
Elevated Water CO2 Can Prevent Dietary-Induced Osteomalacia in Post-Smolt Atlantic Salmon (Salmo salar, L.)

 , ,
, ,
Abstract
1. Introduction
2. Materials and Methods
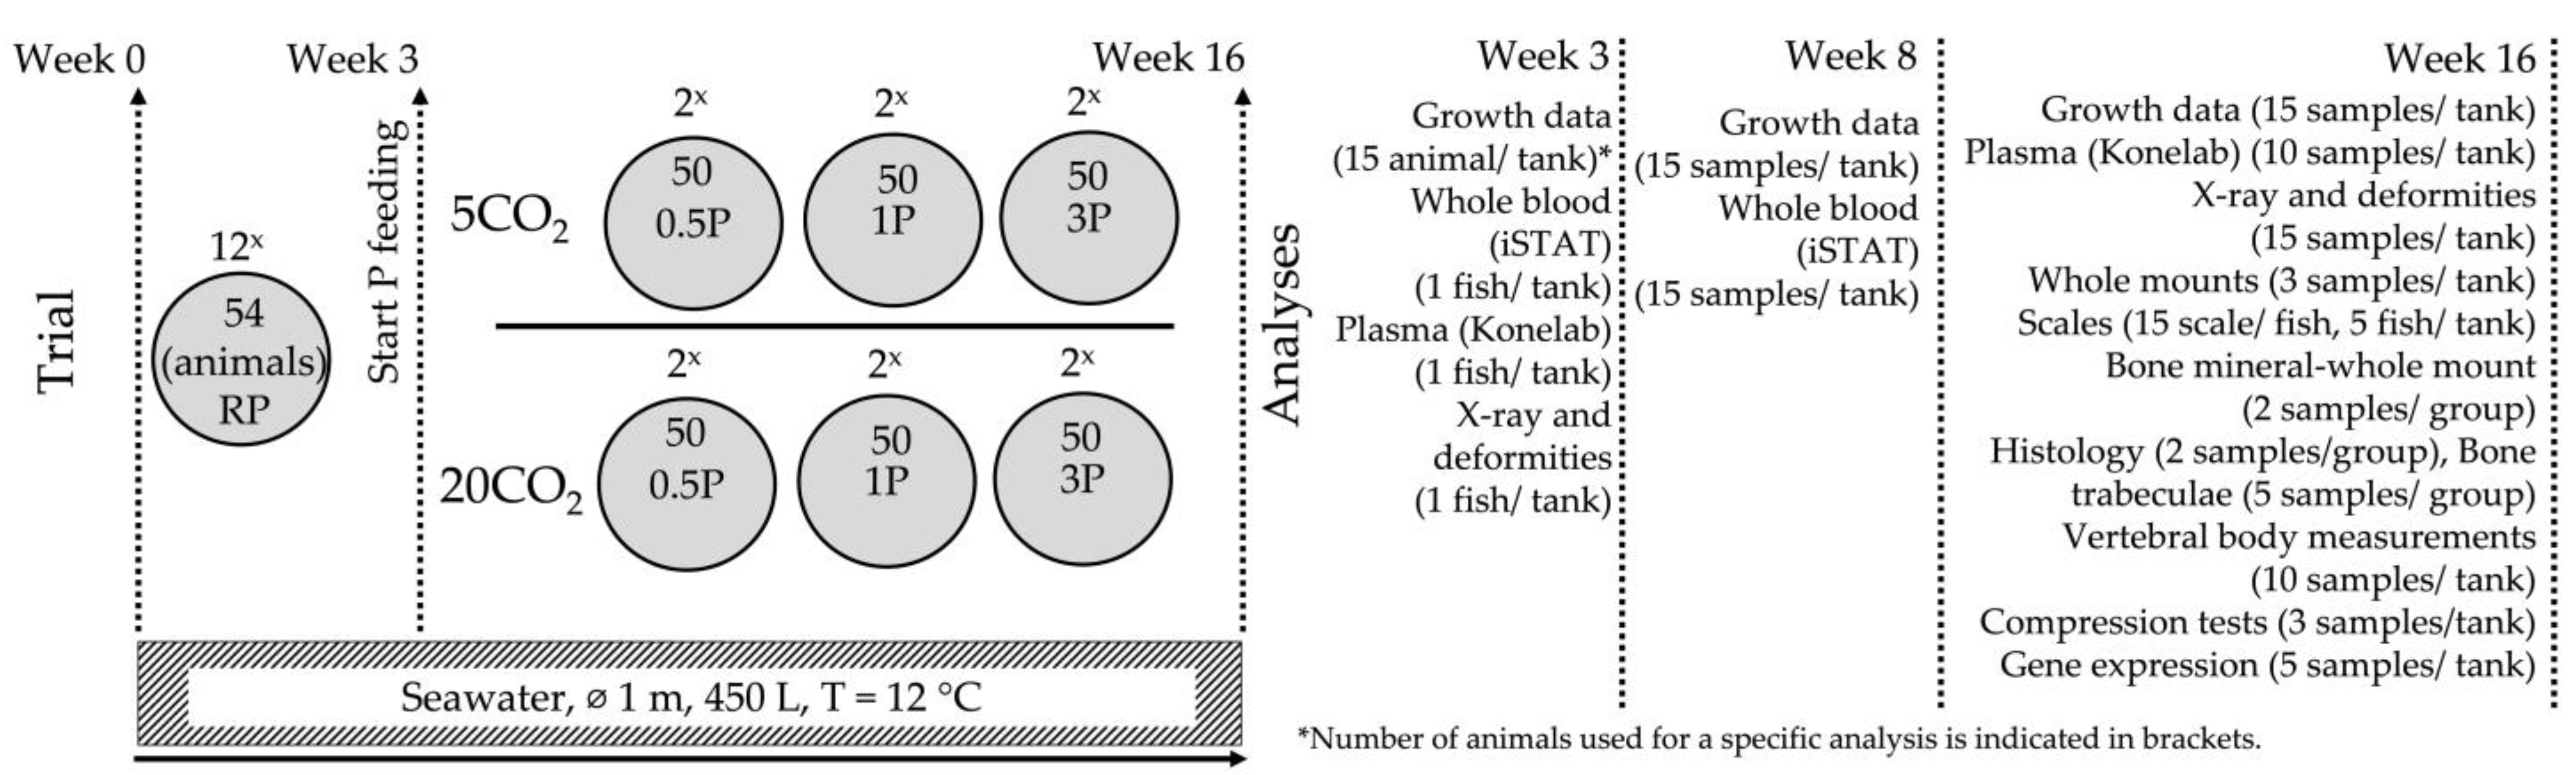
2.1. Animal Stock
2.2. Experimental Period
2.3. Sampling and Growth Measurements
2.4. Blood Analysis
2.4.1. Whole Blood Analysis
2.4.2. Blood Plasma Analysis
2.5. Radiography
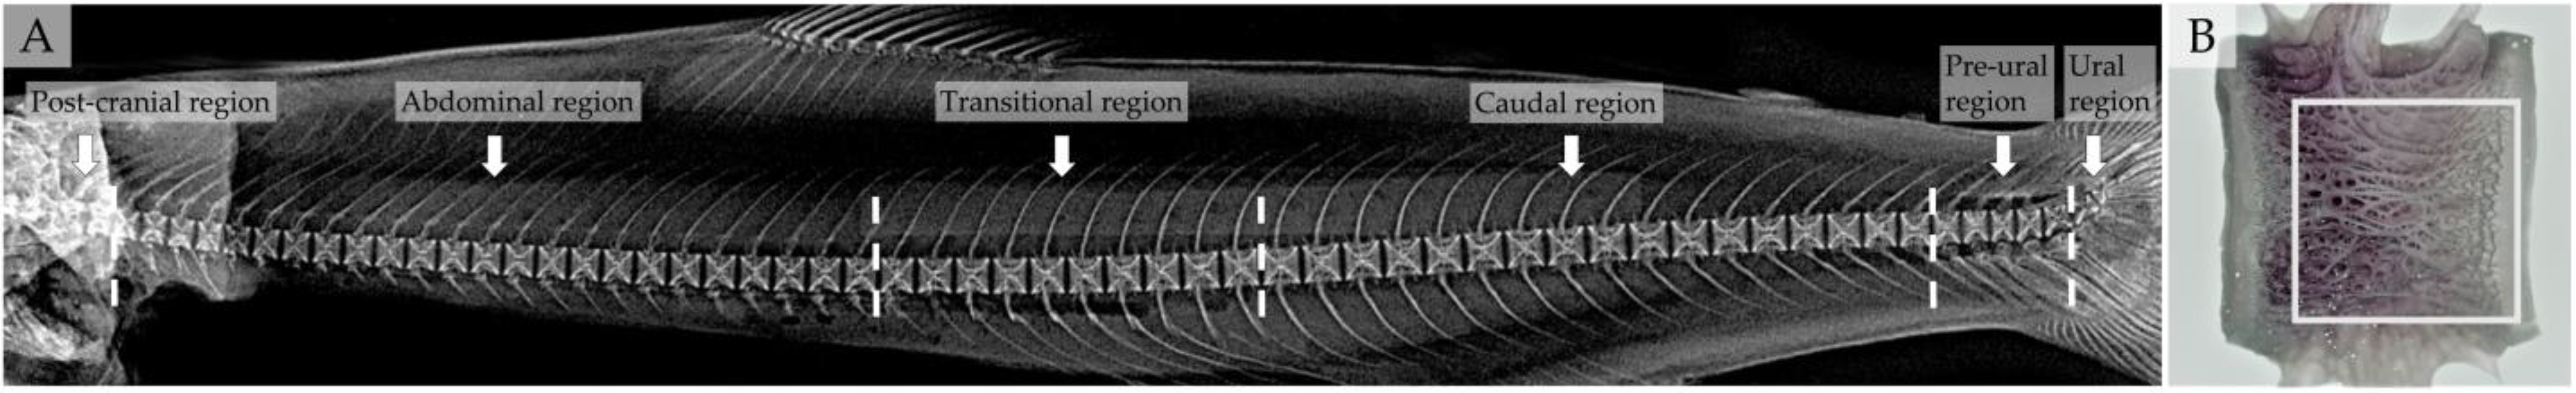
2.6. Vertebral Centra Deformity Diagnosis
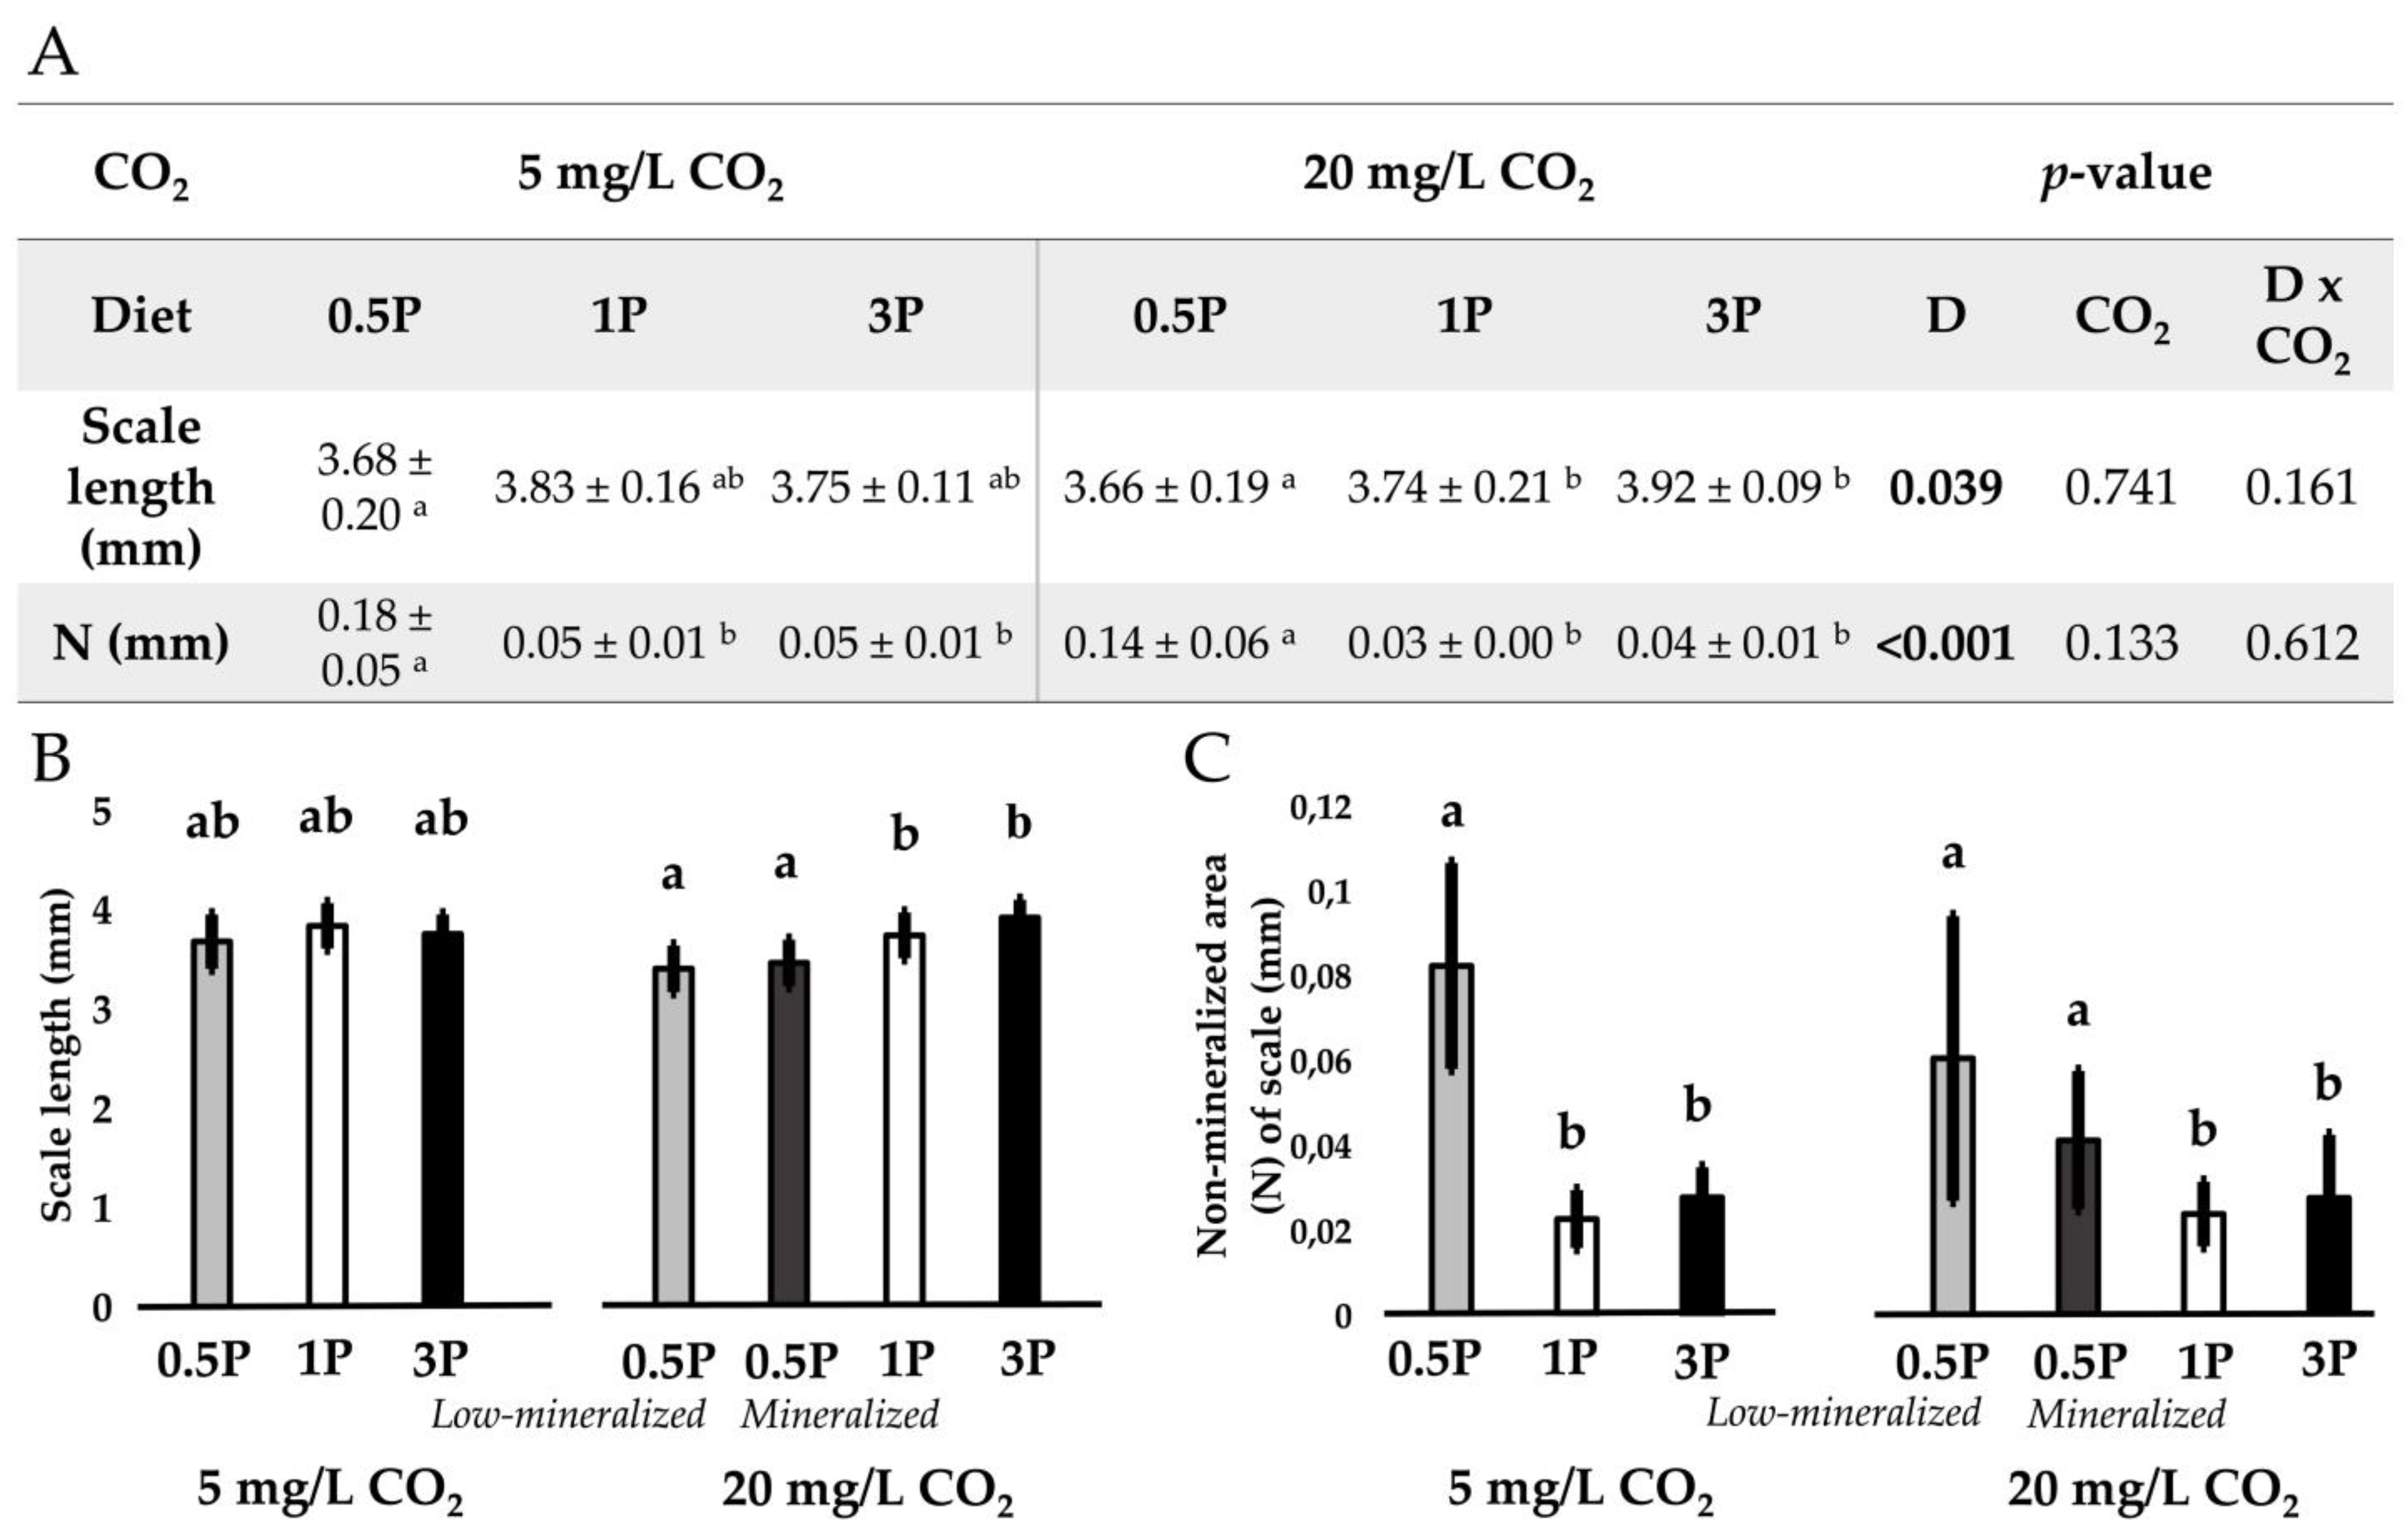
2.7. Vertebral Body and Scale Morphology
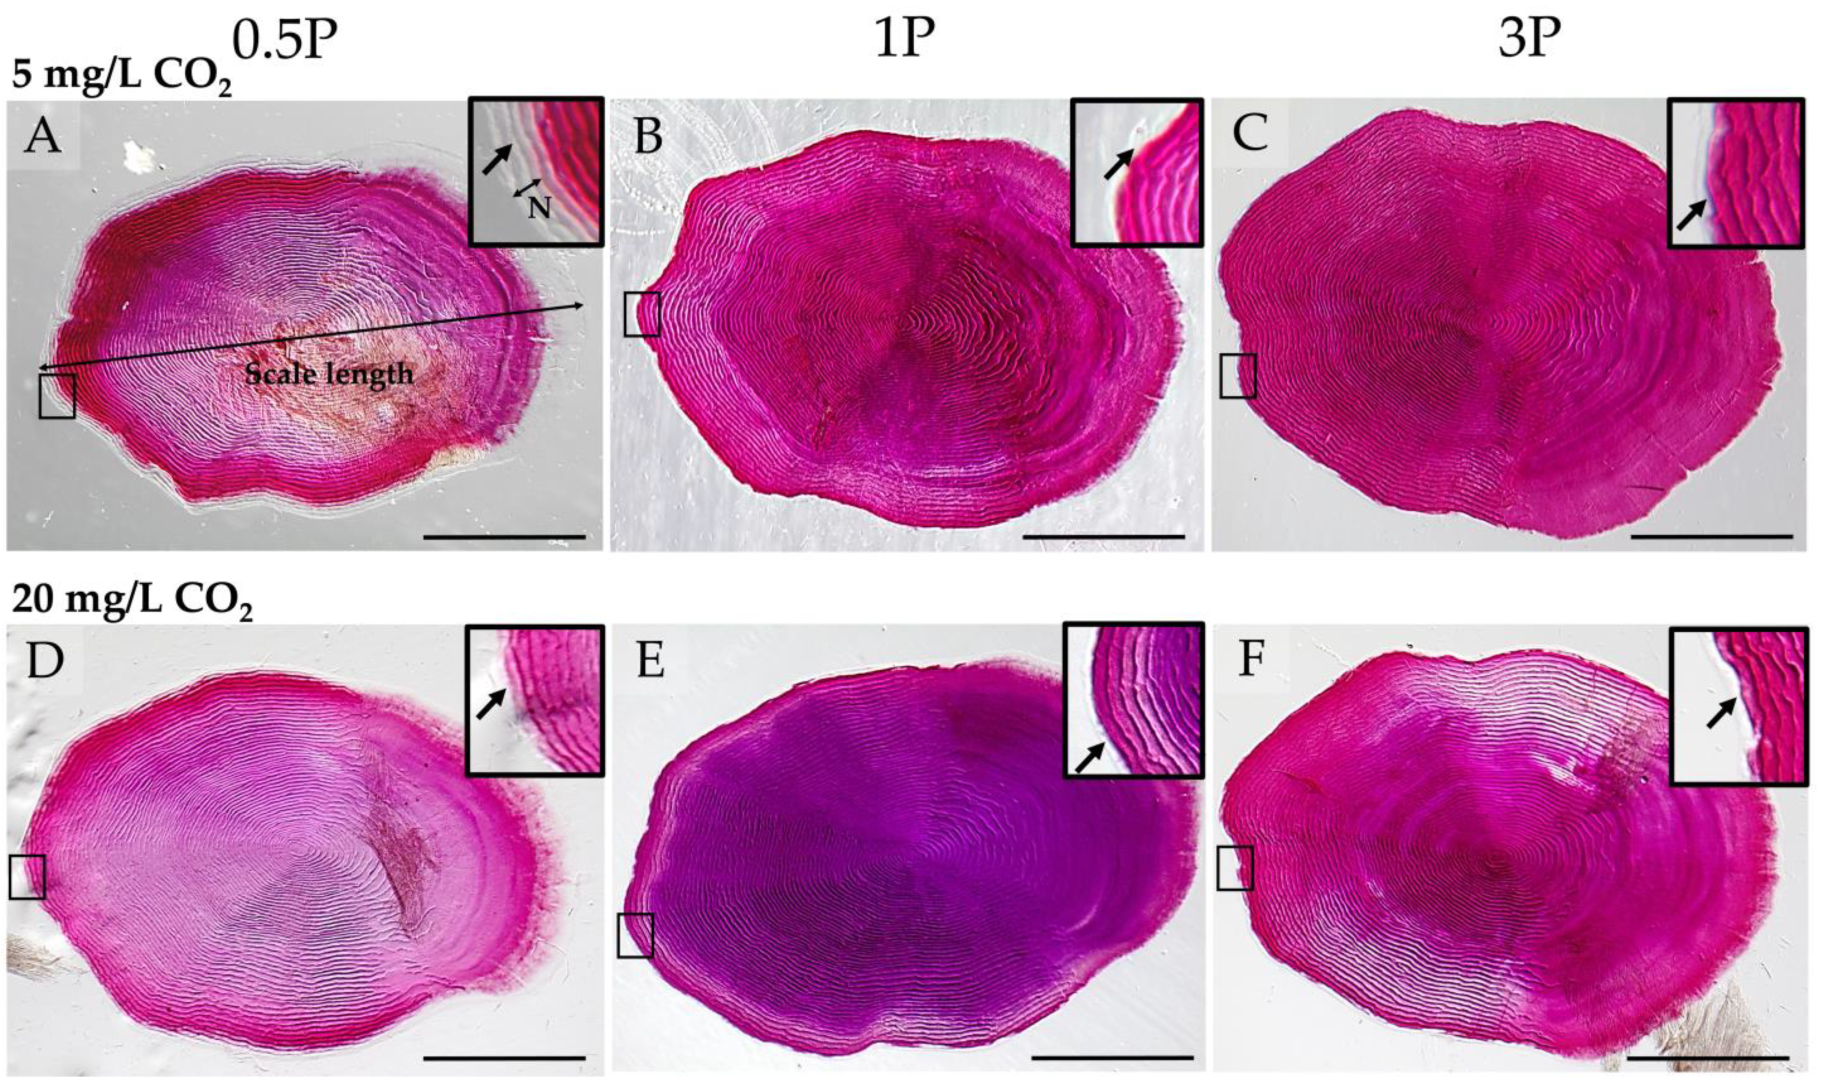
2.7.1. Whole-Mount Alizarin Red S Staining
2.7.2. Histology
2.8. Mineral Analysis of Vertebral Column
2.9. Vertebral Body Measurements
2.10. Vertebral Centrum Compression Tests
2.11. Gene Expression Analysis
2.12. Statistical Analyses
3. Results
3.1. Diets
3.2. Growth Data
3.3. Mineralization
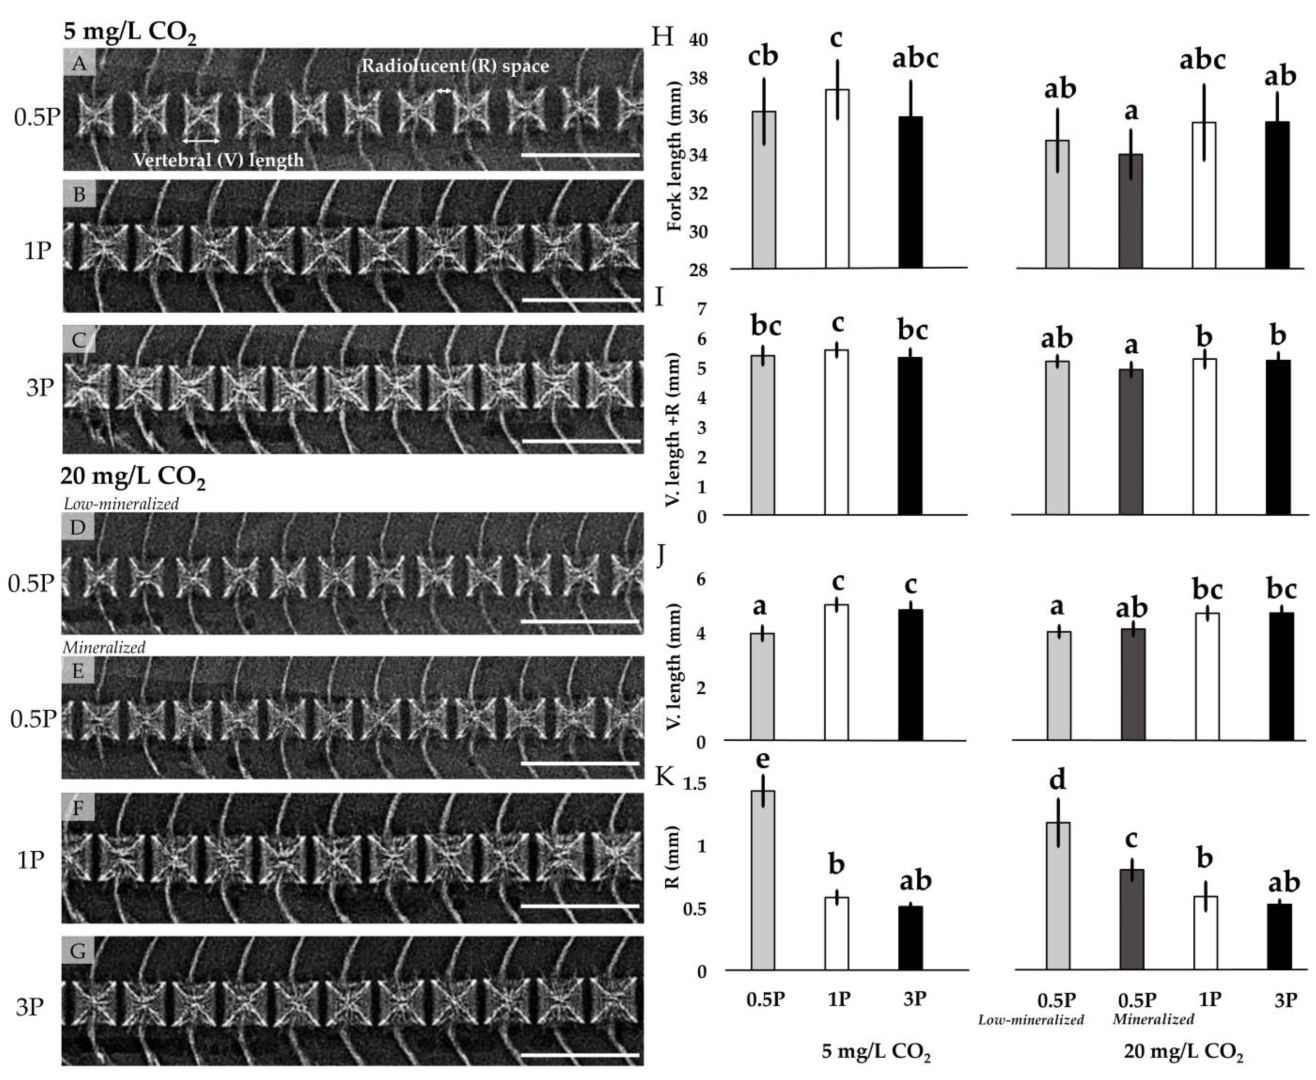
3.3.1. Radiology

| CO2 | 5 mg/L CO2 | 20 mg/L CO2 | p-Value | ||||||
|---|---|---|---|---|---|---|---|---|---|
| Diet/ Measurements | 0.5P | 1P | 3P | 0.5P | 1P | 3P | D | CO2 | D × CO2 |
| Fork length (mm) | 36.18 ± 1.71 bc | 37.32 ± 1.52 c | 35.89 ± 1.87 bc | 34.30 ± 1.48 a | 35.61 ± 1.96 ab | 34.96 ± 1.53 ab | 0.002 | <0.001 | 0.388 |
| V. length + R (mm) | 5.38 ± 0.25 bc | 5.56 ± 0.24 c | 5.31 ± 0.30 bc | 5.04 ± 0.26 a | 5.26 ± 0.34 ab | 5.21 ± 0.26 ab | 0.002 | <0.001 | 0.105 |
| V. length (mm) | 3.95 ± 0.34 a | 4.99 ± 0.24 c | 4.80 ± 0.29 bc | 4.11 ± 0.24 a | 4.68 ± 0.32 b | 4.69 ± 0.26 b | <0.001 | 0.080 | 0.318 |
| R (mm) | 1.43 ± 0.23 c | 0.58 ± 0.05 b | 0.51 ± 0.03 b | 0.93 ± 0.23 ab | 0.59 ± 0.04 b | 0.52 ± 0.03 b | <0.001 | <0.001 | <0.001 |

3.3.2. Mineralization Pattern
3.3.3. Mineral Analysis
3.4. Vertebral Centra Deformities
3.5. Vertebral Body Morphology and Structure
3.6. Blood Analysis
3.7. Mechanical Properties of Vertebral Centra
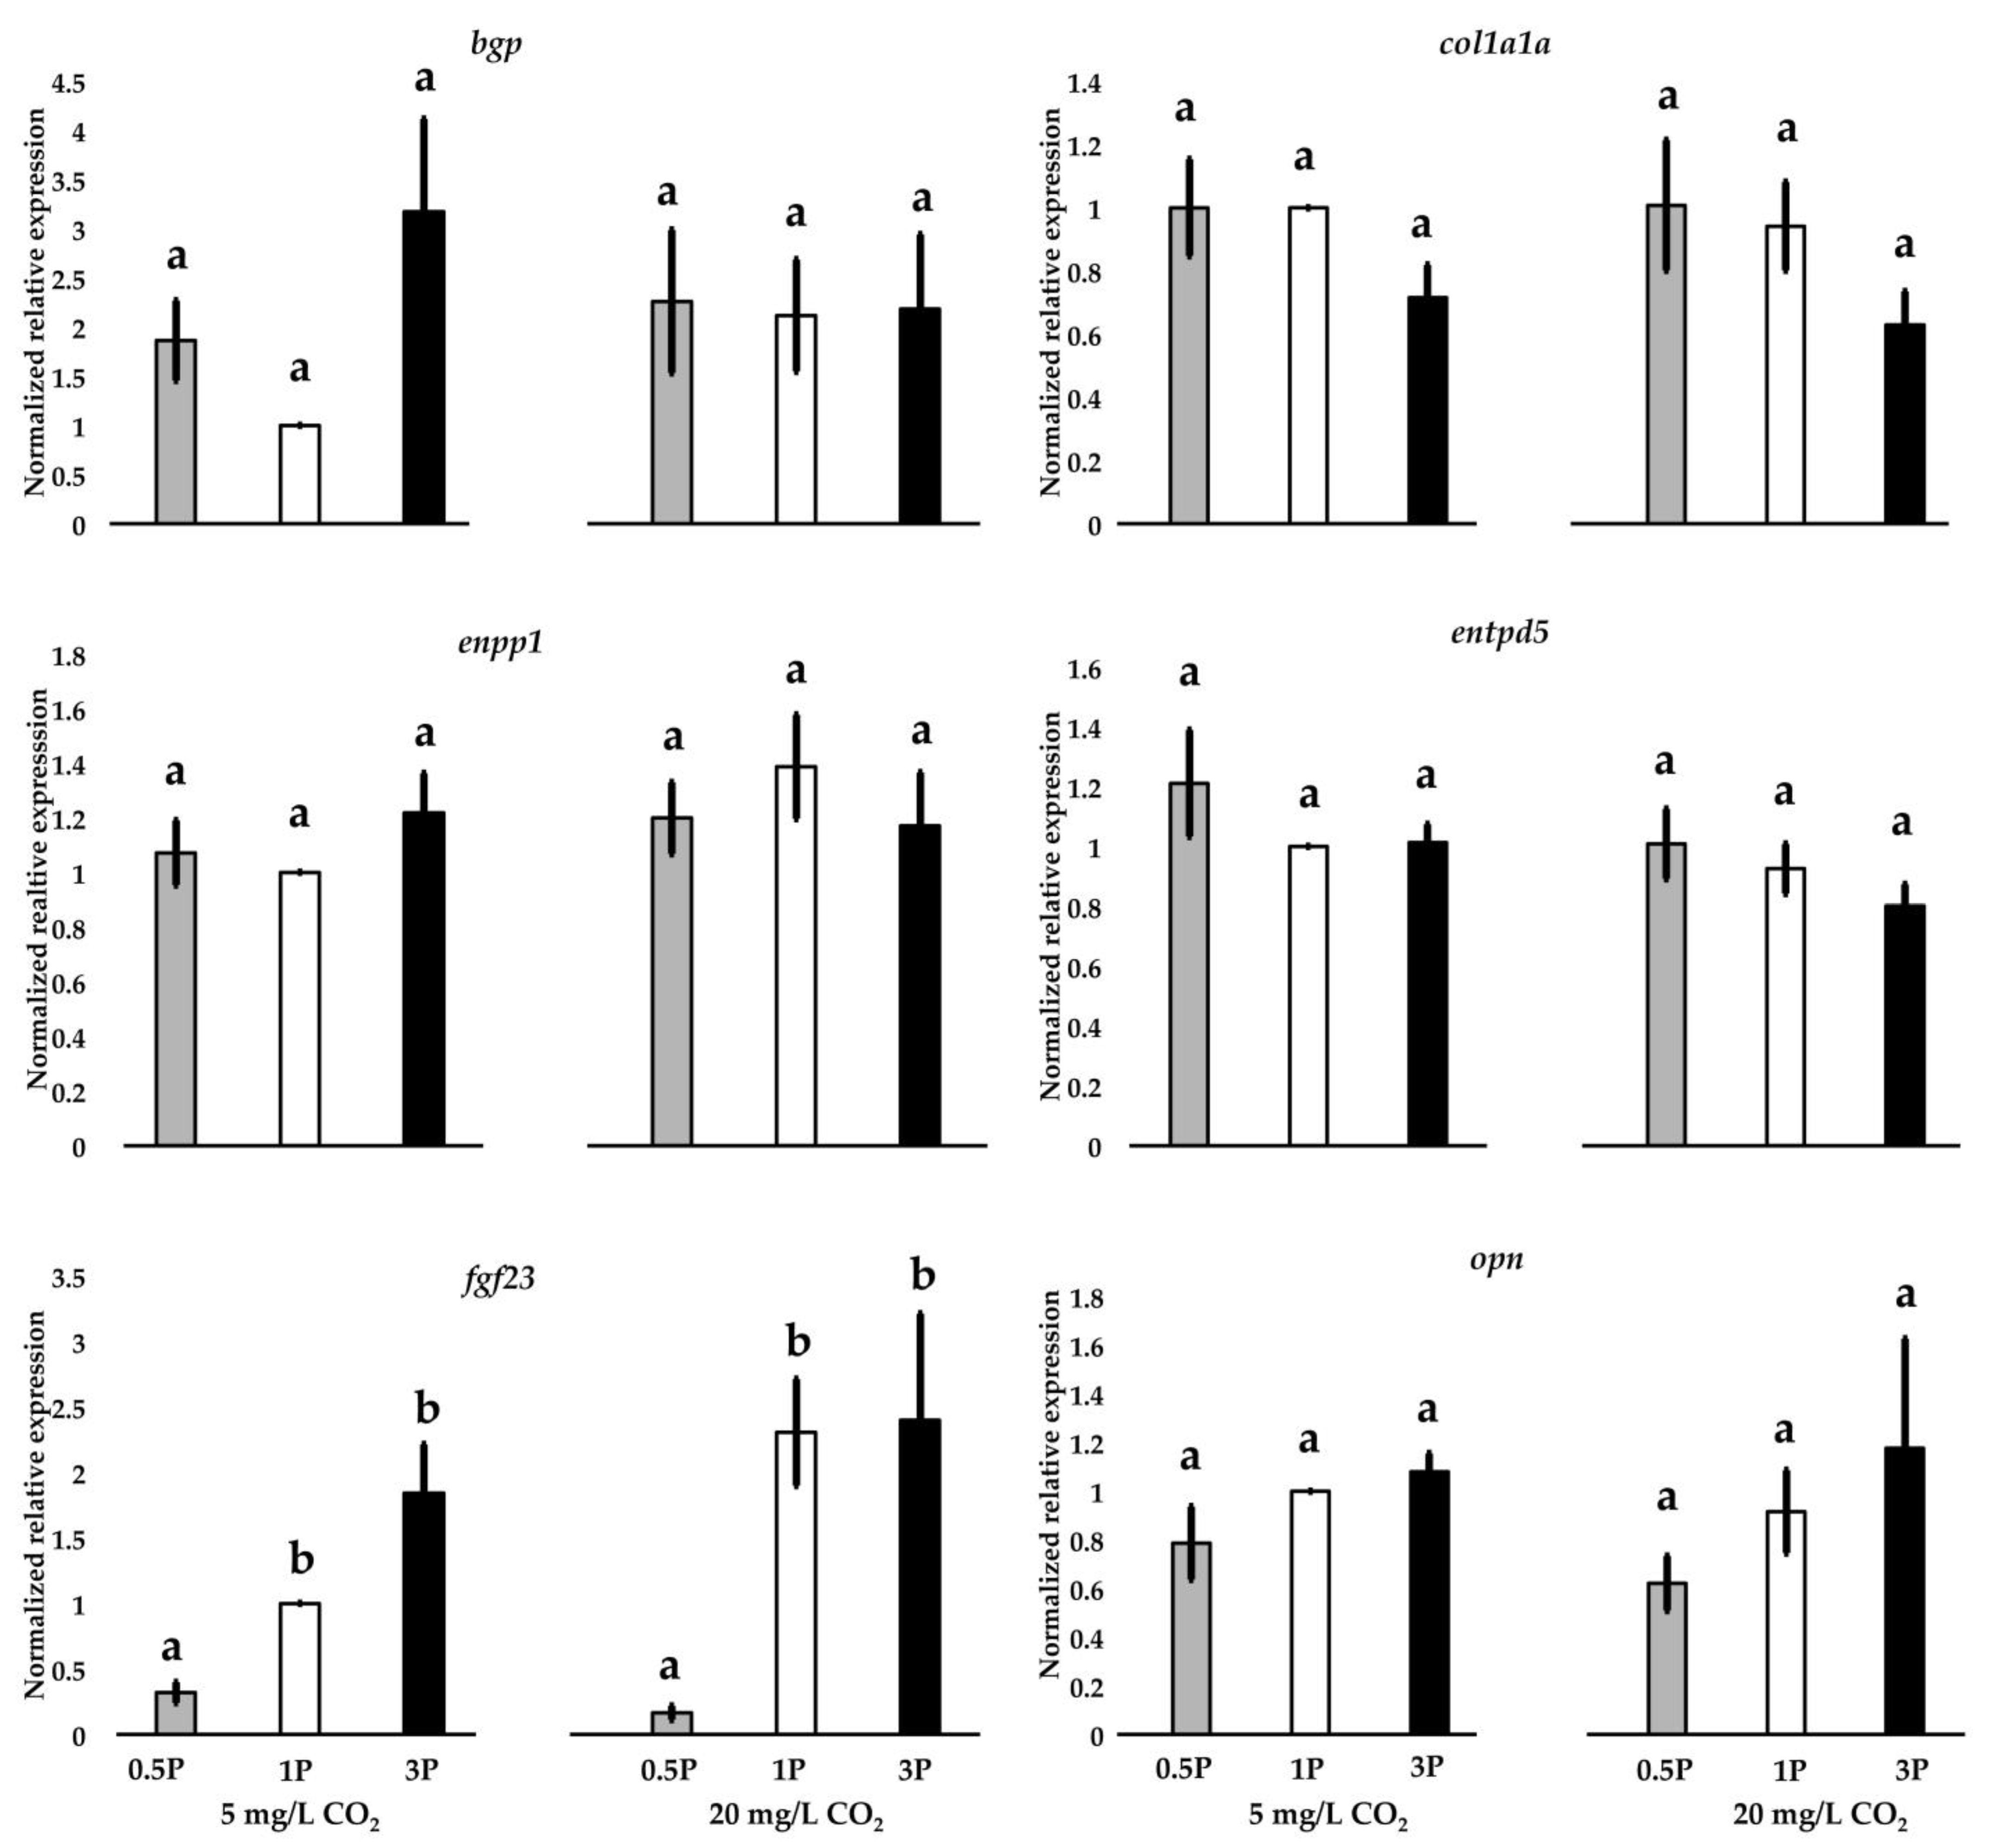
3.8. Gene Expression
4. Discussion
4.1. Elevated CO2 Partly Compensates for Low Dietary P
4.2. Can A Systemic Response to Respiratory Acidosis Help Mineralize A Non-Mineralized Bone?
4.3. Increased Renal Phosphate Reabsorption Driven by the Downregulation of fgf23
4.4. Growth Rate and Mineralization
4.5. The Negative Effect of High P and CO2 on Growth of Animals
4.6. High Dietary P Does Not Improve Bone Health
5. Conclusions
Author Contributions
Funding
Institutional Review Board Statement
Informed Consent Statement
Data Availability Statement
Acknowledgments
Conflicts of Interest
References
- Helland, S.; Refstie, S.; Espmark, Å.; Hjelde, K.; Baeverfjord, G. Mineral balance and bone formation in fast-growing Atlantic salmon parr (Salmo salar) in response to dissolved metabolic carbon dioxide and restricted dietary phosphorus supply. Aquaculture 2005, 250, 364–376. [Google Scholar] [CrossRef]
- Skov, P.V. CO2 in aquaculture. In Carbon Dioxide, 1st ed.; Grosell, M., Munday, P.L., Farrell, A.P., Brauner, C.J., Eds.; Academic Press: Cambridge, MA, USA, 2019; Volume 37, pp. 287–321. [Google Scholar] [CrossRef]
- Bergheim, A.; Fivelstad, S. Atlantic salmon (Salmo salar L.) in aquaculture: Metabolic rate and water flow requirements. In Salmon: Biology, Ecological Impacts and Economical Importance, 1st ed.; Woo, P.T.K., Noakes, D.J., Eds.; Nova Science Publishers, Inc.: Hauppauge, NY, USA, 2014; pp. 155–173. [Google Scholar]
- Gil-Martens, L.; Witten, P.E.; Fivelstad, S.; Huysseune, A.; Sævareid, B.; Vikeså, V.; Obach, A. Impact of high water carbon dioxide levels on Atlantic salmon smolts (Salmo salar L.): Effects on fish performance, vertebrae composition and structure. Aquaculture 2006, 261, 80–88. [Google Scholar] [CrossRef]
- Good, C.; Davidson, J. A review of factors influencing maturation of Atlantic salmon, Salmo salar, with focus on water recirculation aquaculture system environments. J. World Aquac. Soc. 2016, 47, 605–632. [Google Scholar] [CrossRef]
- Good, C.; Davidson, J.; Terjesen, B.F.; Takle, H.; Kolarevic, J.; Bæverfjord, G.; Summerfelt, S. The effects of long-term 20 mg/L carbon dioxide exposure on the health and performance of Atlantic salmon Salmo salar post-smolts in water recirculation aquaculture systems. Aquac. Eng. 2018, 81, 1–9. [Google Scholar] [CrossRef]
- Crouse, C.; Davidson, J.; May, T.; Summerfelt, S.; Good, C. Production of market-size European strain Atlantic salmon (Salmo salar) in land-based freshwater closed containment aquaculture systems. Aquac. Eng. 2021, 92, 102138. [Google Scholar] [CrossRef]
- Fivelstad, S.; Haavik, H.; Løvik, G.; Olsen, A.B. Sublethal effects and safe levels of carbon dioxide in seawater for Atlantic salmon postsmolts (Salmo salar L.): Ion regulation and growth. Aquaculture 1998, 160, 305–316. [Google Scholar] [CrossRef]
- Fivelstad, S.; Olsen, A.B.; Åsgård, T.; Baeverfjord, G.; Rasmussen, T.; Vindheim, T.; Stefansson, S. Long-term sublethal effects of carbon dioxide on Atlantic salmon smolts (Salmo salar L.): Ion regulation, haematology, element composition, nephrocalcinosis and growth parameters. Aquaculture 2003, 215, 301–319. [Google Scholar] [CrossRef]
- Mota, V.C.; Nilsen, T.O.; Gerwins, J.; Gallo, M.; Kolarevic, J.; Krasnov, A.; Terjesen, B.F. Molecular and physiological responses to long-term carbon dioxide exposure in Atlantic salmon (Salmo salar). Aquaculture 2020, 519, 734715. [Google Scholar] [CrossRef]
- Wilson, R.W.; Millero, F.J.; Taylor, J.R.; Walsh, P.J.; Christensen, V.; Jennings, S.; Grosell, M. Contribution of fish to the marine inorganic carbon cycle. Science 2009, 323, 359–362. [Google Scholar] [CrossRef]
- McNeil, B.I.; Matsumoto, K. The changing ocean and freshwater CO2 system. In Carbon Dioxide, 1st ed.; Grosell, M., Munday, P.L., Farrell, A.P., Brauner, C.J., Eds.; Academic Press: Cambridge, MA, USA, 2019; Volume 37, pp. 1–32. [Google Scholar] [CrossRef]
- Goss, S.L.; Lemons, K.A.; Kerstetter, J.E.; Bogner, R.H. Determination of calcium salt solubility with changes in pH and PCO2, simulating varying gastrointestinal environments. J. Pharm. Pharmacol. 2007, 59, 1485–1492. [Google Scholar] [CrossRef]
- Hofmann, L.; Bischof, K. Ocean acidification effects on calcifying macroalgae. Aquat. Biol. 2014, 22, 261–279. [Google Scholar] [CrossRef]
- Perry, S.F. The regulation of hypercapnic acidosis in two Salmonids, the freshwater trout (Salmo gairdneri) and the seawater salmon (Onchorynchus kisutch). Mar. Behav. Physiol. 1982, 9, 73–79. [Google Scholar] [CrossRef]
- Toews, D.P.; Holeton, G.F.; Heisler, N. Regulation of the acid-base status during environmental hypercapnia in the marine teleost fish Conger conger. J. Exp. Biol. 1983, 107, 9–20. [Google Scholar] [CrossRef]
- Munday, P.L.; Rummer, J.L.; Baumann, H. Adaptation and evolutionary responses to high CO2. In Carbon Dioxide, 1st ed.; Grosell, M., Munday, P.L., Farrell, A.P., Brauner, C.J., Eds.; Academic Press: Cambridge, MA, USA, 2019; Volume 37, pp. 369–395. [Google Scholar] [CrossRef]
- Mortimer, C.H. The oxygen content of air-saturated fresh waters, and aids in calculating percentage saturation. Int. Ver. Theor. Angewadte Limnol. Mitt. 1956, 6, 1–20. [Google Scholar] [CrossRef]
- Domenici, P.; Steffensen, J.F.; Marras, S. The effect of hypoxia on fish schooling. Phil. Trans. R. Soc. B 2017, 372, 20160236. [Google Scholar] [CrossRef]
- Rummer, J.L.; McKenzie, D.J.; Innocenti, A.; Supuran, C.T.; Brauner, C.J. Root effect hemoglobin may have evolved to enhance general tissue oxygen delivery. Science 2013, 340, 1327–1329. [Google Scholar] [CrossRef]
- Eddy, F.; Lomholt, J.; Weber, R.; Johansen, K. Blood respiratory properties of rainbow trout (Salmo gairdneri) kept in water of high CO2 tension. J. Exp. Biol. 1977, 67, 37–47. [Google Scholar] [CrossRef]
- Fivelstad, S.; Hosfeld, C.D.; Medhus, R.A.; Olsen, A.B.; Kvamme, K. Growth and nephrocalcinosis for Atlantic salmon (Salmo salar L.) post-smolt exposed to elevated carbon dioxide partial pressures. Aquaculture 2018, 482, 83–89. [Google Scholar] [CrossRef]
- Fivelstad, S.; Kvamme, K.; Handeland, S.; Fivelstad, M.; Olsen, A.B.; Hosfeld, C.D. Growth and physiological models for Atlantic salmon (Salmo salar L.) parr exposed to elevated carbon dioxide concentrations at high temperature. Aquaculture 2015, 436, 90–94. [Google Scholar] [CrossRef]
- Fivelstad, S.; Olsen, A.B.; Kloften, H.; Ski, H.; Stefansson, S. Effects of carbon dioxide on Atlantic salmon (Salmo salar L.) smolts at constant pH in bicarbonate rich freshwater. Aquaculture 1999, 178, 171–187. [Google Scholar] [CrossRef]
- Fivelstad, S.; Waagbø, R.; Stefansson, S.; Olsen, A.B. Impacts of elevated water carbon dioxide partial pressure at two temperatures on Atlantic salmon (Salmo salar L.) parr growth and haematology. Aquaculture 2007, 269, 241–249. [Google Scholar] [CrossRef]
- Mota, V.C.; Nilsen, T.O.; Gerwins, J.; Gallo, M.; Ytteborg, E.; Baeverfjord, G.; Kolarevic, J.; Summerfelt, S.T.; Terjesen, B.F. The effects of carbon dioxide on growth performance, welfare, and health of Atlantic salmon post-smolt (Salmo salar) in recirculating aquaculture systems. Aquaculture 2019, 498, 578–586. [Google Scholar] [CrossRef]
- Larsen, B.K.; Jensen, F.B. Influence of ionic composition on acid-base regulation in rainbow trout (Oncorhynchus mykiss) exposed to environmental hypercapnia. Fish Physiol. Biochem. 1997, 16, 157–170. [Google Scholar] [CrossRef]
- Sullivan, M.; Guy, D.R.; Roberts, R.J.; Manchester, N.J. The aetiology of spinal deformity in Atlantic salmon, Salmo salar L.: Influence of genetic factors on the frequency and severity in freshwater stages. J. Fish Dis. 2007, 30, 753–758. [Google Scholar] [CrossRef] [PubMed]
- Lin, C.-H.; Hwang, P.-P. The control of calcium metabolism in zebrafish (Danio rerio). Int. J. Mol. Sci. 2016, 11, 1783. [Google Scholar] [CrossRef]
- Al-Kholy, A.; Ishak, M.M.; Youssef, Y.A.; Khalil, S.R. Phosphorus uptake from water by Tilapia zillii (Gervais). Hydrobiologia 1970, 36, 471–478. [Google Scholar] [CrossRef]
- Llorens, C.P. Differential Phosphorus Uptake by Juvenile European Catfish (Silurus glanis) from Feed and Water in Recirculating Aquaculture System. Master’s Thesis, Ghent University, Ghent, Belgium, 2022. [Google Scholar]
- van Bussel, C.G.J.; Mahlmann, L.; Kroeckel, S.; Schroeder, J.P.; Schulz, C. The effect of high ortho-phosphate water levels on growth, feed intake, nutrient utilization and health status of juvenile turbot (Psetta maxima) reared in intensive recirculating aquaculture systems (RAS). Aquac. Eng. 2013, 57, 63–70. [Google Scholar] [CrossRef]
- Lall, S.; Kaushik, S. Nutrition and metabolism of minerals in fish. Animals 2021, 11, 2711. [Google Scholar] [CrossRef]
- Baeverfjord, G.; Åsgård, T.; Shearer, K.D. Development and detection of phosphorus deficiency in Atlantic salmon, Salmo salar L.; parr and post-smolts. Aquac. Nutr. 1998, 4, 1–11. [Google Scholar] [CrossRef]
- Fjelldal, P.G.; Hansen, T.; Breck, O.; Sandvik, R.; WaagbØ, R.; Berg, A.; Ørnsrud, R. Supplementation of dietary minerals during the early seawater phase increase vertebral strength and reduce the prevalence of vertebral deformities in fast-growing under-yearling Atlantic salmon (Salmo salar L.) smolt. Aquac. Nutr. 2009, 15, 366–378. [Google Scholar] [CrossRef]
- Fjelldal, P.G.; Hansen, T.J.; Lock, E.J.; Wargelius, A.; Fraser, T.W.K.; Sambraus, F.; El-Mowafi, A.; Albrektsen, S.; Waagbø, R.; Ørnsrud, R. Increased dietary phosphorous prevents vertebral deformities in triploid Atlantic salmon (Salmo salar L.). Aquac. Nutr. 2016, 22, 72–90. [Google Scholar] [CrossRef]
- Storebakken, T.; Shearer, K.; Roem, A. Growth, uptake and retention of nitrogen and phosphorus, and absorption of other minerals in Atlantic salmon Salmo salar fed diets with fish meal and soy-protein concentrate as the main sources of protein. Aquac. Nutr. 2000, 6, 103–108. [Google Scholar] [CrossRef]
- Drábiková, L.; Fjelldal, P.G.; De Clercq, A.; Yousaf, M.N.; Morken, T.; McGurk, C.; Witten, P.E. What will happen to my smolt at harvest? Individually tagged Atlantic salmon help to understand possible progression and regression of vertebral deformities. Aquaculture 2022, 559, 738430. [Google Scholar] [CrossRef]
- Drábiková, L.; Fjelldal, P.G.; De Clercq, A.; Yousaf, M.N.; Morken, T.; McGurk, C.; Witten, P.E. Vertebral column adaptations in juvenile Atlantic salmon Salmo salar, L. as a response to dietary phosphorus. Aquaculture 2021, 541, 736776. [Google Scholar] [CrossRef]
- Witten, P.E.; Fjelldal, P.G.; Huysseune, A.; McGurk, C.; Obach, A.; Owen, M.A.G. Bone without minerals and its secondary mineralization in Atlantic salmon (Salmo salar): The recovery from phosphorus deficiency. J. Exp. Biol. 2019, 222, jeb.188763. [Google Scholar] [CrossRef]
- Witten, P.E.; Owen, M.A.G.; Fontanillas, R.; Soenens, M.; Mcgurk, C.; Obach, A. A primary phosphorus-deficient skeletal phenotype in juvenile Atlantic salmon Salmo salar: The uncoupling of bone formation and mineralization. J. Fish Biol. 2016, 88, 690–708. [Google Scholar] [CrossRef]
- Cotti, S.; Huysseune, A.; Koppe, W.; Rücklin, M.; Marone, F.; Wölfel, E.; Fiedler, I.; Busse, B.; Forlino, A.; Witten, P. More bone with less minerals? The effects of dietary phosphorus on the post-cranial skeleton in zebrafish. Int. J. Mol. Sci. 2020, 21, 5429. [Google Scholar] [CrossRef]
- Fjelldal, P.G.; Nordgarden, U.; Hansen, T. The mineral content affects vertebral morphology in underyearling smolt of Atlantic salmon (Salmo salar L.). Aquaculture 2007, 270, 231–239. [Google Scholar] [CrossRef]
- Canzanello, V.J.; Kraut, J.A.; Holick, M.F.; Johns, C.; Liu, C.C.; Madias, N.E. Effect of chronic respiratory acidosis on calcium metabolism in the rat. J. Lab. Clin. Med. 1995, 126, 81–87. [Google Scholar]
- Elsadin, S.; Nixon, O.; Mozes, N.; Allon, G.; Gaon, A.; Tandler, A.; Koven, W. The effect of dissolved carbon dioxide (CO2) on the bone mineral content and on the expression of bone-Gla protein (BGP, Osteocalcin) in the vertebral column of white grouper (Epinephelus aeneus). Aquaculture 2019, 511, 634196. [Google Scholar] [CrossRef]
- Smart, G.R.; Knox, D.; Harrison, J.G.; Ralph, J.A.; Richards, R.H.; Cowey, C.B. Nephrocalcinosis in rainbow trout Salmo gairdneri Richardson; the effect of exposure to elevated CO2 concentrations. J. Fish Dis. 1979, 2, 279–289. [Google Scholar] [CrossRef]
- Björnsson, B.T.; Hemre, G.-I.; Bjørnevik, M.; Hansen, T. Photoperiod regulation of plasma growth hormone levels during induced smoltification of underyearling Atlantic salmon. Gen. Comp. Endocrinol. 2000, 119, 17–25. [Google Scholar] [CrossRef] [PubMed]
- Fjelldal, P.G.; Lock, E.-J.; Grotmol, S.; Totland, G.K.; Nordgarden, U.; Flik, G.; Hansen, T. Impact of smolt production strategy on vertebral growth and mineralisation during smoltification and the early seawater phase in Atlantic salmon (Salmo salar, L.). Aquaculture 2006, 261, 715–728. [Google Scholar] [CrossRef]
- Hossain, M.S.; Chance, A.B.; El Kertaoui, N.; Wattiez, X.; Houndji, A.; Mandiki, S.N.M.; Kestemont, P. Dietary inorganic monophosphates in high plant ingredient-based diets influence nutrient digestibility, postprandial macro-mineral status and immune functions of juvenile rainbow trout, Oncorhynchus mykiss. Aquacult. Nutr. 2020, 26, 2178–2194. [Google Scholar] [CrossRef]
- Morales, G.A.; Azcuy, R.L.; Casaretto, M.E.; Márquez, L.; Hernández, A.J.; Gómez, F.; Koppe, W.; Mereu, A. Effect of different inorganic phosphorus sources on growth performance, digestibility, retention efficiency and discharge of nutrients in rainbow trout (Oncorhynchus mykiss). Aquaculture 2018, 495, 568–574. [Google Scholar] [CrossRef]
- Milián-Sorribes, M.C.; Tomás-Vidal, A.; Peñaranda, D.; Carpintero, L.; Sebastian, J.; Dupuy Arnau, J.; Donadeu, A.; Macías-Vidal, J.; Martínez-Llorens, S. Estimation of phosphorus and nitrogen waste in rainbow trout (Oncorhynchus mykiss, Walbaum, 1792) Diets including different inorganic phosphorus sources. Animals 2021, 11, 1700. [Google Scholar] [CrossRef]
- Albrektsen, S.; Lock, E.J.; Bæverfjord, G.; Pedersen, M.; Krasnov, A.; Takle, H.; Veiseth-Kent, E.; Ørnsrud, R.; Waagbø, R.; Ytteborg, E. Utilization of H2SO4-hydrolysed phosphorus from herring bone by-products in feed for Atlantic salmon (Salmo salar) 0+postsmolt. Aquac. Nutr. 2018, 24, 348–365. [Google Scholar] [CrossRef]
- Fjelldal, P.G.; Hansen, T.; Albrektsen, S. Inadequate phosphorus nutrition in juvenile Atlantic salmon has a negative effect on long-term bone health. Aquaculture 2012, 334–337, 117–123. [Google Scholar] [CrossRef]
- Smedley, M.A.; Migaud, H.; McStay, E.L.; Clarkson, M.; Bozzolla, P.; Campbell, P.; Taylor, J.F. Impact of dietary phosphorous in diploid and triploid Atlantic salmon (Salmo salar L.) with reference to early skeletal development in freshwater. Aquaculture 2018, 490, 329–343. [Google Scholar] [CrossRef]
- Krogdahl, Å.; Hemre, G.I.; Mommsen, T.O. Carbohydrates in fish nutrition: Digestion and absorption in postlarval stages. Aquacult. Nutr. 2005, 11, 103–122. [Google Scholar] [CrossRef]
- Bergot, F. Digestibility of a purified cellulose by the rainbow trout (Salmo gairdnerii) and the common carp (Cyprinus carpio). Reprod. Nutr. Develop. 1981, 21, 83–93. [Google Scholar] [CrossRef]
- Kraugerud, O.F.; Penn, M.; Storebakken, T.; Refstie, S.; Krogdahl, Å.; Svihus, B. Nutrient digestibilities and gut function in Atlantic salmon (Salmo salar) fed diets with cellulose or non-starch polysaccharides from soy. Aquaculture 2007, 273, 96–107. [Google Scholar] [CrossRef]
- Hansen, J.Ø.; Storebakken, T. Effects of dietary cellulose level on pellet quality and nutrient digestibilities in rainbow trout (Oncorhynchus mykiss). Aquaculture 2007, 272, 458–465. [Google Scholar] [CrossRef]
- Bromley, P.J.; Adkins, T.C. The influence of cellulose filler on feeding, growth and utilization of protein and energy in rainbow trout, Salmo gairdnerii Richardson. J. Fish Biol. 1984, 24, 235–244. [Google Scholar] [CrossRef]
- Busacker, G.P.; Adelman, I.R.; Goolish, E.M. Growth. In Methods for Fish Biology, 1st ed.; Schreck, C.B., Moyle, P.B., Eds.; American Fisheries Society: Bethesda, MD, USA, 1990; pp. 363–387. [Google Scholar]
- National Research Council. Nutrient Requirements of Fish and Shrimp; The National Academic Press: Washinghton, DC, USA, 2011.
- Ponder, B.A.; Wilkinson, M.M. Inhibition of endogenous tissue alkaline phosphatase with the use of alkaline phosphatase conjugates in immunohistochemistry. J. Histochem. Cytochem. 1981, 29, 981–984. [Google Scholar] [CrossRef]
- Witten, P.E. Enzyme histochemical characteristics of osteoblasts and mononucleated osteoclasts in a teleost fish with acellular bone (Oreochromis niloticus, Cichlidae). Cell Tissue Res. 1997, 287, 591–599. [Google Scholar] [CrossRef]
- De Clercq, A.; Perrott, M.R.; Davie, P.S.; Preece, M.A.; Wybourne, B.; Ruff, N.; Huysseune, A.; Witten, P.E. Vertebral column regionalisation in Chinook salmon, Oncorhynchus tshawytscha. J. Anat. 2017, 231, 500–514. [Google Scholar] [CrossRef]
- Witten, P.E.; Gil-Martens, L.; Huysseune, A.; Takle, H.; Hjelde, K. Towards a classification and an understanding of developmental relationships of vertebral body malformations in Atlantic salmon (Salmo salar L.). Aquaculture 2009, 295, 6–14. [Google Scholar] [CrossRef]
- Arratia, G.; Schultze, H.-P. Reevaluation of the caudal skeleton of certain actinopterygian fishes: III. Salmonidae. Homologization of caudal skeletal structures. J. Morphol. 1992, 214, 187–249. [Google Scholar] [CrossRef]
- Arratia, G.; Schultze, H.P.; Casciotta, J. Vertebral column and associated elements in dipnoans and comparison with other fishes: Development and homology. J. Morphol. 2001, 250, 101–172. [Google Scholar] [CrossRef]
- Britz, R.; Johnson, G.D. Occipito-vertebral fusion in ocean sunfishes (Teleostei: Tetraodontiformes: Molidae) and its phylogenetic implications. J. Morphol. 2005, 266, 74–79. [Google Scholar] [CrossRef] [PubMed]
- De Clercq, A.; Perrott, M.R.; Davie, P.S.; Preece, M.A.; Owen, M.A.G.; Huysseune, A.; Witten, P.E. Temperature sensitive regions of the Chinook salmon vertebral column: Vestiges and meristic variation. J. Morphol. 2018, 279, 1301–1311. [Google Scholar] [CrossRef] [PubMed]
- Johanson, Z.; Sutija, M.; Joss, J. Regionalization of axial skeleton in the lungfish Neoceratodus forsteri (Dipnoi). J. Exp. Zool. Part B Mol. Dev. Evol. 2005, 304, 229–237. [Google Scholar] [CrossRef] [PubMed]
- Niemelä, E.; Lajunen, M.; Kuusela, J.; Haantie, J.; Aro, P.; Kalske, T. Scale reading atlas for Atlantic salmon in the Barents Sea area. In Trilateral Cooperation on Our Common Resource, Proceedings of the the Atlantic Salmon the Barents Region—Kolarctic Salmon (KO197), Vadsø, Norway, 15 March 2011; 2013; pp. 1–171. [Google Scholar]
- Presnell, J.K.; Schreibman, M.P. Humason’s Animal Tissue Techniques, 5th ed.; The John Hopkins University Press: Baltimore, MD, USA, 1998. [Google Scholar]
- Fjelldal, P.G.; Nordgarden, U.; Berg, A.; Grotmol, S.; Totland, G.K.; Wargelius, A.; Hansen, T. Vertebrae of the trunk and tail display different growth rates in response to photoperiod in Atlantic salmon Salmo salar L., post-smolts. Aquaculture 2005, 250, 516–524. [Google Scholar] [CrossRef]
- Hamilton, S.J.; Mehrle, P.M.; Mayer, F.L.; Jones, J.R. Method to evaluate mechanical properties of bone in fish. Trans. Am. Fish. Soc. 1981, 110, 708–717. [Google Scholar] [CrossRef]
- Turner, C.H. Bone strength: Current concepts. Ann. N. Y. Acad. Sci. 2006, 1068, 429–446. [Google Scholar] [CrossRef]
- Fjelldal, P.G.; Grotmol, S.; Kryvi, H.; Gjerdet, N.R.; Taranger, G.L.; Hansen, T.; Porter, M.J.R.; Totland, G.K. Pinealectomy induces malformation of the spine and reduces the mechanical strength of the vertebrae in Atlantic salmon, Salmo salar. J. Pineal Res. 2004, 36, 132–139. [Google Scholar] [CrossRef]
- Vera, L.M.; Lock, E.-J.; Hamre, K.; Migaud, H.; Leeming, D.; Tocher, D.R.; Taylor, J.F. Enhanced micronutrient supplementation in low marine diets reduced vertebral malformation in diploid and triploid Atlantic salmon (Salmo salar) parr, and increased vertebral expression of bone biomarker genes in diploids. Comp. Biochem. Physiol. Part B Biochem. Mol. Biol. 2019, 237, 110327. [Google Scholar] [CrossRef]
- Pfaffl, M.W. A new mathematical model for relative quantification in real-time RT-PCR. Nucleic Acids Res. 2001, 29, e45. [Google Scholar] [CrossRef]
- Anderson, K.C.; Elizur, A. Hepatic reference gene selection in adult and juvenile female Atlantic salmon at normal and elevated temperatures. BMC Res. Notes 2012, 5, 21. [Google Scholar] [CrossRef]
- Braden, L.M.; Barker, D.E.; Koop, B.F.; Jones, S.R.M. Comparative defense-associated responses in salmon skin elicited by the ectoparasite Lepeophtheirus salmonis. Comp. Biochem. Physiol. Part D Genom. Proteom. 2012, 7, 100–109. [Google Scholar] [CrossRef]
- Xie, F.; Xiao, P.; Chen, D.; Xu, L.; Zhang, B. miRDeepFinder: A miRNA analysis tool for deep sequencing of plant small RNAs. Plant Mol. Biol. 2012, 80, 74–84. [Google Scholar] [CrossRef]
- Gistelinck, C.; Gioia, R.; Gagliardi, A.; Tonelli, F.; Marchese, L.; Bianchi, L.; Landi, C.; Bini, L.; Huysseune, A.; Witten, P.E.; et al. Zebrafish collagen type I: Molecular and biochemical characterization of the major structural protein in bone and skin. Sci. Rep. 2016, 6, 21540. [Google Scholar] [CrossRef]
- Zoch, M.L.; Clemens, T.L.; Riddle, R.C. New insights into the biology of osteocalcin. Bone 2016, 82, 42–49. [Google Scholar] [CrossRef]
- Koyama, Y.; Rittling, S.R.; Tsuji, K.; Hino, K.; Salincarnboriboon, R.; Yano, T.; Taketani, Y.; Nifuji, A.; Denhardt, D.T.; Noda, M. Osteopontin deficiency suppresses high phosphate load-induced bone loss via specific modulation of osteoclasts. Endocrinology 2006, 147, 3040–3049. [Google Scholar] [CrossRef]
- Yuan, Q.; Jiang, Y.; Zhao, X.; Sato, T.; Densmore, M.; Schüler, C.; Erben, R.G.; McKee, M.D.; Lanske, B. Increased Osteopontin Contributes to Inhibition of Bone Mineralization in FGF23-Deficient Mice. J. Bone Miner. Res. 2014, 29, 693–704. [Google Scholar] [CrossRef]
- Huitema, L.F.A.; Apschner, A.; Logister, I.; Spoorendonk, K.M.; Bussmann, J.; Hammond, C.L.; Schulte-Merker, S. Entpd5 is essential for skeletal mineralization and regulates phosphate homeostasis in zebrafish. Proc. Natl. Acad. Sci. USA 2012, 109, 21372–21377. [Google Scholar] [CrossRef]
- Rutsch, F.; Ruf, N.; Vaingankar, S.; Toliat, M.R.; Suk, A.; Höhne, W.; Schauer, G.; Lehmann, M.; Roscioli, T.; Schnabel, D.; et al. Mutations in ENPP1 are associated with “idiopathic” infantile arterial calcification. Nat. Genet. 2003, 34, 379–381. [Google Scholar] [CrossRef]
- Mulero, J.J.; Yeung, G.; Nelken, S.T.; Ford, J.E. CD39-L4 Is a secreted human apyrase, specific for the hydrolysis of nucleoside diphosphates *. J. Biol. Chem. 1999, 274, 20064–20067. [Google Scholar] [CrossRef]
- Martin, A.; David, V.; Quarles, L.D. Regulation and function of the FGF23/klotho endocrine pathways. Physiol. Rev. 2012, 92, 131–155. [Google Scholar] [CrossRef]
- Baeverfjord, G.; Prabhu, P.A.J.; Fjelldal, P.G.; Albrektsen, S.; Hatlen, B.; Lundebye, A. Mineral nutrition and bone health in salmonids. Rev. Aquac. 2018, 11, 740–765. [Google Scholar] [CrossRef]
- Sambraus, F.; Hansen, T.; Daae, B.S.; Thorsen, A.; Sandvik, R.; Stien, L.H.; Fraser, T.W.K.; Fjelldal, P.G. Triploid Atlantic salmon Salmo salar have a higher dietary phosphorus requirement for bone mineralization during early development. J. Fish Biol. 2020, 97, 137–147. [Google Scholar] [CrossRef] [PubMed]
- Cotti, S.; Huysseune, A.; Larionova, D.; Koppe, W.; Forlino, A.; Witten, P.E. Compression fractures and partial phenotype rescue with a low phosphorus diet in the Chihuahua zebrafish osteogenesis imperfecta model. Front. Endocrinol. 2022, 13, 851879. [Google Scholar] [CrossRef] [PubMed]
- Heuer, R.M.; Grosell, M. Physiological impacts of elevated carbon dioxide and ocean acidification on fish. Am. J. Physiol. Integr. Comp. Physiol. 2014, 307, R1061–R1084. [Google Scholar] [CrossRef] [PubMed]
- Avila, E.M.; Tu, H.; Basantes, S.; Ferraris, R.P. Dietary phosphorus regulates intestinal transport and plasma concentrations of phosphate in rainbow trout. J. Comp. Physiol. B 2000, 170, 201–209. [Google Scholar] [CrossRef] [PubMed]
- Sugiura, S.H.; Ferraris, R.P. Contributions of different NaPi cotransporter isoforms to dietary regulation of P transport in the pyloric caeca and intestine of rainbow trout. J. Exp. Biol. 2004, 207, 2055–2064. [Google Scholar] [CrossRef] [PubMed]
- Bird, N.C.; Mabee, P.M. Developmental morphology of the axial skeleton of the zebrafish, Danio rerio (Ostariophysi: Cyprinidae). Dev. Dyn. 2003, 228, 337–357. [Google Scholar] [CrossRef]
- Boivin, G.; Meunier, P.J. The Degree of mineralization of bone tissue measured by computerized quantitative contact microradiography. Calcif. Tissue Int. 2002, 70, 503–511. [Google Scholar] [CrossRef]
- Cubbage, C.C.; Mabee, P.M. Development of the cranium and paired fins in the zebrafish Danio rerio (Ostariophysi, Cyprinidae). J. Morphol. 1996, 229, 121–160. [Google Scholar] [CrossRef]
- Totland, G.K.; Fjelldal, P.G.; Kryvi, H.; Løkka, G.; Wargelius, A.; Sagstad, A.; Hansen, T.; Grotmol, S. Sustained swimming increases the mineral content and osteocyte density of salmon vertebral bone. J. Anat. 2011, 219, 490–501. [Google Scholar] [CrossRef]
- Solstorm, F.; Solstorm, D.; Oppedal, F.; Gunnar, P. The vertebral column and exercise in Atlantic salmon—Regional effects. Aquaculture 2016, 461, 9–16. [Google Scholar] [CrossRef]
- Ytteborg, E.; Torgersen, J.S.; Pedersen, M.E.; Helland, S.J.; Grisdale-Helland, B.; Takle, H. Exercise induced mechano-sensing and substance P mediated bone modeling in Atlantic salmon. Bone 2013, 53, 259–268. [Google Scholar] [CrossRef]
- Stagi, S.; Cavalli, L.; Iurato, C.; Seminara, S.; Brandi, M.L.; de Martino, M. Bone metabolism in children and adolescents: Main characteristics of the determinants of peak bone mass. Clin. Cases Miner. Bone Metab. 2013, 10, 172–179. [Google Scholar]
- Sugiura, S.H.; Dong, P.M.; Hardy, R.W. Primary responses of rainbow trout to dietary phosphorus concentrations. Aquac. Nutr. 2000, 6, 235–245. [Google Scholar] [CrossRef]
- Heraud, C.; Hirschinger, T.; Baranek, E.; Larroquet, L.; Surget, A.; Sandres, F.; Lanuque, A.; Terrier, F.; Roy, J. Detection and modulation of olfactory sensing receptors in carnivorous rainbow trout (Oncorhynchus mykiss) fed from first feeding with plant-based diet. Int. J. Mol. Sci. 2022, 14, 2123. [Google Scholar] [CrossRef]
- Porteus, C.S.; Hubbard, P.C.; Uren Webster, T.M.; van Aerle, R.; Canário, A.V.M.; Santos, E.; Wilson, R.W. Near-future carbon dioxide levels impair the olfactory system of a marine fish. Nat. Clim. Chang. 2018, 8, 737–743. [Google Scholar] [CrossRef]
- Porteus, C.S.; Roggatz, C.C.; Velez, Z.; Hardege, J.D.; Hubbard, P.C. Acidification can directly affect olfaction in marine organisms. J. Exp. Biol. 2021, 224, jeb237941. [Google Scholar] [CrossRef]
- Velez, Z.; Roggatz, C.C.; Benoit, D.M.; Hardege, J.D.; Hubbard, P.C. Short- and medium-term exposure to ccean acidification reduces olfactory sensitivity in gilthead seabream. Front. Physiol. 2019, 10, 731. [Google Scholar] [CrossRef]
- Graff, I.E.; Waagbø, R.; Fivelstad, S.; Vermeer, C.; Lie, Ø.; Lundebye, A.K. A multivariate study on the effects of dietary vitamin K, vitamin D3 and calcium, and dissolved carbon dioxide on growth, bone minerals, vitamin status and health performance in smolting Atlantic salmon Salmo salar L. J. Fish Dis. 2002, 25, 599–614. [Google Scholar] [CrossRef]
- Hannan, K.D.; Rummer, J.L. Aquatic acidification: A mechanism underpinning maintained oxygen transport and performance in fish experiencing elevated carbon dioxide conditions. J. Exp. Biol. 2018, 221, jeb154559. [Google Scholar] [CrossRef]
- Ishimatsu, A.; Hayashi, M.; Lee, K.-S.; Kikkawa, T.; Kita, J. Physiological effects on fishes in a high-CO2 world. J. Geophys. Res. Ocean. 2005, 110, C09S09. [Google Scholar] [CrossRef]
- Khan, J.R.; Johansen, D.; Skov, P.V. The effects of acute and long-term exposure to CO2 on the respiratory physiology and production performance of Atlantic salmon (Salmo salar) in freshwater. Aquaculture 2018, 491, 20–27. [Google Scholar] [CrossRef]
- Goss, G.G.; Laurent, P.; Perry, S.F. Gill morphology during hypercapnia in brown bullhead (Ictalurus nebulosus): Role of chloride cells and pavement cells in acid-base regulation. J. Fish Biol. 1994, 45, 705–718. [Google Scholar] [CrossRef]
- Weston, C.W.; Wen, J.W. Purified Monoammonium Phosphate Process. U.S. Patent US4,325,927A, 20 April 1982. [Google Scholar]
- Andersen, F.; Magge, A.; Julshamn, K. An estimation of dietary iron requirement of Atlantic salmon, Salmo salar L.; parr. Aquac. Nutr. 1996, 2, 41–47. [Google Scholar] [CrossRef]
- Tsay, J.; Yang, Z.; Ross, F.P.; Cunningham-Rundles, S.; Lin, H.; Coleman, R.; Mayer-Kuckuk, P.; Doty, S.B.; Grady, R.W.; Giardina, P.J.; et al. Bone loss caused by iron overload in a murine model: Importance of oxidative stress. Blood 2010, 116, 2582–2589. [Google Scholar] [CrossRef]
- Zhang, W.; Xu, J.; Qiu, J.; Xing, C.; Li, X.; Leng, B.; Su, Y.; Lin, J.; Lin, J.; Mey, X.; et al. Novel and rapid osteoporosismodel established in zebrafish using high iron stress. Biochem. Biophys. Res. Commun. 2018, 496, 654–660. [Google Scholar] [CrossRef]
- Green, J.A.; Brannon, E.L.; Hardy, R.W. Effects of dietary phosphorus and lipid levels on utilization and excretion of phosphorus and nitrogen by rainbow trout (Oncorhynchus mykiss). 2. Production-scale study. Aquac. Nutr. 2002, 8, 291–298. [Google Scholar] [CrossRef]
- Green, J.A.; Hardy, R.W.; Brannon, E.L. Effects of dietary phosphorus and lipid levels on utilization and excretion of phosphorus and nitrogen by rainbow trout (Oncorhynchus mykiss). 1. Laboratory-scale study. Aquac. Nutr. 2002, 8, 279–290. [Google Scholar] [CrossRef]
- Ketola, H.; Westers, H.; Houghton, W.; Pecor, C. Effect of diet on growth and survival of coho salmon and on phosphorus discharges from a fish hatchery. Am. Fish. Soc. Symp. 1991, 10, 402–409. [Google Scholar]
- Ketola, H.G.; Harland, B.F. Influence of phosphorus in rainbow trout diets on phosphorus discharges in effluent water. Trans. Am. Fish. Soc. 1993, 122, 1120–1126. [Google Scholar] [CrossRef]
- Rodehutscord, M.; Gregus, Z.; Pfeffer, E. Effect of phosphorus intake on faecal and non-faecal phosphorus excretion in rainbow trout (Oncorhynchus mykiss) and the consequences for comparative phosphorus availability studies. Aquaculture 2000, 188, 383–398. [Google Scholar] [CrossRef]
- Vielma, J.; Lall, S.P. Phosphorus utilization by Atlantic salmon (Salmo salar) reared in freshwater is not influenced by higher dietary calcium intake. Aquaculture 1998, 160, 117–128. [Google Scholar] [CrossRef]
- Wiesmann, D.; Scheid, H.; Pfeffer, E. Water pollution with phosphorus of dietary origin by intensively fed rainbow trout (Salmo gairdneri Rich.). Aquaculture 1988, 69, 263–270. [Google Scholar] [CrossRef]


| Diet | 0.5P | 1P | 3P |
|---|---|---|---|
| Formulation (g/kg) | |||
| Wheat gluten | 241.8 | 243.6 | 243.7 |
| Fishmeal ab | 250.0 | 250.0 | 250.0 |
| Tapioca Starch 79.5% | 71.5 | 72.0 | 71.3 |
| Sodium caseinate 89.2% | 61.0 | 59.4 | 59.4 |
| Guar meal 58% | 9.8 | 9.8 | 9.7 |
| Wheat | 31.3 | 31.3 | 31.2 |
| Mono-ammonium phosphate a | 0.0 | 11.9 | 88.2 |
| Cellulose | 92.2 | 80.5 | 0.0 |
| Fish oil c | 78.9 | 78.4 | 78.5 |
| Rapeseed oil | 150.0 | 149.0 | 149.1 |
| Premixes d | 15.8 | 15.9 | 15.9 |
| Water/ Moisture change e | −2.3 | −1.8 | 2.9 |
| Proximate analysis | |||
| Moisture (%) | 6.1 | 6.8 | 6.3 |
| Crude protein (%) | 43.4 | 43.7 | 49.5 |
| Crude fat (%) | 26.9 | 26.1 | 27.5 |
| Ash (%) | 4.4 | 4.8 | 9.4 |
| Total P g/kg | 6.3 | 9.0 | 26.8 |
| Estimated available P g/kg f | 2.8 | 5.6 | 23.4 |
| Total Fe, mg/kg | 78.0 | 102.0 | 148.0 |
| Astaxanthin mg/kg | 63.0 | 60.5 | 58.9 |
| Target | Primer Sequence 5′ to 3′ | Accession Number | Amplicon Size (bp*) | Annealing Temperature | Reference |
|---|---|---|---|---|---|
| β-actin | F: CAACTGGGACGACATGGAGA R: AGTGAGCAGGACTGGGTGCT | AF012125 | 88 | 58 | [80] |
| ef1a | F: GCACCACGAGACCCTGGAAT R: CACGTTGCCACGACGATAT | AF321836 | 94 | 60 | [79] |
| bgp | F: GACTCCTCTACCTCCACTGC R: AATGATCCCAGCTGTGTCCA | NM_001136551.1 | 207 | 60 | [77] |
| col1a1a | F: TGGTGAGCGTGGTGAGTCTG R: TAGCTCCGGTGTTTCCAGCG | FJI95608 | 188 | 60 | [77] |
| opn | F: CTTACTGAGGTGGCCCCTGT R: GCTGTCCGATGTTGGGTCTG | XM_014186048.1 | 114 | 60 | [77] |
| enpp1 | F: ACGGACCAATGAGCAGTCAG R: TGAGTTCACGAATGCAGCCT | XM_014204668.1 | 173 | 60 | Own design |
| entpd5 | F: AGCCGTACGAGATAAAGGGC R: CCCCGACTGCCATCAATGAG | XM_0141843607.2 | 94 | 60 | Own design |
| fgf23 | F: ACTGGGGGAATCCGAGAAGA R: TCTTCCTTGTGGCAAACGGT | XM_014153467.2 | 241 | 60 | Own design |
| CO2 | 5 mg/L CO2 | 20 mg/L CO2 | p-Value | ||||||
|---|---|---|---|---|---|---|---|---|---|
| Diet/ Measurements | 0.5P | 1P | 3P | 0.5P | 1P | 3P | D | CO2 | D × CO2 |
| Week 3 | |||||||||
| Fork length (cm) | 25.97 ± 0.85 | 26.04 ± 0.89 | 25.81 ± 0.78 | 26.00 ± 0.91 | 26.25 ± 1.09 | 25.82 ± 0.85 | - 1 | - | - |
| Weight (g) | 204. 28 ± 18.84 | 205. 15 ± 21.73 | 205.14 ± 21.87 | 204.60 ± 18.01 | 207.22 ± 21.45 | 207.02 ± 19.35 | - | - | - |
| Condition factor | 1.18 ± 0.07 | 1.20 ± 0.08 | 1.20 ± 0.05 | 1.18 ± 0.08 | 1.15 ± 0.06 | 1.18 ± 0.06 | - | - | - |
| Week 8 | |||||||||
| Fork length (cm) | 29.33 ± 1.01 ab | 29.97 ± 1.47 b | 29.17 ± 1.12 ab | 28.50 ± 1.34 a | 28.72 ± 1.28 a | 29.22 ± 1.22 ab | 0.245 | 0.250 | 0.026 |
| Weight (g) | 299.87 ± 30.19 ab | 326.40 ± 48.04 b | 287.53 ± 35.37 a | 269.60 ± 42.40 a | 270.87 ± 43.50 a | 284.87 ± 38.96 a | 0.117 | <0.001 | 0.002 |
| Condition factor | 1.19 ± 0.09 ab | 1.21 ± 0.09 b | 1.16 ± 0.07 ab | 1.16 ± 0.07 ab | 1.14 ± 0.08 a | 1.14 ± 0.06 a | 0.059 | 0.002 | 0.608 |
| Week 16 | |||||||||
| Fork length (cm) | 36.02 ± 2.02 bc | 36.92 ± 1.56 c | 35.67 ± 2.00 abc | 34.30 ± 1.53 a | 35.49 ± 2.07 ab | 35.24 ± 1.55 a | 0.009 | <0.001 | 0.056 |
| Weight (g) | 586.47 ± 79.47 bc | 635.13 ± 96.50 c | 531.33 ± 105.90 ab | 484.33 ± 79.87 a | 526.13 ± 85.42 ab | 527.80 ± 66.09 ab | 0.002 | <0.001 | 0.001 |
| Condition factor | 1.26 ± 0.21 ab | 1.25 ± 0.10 b | 1.16 ± 0.15 ab | 1.19 ± 0.08 ab | 1.17 ± 0.07 a | 1.20 ± 0.07 ab | 0.192 | 0.059 | 0.002 |
| SGR 2 (% body mass day−1) 3 | 1.17 ± 0.01 | 1.25 ± 0.05 | 1.10 ± 0.01 | 0.99 ± 0.02 | 1.10 ± 0.06 | 1.06 ± 0.01 | <0.001 | 0.010 | 0.056 |
| FCR 4 (DM 5) 3 | 0.71 ± 0.00 | 0.69 ± 0.01 | 0.70 ± 0.00 | 0.75 ± 0.00 | 0.72 ± 0.01 | 0.73 ± 0.00 | <0.001 | <0.001 | 0.847 |
| Feed intake (% of body mass day−1) 3 | 0.89 ± 0.01 | 0.92 ± 0.03 | 0.82 ± 0.01 | 0.79 ± 0.02 | 0.85 ± 0.05 | 0.82 ± 0.00 | 0.010 | 0.027 | 0.064 |
| Total feed eaten (kg DM) 3 | 10.28 ± 0.00 | 11.12 ± 0.32 | 8.82 ± 0.04 | 8.17 ± 0.57 | 8.81 ± 0.61 | 8.18 ± 0.01 | <0.001 | 0.004 | 0.034 |
| CO2 | 5 mg/L CO2 | 20 mg/L CO2 | p-Value | ||||||
|---|---|---|---|---|---|---|---|---|---|
| Diet/Measurements | 0.5P | 1P | 3P | 0.5P | 1P | 3P | D | CO2 | D × CO2 |
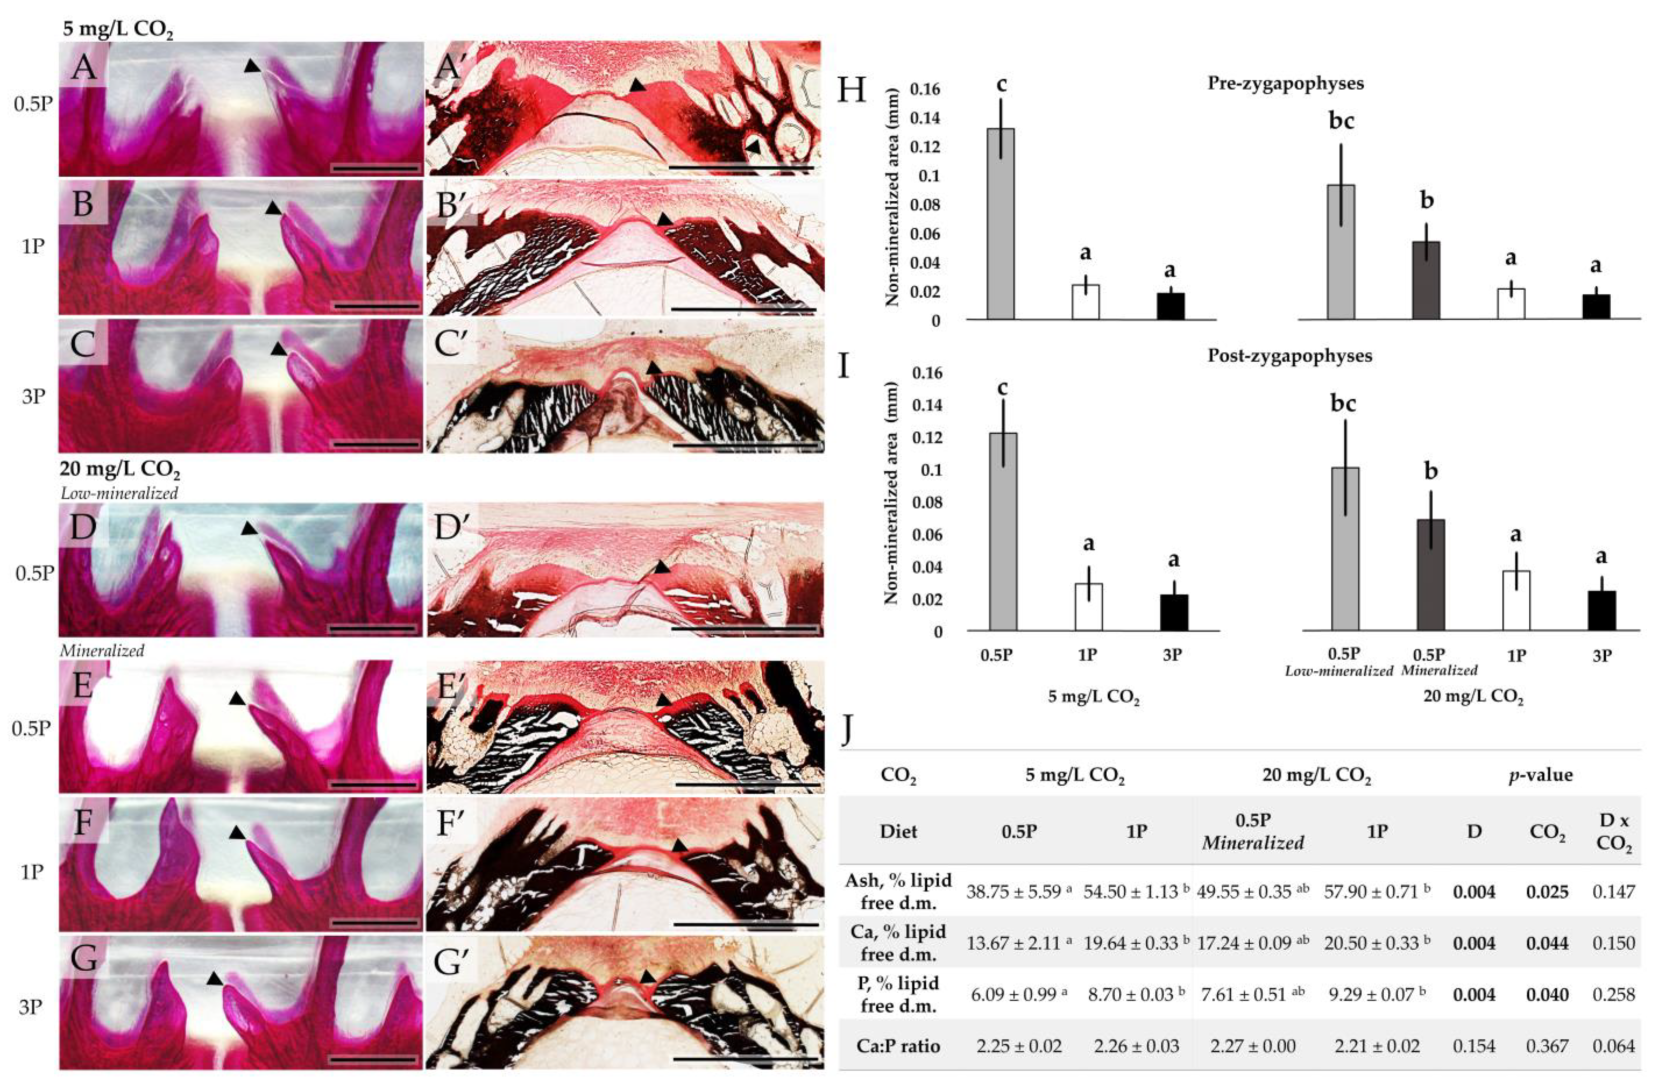
| Pre-zygapophyses (mm) | 0.13 ± 0.09 b | 0.02 ± 0.00 a | 0.02 ± 0.00 a | 0.07 ± 0.03 ab | 0.02 ± 0.01 a | 0.02 ± 0.00 a | <0.001 | 0.113 | 0.123 |
| Post-zygapophyses (mm) | 0.12 ± 0.05 b | 0.03 ± 0.01 bc | 0.02 ± 0.01 bc | 0.08 ± 0.02 ab | 0.04 ± 0.01 b | 0.02 ± 0.00 bc | <0.001 | 0.286 | 0.078 |
| CO2 | 5 mg/L | 20 mg/L | p-Value | |||||||
|---|---|---|---|---|---|---|---|---|---|---|
| Week 3 | Week 16 | |||||||||
| Diet/Measurements | 0.5P | 0.5P | 1P | 3P | 0.5P | 1P | 3P | D | CO2 | D × CO2 |
| pH | 7.06 ± 0.02 | 6.99 ± 0.04 b | 7.02 ± 0.04 b | 7.03 ± 0.05 b | 7.20 ± 0.05 c | 7.17 ± 0.05 c | 7.17 ± 0.03 c | 0.993 | <0.001 | 0.092 |
| PCO2 (kPa) | 5.25 ± 0.45 | 3.80 ± 0.45 a | 3.59 ± 0.35 a | 3.62 ± 0.44 a | 6.43 ± 0.87 b | 7.12 ± 0.57 b | 7.28 ± 0.72 b | 0.226 | <0.001 | 0.018 |
| Bicarbonate ions (mmol/L) | 11.08 ± 0.60 | 6.93 ± 0.62 a | 6.88 ± 0.40 a | 7.05 ± 0.32 a | 18.94 ± 0.81 b | 19.58 ± 1.29 b | 19.93 ± 0.66 b | 0.098 | <0.001 | 0.178 |
| TCO2 (mmol/L) | 12.33 ± 0.52 | 7.88 ± 0.75 a | 7.70 ± 0.50 a | 7.90 ± 0.22 a | 20.33 ± 1.02 b | 21.20 ± 1.24 b | 21.60 ± 0.72 b | 0.076 | <0.001 | 0.053 |
| PO2 (kPa) | 4.98 ± 2.48 | 4.95 ± 1.06 | 5.33 ± 1.11 | 4.89 ± 1.56 | 5.72 ± 0.91 | 5.68 ± 1.75 | 4.57 ± 0.72 | 0.167 | 0.475 | 0.432 |
| sO2 (%) | 45.17 ± 24.72 | 44.28 ± 14.79 ab | 30.63 ± 13.69 a | 45.55 ± 21.34 ab | 66.18 ± 11.67 b | 61.10 ± 20.71 b | 49.80 ± 10.01 ab | 0.259 | 0.009 | 0.280 |
| CO2 | 5 mg/L | 20 mg/L | p-Value | |||||||
|---|---|---|---|---|---|---|---|---|---|---|
| Week 3 | Week 16 | |||||||||
| Diet/ Measurements | 0.5P | 0.5P | 1P | 3P | 0.5P | 1P | 3P | D | CO2 | D × CO2 |
| ALP (U/L) | 161.00 ± 32.14 | 158.63 ± 37.62 a | 196.98 ± 45.61 ab | 217.00 ± 46.93 ab | 184.33 ± 33.59 ab | 232.61 ± 35.63 ab | 285.26 ± 75.23 b | 0.001 | 0.011 | 0.530 |
| b/l/k ALP (U/L) | - | 103.35 ± 28.50 a | 126.93 ± 37.78 ab | 139.74 ± 34.74 ab | 119.58 ± 25.43 ab | 152.18 ± 29.11 ab | 188.23 ± 61.49 b | 0.008 | 0.025 | 0.564 |
| pH | 7.20 ± 0.08 | 7.20 ± 0.07 a | 7.14 ± 0.09 a | 7.08 ± 0.16 a | 7.39 ± 0.09 b | 7.40 ± 0.09 b | 7.37 ± 0.13 b | 0.020 | <0.001 | 0.173 |
| Bicarbonate ions (mmol/L) | 10.60 ± 1.18 | 10.76 ± 1.42 a | 10.10 ± 1.32 a | 10.11 ± 1.49 a | 23.34 ± 1.89 b | 23.39 ± 1.98 b | 24.30 ± 1.92 b | 0.482 | <0.001 | 0.124 |
| Total Ca2+ (mmol/L) | 3.50 ± 0.34 | 3.14 ± 0.14 a | 3.29 ± 0.13 ab | 3.30 ± 0.32 ab | 3.28 ± 0.17 ab | 3.52 ± 0.17c | 3.57 ± 0.13 c | <0.001 | <0.001 | 0.288 |
| Non-bound Ca2+ (mmol/L) | 1.8 ± 0.11 | 1.46 ± 0.06 abc | 1.43 ± 0.07 ab | 1.45 ± 0.11 ab | 1.52 ± 0.07 cd | 1.54 ± 0.04 d | 1.54 ± 0.07 d | 0.020 | <0.001 | 0.419 |
| Pi (mmol/L) | 3.40 ± 0.62 | 2.19 ± 0.22 a | 3.85 ± 0.36 b | 3.56 ± 0.31 b | 2.26 ± 0.51 a | 3.73 ± 0.25 b | 3.69 ± 0.25 b | <0.001 | 0.671 | 0.231 |
| Cl− (mmol/L) | 108.50 ± 2.07 | 116.45 ± 1.70 b | 115.65 ± 1.63 b | 115.15 ± 2.72 b | 112.50 ± 3.28 ab | 111.10 ± 1.41 a | 111.70 ± 1.45 a | 0.039 | <0.001 | 0.522 |
| Zn2+ (mmol/L) | 68.60 ± 15.40 | 215.35 ± 41.07 c | 205.4 ± 30.99 bc | 172.80 ± 34.80 ab | 180.80 ± 28.77 abc | 165.00 ± 23.06 a | 155.85 ± 31.34 a | <0.001 | <0.001 | 0.222 |
| CO2 | 5 mg/L CO2 | 20 mg/L CO2 | p-Value | ||||||
|---|---|---|---|---|---|---|---|---|---|
| Diet/ Measurements | 0.5P | 1P | 3P | 0.5P | 1P | 3P | D | CO2 | D × CO2 |
| Modulus of Elasticity | 0.15 ± 0.04 a | 0.60 ± 0.12 b | 0.71 ± 0.12 b | 0.25 ± 0.07 a | 0.70 ± 0.10 b | 0.65 ± 0.12 b | <0.001 | 0.152 | 0.012 |
| Yield point (0.2% offset) | 1.56 ± 0.31 a | 3.18 ± 0.89 bc | 3.30 ± 0.82 c | 2.39 ± 0.44 ab | 3.75 ± 0.79 c | 3.27 ± 0.75 bc | <0.001 | 0.023 | 0.103 |
| Failure point (5% offset) | 2.40 ± 0.27 a | 4.92 ± 0.86 b | 5.55 ± 0.44 b | 3.17 ± 0.30 a | 5.29 ± 0.68 b | 5.19 ± 0.38 b | <0.001 | 0.165 | 0.039 |
| Toughness (MPa x%) | 31.46 ± 5.79 a | 43.77 ± 10.38 ab | 47.45 ± 8.32 b | 36.60 ± 4.87 ab | 46.01 ± 8.23 ab | 46.54 ± 9.93 b | <0.001 | 0.377 | 0.736 |
Disclaimer/Publisher’s Note: The statements, opinions and data contained in all publications are solely those of the individual author(s) and contributor(s) and not of MDPI and/or the editor(s). MDPI and/or the editor(s) disclaim responsibility for any injury to people or property resulting from any ideas, methods, instructions or products referred to in the content. |
© 2023 by the authors. Licensee MDPI, Basel, Switzerland. This article is an open access article distributed under the terms and conditions of the Creative Commons Attribution (CC BY) license (https://creativecommons.org/licenses/by/4.0/).
Share and Cite
Drábiková, L.; Fjelldal, P.G.; Yousaf, M.N.; Morken, T.; De Clercq, A.; McGurk, C.; Witten, P.E. Elevated Water CO2 Can Prevent Dietary-Induced Osteomalacia in Post-Smolt Atlantic Salmon (Salmo salar, L.). Biomolecules 2023, 13, 663. https://doi.org/10.3390/biom13040663
Drábiková L, Fjelldal PG, Yousaf MN, Morken T, De Clercq A, McGurk C, Witten PE. Elevated Water CO2 Can Prevent Dietary-Induced Osteomalacia in Post-Smolt Atlantic Salmon (Salmo salar, L.). Biomolecules. 2023; 13(4):663. https://doi.org/10.3390/biom13040663
Chicago/Turabian StyleDrábiková, Lucia, Per Gunnar Fjelldal, Muhammad Naveed Yousaf, Thea Morken, Adelbert De Clercq, Charles McGurk, and Paul Eckhard Witten. 2023. "Elevated Water CO2 Can Prevent Dietary-Induced Osteomalacia in Post-Smolt Atlantic Salmon (Salmo salar, L.)" Biomolecules 13, no. 4: 663. https://doi.org/10.3390/biom13040663
APA StyleDrábiková, L., Fjelldal, P. G., Yousaf, M. N., Morken, T., De Clercq, A., McGurk, C., & Witten, P. E. (2023). Elevated Water CO2 Can Prevent Dietary-Induced Osteomalacia in Post-Smolt Atlantic Salmon (Salmo salar, L.). Biomolecules, 13(4), 663. https://doi.org/10.3390/biom13040663