


LEO1 Is Required for Efficient Entry into Quiescence, Control of H3K9 Methylation and Gene Expression in Human Fibroblasts


Abstract
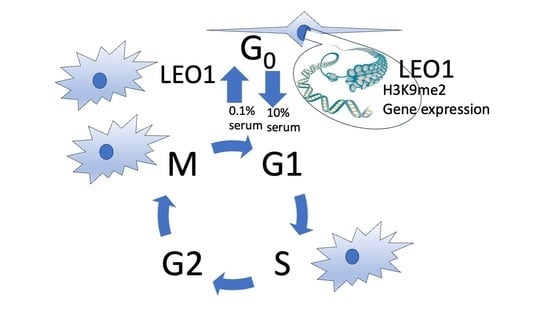
1. Introduction
2. Materials and Methods
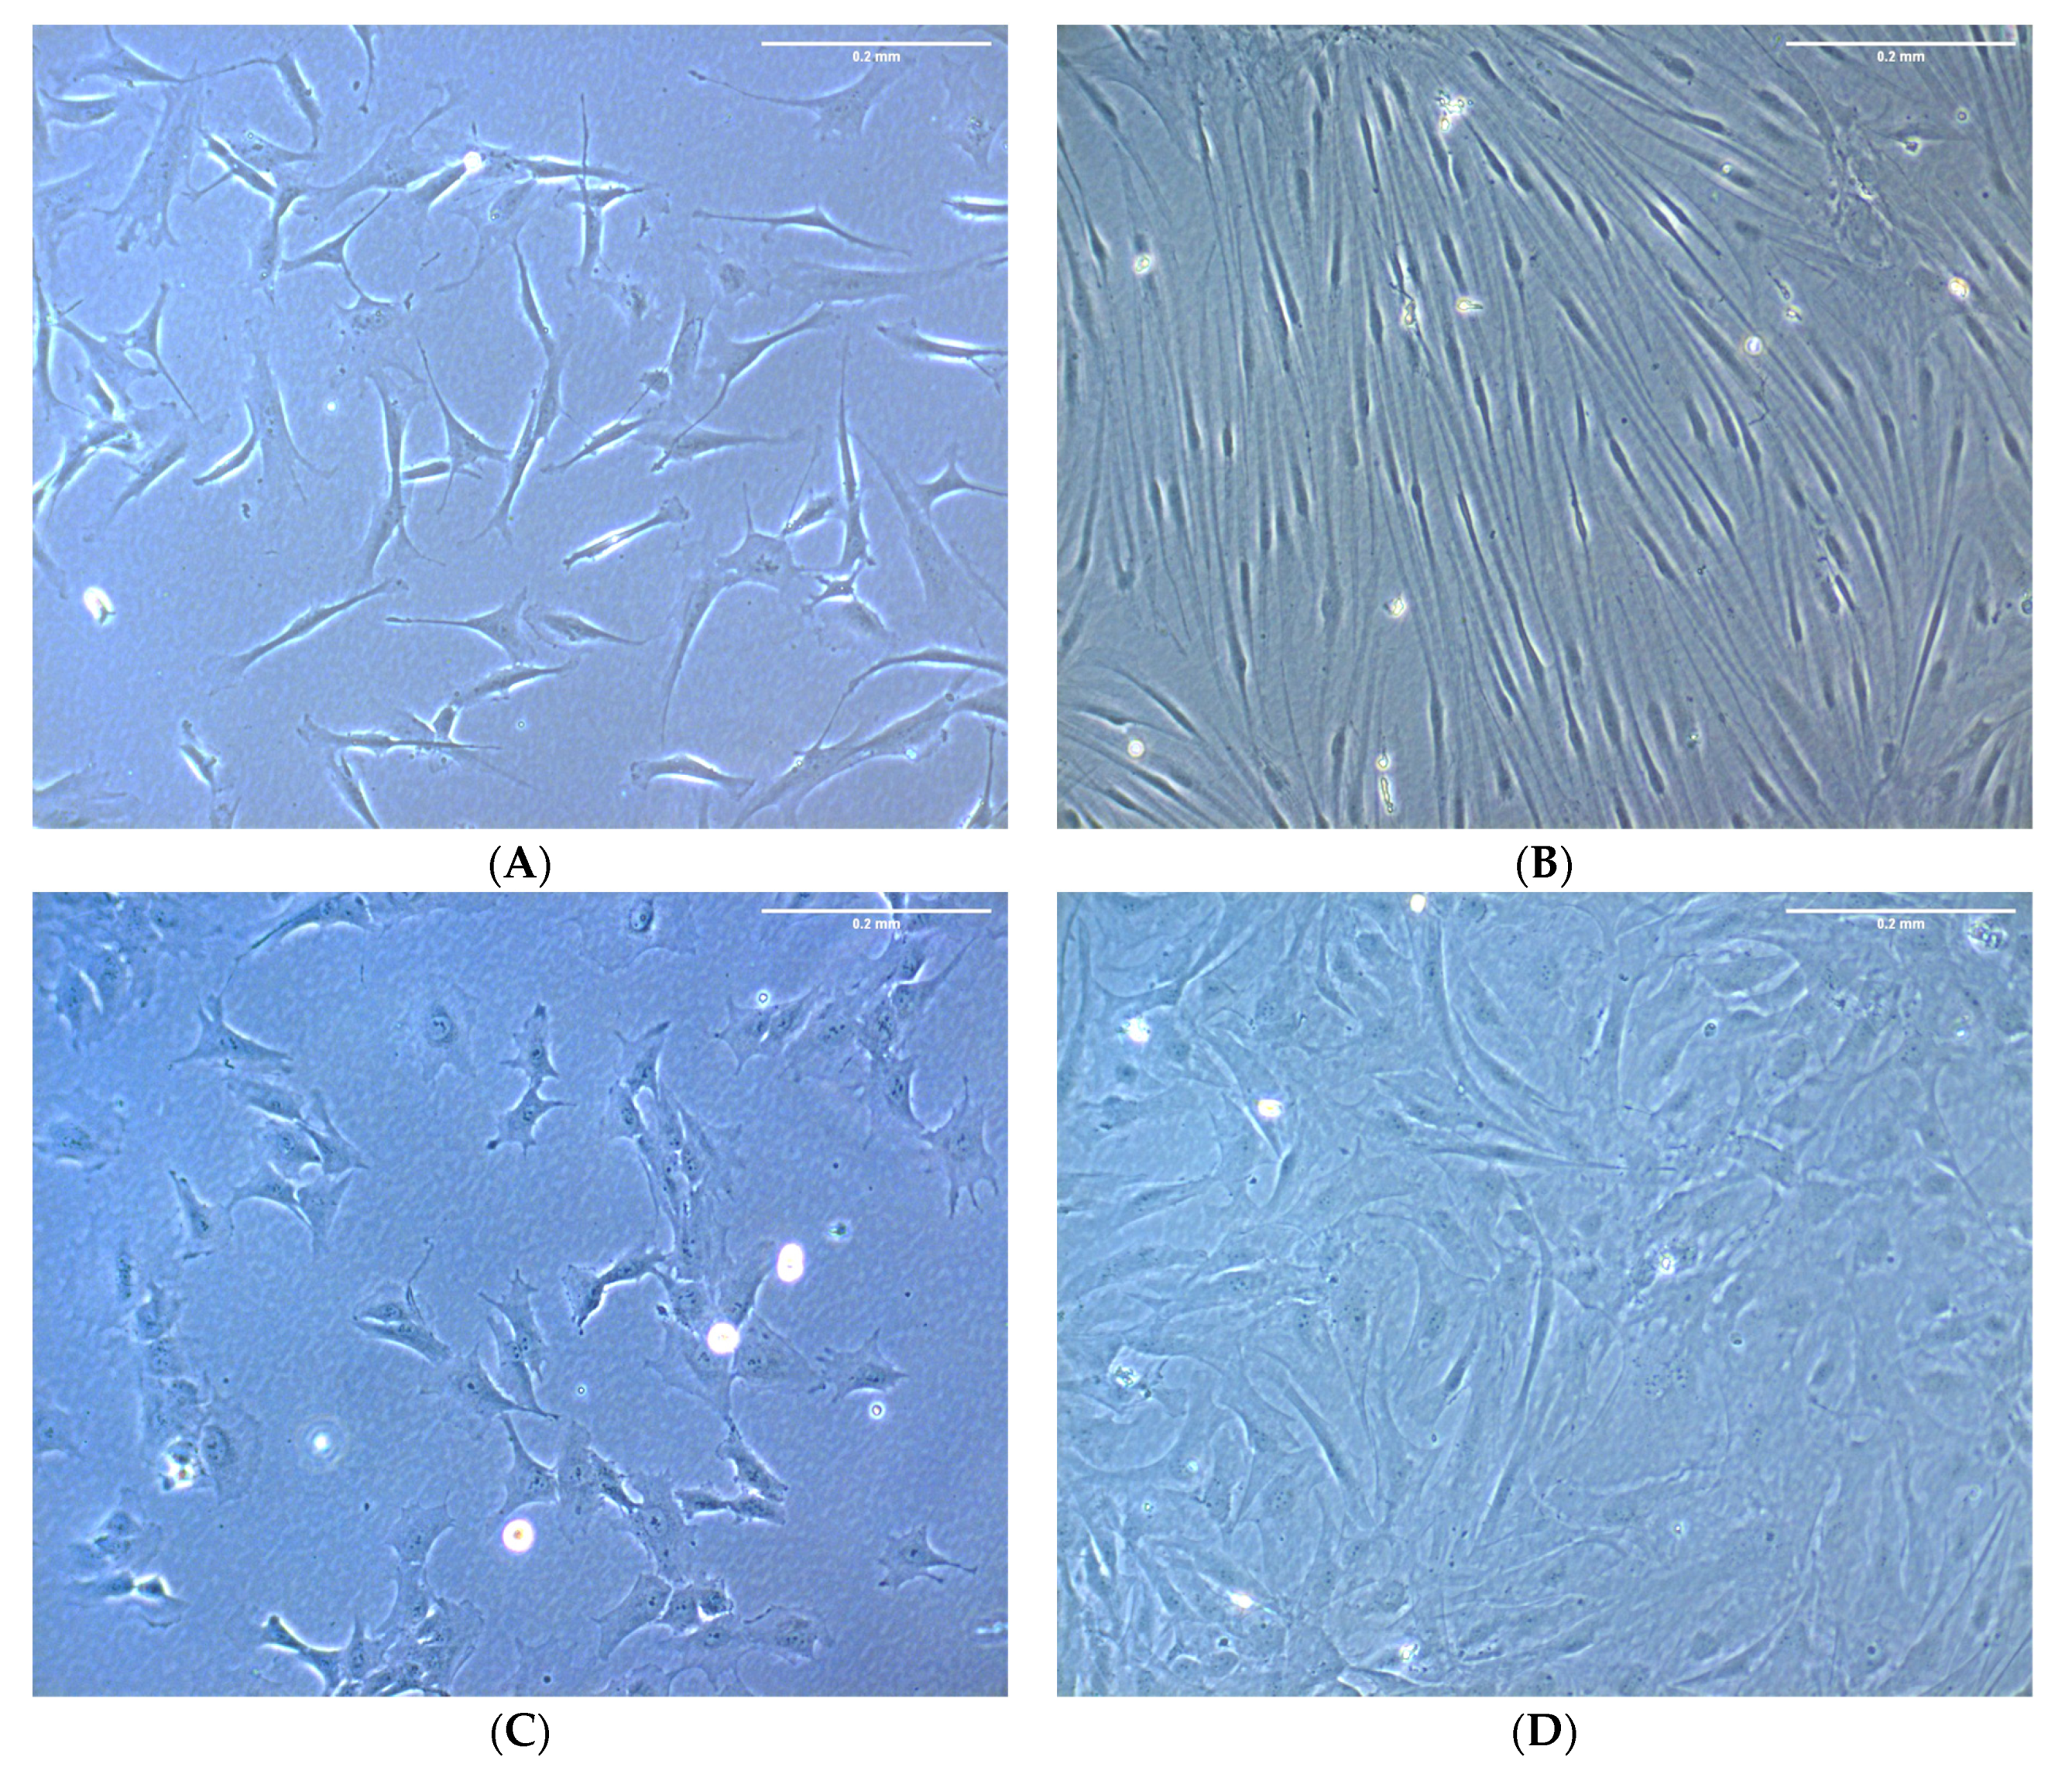
2.1. Cell Culture
2.2. Cell Growth and Viability Assays
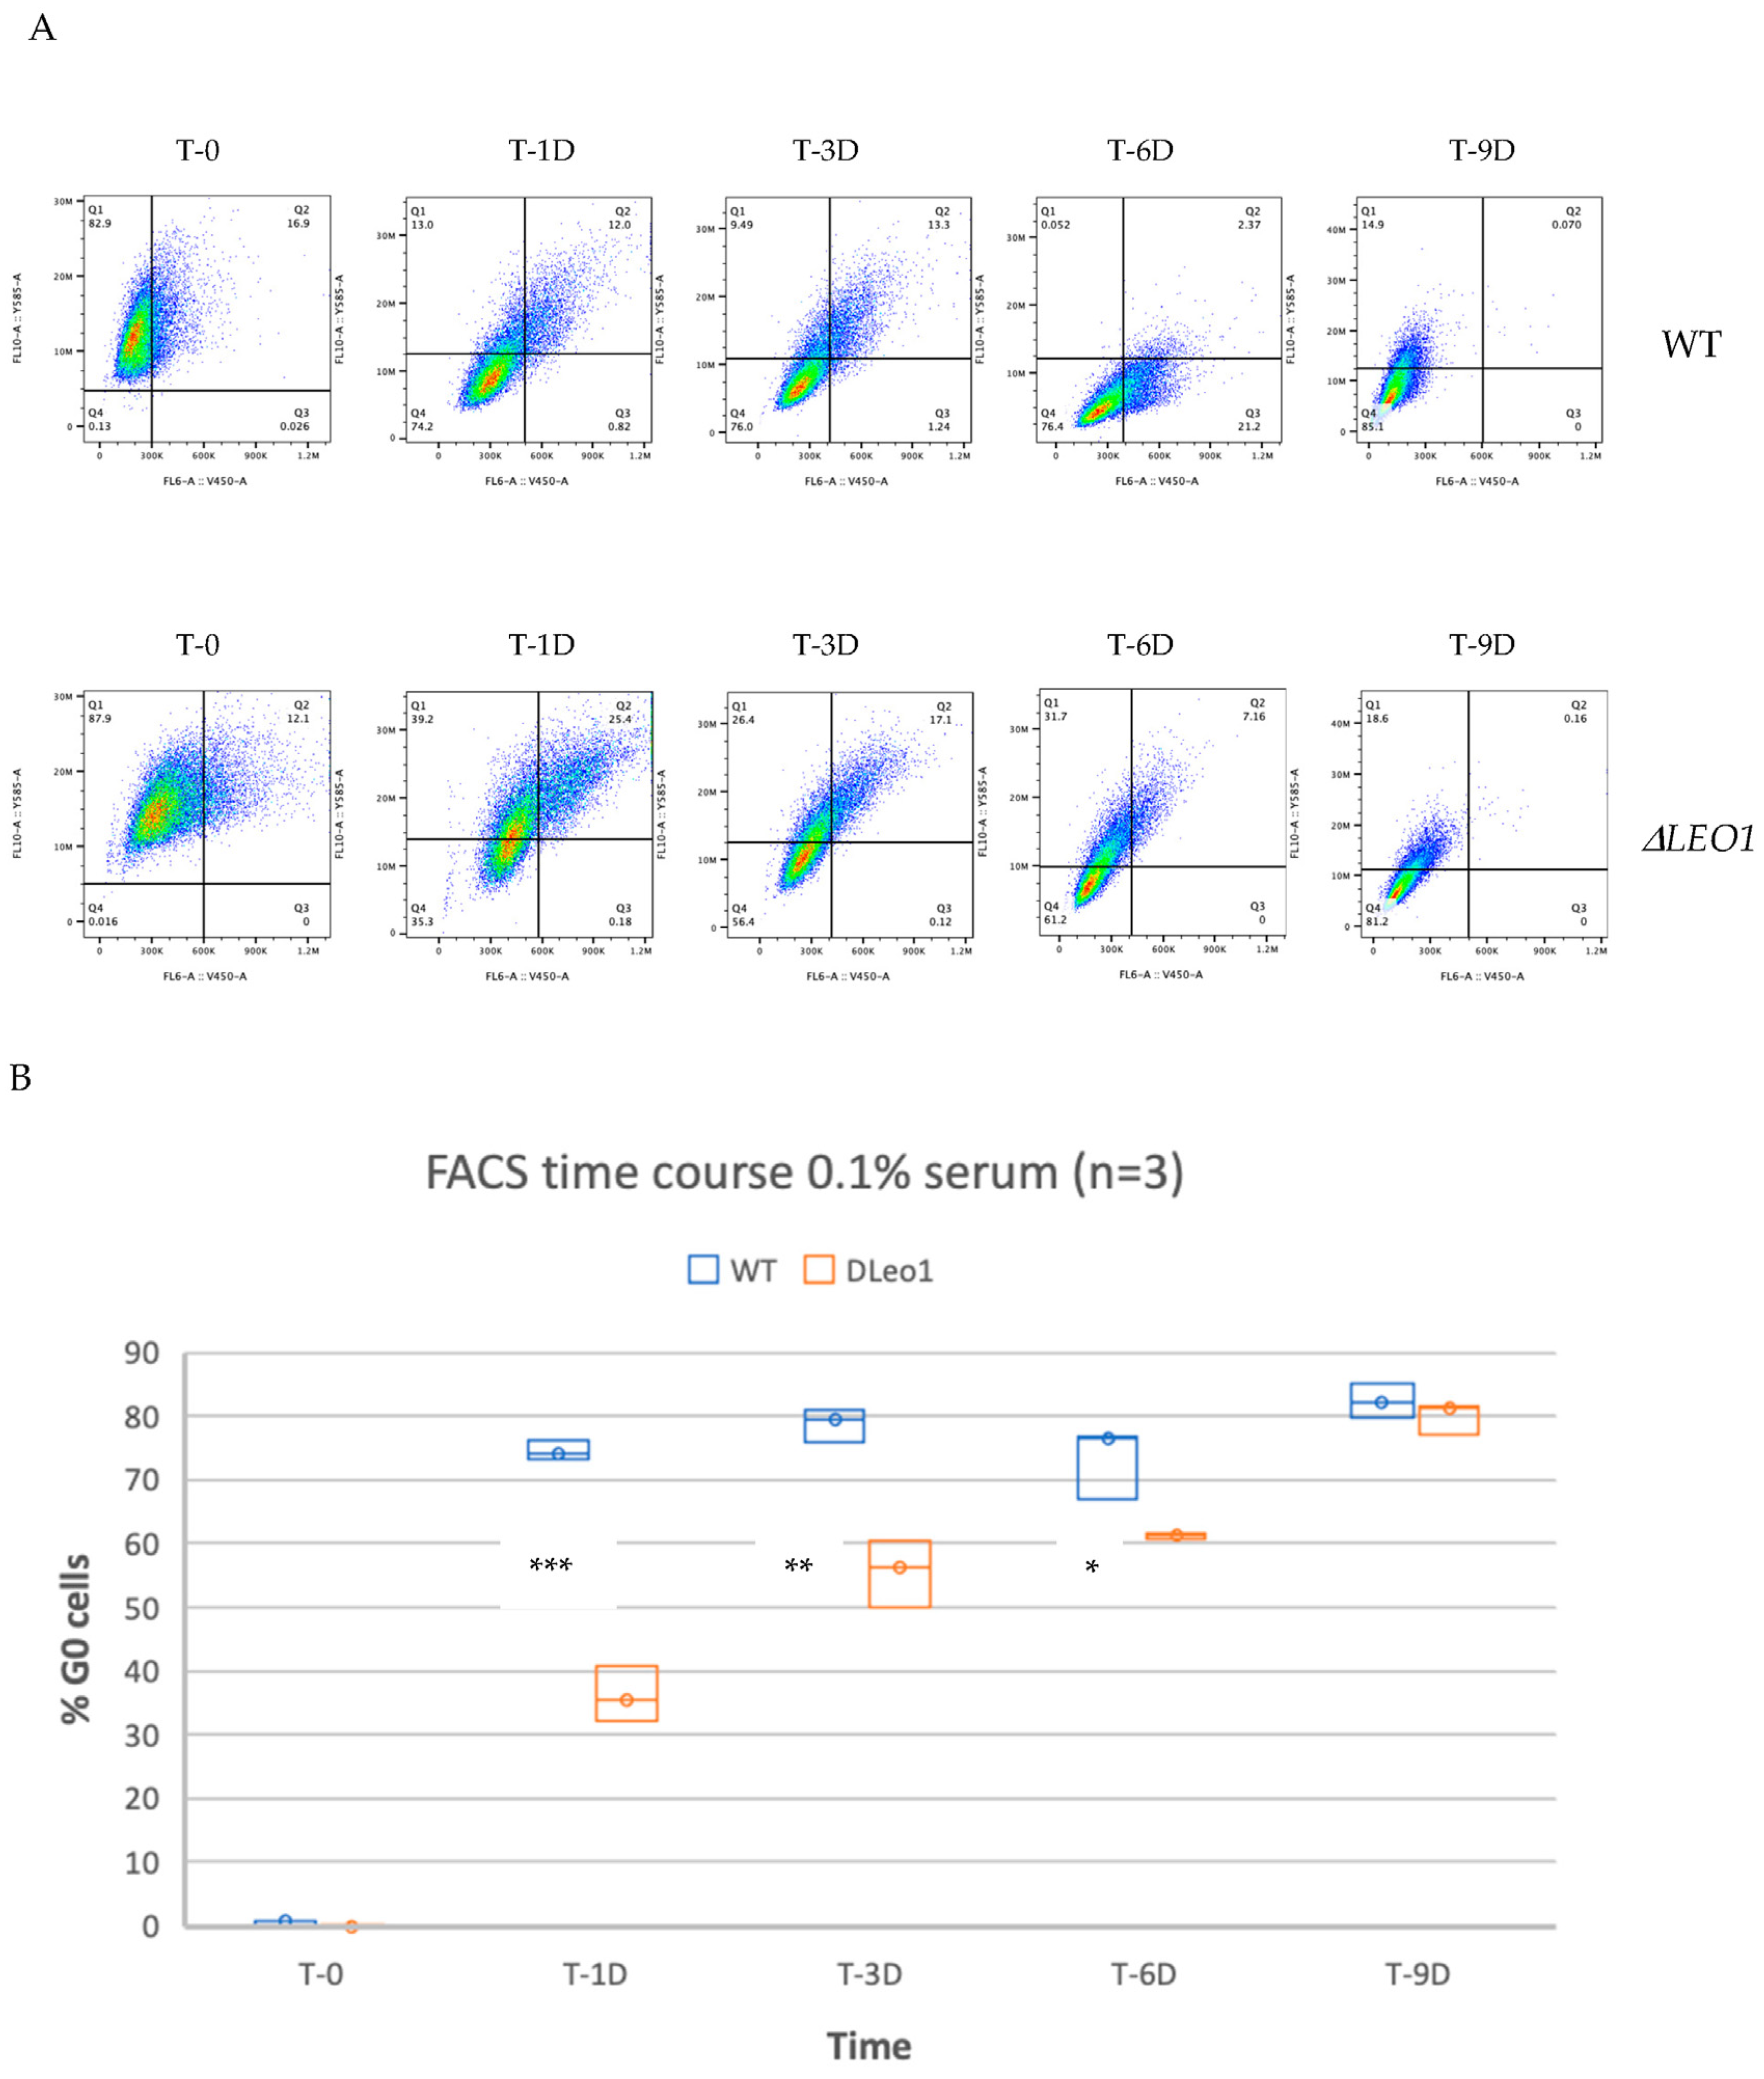
2.3. FACS Analysis
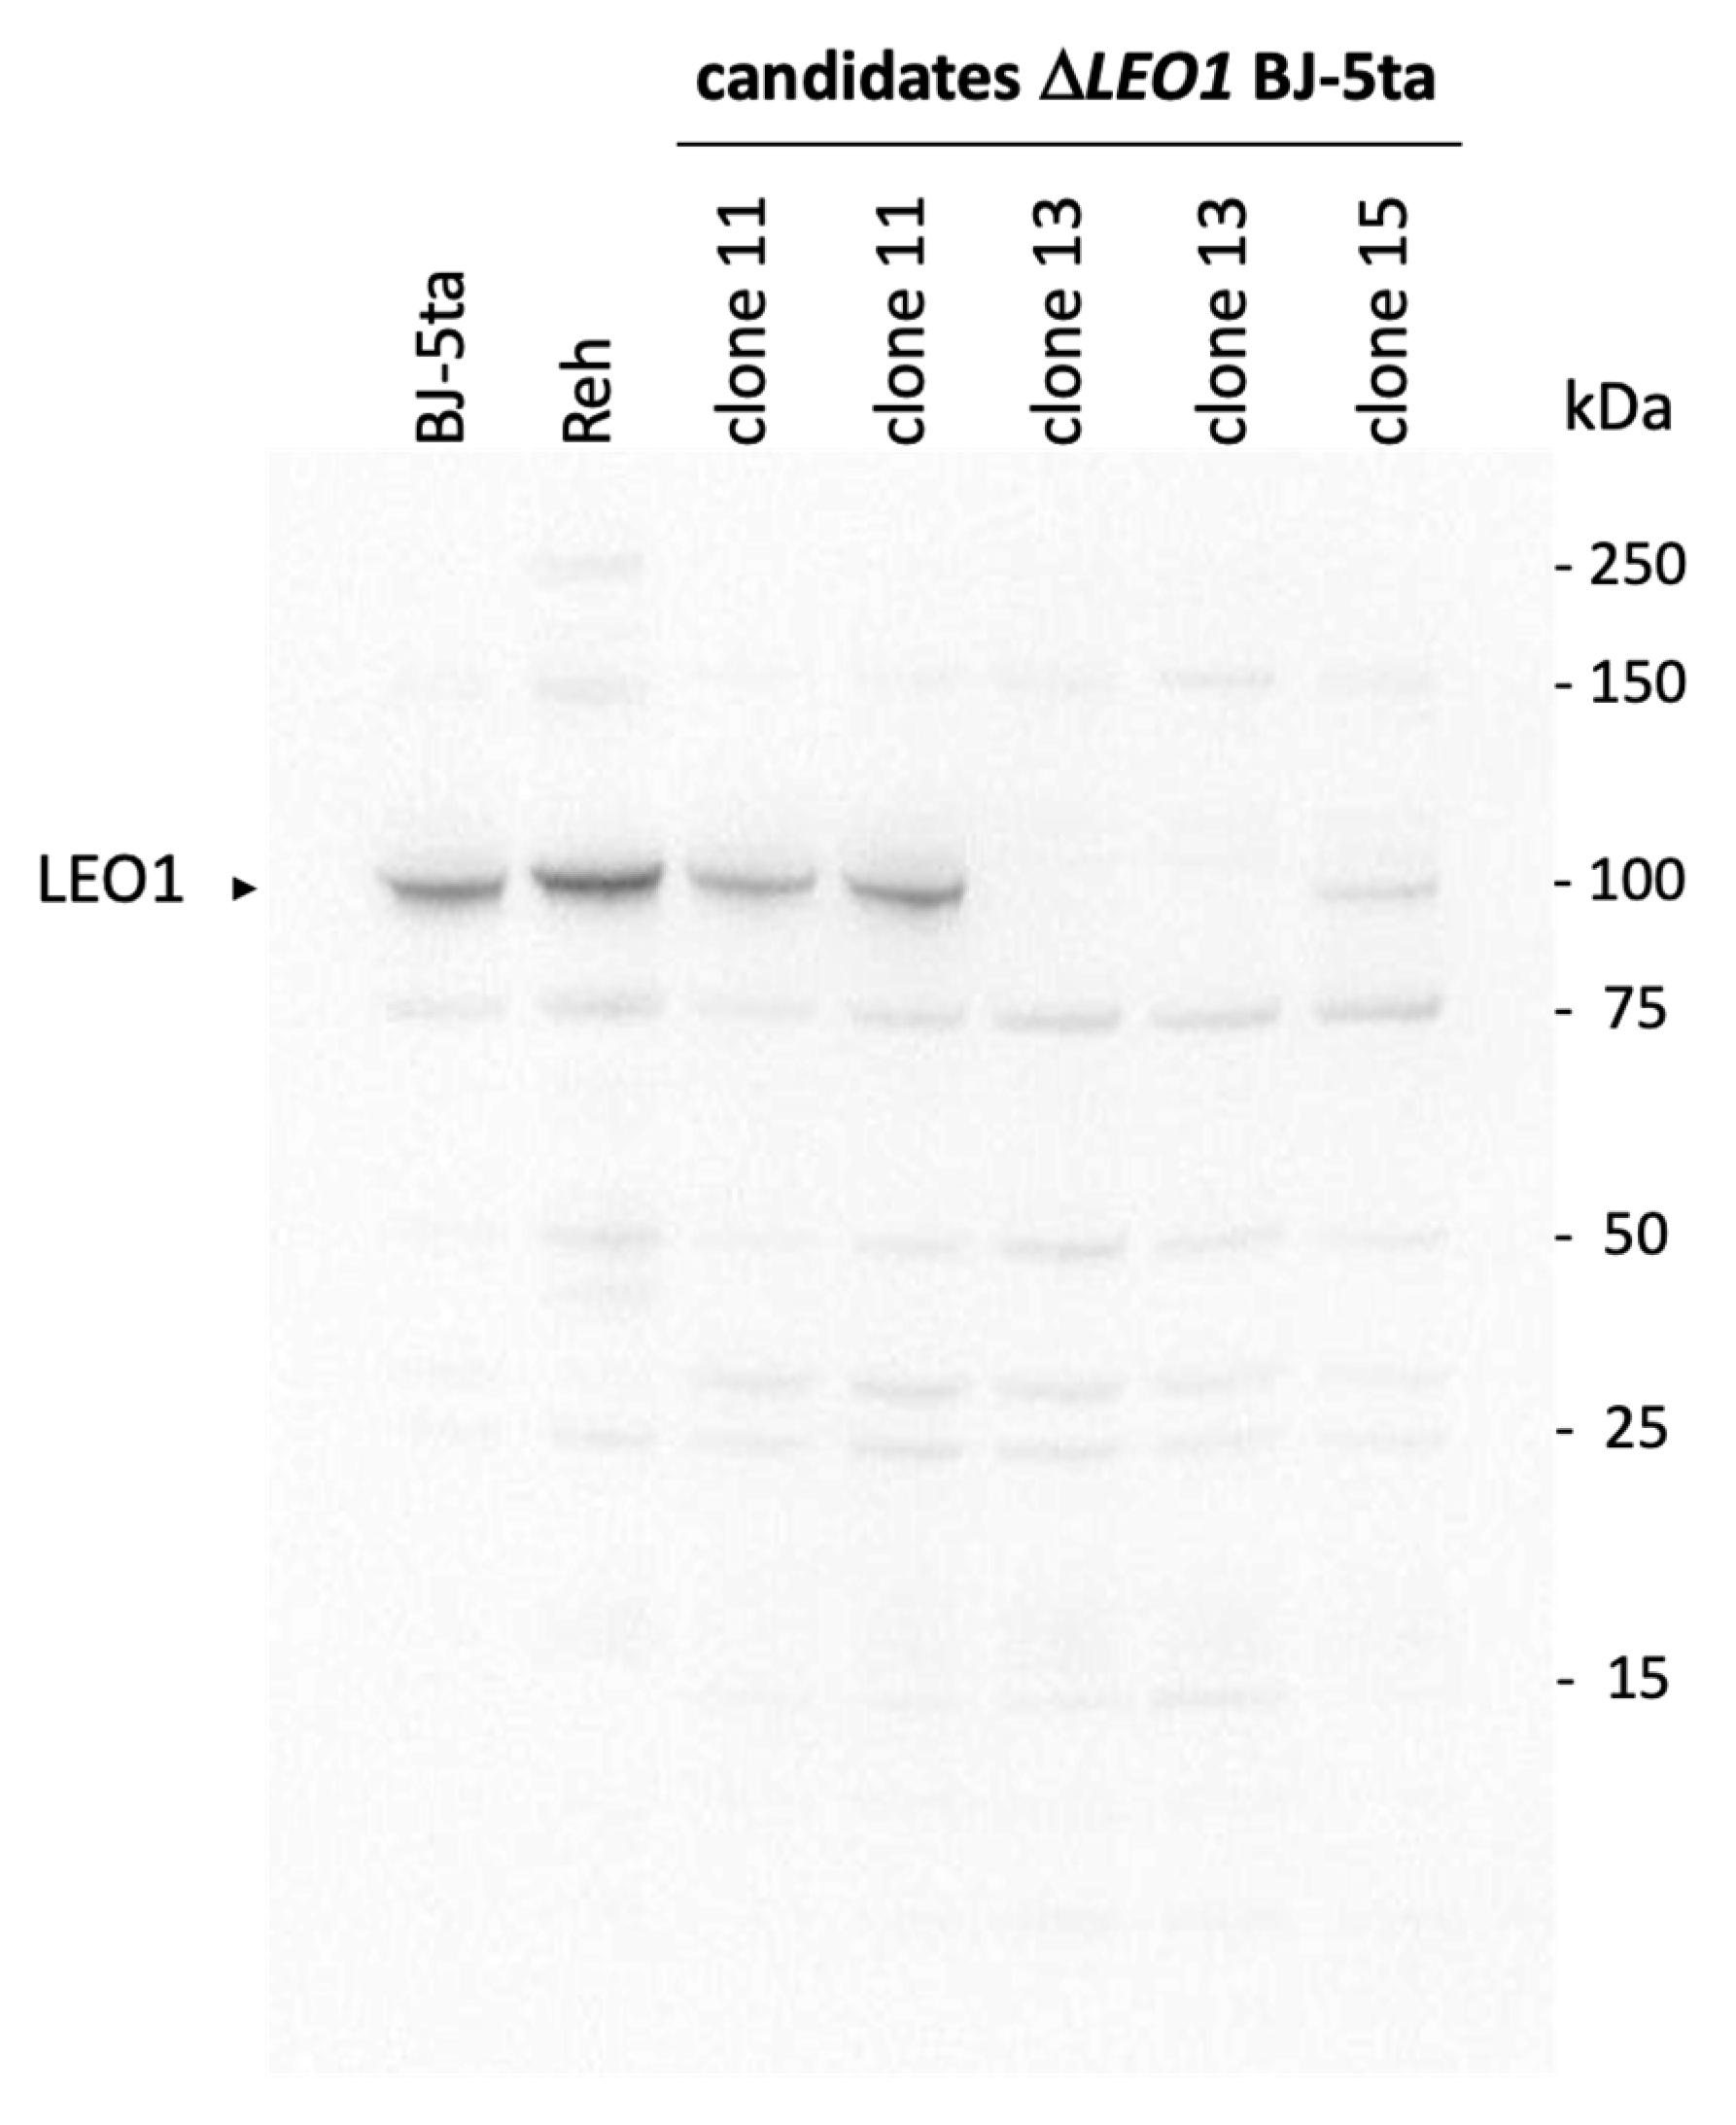
2.4. Knockout of the LEO1 Gene
2.5. ChIP Sequencing
2.6. RNA Sequencing
2.7. Bioinformatics and Statistical Analysis
3. Results
3.1. Knock out of the LEO1 Gene
3.2. A Phenotype for ΔLEO1 Cells in Quiescence
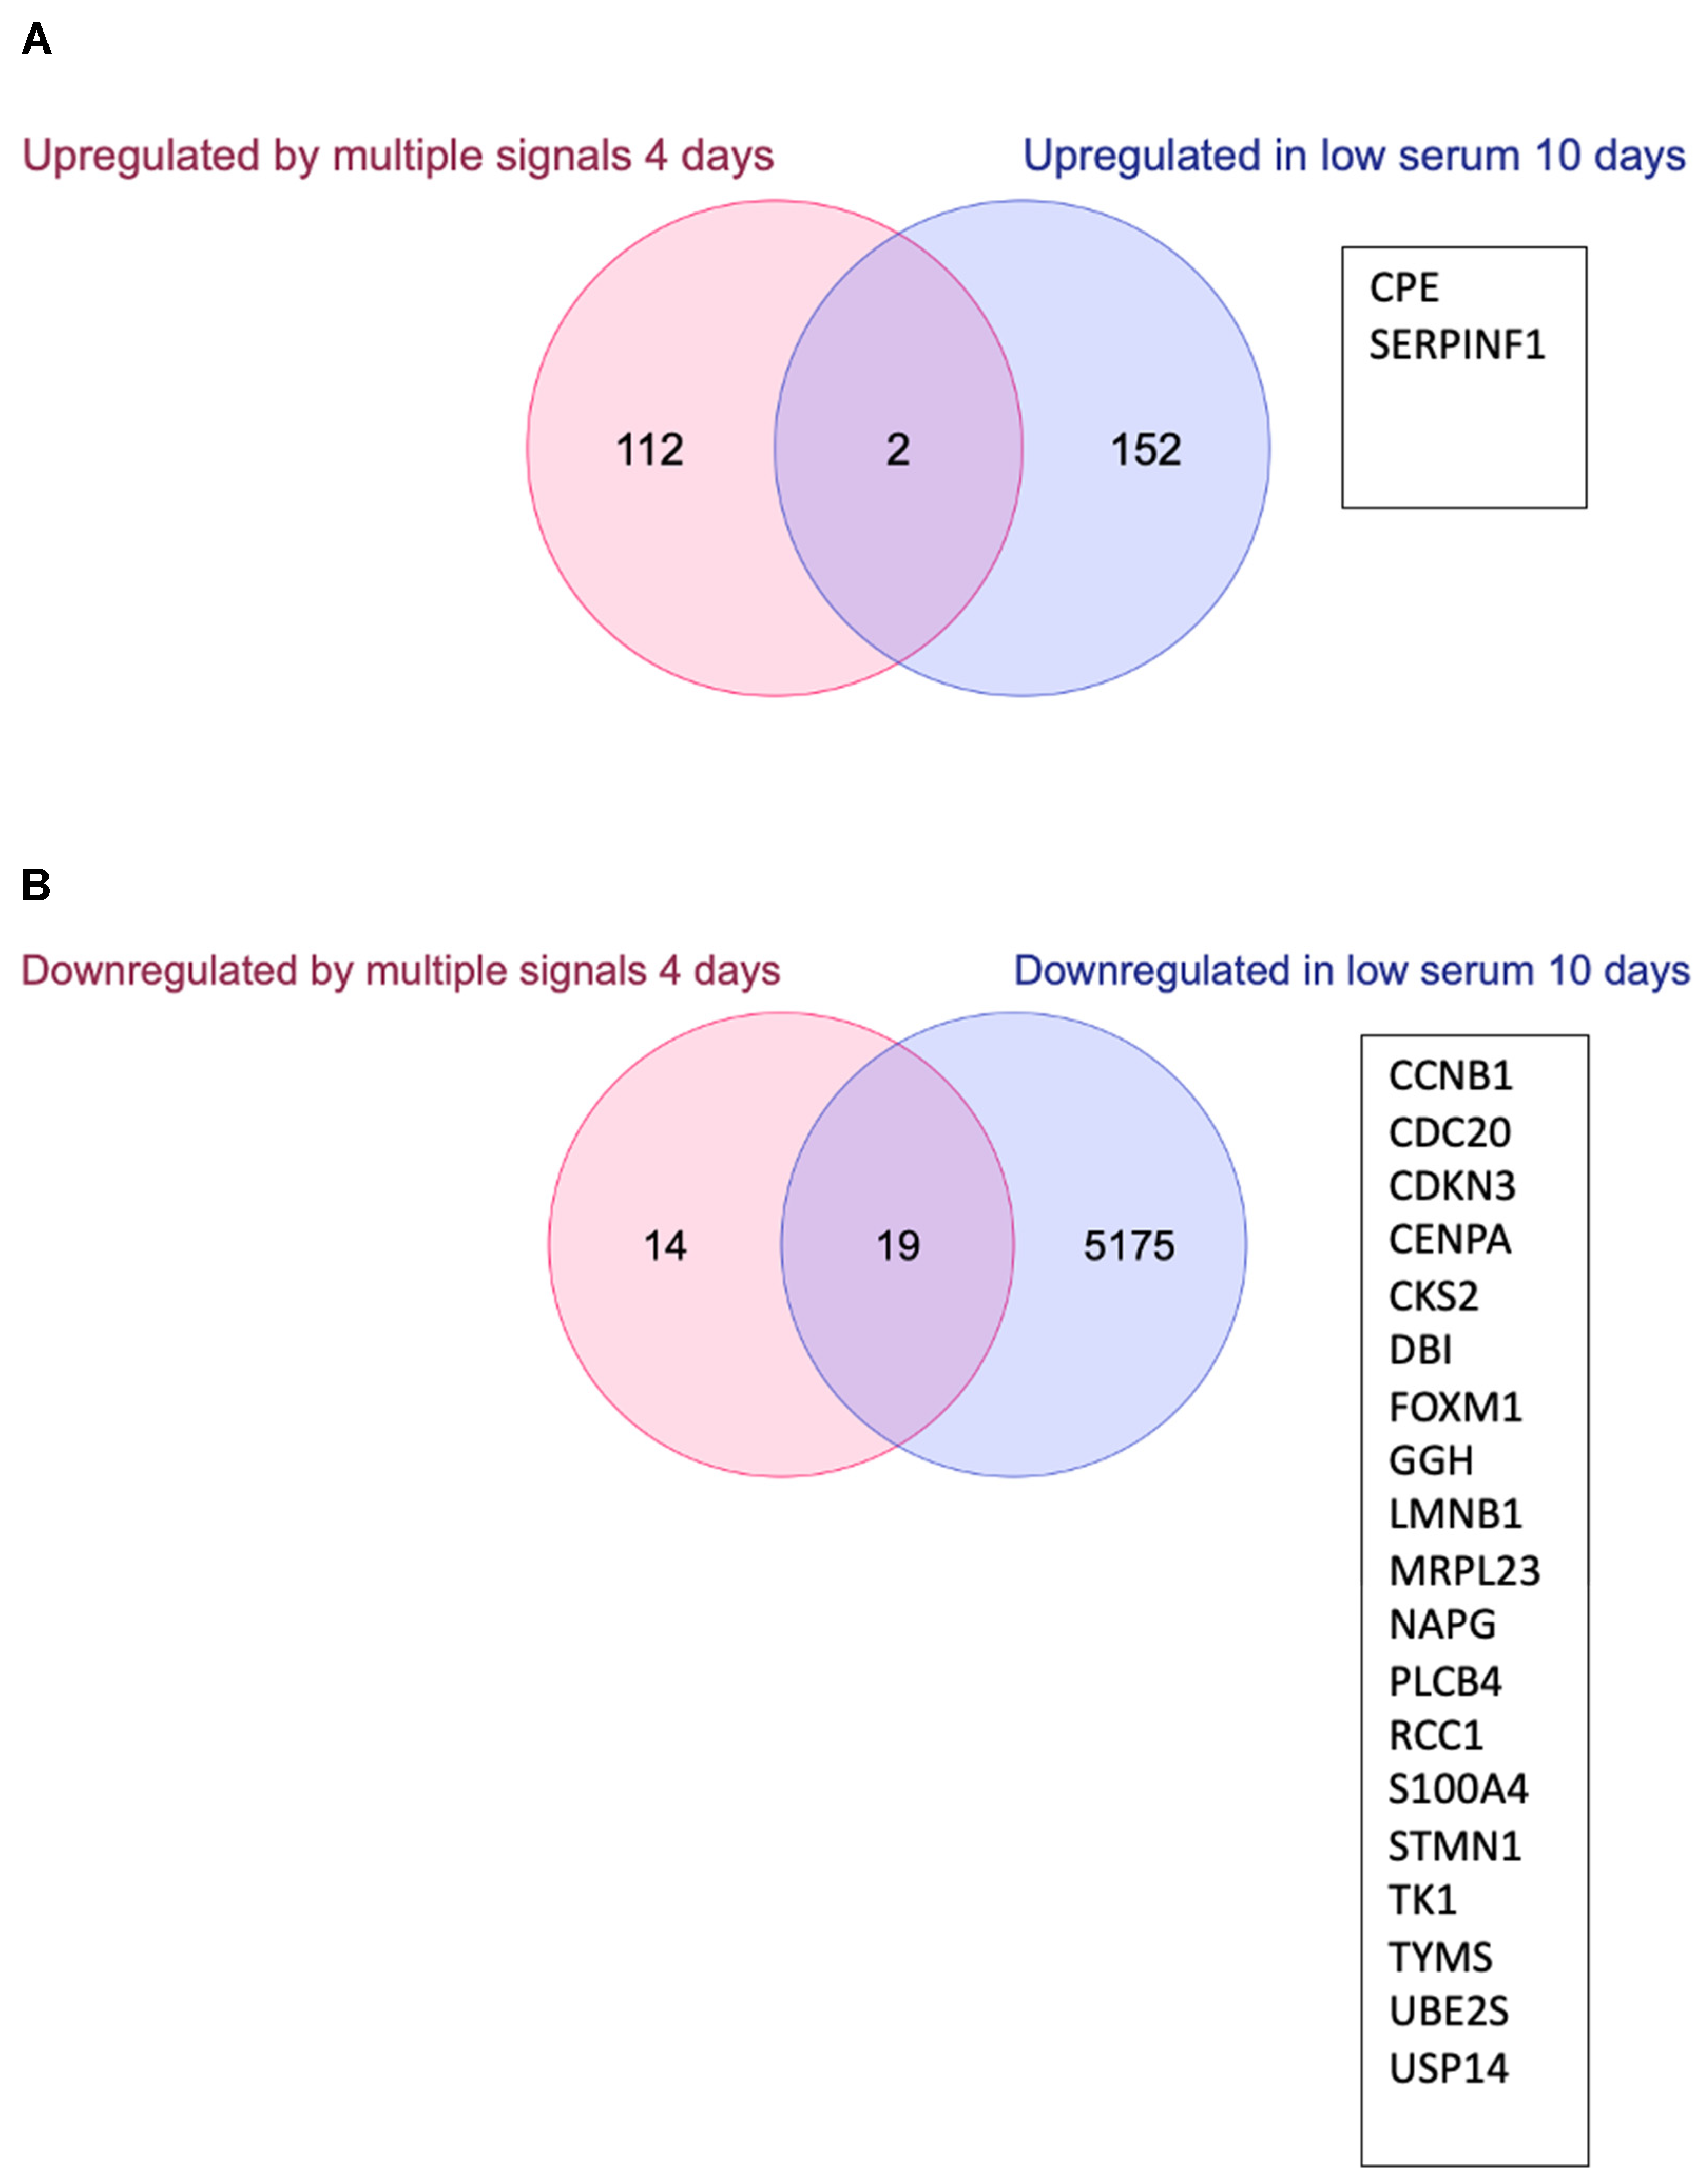
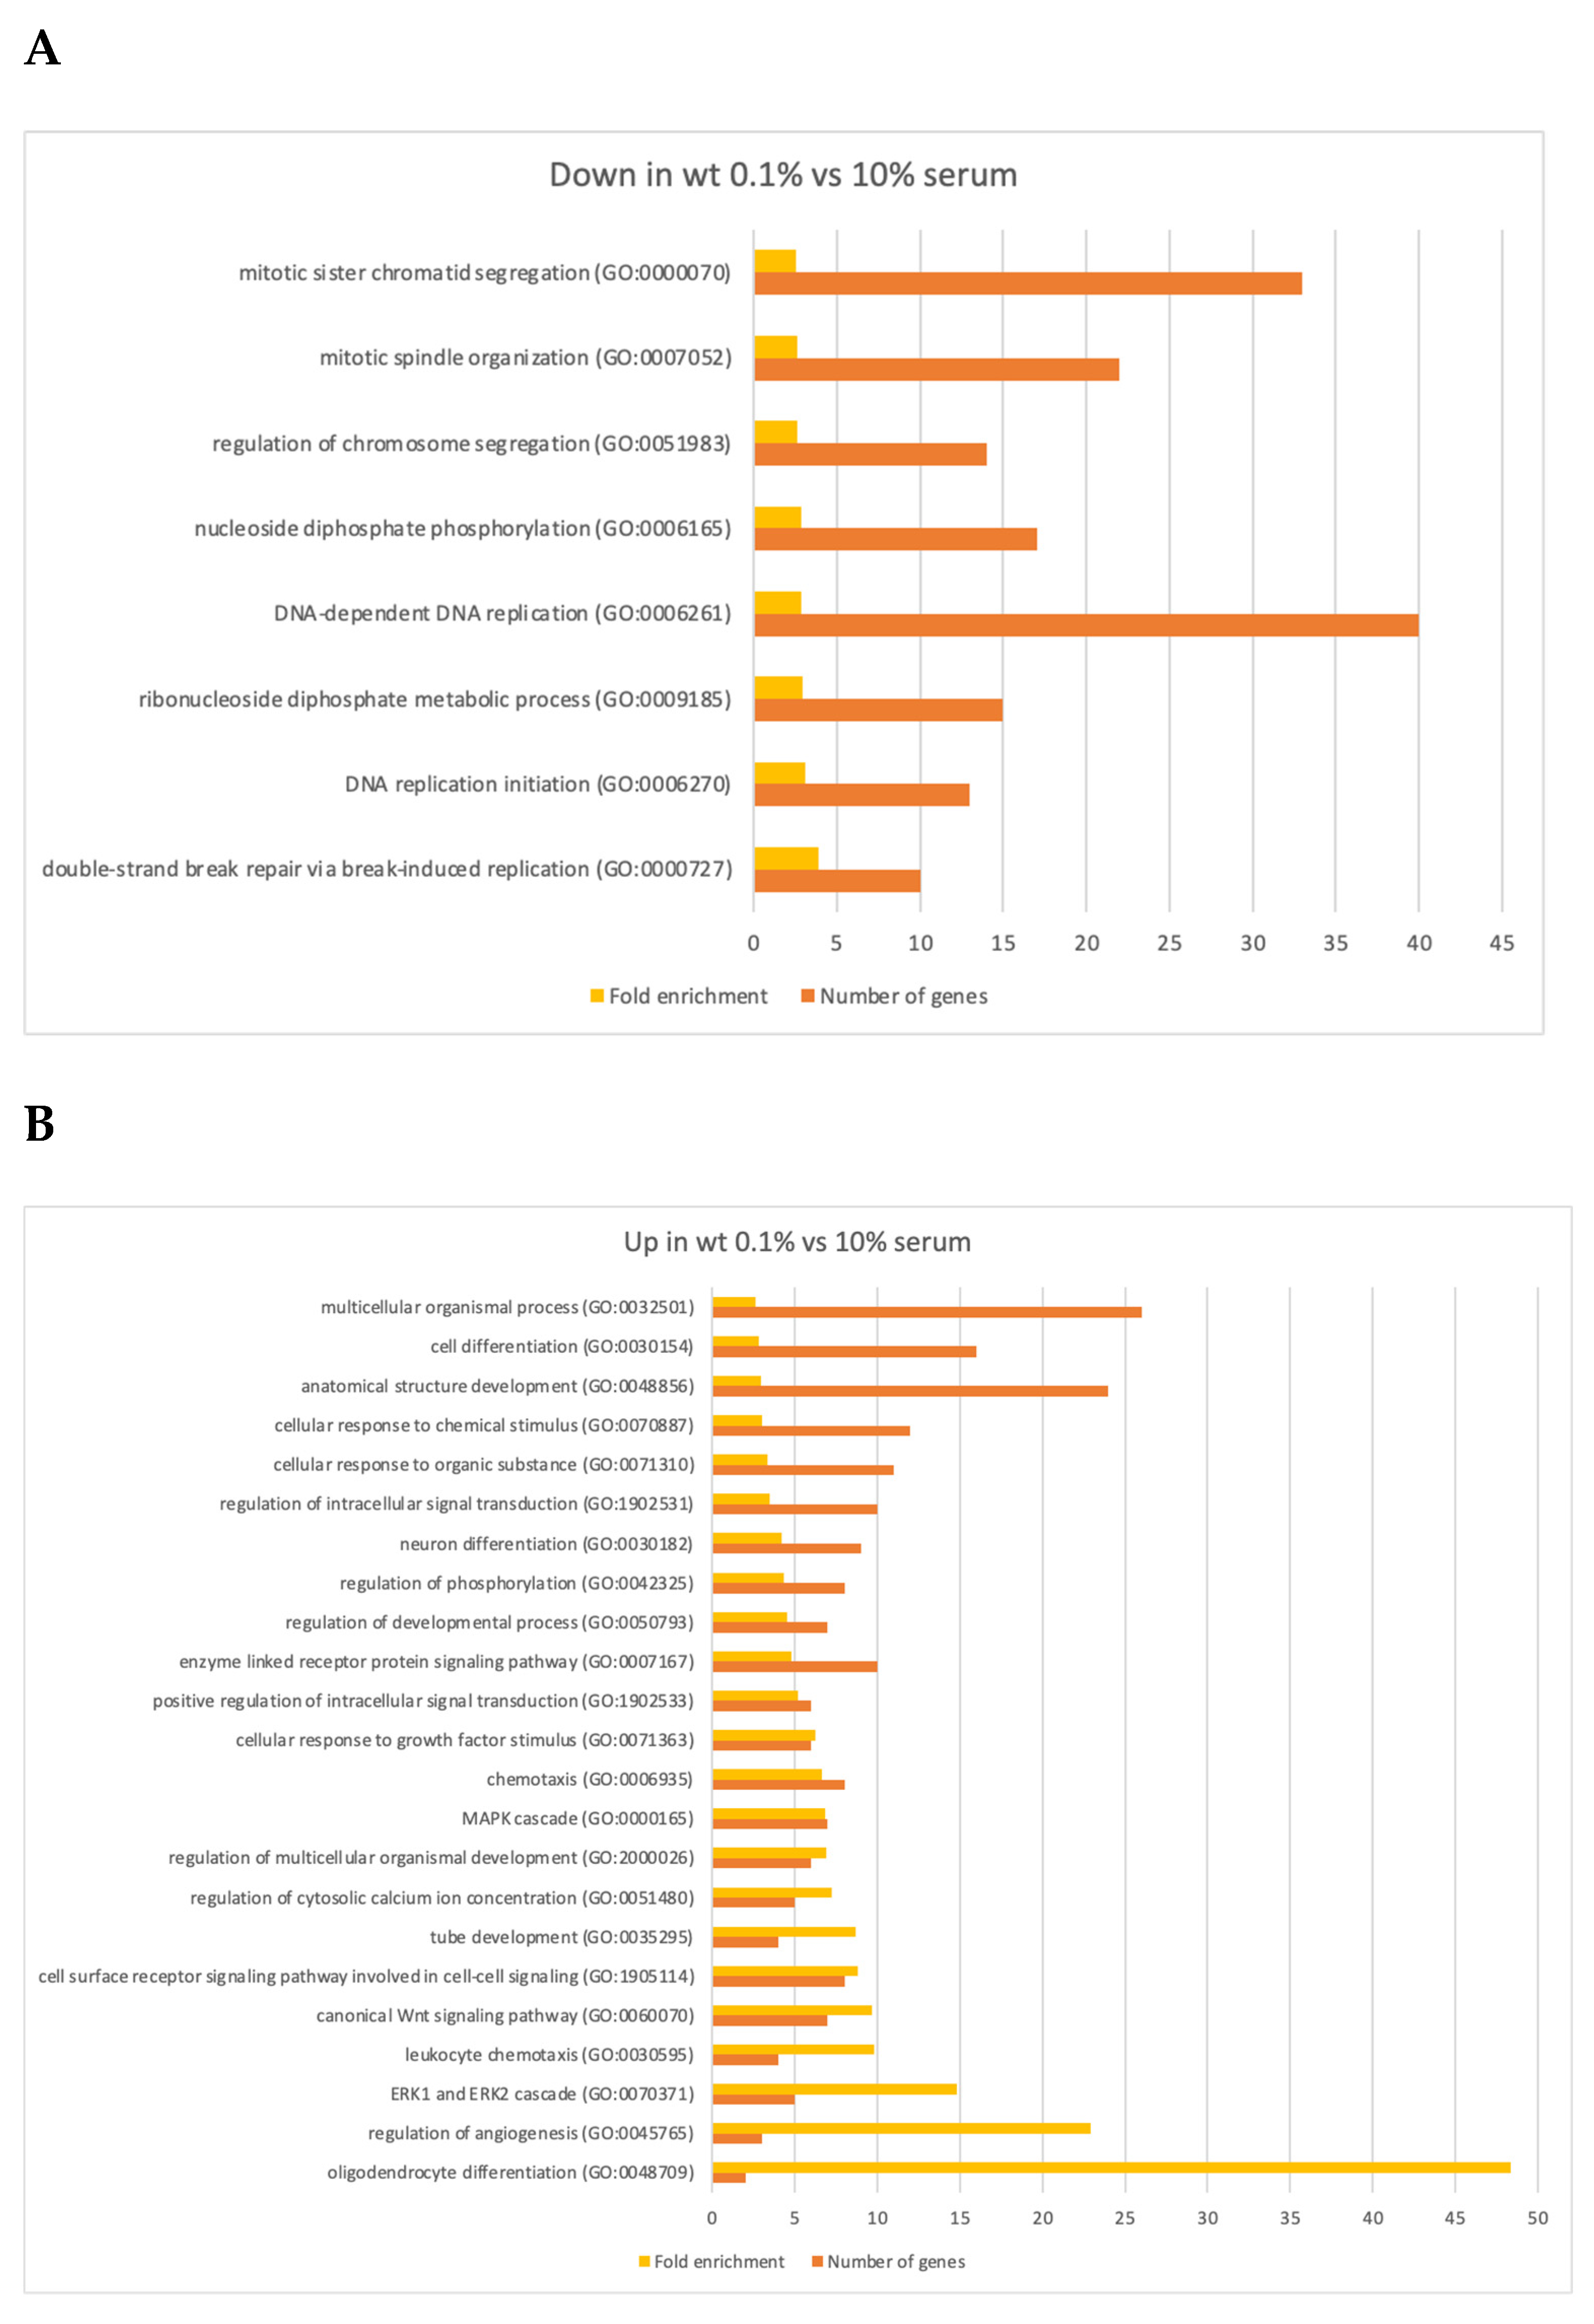
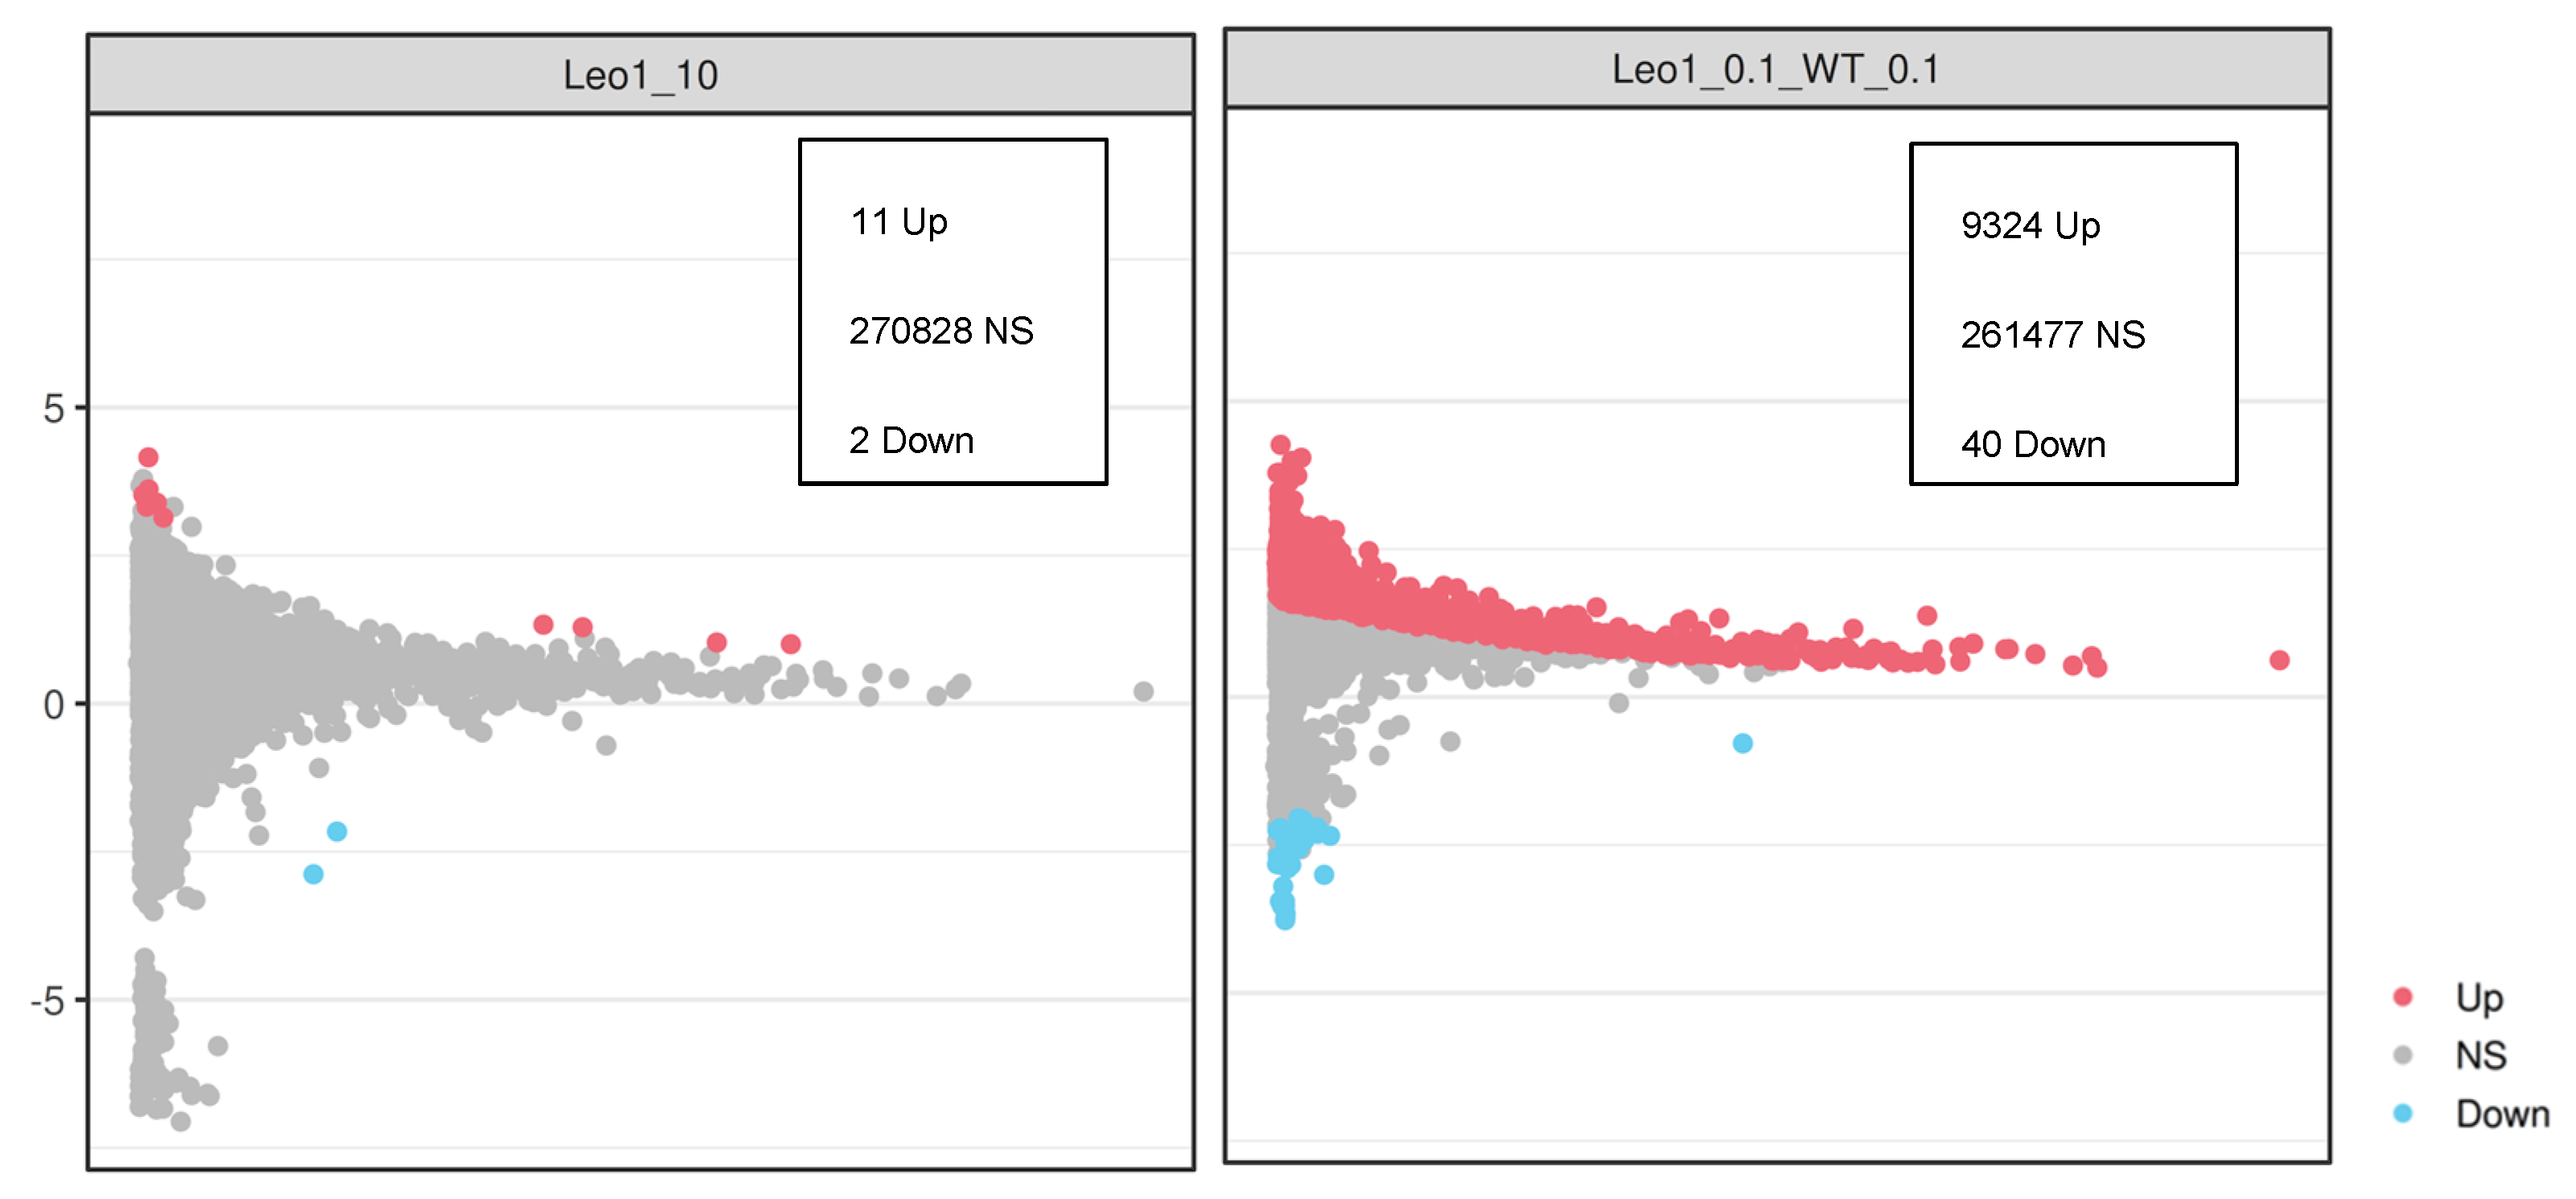
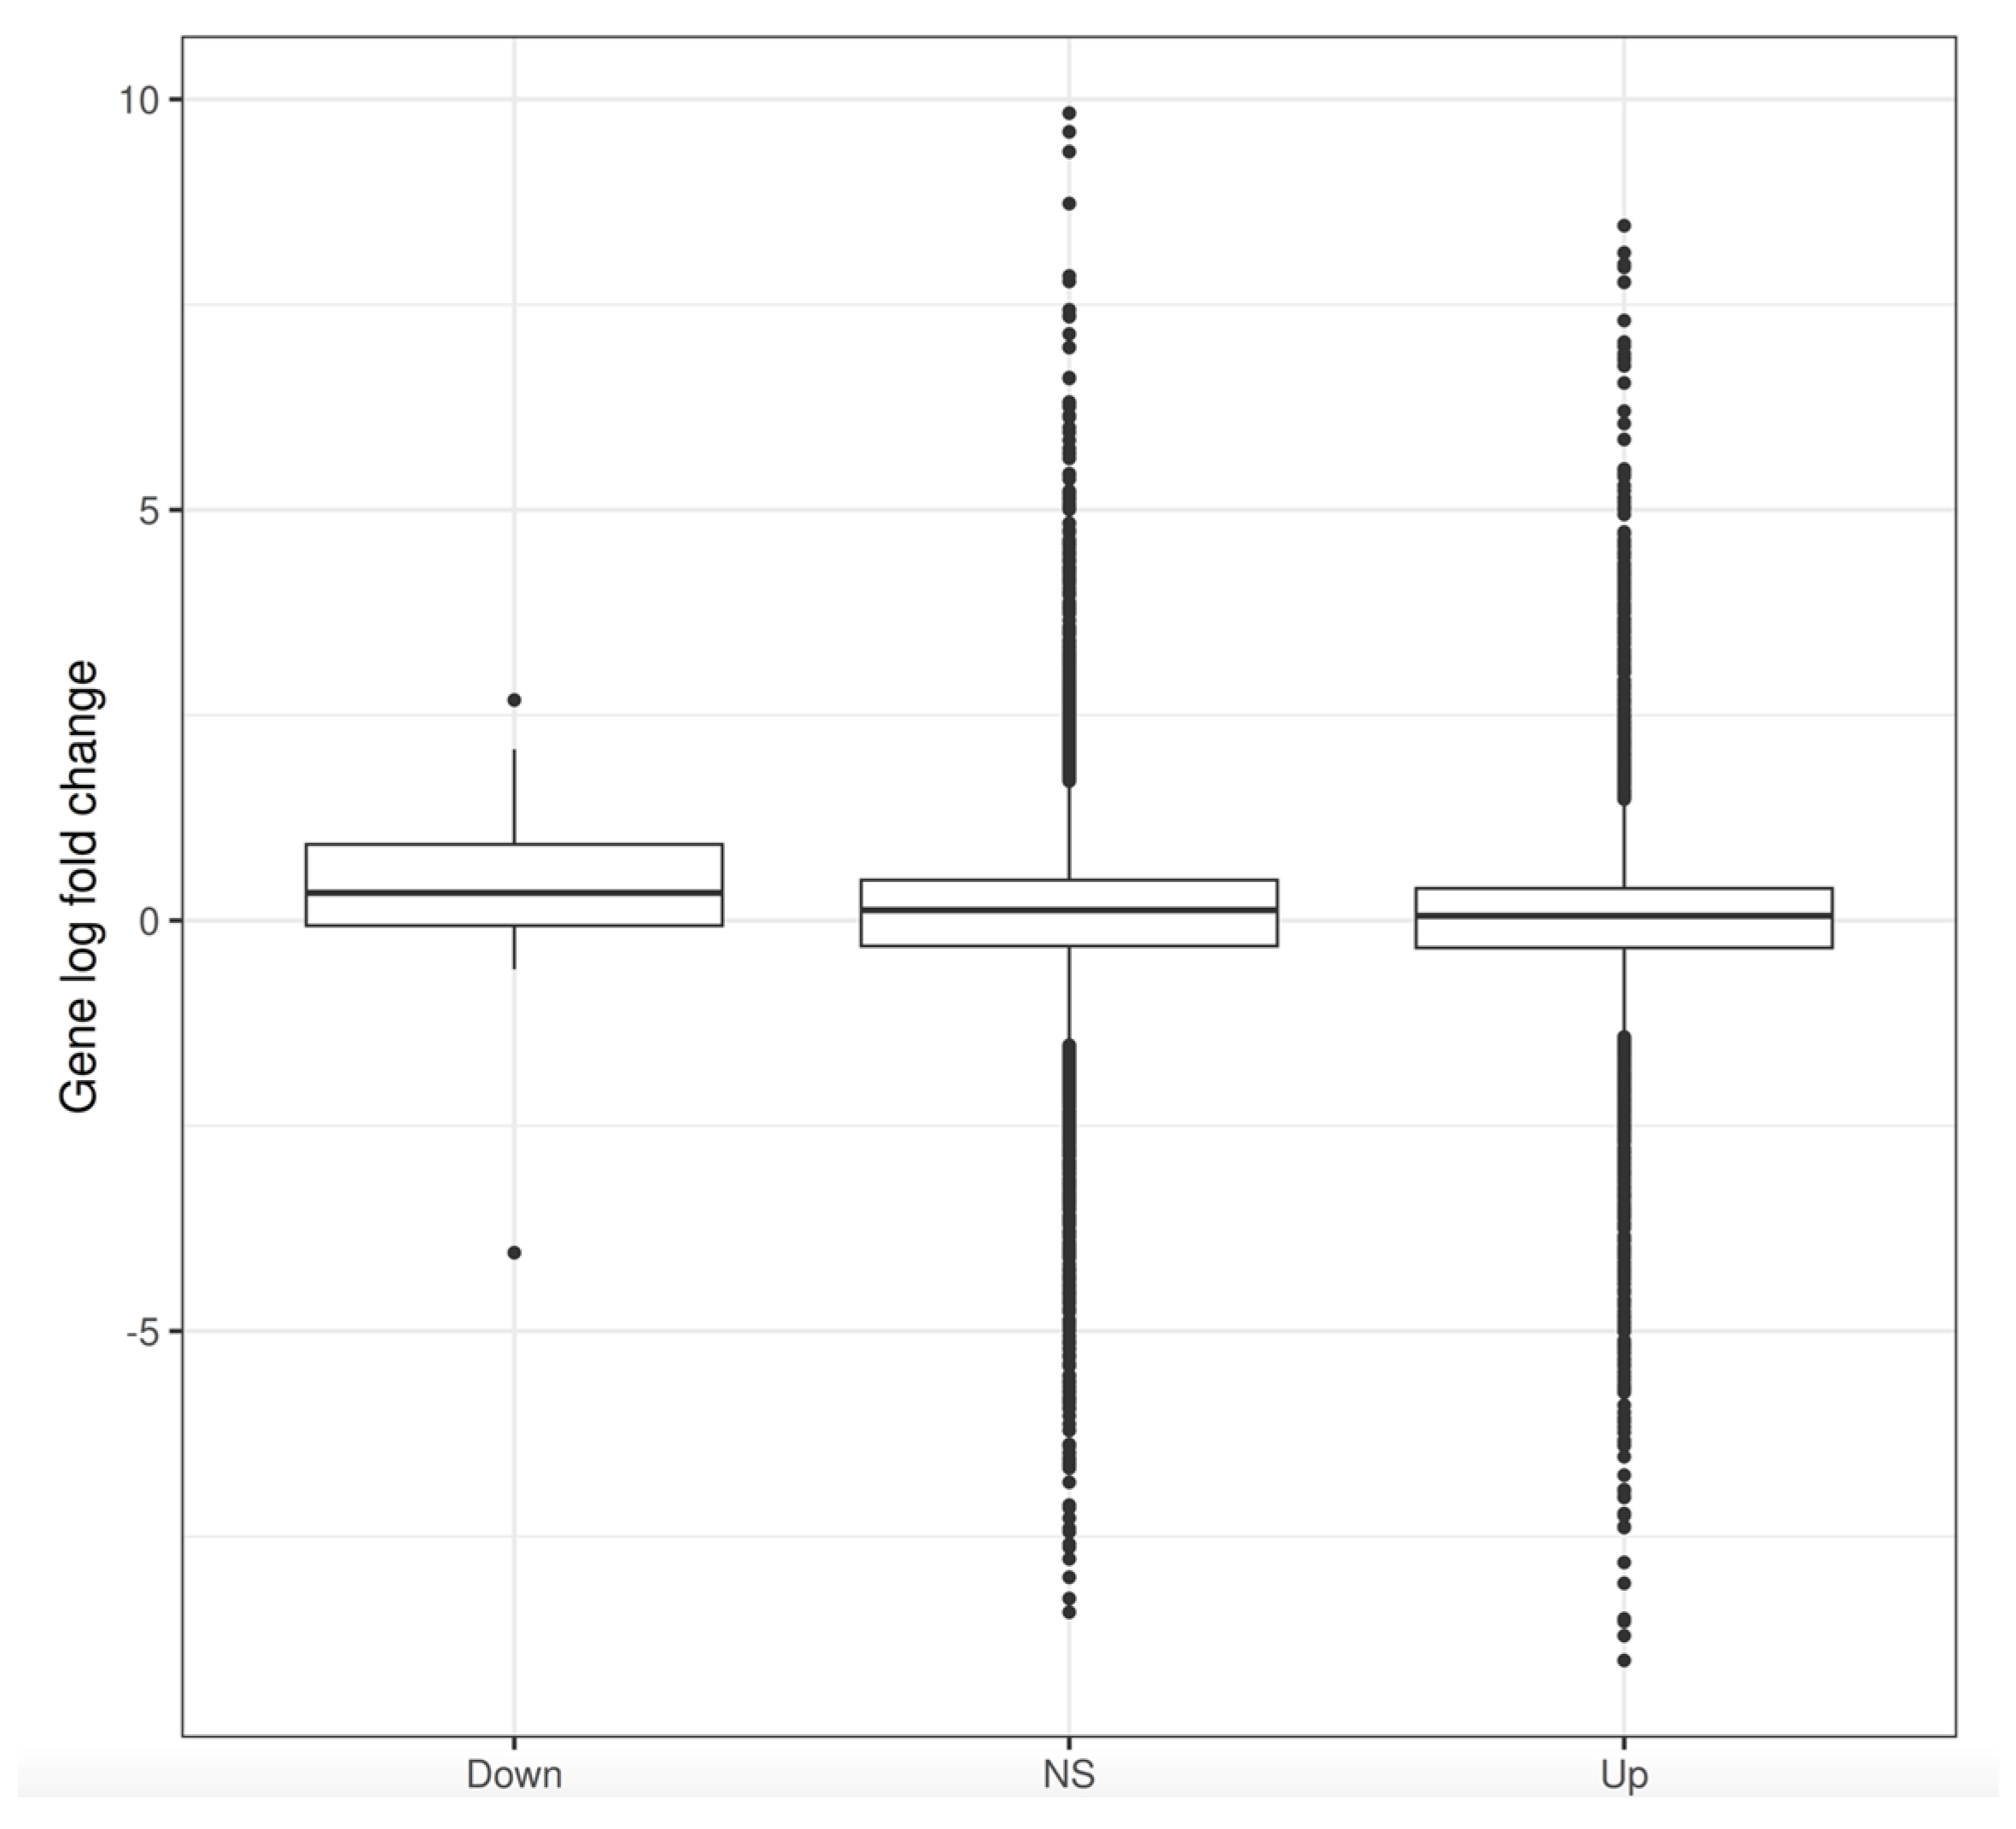
3.3. Changes in Gene Expression
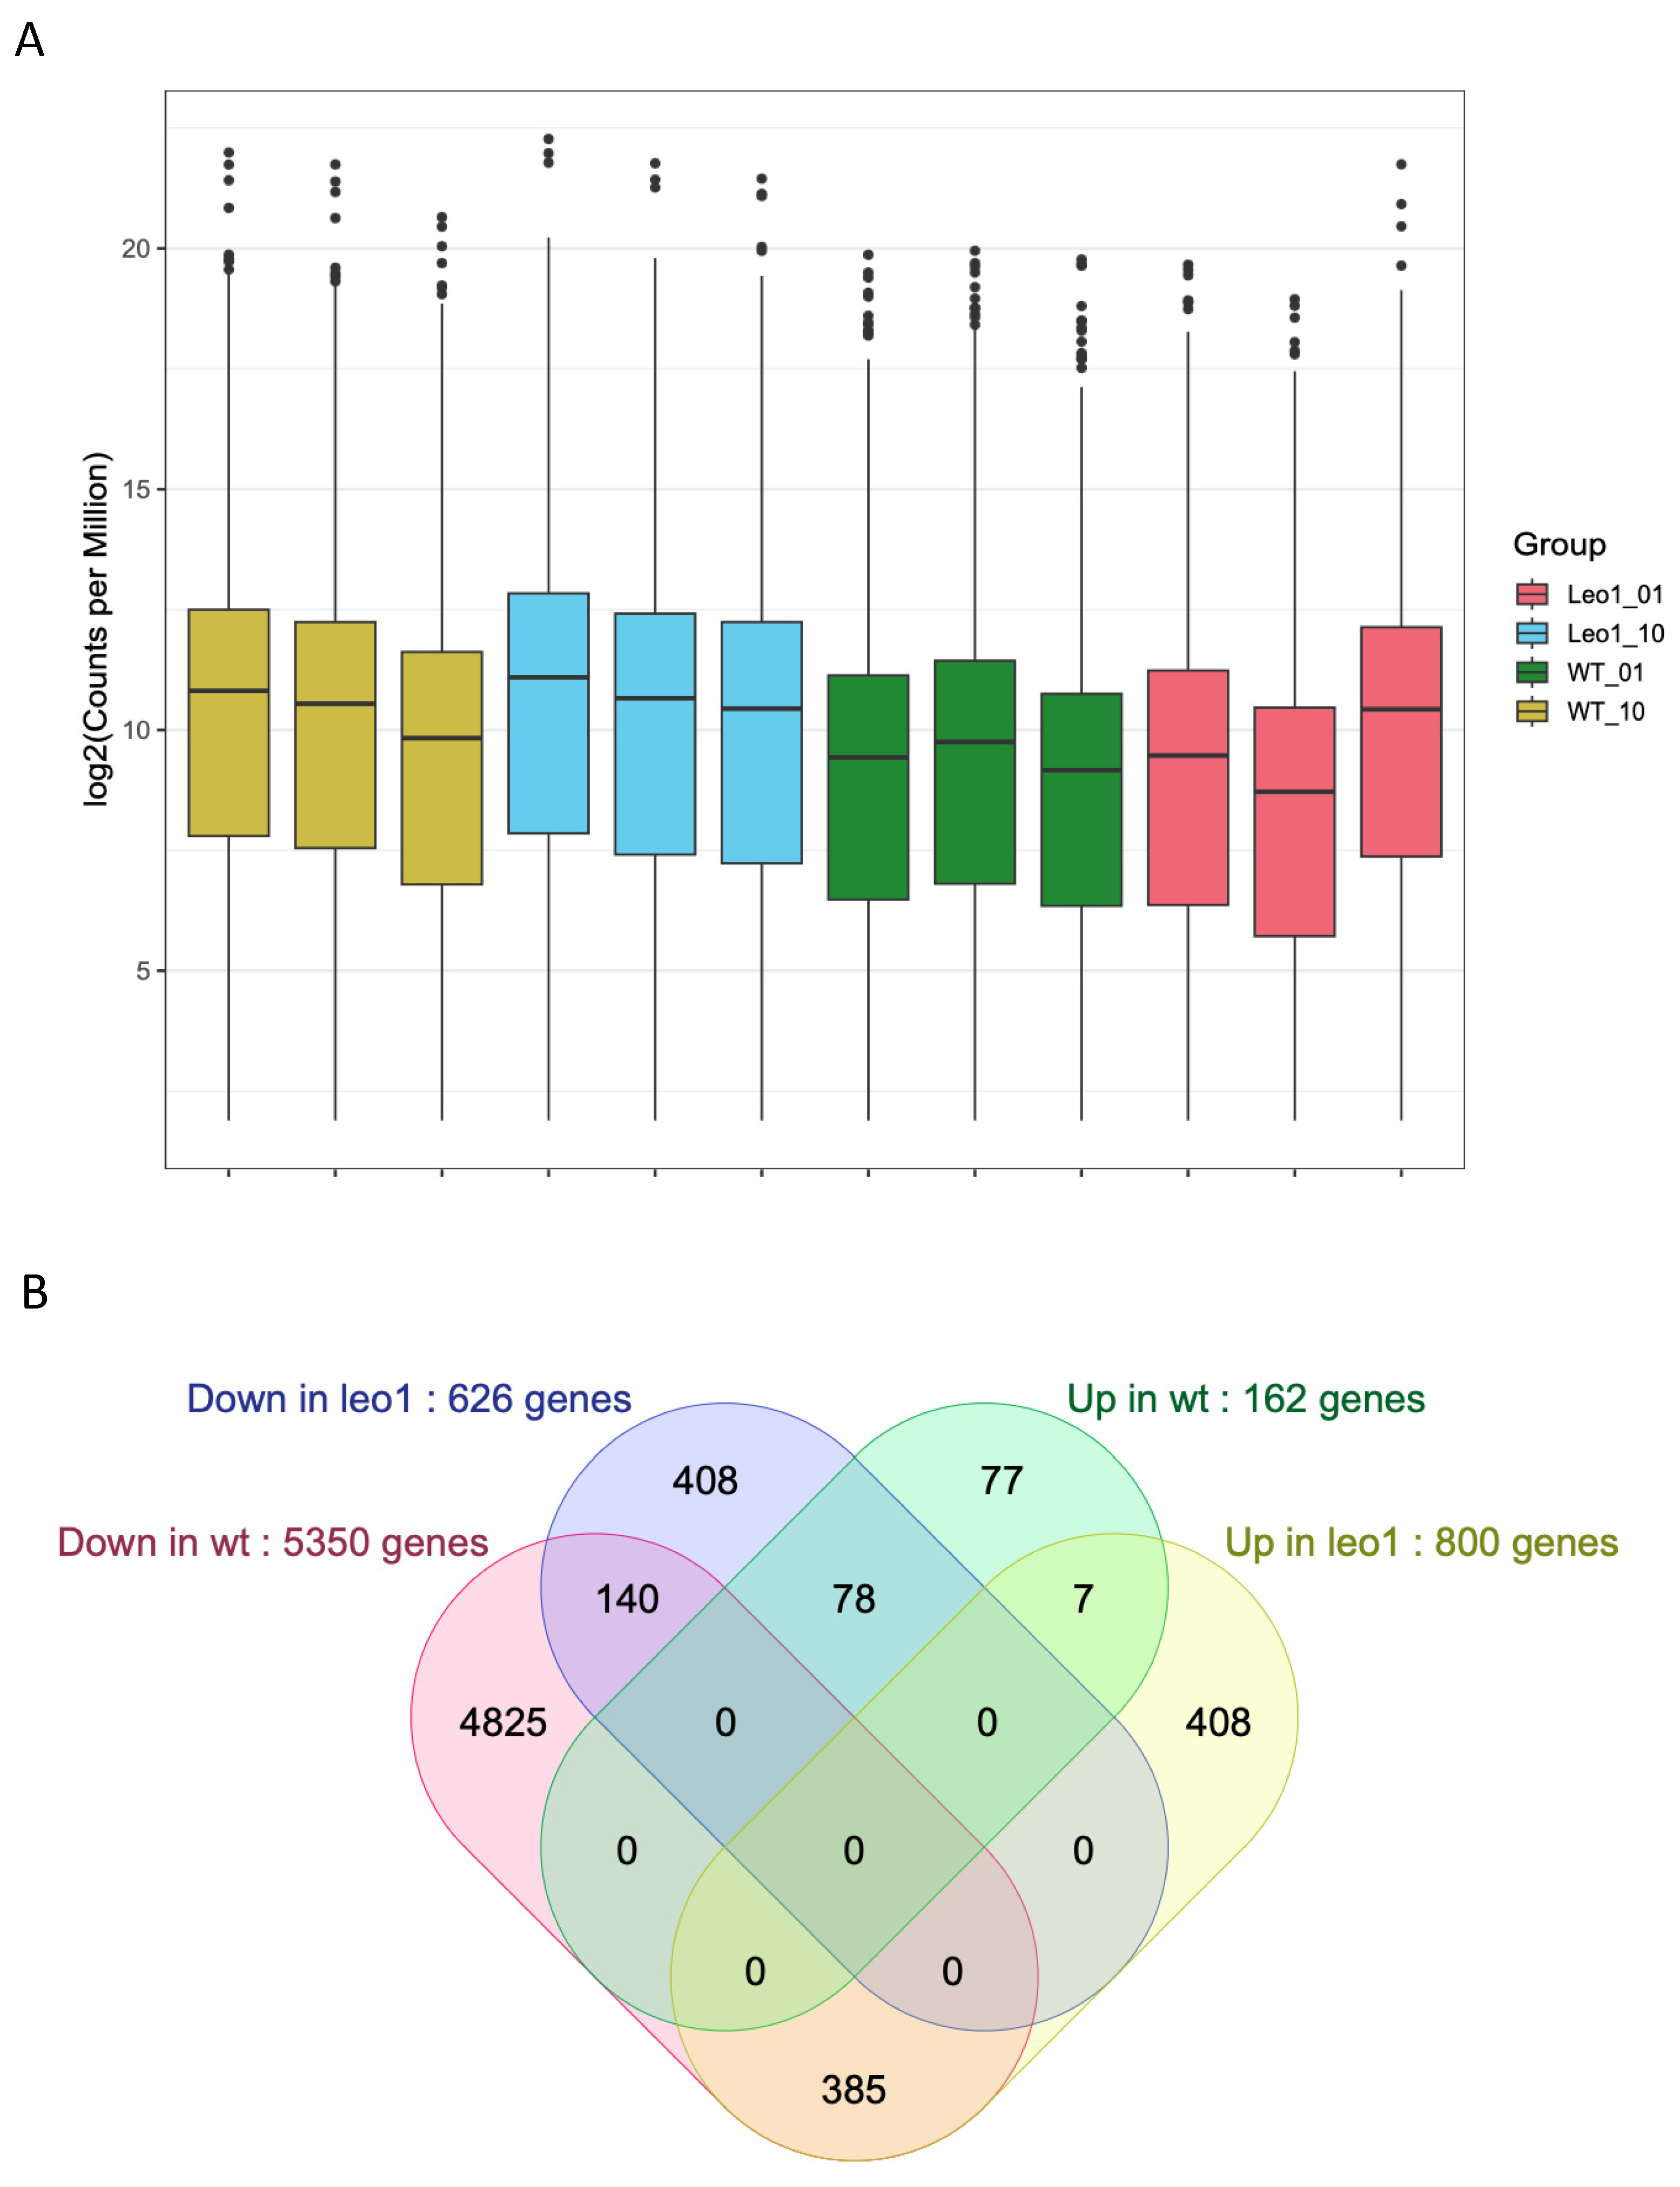
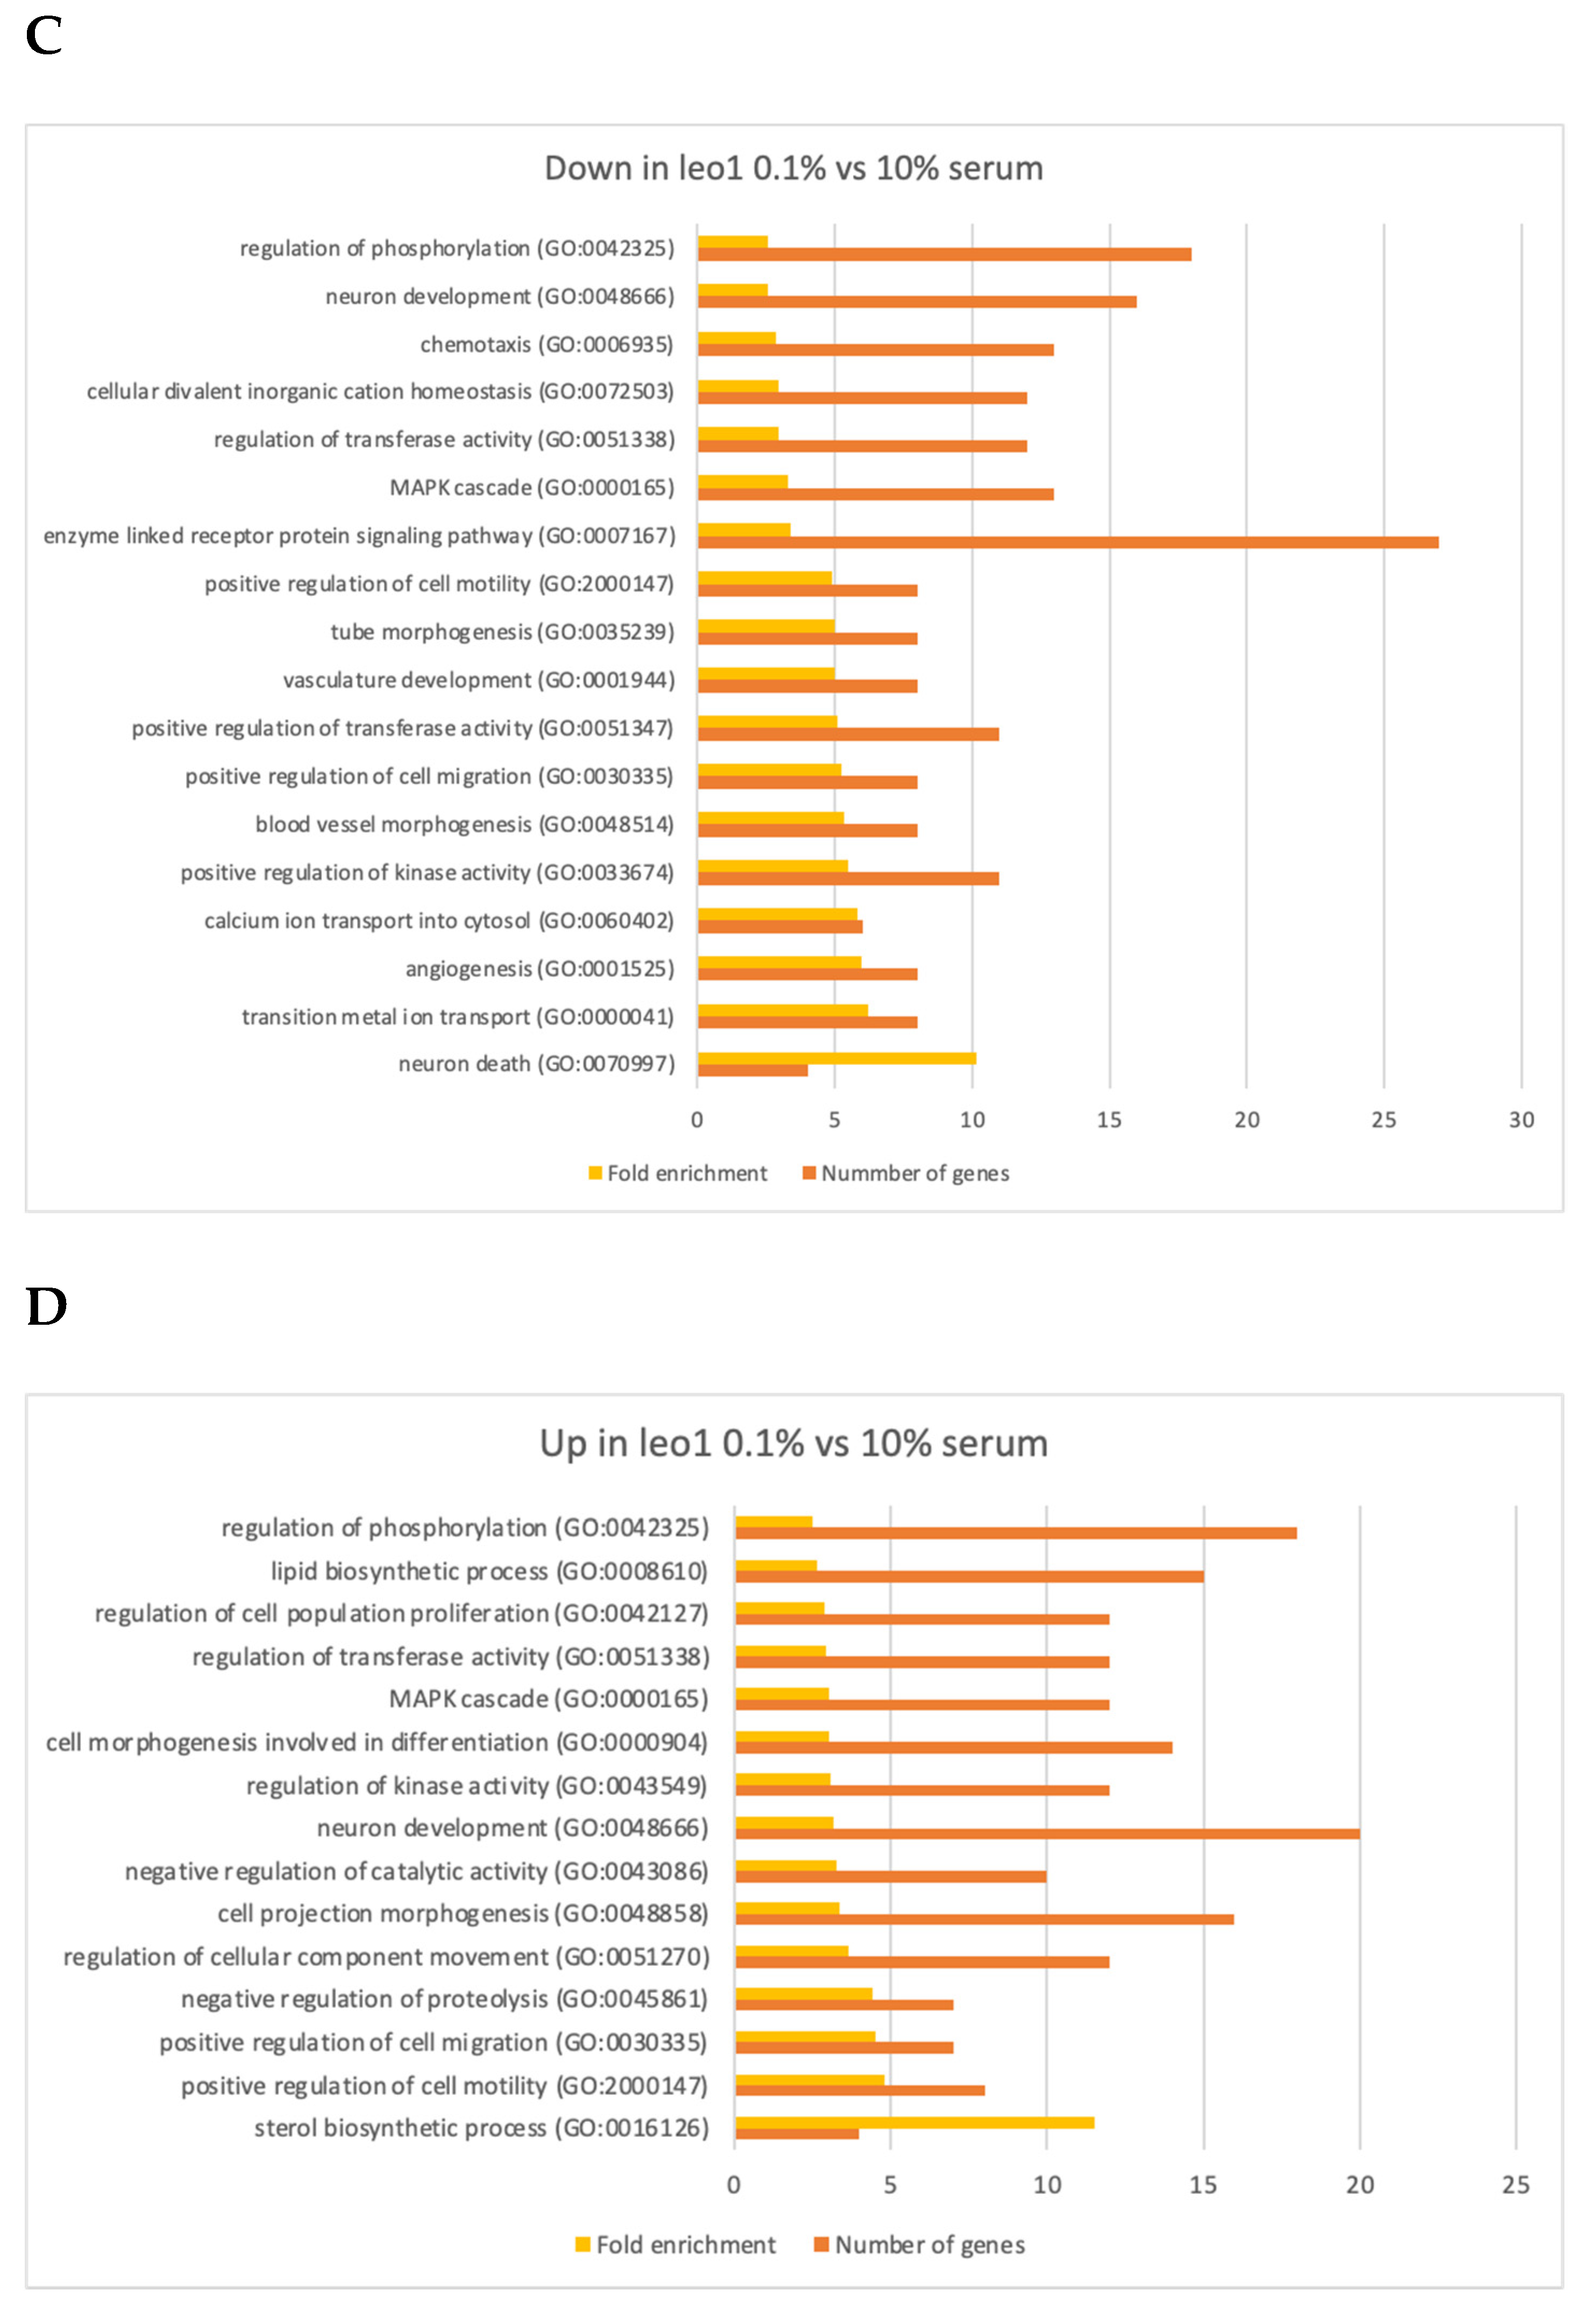
3.4. Changes in Gene Expression in ΔLEO1 Cells
3.5. Epigenome Changes in ΔLEO1 Cells
4. Discussion
4.1. A Role for LEO1 in Quiescent Fibroblasts
4.2. Gene Expression Changes in Quiescent Wild Type and ΔLEO1 Cells
4.3. Histone Modification Change of H3K9me2—Possible Mechanism
4.4. A Conserved Role of LEO1 in Quiescent Eukaryotes?
4.5. Implications
5. Conclusions
Supplementary Materials
Author Contributions
Funding
Institutional Review Board Statement
Informed Consent Statement
Data Availability Statement
Acknowledgments
Conflicts of Interest
Abbreviations
| LEO1 | Left open reading frame 1 |
| ΔLEO1 | gene deletion of LEO1 |
| WT | wild type |
| PAF1C | RNA polymerase II associated factor 1 complex |
| HES1 | Hairy and Enhancer of Split-1 |
| CRISPR | Clustered regularly interspaced short palindromic repeats |
| H3K9 | histone H3 lysine 9 |
| BJ-5ta | hTERT-immortalized fibroblasts cell line |
| FBS | fetal bovine serum |
| ChIP | Chromatin immunoprecipitation |
| FACS | Fluorescence-activated cell sorting |
| ERCC | External RNA Controls Consortium |
| MTT | (3-(4,5-dimethylthiazol-2-yl)-2,5 diphenyl tetrazolium bromide) |
| ERK1/ERK2 | Extracellular signal-regulated kinase 1/2 |
| Wnt | Wingless and Int-1 |
| TSS | Transcription start site |
References
- Marescal, O.; Cheeseman, I.M. Cellular Mechanisms and Regulation of Quiescence. Dev. Cell 2020, 55, 259–271. [Google Scholar] [CrossRef] [PubMed]
- Chen, W.; Dong, J.; Haiech, J.; Kilhoffer, M.-C.; Zeniou, M. Cancer Stem Cell Quiescence and Plasticity as Major Challenges in Cancer Therapy. Stem Cells Int. 2016, 2016, 1740936. [Google Scholar] [CrossRef] [PubMed]
- Sun, S.; Gresham, D. Cellular Quiescence in Budding Yeast. Yeast 2020, 38, 12–29. [Google Scholar] [CrossRef] [PubMed]
- Iyer, V.R.; Eisen, M.B.; Ross, D.T.; Schuler, G.; Moore, T.; Lee, J.C.F.; Trent, J.M.; Staudt, L.M.; Hudson, J.H., Jr.; Boguski, M.S.; et al. The Transcriptional Program in the Response of Human Fibroblasts to Serum. Science 1999, 283, 83–87. [Google Scholar] [CrossRef]
- Coller, H.A.; Sang, L.; Roberts, J.M. A New Description of Cellular Quiescence. PLoS Biol. 2006, 4, e83. [Google Scholar] [CrossRef]
- Johnson, E.L.; Robinson, D.G.; Coller, H.A. Widespread Changes in MRNA Stability Contribute to Quiescence-Specific Gene Expression Patterns in a Fibroblast Model of Quiescence. BMC Genom. 2017, 18, 123. [Google Scholar] [CrossRef]
- Sang, L.; Coller, H.A.; Roberts, J.M. Control of the Reversibility of Cellular Quiescence by the Transcriptional Repressor HES1. Science 2008, 321, 1095–1100. [Google Scholar] [CrossRef] [PubMed]
- Bridger, J.M.; Boyle, S.; Kill, I.R.; Bickmore, W.A. Re-Modelling of Nuclear Architecture in Quiescent and Senescent Human Fibroblasts. Curr. Biol. 2000, 10, 149–152. [Google Scholar] [CrossRef] [PubMed]
- Nagashima, R.; Hibino, K.; Ashwin, S.S.; Babokhov, M.; Fujishiro, S.; Imai, R.; Nozaki, T.; Tamura, S.; Tani, T.; Kimura, H.; et al. Single Nucleosome Imaging Reveals Loose Genome Chromatin Networks via Active RNA Polymerase II. J. Cell Biol. 2019, 218, 1511–1530. [Google Scholar] [CrossRef]
- Kallingappa, P.K.; Turner, P.M.; Eichenlaub, M.P.; Green, A.L.; Oback, F.C.; Chibnall, A.M.; Wells, D.N.; Oback, B. Quiescence Loosens Epigenetic Constraints in Bovine Somatic Cells and Improves Their Reprogramming into Totipotency. Biol. Reprod. 2015, 95, 16. [Google Scholar] [CrossRef]
- Evertts, A.G.; Manning, A.L.; Wang, X.; Dyson, N.J.; Garcia, B.A.; Coller, H.A. H4K20 Methylation Regulates Quiescence and Chromatin Compaction. Mol. Biol. Cell 2013, 24, 3025–3037. [Google Scholar] [CrossRef]
- Jaehning, J.A. The Paf1 Complex: Platform or Player in RNA Polymerase II Transcription? Biochim. Et Biophys. Acta Bba-Gene Regul. Mech. 2010, 1799, 379–388. [Google Scholar] [CrossRef] [PubMed]
- Sadeghi, L.; Prasad, P.; Ekwall, K.; Cohen, A.; Svensson, J.P. The Paf1 Complex Factors Leo1 and Paf1 Promote Local Histone Turnover to Modulate Chromatin States in Fission Yeast. Embo. Rep. 2015, 16, 1673–1687. [Google Scholar] [CrossRef] [PubMed]
- Oya, E.; Durand-Dubief, M.; Cohen, A.; Maksimov, V.; Schurra, C.; Nakayama, J.; Weisman, R.; Arcangioli, B.; Ekwall, K. Leo1 Is Essential for the Dynamic Regulation of Heterochromatin and Gene Expression during Cellular Quiescence. Epigenet. Chromatin 2019, 12, 45. [Google Scholar] [CrossRef]
- Zahedi, Y.; Durand-Dubief, M.; Ekwall, K. High-Throughput Flow Cytometry Combined with Genetic Analysis Brings New Insights into the Understanding of Chromatin Regulation of Cellular Quiescence. Int. J. Mol. Sci. 2020, 21, 9022. [Google Scholar] [CrossRef]
- Dobin, A.; Davis, C.A.; Schlesinger, F.; Drenkow, J.; Zaleski, C.; Jha, S.; Batut, P.; Chaisson, M.; Gingeras, T.R. STAR: Ultrafast Universal RNA-Seq Aligner. Bioinformatics 2013, 29, 15–21. [Google Scholar] [CrossRef] [PubMed]
- Liao, Y.; Smyth, G.K.; Shi, W. FeatureCounts: An Efficient General Purpose Program for Assigning Sequence Reads to Genomic Features. Bioinformatics 2014, 30, 923–930. [Google Scholar] [CrossRef]
- Robinson, M.D.; McCarthy, D.J.; Smyth, G.K. EdgeR: A Bioconductor Package for Differential Expression Analysis of Digital Gene Expression Data. Bioinformatics 2010, 26, 139–140. [Google Scholar] [CrossRef]
- Muralikrishna, B.; Dhawan, J.; Rangaraj, N.; Parnaik, V.K. Distinct Changes in Intranuclear Lamin A/C Organization during Myoblast Differentiation. J. Cell Sci. 2001, 114, 4001–4011. [Google Scholar] [CrossRef]
- Almouzni, G.; Cedar, H. Maintenance of Epigenetic Information. Cold Spring Harb. Perspect. Biol. 2016, 8, a019372. [Google Scholar] [CrossRef]
- Farnung, L.; Ochmann, M.; Garg, G.; Vos, S.M.; Cramer, P. Structure of a Backtracked Hexasomal Intermediate of Nucleosome Transcription. Mol. Cell 2022, 82, 3126–3134.e7. [Google Scholar] [CrossRef]
- Cheng, F.; Lu, W.; Liu, C.; Fang, J.; Hou, Y.; Handy, D.E.; Wang, R.; Zhao, Y.; Yang, Y.; Huang, J.; et al. A Genome-Wide Positioning Systems Network Algorithm for in Silico Drug Repurposing. Nat. Commun. 2019, 10, 3476. [Google Scholar] [CrossRef]


Disclaimer/Publisher’s Note: The statements, opinions and data contained in all publications are solely those of the individual author(s) and contributor(s) and not of MDPI and/or the editor(s). MDPI and/or the editor(s) disclaim responsibility for any injury to people or property resulting from any ideas, methods, instructions or products referred to in the content. |
© 2023 by the authors. Licensee MDPI, Basel, Switzerland. This article is an open access article distributed under the terms and conditions of the Creative Commons Attribution (CC BY) license (https://creativecommons.org/licenses/by/4.0/).
Share and Cite
Laurent, M.; Cordeddu, L.; Zahedi, Y.; Ekwall, K. LEO1 Is Required for Efficient Entry into Quiescence, Control of H3K9 Methylation and Gene Expression in Human Fibroblasts. Biomolecules 2023, 13, 1662. https://doi.org/10.3390/biom13111662
Laurent M, Cordeddu L, Zahedi Y, Ekwall K. LEO1 Is Required for Efficient Entry into Quiescence, Control of H3K9 Methylation and Gene Expression in Human Fibroblasts. Biomolecules. 2023; 13(11):1662. https://doi.org/10.3390/biom13111662
Chicago/Turabian StyleLaurent, Marc, Lina Cordeddu, Yasaman Zahedi, and Karl Ekwall. 2023. "LEO1 Is Required for Efficient Entry into Quiescence, Control of H3K9 Methylation and Gene Expression in Human Fibroblasts" Biomolecules 13, no. 11: 1662. https://doi.org/10.3390/biom13111662
APA StyleLaurent, M., Cordeddu, L., Zahedi, Y., & Ekwall, K. (2023). LEO1 Is Required for Efficient Entry into Quiescence, Control of H3K9 Methylation and Gene Expression in Human Fibroblasts. Biomolecules, 13(11), 1662. https://doi.org/10.3390/biom13111662