Review

Distinguishing Between Embryonic Provisioning Strategies in Teleost Fishes Using a Threshold Value for Parentotrophy

by
Zoe M. G. Skalkos
1,
James U. Van Dyke
2,† and
Camilla M. Whittington
1,*,†
1
School of Life and Environmental Sciences, The University of Sydney, Heydon-Laurence Building (A08), Sydney, NSW 2006, Australia
2
School of Agriculture, Biomedicine and Environment, La Trobe University, Wodonga, VIC 3690, Australia
*
Author to whom correspondence should be addressed.
These authors jointly supervised this work.
Biomolecules 2023, 13(1), 166; https://doi.org/10.3390/biom13010166
Submission received: 2 November 2022 / Revised: 20 December 2022 / Accepted: 24 December 2022 / Published: 13 January 2023
(This article belongs to the Special Issue Biomolecules in Parental–Embryo Communication and Implantation)

Abstract

:
The source of embryonic nutrition for development varies across teleost fishes. A parentotrophy index (ratio of neonate: ovulated egg dry mass) is often used to determine provisioning strategy, but the methodologies used vary across studies. The variation in source and preservation of tissue, staging of embryos, and estimation approach impedes our ability to discern between methodological and biological differences in parentotrophy indices inter- and intra-specifically. The threshold value used to distinguish between lecithotrophy and parentotrophy (0.6–1) differs considerably across studies. The lack of a standardised approach in definition and application of parentotrophy indices has contributed to inconsistent classifications of provisioning strategy. Consistency in both methodology used to obtain a parentotrophy index, and in the classification of provisioning strategy using a threshold value are essential to reliably distinguish between provisioning strategies in teleosts. We discuss alternative methods for determining parentotrophy and suggest consistent standards for obtaining and interpreting parentotrophy indices.

1. Introduction

Embryonic nutrition can be provided entirely from the maternally supplied yolk (lecithotrophy), or supplemented with post-fertilisation maternal (matrotrophy) [1,2], or paternal (patrotrophy) nutrient provisioning [1,3]. Lecithotrophy and parentotrophy represent endpoints of a complex continuum of embryonic nutritional patterns, with no definitive biological point of distinguishment [4,5], For example, small amounts of inorganic nutrient provisioning (calcium) occur in lecithotrophic-classified viviparous squamates, either mobilised from the eggshell, or via simple placentotrophy [6,7]. Squamate classification of provisioning strategy is often also associated with anatomy, i.e., simple vs. complex placentation for lecithotrophy and placentotrophy (parentotrophy via placenta), respectively, despite both capable of post-fertilisation nutrient provisioning [7]. The transport of inorganic molecules requires relatively simple mechanisms compared to the transport of organic molecules [8]. Interestingly though, small uptake of organic molecules (amino acids) from the external environment has also been observed in oviparous teleosts [4]. This suggests the ability of parentotrophic embryos to absorb nutrients from their environment may be retained from an egg-laying ancestor. This ability is a prerequisite for parentotrophy, when the absorbed nutrients are acquired from the gestating parent during pregnancy [1,2]. Applying two broad provisioning strategies to vertebrates that exhibit a continuum of nutrient provisioning abilities between lecithotrophy and parentotrophy, makes correctness and consistency difficult.
Here, we define parentotrophy as the paternal or maternal post-fertilisation supplementation of nutrients to developing embryos during gestation. The parentotrophy provisioning continuum amongst viviparous (live-bearing) teleosts ranges from incipient (mostly yolk reliant with small amounts of supplementation) to substantial parental supplementation post-fertilisation (primarily provisioning) [1,9], and can be achieved via many physiological processes [10]. Viviparous animals can exhibit any provisioning strategy along this continuum. In contrast, oviparous (egg-laying) embryos are lecithotrophic, except for monotremes, and some species that brood their embryos [1,9,11]. Brooding involves egg incubation on or in the parental body [11,12], and provides an opportunity for additional nutrients to be supplied by the brooding parent.
Teleosts (modern bony fishes) demonstrate a diverse range of parental care and reproductive strategies [13], including oviparity, viviparity (incubation inside the female reproductive tract [14], and oviparity with brooding in either parent. Thus, brooding males can provide embryonic nutrition in some species. For example, the Syngnathidae family (pipefish, seadragons, and seahorses) exhibits a specialised form of parental care, whereby fertilisation and gestation occur inside the male, in a specialised structure called the brood pouch [13,15]. Some syngnathids are capable of post-fertilisation provisioning from the father [3,16]. Thus, in this review we use the term parentotrophy to encompass both maternal and paternal post-fertilisation provisioning [10,11]. Unlike viviparous amphibians, amniotes, and chondrichthyans, viviparous teleosts do not develop Müllerian ducts during embryogenesis, thus there is no development of oviducts or uteri in females [10,17,18,19]. Consequently, viviparous teleosts have intra-ovarian rather than intra-uterine gestation [10].
Parentotrophy has independently evolved from the ancestral state, lecithotrophy [9], in at least 33 clades of vertebrates, with substantial parentotrophy evolving 24 times, mostly in bony fishes [1,20]. Matrotrophy has been most extensively studied in the viviparous teleost families; Anablepidae [21], Goodeidae [22] and Poeciliidae [23,24]. Anablepidae and Goodeidae exhibit extreme matrotrophy, increasing in dry mass one thousandfold over embryonic development [21,22]. In contrast, poeciliid embryos receive varying amounts of post-fertilisation nutrition ranging from a decrease in dry mass of 57% to an increase of 625% [9,25,26]. Patrotrophy has evolved at least once in teleosts in the Syngnathidae family [3], but has not yet been studied in other male-brooding teleosts, for example, the forehead-brooding Kurtidae [27], or mouth-brooding Apogonidae [27] and Ariidae [28].
The degree of parentotrophy is commonly measured using a matrotrophy index (MI) (or patrotrophy index (PI) in male pregnant species) [3,23,29]. This ratio has been applied to reptiles [30,31], sharks [32] and bony fishes [3,33]. Wourms et al. [2] were the first to suggest that the degree of post-fertilisation nutrient provisioning could be measured by “the ratio of dry weight of the developed embryo to that of the fertilised egg”. This notion has since evolved to the dry mass of the neonate or newborn at birth divided by the dry mass of the recently fertilised egg [24,34]. The ratio is referred to in this review as matrotrophy index (MI) in matrotrophic species and patrotrophy index (PI) in patrotrophic species. As weight is relative to gravity and the studies mentioned here measured mass, we use the term, mass, for accuracy and consistency.
The dry mass lost by embryos during development in oviparous species provides a threshold MI or PI value used to distinguish between lecithotrophic and parentotrophic nutrition. In oviparous teleosts, the catabolised portion of the yolk to provide energy for growth results in a dry mass loss; thus, the average ratio of an oviparous teleost is MI = 0.7, but always <1, as the embryonic nutrition is provided in the yolk or eggshell only [23,35]. A lecithotrophic viviparous MI is expected to be similar to oviparous teleosts, as neither receive post-fertilisation provisioning.
Despite the continuum of embryonic provisioning, the degree of dry mass lost in oviparous species is used as a threshold value above which a closely-related viviparous species is assumed parentotrophic. However, the threshold values used to distinguish between lecithotrophy and parentotrophy vary considerably across the teleost literature (anything between 0.6 and 1.0: see Section 2), resulting in inconsistent application of threshold values to classify viviparous or brooding species as lecithotrophic or parentotrophic. The concerns about the use of a threshold MI/PI are: (1) it assumes a consistent dry mass loss across oviparous species, but available data are lacking for oviparous teleosts; (2) it assumes consistency in catabolic costs across lecithotrophic viviparous and oviparous species [36]; (3) parentotrophic species may catabolise nutrients at a higher rate if they are receiving additional parental supplementation [37]; and (4) there are varying methodologies for measuring MI/PI. A review of dry weight losses in chondrichthyans questions the current use of threshold MI value [38]. The authors found a large discrepancy in the standard chondrichthyan threshold MI = 0.8 and the MI 0.6 calculated for the oviparous Heterodontus portusjacksoni and discuss inconsistencies and inaccuracies in previous chondrichthyan research. Frazer et al. [38] strongly recommended the disuse of a threshold value to distinguish between lecithotrophy and incipient parentotrophy in chondrichthyans. Therefore, in this review, we evaluate the use of threshold values to classify parentotrophy in teleosts and discuss the variation in methodology used across studies. The goal of this review is to determine the applicability of a single threshold value indicating teleost parentotrophy, and to provide suggestions for methodological consistency to enable a meaningful threshold value to be determined.

2. Teleost Parentotrophy Indices: Methodology and Provisioning Strategy Classification

Teleost literature varies in its methodology of obtaining and interpreting a parentotrophy index for the purpose of classifying a provisioning strategy to a species (Table S1). It differs in the embryonic stages used, the source and preservation of samples, and the use of real or estimated means to calculate an MI/PI. This variation can result in parentotrophy indices not accurately representing real differences in dry mass between birth and fertilisation and eliminate the ability to compare results between studies. Furthermore, the interpretation of an MI/PI varies across studies using varying parentotrophy thresholds and statistical methods, resulting in an overlap of provisioning strategy classifications between and within species. Here, we explore sources of variation in calculating MI/PI.

2.1. Methodological Sources of Variation in Parentotrophy Indices

2.1.1. Raw vs. Regression Estimated Means

An MI/PI can be calculated from either raw (real) or estimated data for the dry mass of an offspring at birth divided by the raw or estimated dry mass of an embryo at fertilisation. Thus, dry masses are required from two embryonic developmental stages: “near-fertilisation” and “near-birth”. Raw data are derived from measuring dry masses of either preserved or freshly collected samples. For these comparisons, mean dry masses from several to hundreds of embryos/offspring are calculated (see references in Table 1).
Studies using raw data to measure dry mass means do so through varying methods to pool offspring within a clutch. These methods include: whole brood total dry mass divided by the number of offspring per brood [39,40,41]; dividing the whole clutch into pools of two to ten individuals for dry mass measurement, dividing each result by the number of offspring in each pool, and then calculating a clutch average [3,42]; or measuring a predetermined number of pooled offspring per clutch (5-100) [33,43]. Some studies do not specify if or how they pooled, subsampled or used whole clutches to measure dry mass, and each study has varying numbers of replicates per stage of development.
In contrast, estimating mean dry mass data uses dry mass data from varying (often opportunistic) stages of embryonic development to code either a linear or quadratic regression model of the relationship between embryonic stage and dry mass. These models are used to estimate the dry masses of embryos at fertilisation and/or at birth and are suitable when embryos cannot be collected at those specific developmental stages. The predicted values, rather than raw measured values, are then used to calculate the parentotrophy index.
Using regression models to predict embryonic dry mass is flawed for two main reasons. Firstly, a regression assumes that the x-axis values are truly quantitative and continuous. Embryonic stage is a discrete variable and offers a qualitative descriptor of the progression of embryogenesis [44,45]. Using embryonic stage as the independent variable assumes a consistent quantitative progression between each stage from beginning to end, which is unlikely [44]. Time after fertilisation or prior to birth, rather than embryonic stage, could be a better consistent quantitative metric, but is still not ideal as developmental rate is affected by environmental variables like temperature [46,47]. Furthermore, a regression of mass vs. time would demonstrate embryo mass gain or loss over time, which does not equate to a parentotrophy index.
The second problem with predicting y-axis values from a regression is that predictions are only valid for the range of data used to estimate the model. Thus, attempts to estimate fertilised egg or newborn dry mass from regressions based on datasets comprising developmental stages after fertilisation and prior to birth will accumulate error at the extremes of the developmental stages as predictions stray further from the available data on the x-axis. Regression models could be improved by including mature eggs prior to fertilization, and newborns. Yet, many teleost studies use a regression to estimate MI/PI but do not specify using samples that expands that full range (see references in Table 1). Furthermore, very few studies provide the sample sizes for each embryonic stage the regression was based on. For those that do, the sample sizes at either extreme of embryonic development are very low. For example, out of a sample size of ~48 clutches of reproductively active Heterophallus milleri, only two and three clutches were from the earliest and latest embryonic stages, respectively, with most data collected from mid-development [48]. The timing of parentotrophy during embryonic development is variable between species (see Section 2.2.3). Therefore, making predictions outside the existing data range, especially with small sample sizes or no samples at the two available ends of development, is discouraged.
Differences in real mean and estimated mean may result in incorrect provisioning strategy classification for species that are lecithotrophic or incipiently parentotrophic. Regressions are therefore likely not suitable for estimating dry masses using an MI/PI for many teleost species. In contrast, this approach is less likely to have a strong influence on conclusions drawn for highly parentotrophic species than for incipiently parentotrophic or lecithotrophic species, since the difference in fertilised egg and newborn dry mass is so large, e.g., Dermogenys sumatrana, which has an MI of 198.5 [49]. The regression approach is therefore potentially useful for such species, even when recently fertilised eggs or newborns are unavailable.

2.1.2. Embryonic Staging

The ideal MI calculation is estimated as the dry mass of the offspring at birth divided by the dry mass of the embryo at fertilisation [2,24]. As yolk formation is complete by the time fertilisation occurs, any additional nutrients present in the embryo must be due to post-fertilisation provisioning [2,50]. However, the embryonic stages used to estimate an MI/PI from raw data vary across teleost studies.
Obtaining samples exactly at fertilisation or birth is impossible in some viviparous teleosts without constant monitoring, thus the next best achievable stage is often used. However, these stages are not consistent across studies, which is problematic in two ways. Firstly, the post-fertilisation sampling delay can affect a calculated MI/PI as parentotrophy may have already started. For lecithotrophic species, the later the sampling occurs after fertilisation, the more likely the embryos have already lost dry mass and thus, the MI would be overestimated. For parentotrophic species, a longer time post-fertilisation before sampling may result in an underestimated MI/PI, as provisioning may have already begun. There is no consistent standard for “near fertilisation” sampling within or across teleost studies, and timing varies considerably across fresh data studies from minutes [50], to hours [3]. Secondly, the amount of time before or after birth that samples are collected can also affect a calculated MI, with no consistent standard for “near birth”. Normal tables of development vary across species and thus, without consistent staging of both near fertilisation and near birth within a species or the equivalent between species, comparisons cannot be drawn. Most studies followed Haynes [44] embryonic staging, comparing stage four (blastocyst) to stage eleven (mature) [51,52], or Reznick [45], comparing stage two (un-eyed) to stage six (very-late eyed/mature) [42,53]. Stage four and eleven from Haynes [44], equate to stage one and six in Reznick [45], respectively. Using late-stage embryos is common for wild populations as we predict collection of this stage prior to birth, reduces the potential effect of catabolism or consumption of food from the external environment, on new-born dry mass and is more logistically achievable. In contrast, laboratory studies can sample immediately after birth [54], or within hours of parturition [3]. The point at which parental nutrient transport to embryos starts and the constant or fluctuating rate at which it occurs is unknown for most parentotrophic teleosts, so the measurable impacts of sampling post-fertilisation or pre-birth are unknown. Even so, using near birth and near fertilisation stages likely results in under- or over-estimated MIs, and studies using different methodology in their embryonic staging are not comparable.

2.1.3. Variation in Maternal Size

Ideally, a parentotrophy index comparison of embryos at fertilisation and new-borns would be obtained from the same female, for multiple individuals across multiple populations. This is possible for species with superfetation, where two or more broods are developing at the same time within the same female, but collecting multiple individuals containing both “near fertilisation” and “near-birth” embryonic stages is likely to be difficult. Thus, matrotrophy indices compare the eggs from multiple females to the offspring of multiple other females, assuming heterogeneity of initial egg size. However, larger egg [55,56] and new-born [56,57,58,59,60] dry mass/size is correlated with larger viviparous females in some species. Note that an increase in offspring size does not always equate to an increase in offspring dry mass [33]. Furthermore, the degree of parentotrophy may change with female size/age [61]. The influence of maternal size can be methodologically mitigated by selecting for same age/sized females across embryonic comparisons.

2.1.4. Source and Preservation of Samples

Dry mass measurements used to calculate both raw and estimated MI/PI can be derived from wild or captive, fresh or preserved samples, which can alter the dry mass of a sample. Only two studies within the viviparous teleost MI/PI range of 0.6 and 1.1 used fresh samples, both in laboratory conditions [3,54]. All oviparous teleost studies mentioned here measured dry mass changes from fresh samples, with liquid nitrogen used as temporary storage for Danio rerio [62], before drying (Table 1). However, no significant difference is observed between dry masses of demersal fish eggs frozen before drying and eggs dried fresh [63]. Most viviparous studies presented here use samples from wild populations with preserved specimens in Neutral Buffered Formalin (NBF) alone or followed by ethanol, in varying concentrations (Table 1). However, preservation in formaldehyde solutions can significantly increase [64] or decrease [63,65] fish egg dry mass. The use of NBF can also result in some loss of lipids from tissue [66]. Furthermore, as lipids are ethanol soluble [67], fixation in ethanol measures lean dry mass, which can be different to dry mass [68,69]. The use of these preservatives can result in a conservative or exaggerated parentotrophy index. Not all teleost parentotrophy research specifies or measures the effects of the method of preservation, except for Thibault and Shultz [43] (Table 1). For example, Olivera-Tlahuel et al. [70] obtained data from alternate sources to use in their MI regression formula when calculating MIs for some species. For two of those species, Phalloceros caudiomaculatus [68] and Phalloceros anisophallos [71], the data obtained were lean dry masses, but the MIs were presented with those derived from dry masses, without distinguishment. Studies in which samples were preserved in NBF or ethanol may not accurately represent the true MI/PI, unless validated by determining the effect of preservation on the embryo dry mass. This is important when distinguishing between facultative or incipient parentotrophy and lecithotrophy because any preservative effect on dry mass may result in the classification of an incorrect provisioning strategy.
Table 1. Parentotrophy indices calculated for teleost fishes indicate discrepant application of a threshold value for parentotrophy.
SpeciesMI/PIReal v
Estimated
Parentotrophy
Threshold
Statistical Test for
Significant Difference
Classification of Nutrient
Provisioning Strategy
Resource
Viviparous
Alfaro huberi0.64EEN>1NALecithotrophy[72] P
Belonesox belizanus0.70EEN>1NALecithotrophy* [72] P
Brachyrhaphis episcopi0.78RNot statedNANot specified[73] PF
Brachyrhaphis holdridgei0.66EEN>1NALecithotrophy[72] P
Brachyrhaphis rhabdophora0.77EEN>1NALecithotrophy* [72] P
Dermogenys burmanica0.67EEN>0.70.7Lecithotrophy[49] PE
Dermogenys siamensis0.64EEN>0.70.7Lecithotrophy[49] PE
Gambusia affinis0.62EEN>1NALecithotrophy* [72] P
Gambusia aurata0.82EEN≥0.8NAMatrotrophy[70] PE
Gambusia holbrooki0.70RNot statedNANot specified** [42]
0.64EEN>1NALecithotrophy* [72] P
Gambusia hubbsi0.86EN>0.70.7Both** [74] PE
Gambusia punctata0.78EEN>0.70.7Lecithotrophy[75] P
Gambusia sexradiata0.73EEN>0.70.7Lecithotrophy[75] P
Gambusia vittata0.77EEN>0.70.7Lecithotrophy** [75] P
0.74EEN>1NALecithotrophy[72] P
1.29EEN≥1NABoth** [41] PE
Gambusia wrayi0.70EEN>0.70.7Lecithotrophy[75] P
Hemirhamphodon kapuasensis0.61EEN>0.70.7Lecithotrophy[49] PE
Hemirhamphodon pogonognathus0.64EEN>0.70.7Lecithotrophy[49] PE
Heterophallus milleri0.74EEN>0.75NALecithotrophy[48] PF
Hippocampus abdominalisp1R>0.7StagePatrotrophy[3] F
Hippocampus fuscusp0.75RNot statedNANot specified[54] F
Limia dominicensis0.65EEN≥1NALecithotrophy[76] P
0.51EEN≥1NALecithotrophy[77] N
Limia heterandria0.67EEN≥1NALecithotrophy[77] N
Limia melanogaster0.71EEN≥1NALecithotrophy** [77] N
0.67EEN≥1NALecithotrophy[76] P
Limia melanonotata0.67EEN≥1NALecithotrophy[77] N
Limia nigrofasciata0.64EEN≥1NALecithotrophy** [77] N
Limia pauciradiata0.66EEN≥1NALecithotrophy[77] N
Limia perugiae0.90EEN≥1NALecithotrophy[77] N
Limia tridens0.90EEN≥1NALecithotrophy[77] N
Limia versicolor0.74EEN≥1NALecithotrophy[77] N
Limia vittata0.76EEN≥1NALecithotrophy** [77] N
Limia zonata0.91EEN≥1NALecithotrophy[77] N
Micropoecilia picta0.78EEN>0.70.7Lecithotrophy** [78] PF
Nomorhamphus kolonodalensis0.66EEN>0.70.7Lecithotrophy[49] PE
Nomorhamphus megarrhamphus0.84EEN>0.70.7Lecithotrophy[49] PE
Nomorhamphus weberi0.77EEN>0.70.7Lecithotrophy[49] PE
Phallichthys fairweatheri0.65EEN≥0.70.7Lecithotrophy[25] P
Phallichthys quadripunctatus0.75EEN≥0.70.7Lecithotrophy** [25] N
Poecilia caucana0.77EEN≥1NALecithotrophy[76] P
Poecilia latipinna0.92EENNot statedNABoth** [79] PF
Poecilia latipunctata0.85EEN≥1NALecithotrophy[80] PF
Poecilia mexicana0.63EN>1NALecithotrophy[72] P
0.57EEN>0.7NALecithotrophy** [81] PF
0.68EN>0.65NALecithotrophy** [34] PF
Poecilia reticulata0.70EEN>0.70.7Lecithotrophy** [78] PF
Poecilia wingei0.84EEN>0.70.7Lecithotrophy[78] PF
Poeciliopsis baenschi0.98EEN≥0.8NAMatrotrophy[70] PE
Poeciliopsis balsas1.05EN>0.60.7Lecithotrophy[23] P
Poeciliopsis catemaco0.68EN>0.60.7Lecithotrophy[23] P
Poeciliopsis fasciata0.81EN>0.60.7Lecithotrophy[23] P
Poeciliopsis gracilis0.69EN>0.60.7Lecithotrophy[23] P
0.84EEN≥0.8NAMatrotrophy[70] PE
0.80EEN≥1NABoth** [82] PE
0.72RNot statedNALecithotrophy[51] PE
Poeciliopsis hnilickai0.86EN>0.60.7Lecithotrophy[23] P
Poeciliopsis infans0.86EN>0.60.7Lecithotrophy[23] P
1.05EEN≥0.8NAMatrotrophy[70] PE
Poeciliopsis latidens0.86EN>0.60.7Matrotrophy[23] P
Poeciliopsis monacha0.61RNot statedNANot specified[43] PE
Poeciliopsis scarlli0.87EN>0.60.7Lecithotrophy[23] P
Poeciliopsis turrubarensis0.66EN>0.60.7Lecithotrophy[23] P
1.05RNot statedNAMatrotrophy** [52] PE
Poeciliopsis viriosa0.93EN>0.60.7Matrotrophy[23] P
Priapella chamulae0.71EEN>0.75StageLecithotrophy[34] PF
Priapella intermedia1.03RNot statedNAMatrotrophy[51] PE
Priapella olmecae0.76EEN≥0.8NALecithotrophy[70]
Priapichthys festae0.60R>0.65NALecithotrophy[83] PF
Pseudoxhiphophorus jonesii0.65EEN≥0.8NALecithotrophy[70] PE
Syngnathus schlegelip0.71RNot statedStagePatrotrophy[33] PE
Xiphophorus hellerii0.61EEN>1NALecithotrophy[72] P
Oviparous
Clupea harengus0.73RNot statedNANot specified[84] F
Danio rerio0.77RNot statedNANot specified[62] FL
Salmo fario0.63RNot statedNANot specified[50] F
Salmo salar0.70RNot statedNANot specified[85] F
Salmo irideus0.62RNot statedNANot specified[86] F
Salvelinus fontinalis0.75RNot statedNANot specified[87] F
Only MI/PI between 0.6 and 1.1 were included to represent the species most likely affected by in-consistencies in methodology. The calculated matrotrophy index (MI) or patrotrophy index (PI) and the classification of nutrient provisioning strategy is shown for each study. Each of the included studies calculates at least one Parentotrophy Index (MI/PI) or % dry mass change during embryogenesis. For studies containing multiple populations, the average is displayed here (**). Estimations were performed using regression models. Statistics listed were parentotrophy index-specific in determining provisioning strategy. Parentotrophy index values were rounded to 2 decimal places. * = not original data source, but MI is reported in the publication. In the Test for Significant Difference column, ”stage” indicates a test for significant difference between early and late/newborn stage and “0.7” indicates testing the MI/PI to be significantly different to 0.7. (NA) = no classifying statistics performed or no parentotrophy threshold given and thus no classification; (R) = raw mean embryo dry mass values from two embryonic stages (fresh and pre-served with 10% Neutral Buffered Formalin) were used to calculate the MI/PI; (EN) = regression used to estimate newborn dry mass; EEN = regression used to estimate embryo at fertilisation and newborn dry mass. Subscript (p) indicates a Patrotrophy Index for male gestating parents. Superscripts indicate whether samples were fresh (F), fresh but briefly stored in liquid nitrogen (FL), preserved in Neutral Buffered Formalin (PF), preserved in Ethanol with or without formalin fixation (PE), preserved but methodology not specified (P), or not specified whether fresh or preserved (N). All preservation types were included for oviparous due to the limited studies available. Ash-free (organic) masses were not included. Studies not specifying fresh or pre-served samples were not included. Studies that used unfertilised eggs as comparison were excluded unless they specified that they were mature. Thresholds and classifications were only included if specified in the original source.

2.2. Methodological Sources of Variation in Provisioning Strategy Classification

2.2.1. Discrepant Use of Threshold Value for Parentotrophy

The threshold value for parentotrophy used in teleost literature is highly variable, ranging from MI > 0.6 to MI > 1 (Table 1), resulting in overlap of classifications along the provisioning continuum (Figure 1). The most common MI/PI threshold values are ≥1 and >0.7 (Table 1). The lack of a consistent threshold applied to the continuum of embryonic provisioning, means that distinguishing lecithotrophy from incipient parentotrophy is difficult and has resulted in overlap of classifications (Figure 1). Multiple species are classified differently across studies due to varying threshold values, including Gambusia vittata, Poeciliopsis gracilis, Poeciliopsis infans, and Poeciliopsis turrubarensis (Table 1, Figure 1). For teleosts with moderate or substantial parentotrophy (Table 2), the use of a consistent methodology is not as essential because the methodological causes of variation should not change the provisioning strategy classification.

2.2.2. Variation in Use of Statistical Tests

The lack of a standard method or statistical approach to assign a provisioning strategy based on an MI/PI can also account for some of the inconsistency in classification observed inter- and intraspecifically (Figure 1; Table 1). Most studies perform no parentotrophy index-specific statistics while others tested if the MI/PI was significantly different from 0.7. This can result in species with MI/PI values larger than 0.7 being classified as lecithotrophic, e.g., Gambusia punctata and Micropoecilia picta (MI = 0.78), or Nomorhamphus megarrhamphus (MI = 0.84) (Table 1), likely due to large variance around the mean and/or statistically inadequate sample sizes. The remaining studies assessed if their near fertilisation and near birth developmental stages were significantly different from one another (Table 1).

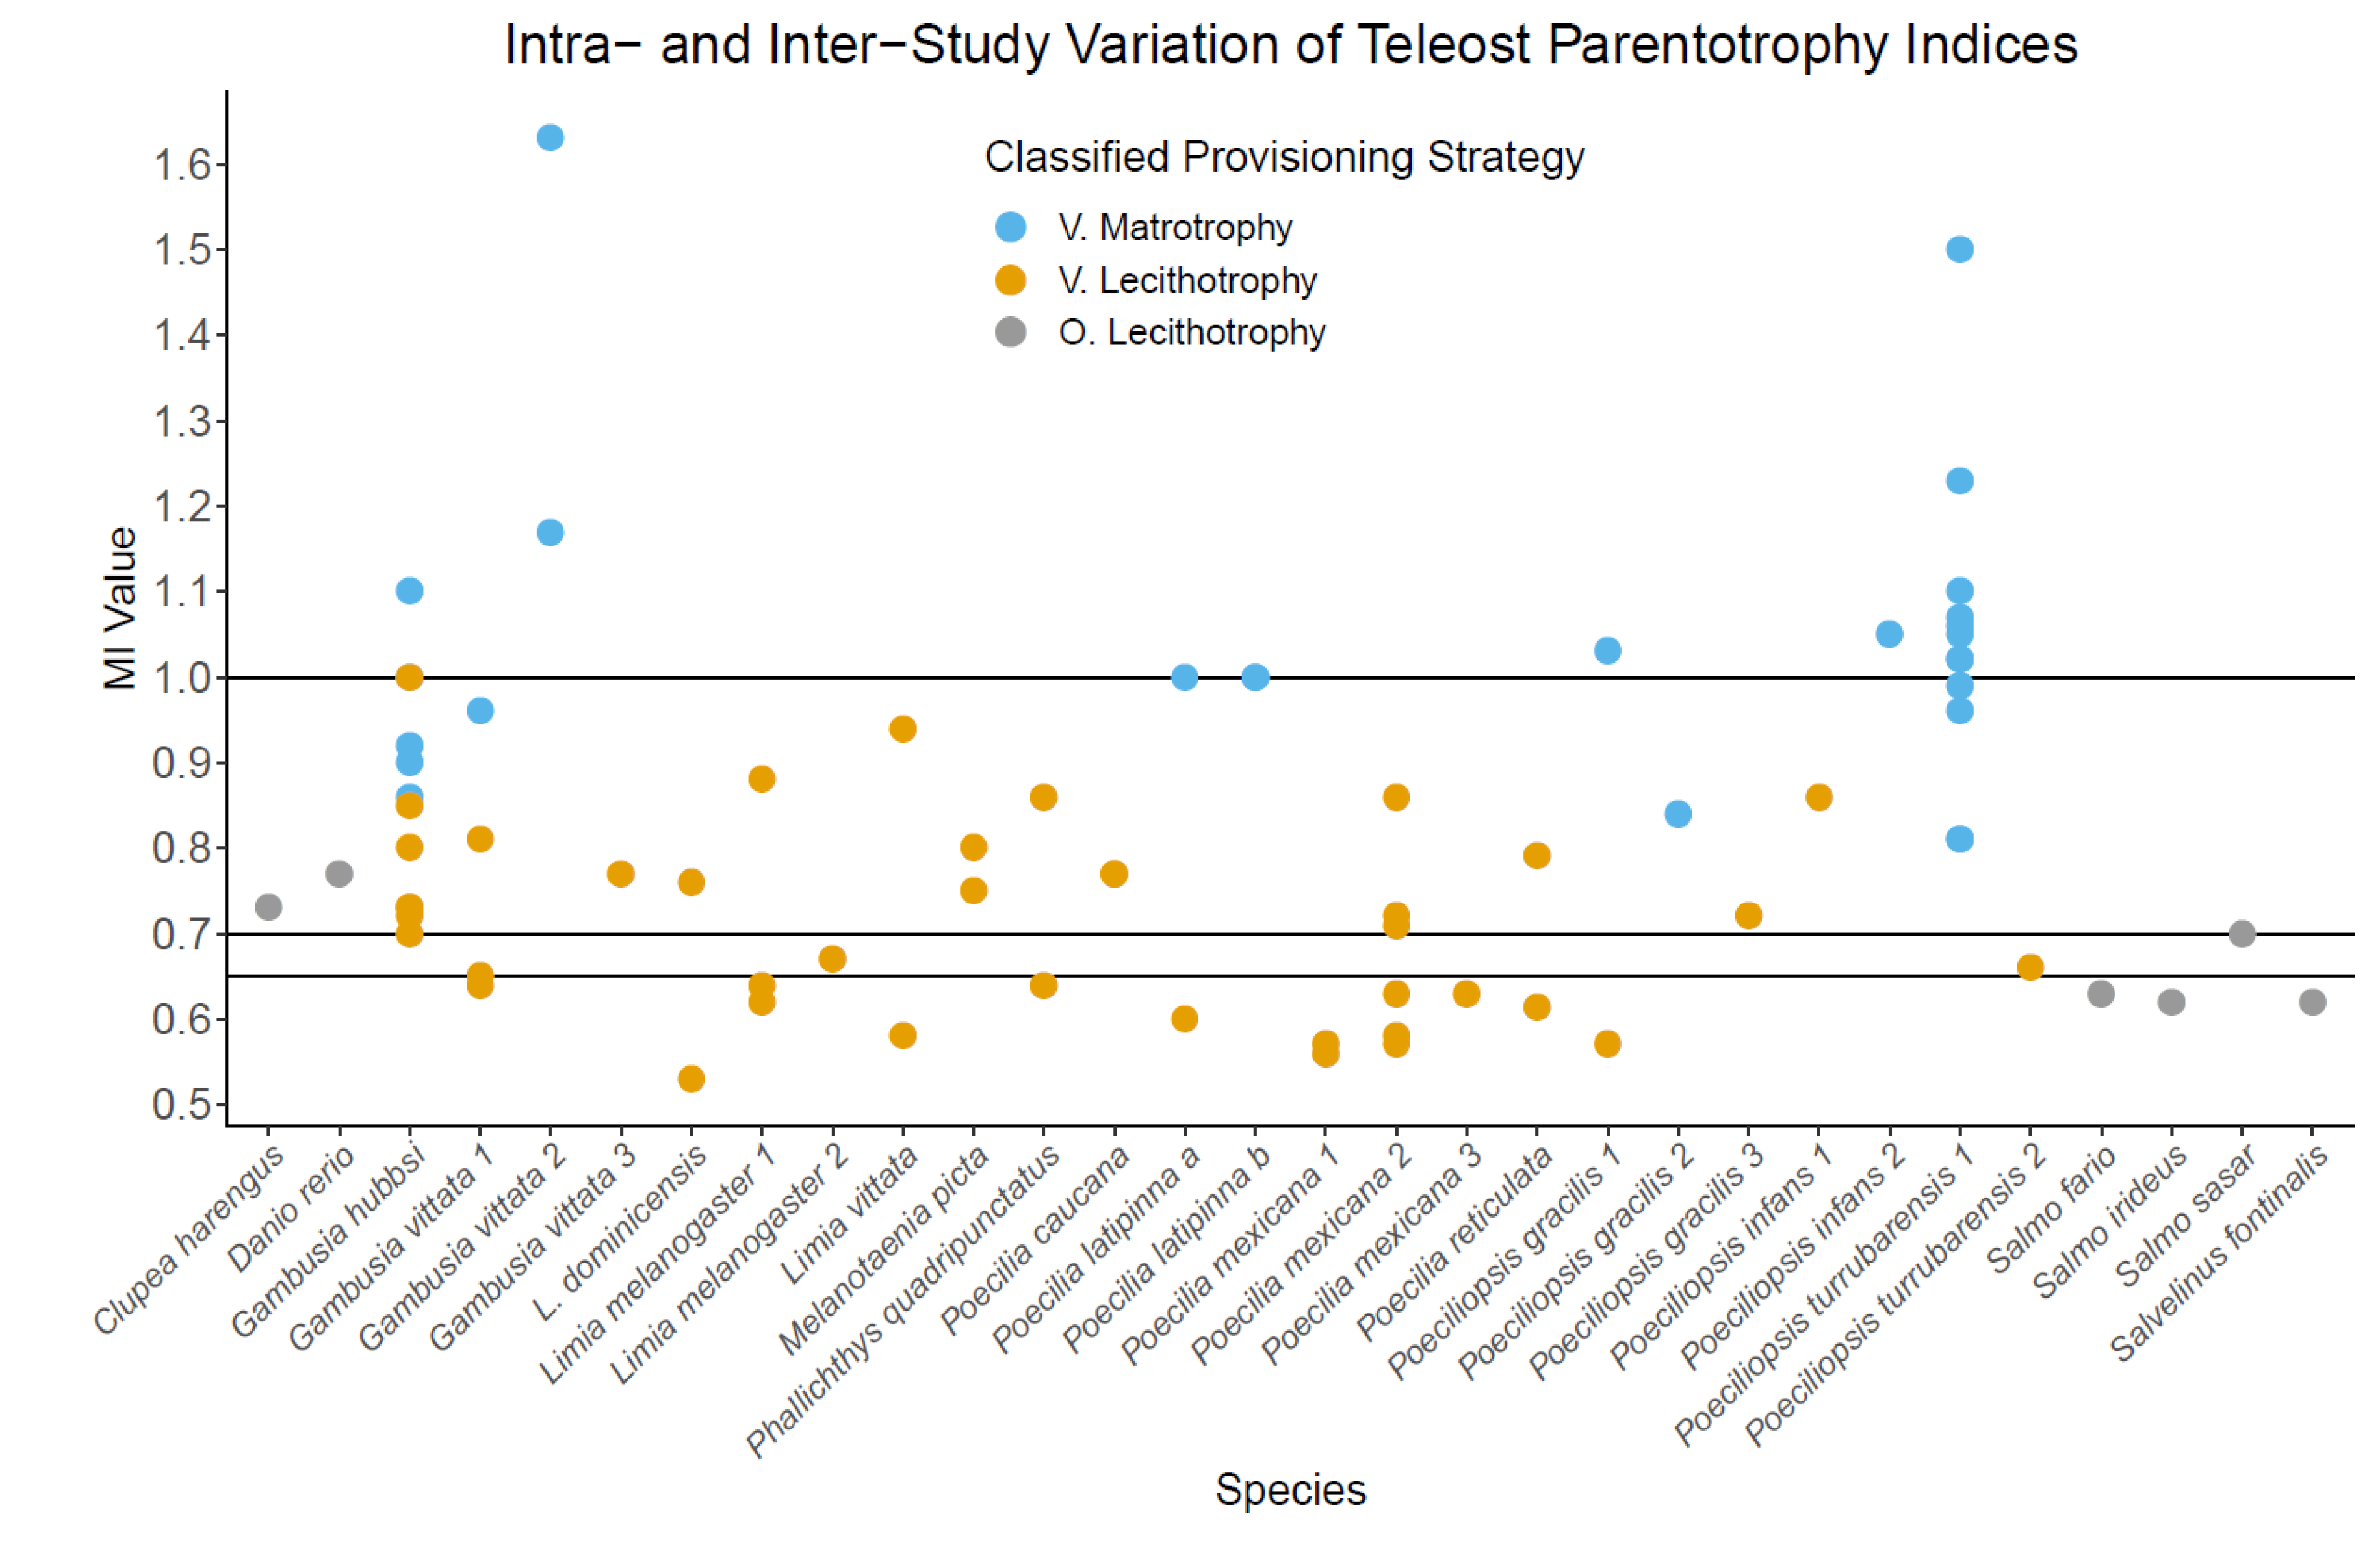
2.2.3. Intra-Specific Variation in Parentotrophy Indices

Intra-Specific Variation in MI/PI Suggests Parentotrophy

In lecithotrophic species, a change in biological factors (e.g., temperature, resource availability) should result in no change in calculated MI/PI across study conditions of populations, providing methodology is consistent and sample size is sufficient. However, if the species is capable of parentotrophy, then variation in MI/PI is likely to occur, even with consistent methodology, due to environmental or genetic factors. This variation means that under certain contexts, an MI could fail to detect parentotrophy, despite the species being parentotrophic. For example, if a species is facultatively parentotrophic, it would be unlikely to be detected in systems where the gestating parent does not have the excess nutrients/energy to provide to developing embryos, like in resource limiting environments [94,95]. As also seen in reptiles, if a pregnant mother has sufficient resource availability for facultative parentotrophy, the MI should increase [96]. For some teleost species with MIs calculated for multiple populations within a study, some populations are classified as lecithotrophic and others parentotrophic, for example Gambusia hubbsi, G. vittata, P. gracilis, and Poecilia latipinna (Figure 1). However, if a species is capable of parentotrophy, but does not always exhibit parentotrophy, then it should be classified as parentotrophic (i.e., capable of parentotrophy). By this standard, assuming methodology is consistent within studies, G. hubbsi, G. vittata, P. gracilis, and P. latipinna should all be classified as potentially parentotrophic. For species with MI/PI between 0.6 and 1, if methodology is not consistent within or across studies, large variation in parentotrophy indices may be methodological and incorrectly imply parentotrophy. We suggest that a parentotrophy index from a single population may not accurately represent a species’ ability for parentotrophy if its MI/PI falls within the range of 0.6 and 1, and that studies should look at multiple populations, age groups (or equal variation in parental ages across the two stages), and/or study conditions (e.g., resource availability).

Temporal Intra-Specific Variation in Parentotrophy

In parentotrophic teleosts, the timing, source, and quantity of embryonic nutrition across development is variable between species and can be non-linear. Species can receive parental provisioning at different stages of development, so the timing of sampling in species with varying metabolisms can heavily influence parentotrophy index results and provisioning conclusions. For example, Gambusia holbrooki is classified as lecithotrophic (Table 1), yet embryos increase in dry mass by almost 50% during embryogenesis before decreasing again before parturition [37]. This increase to ~150% of the original dry mass is significantly different to early and late embryonic masses. In contrast, in some Phalloceros species, the embryos decrease in dry mass at the beginning of gestation and then increase up to three-fold [90]. Similarly, Xenodexia ctenolepis embryos dry weights remain stable or decrease slightly until about half-way through gestation, where significant matrotrophy occurs, resulting in a three-to-four-fold increase in dry mass from fertilisation to birth [49]. Comparing two stages on either end of embryonic development without consideration for the intermediate stages, is a limitation to using the MI/PI to classify provisioning strategy and can result in incorrectly classifying a species as lecithotrophic.

3. Alternative Approaches to Measuring Parentotrophy

There are several alternative methods to determine provisioning strategies that have been used across vertebrate literature, including comparing the nutrient content of neonates to that of eggs via nutrient extractions, mass spectrometry or chemical composition analysis. In lecithotrophic species, if the nutrient in question is catabolisable (e.g., lipids), its mass should decrease due to the catabolism of the embryo. Thus, if transport of a metabolised nutrient occurs, then the mass of that nutrient in the newborns should be more than or slightly less than that of the recently fertilised eggs [3]. For example, quantifying lipids [3,97,98] and proteins [97,98] has been used as evidence for matrotrophy.
To determine whether parentotrophy occurs, the transport of specifically labelled nutrients can be tracked between the parent and offspring, as commonly used in reptiles [98,99,100] and fish [16,94,101,102,103]. Currently, there are two direct labelling methods to track nutrient transport and determine the presence of parentotrophy: stable isotope labelled nutrients and radioactively labelled nutrients. These methods can be used with a range of nutrients including fatty acids [104] and amino acids [81,100,104] and consist of either feeding or directly injecting the labelled nutrients into pregnant individuals. The abundance of the labelled nutrients is then measured in the embryos to determine if they have taken up any of the labelled nutrients [104]. Labelled nutrient studies can offer opposite conclusions to a derived parentotrophy index. For example, an estimated MI of 0.56 and 0.57 for two separate populations of Poecilia mexicana suggests lecithotrophy [81]. However, the study also conducted a radio-tracer assay and found significant maternal nutrient transfer of labelled leucine to developing embryos, revealing parentotrophy had occurred. Respirometry by measurement of oxygen consumption, and calorimetry by measurement of heat loss, can indirectly measure embryonic metabolic rates and has been used to make inferences on the level of parentotrophy in the genus Sebastes [36]. Respirometry indicates that Sebastes melanops embryos catabolise 64% of the energy provided in the egg but offspring at birth contained 81% of the initial energy of the mature egg. Therefore, the total energy required for embryonic development is ~1.45 x the initial egg supply, suggesting that the species is parentotrophic [36]. Additionally, immunohistochemistry can localise proteins [105] involved in nutrient transport and can display how, when and/or where parentotrophy may be occurring.

4. Conclusions and Future Directions

Teleost nutrient provisioning strategies range from lecithotrophy to extreme parentotrophy [21,22], and distinguishing between the two is vital in gaining foundational biological understanding of a species’ reproduction. Therefore, methodological consistency in obtaining an MI/PI and consistency in a parentotrophy threshold is essential for establishing a credible standard parentotrophy index comparison across species, populations, and studies. We argue that preserved specimens may not accurately estimate an MI/PI unless validated with a comparison of dried fresh and dried preserved specimens. We further argue that calculating an MI/PI using a regression to estimate dry mass based on embryonic staging can be problematic because embryonic stage is not quantitative and continuous, and predictions cannot be made outside the range of data used to make the regression. We therefore propose that a single threshold cannot be used to distinguish between lecithotrophy and incipient parentotrophy in every teleost species, similar to Frazer et al.’s [38] recommendations for chondrichthyans. For species with 0.6 ≤ MI ≤ 1, we recommend the addition of another method to distinguish between lecithotrophy and parentotrophy (e.g., nutrient extractions or mass spectrometry of embryos/uterine or pouch fluid, radio-tracer assay, histology, and electron microscopy), to confirm a species’ ability (whether realised in natural populations or not) to be parentotrophic. Alternatively, studies of similar sized/aged animals in multiple environmental treatments (e.g., feeding regimes) in which separate parentotrophy indices are calculated may be useful to determine any variability that may suggest parentotrophy. The number of oviparous teleost species for which MI has been calculated is limited and these studies are highly variable in their methodology. Thus, further research is required with consistent embryonic stage comparisons between species and a preference for the use of fresh rather than fixed tissues. With consistent methodology, the biological and genetic causes for variation in parentotrophic species can then be compared across studies, species, and populations.

Supplementary Materials

The following supporting information can be downloaded at: https://www.mdpi.com/article/10.3390/biom13010166/s1, Table S1: Inclusion Criteria.

Funding

Funder: University of Sydney. Grant Number: Sydney Research Accelerator Fellowship to CMW.

Institutional Review Board Statement

Not applicable.

Informed Consent Statement

Not applicable.

Data Availability Statement

Not applicable.

Acknowledgments

The authors thank Bill Holt for the opportunity to contribute to this Special Issue, Catherine Grueber for stimulating discussions during conceptualisation of this paper, and Samson Dowland for helpful comments on a previous version of this manuscript.

Conflicts of Interest

The authors declare no conflict of interest.

References

  1. Blackburn, D.G. Evolution of vertebrate viviparity and specializations for fetal nutrition: A quantitative and qualitative analysis. J. Morphol. 2014, 276, 961–990. [Google Scholar] [CrossRef] [PubMed]
  2. Wourms, J.P.; Grove, B.D.; Lombardi, J. The Maternal-Embryonic Relationship in Viviparous FishesHoar, W.S., Randall, D.J., Eds.; Fish Physiology1988; Volume 11, pp. 1–34.
  3. Skalkos, Z.M.G.; Van Dyke, J.U.; Whittington, C.M. Paternal nutrient provisioning during male pregnancy in the seahorse Hippocampus abdominalis. J. Comp. Physiol. B 2020, 190, 547–556. [Google Scholar] [CrossRef]
  4. Morrison, K.R.; Ngo, V.; Cardullo, A.R.; Reznick, D.N. How fish eggs are preadapted for the evolution of matrotrophy. Proc. R. Soc. 2017, 284, 20171342. [Google Scholar] [CrossRef] [Green Version]
  5. Stewart, J.R. Fetal nutrition in lecithotrophic squamate reptiles: Toward a comprehensive model for evolution of viviparity and placentation. J. Morphol. 2013, 274, 824–843. [Google Scholar] [CrossRef]
  6. Stewart, J.R.; Thompson, M. Evolution of placentation among squamate reptiles: Recent research and future directions. Comp. Biochem. Physiol. Part A Mol. Integr. Physiol. 2000, 127, 411–431. [Google Scholar] [CrossRef]
  7. Thompson, M.B.; Speake, B.K. A review of the evolution of viviparity in lizards: Structure, function and physiology of the placenta. J. Comp. Physiol. B 2005, 176, 179–189. [Google Scholar] [CrossRef] [PubMed]
  8. Silverthorn, D.U. Human Physiology: An Integrated Approach, 8th ed.Pearson Education Limited: Harlow, UK, 2018. [Google Scholar]
  9. Blackburn, D.G. Convergent evolution of viviparity, matrotrophy, and specializations for fetal nutrition in reptiles and other vertebrates. Am. Zool. 1992, 32, 313–321. [Google Scholar] [CrossRef] [Green Version]
  10. Wourms, J.P. Viviparity: The maternal-fetal relationship in fishes. Am. Zool. 1981, 21, 473–515. [Google Scholar] [CrossRef] [Green Version]
  11. Whittington, C.M.; Friesen, C.R. The evolution and physiology of male pregnancy in syngnathid fishes. Biol. Rev. 2020, 95, 1252–1272. [Google Scholar] [CrossRef]
  12. Ostrovsky, A.N.; Lidgard, S.; Gordon, D.P.; Schwaha, T.; Genikhovich, G.; Ereskovsky, A.V. Matrotrophy and placentation in invertebrates: A new paradigm. Biol. Rev. 2015, 91, 673–711. [Google Scholar] [CrossRef]
  13. Sutton, F.B.; Wilson, A.B. Parental behavior in fish. In Encyclopedia of Reproduction, 2nd ed.; Skinner, M.K., Ed.; Elsevier Science & Technology: Amsterdam, The Netherlands, 2018; pp. 106–114. [Google Scholar]
  14. Blackburn, D.G. Classification of vertebrate reproductive modes. Am. Zool. 2000, 22, 371–377. [Google Scholar]
  15. Stölting, K.N.; Wilson, A.B. Male pregnancy in seahorses and pipefish: Beyond the mammalian model. Bioessays 2007, 29, 884–896. [Google Scholar] [CrossRef] [PubMed]
  16. Kvarnemo, C.; Mobley, K.B.; Partridge, C.; Jones, A.; Ahnesjö, I. Evidence of paternal nutrient provisioning to embryos in broad-nosed pipefish Syngnathus typhle. J. Fish Biol. 2011, 78, 1725–1737. [Google Scholar] [CrossRef]
  17. Turner, C.L. Viviparity in teleost fishes. Sci. Mon. 1947, 65, 508–518. [Google Scholar] [PubMed]
  18. Uribe, M.C.; Cruz, G.D.L.R.; Alarcón, A.G.; Caballero, J.C.C.; Bárcenas, M.G.G. Structures Associated with Oogenesis and Embryonic Development during Intraovarian Gestation in Viviparous teleosts (Poeciliidae). Fishes 2019, 4, 35. [Google Scholar] [CrossRef] [Green Version]
  19. Uribe, M.C.; Grier, H.J.; De la Rosa Cruz, G.; García Alarcón, A. Modifications in ovarian and testicular morphology associated with viviparity in teleosts. In Reproductive Biology and Phylogeny of Fishes (Agnathans and Bony Fishes); Jamieson, B.G.M., Ed.; CRC Press: Boca Raton, FL, USA, 2009; pp. 99–132. [Google Scholar]
  20. Blackburn, D.G. The evolution of viviparity and matrotrophy in vertebrates, with special reference to reptiles. Ph.D. Dissertation, Cornell University, New York, NY, USA, 1985. [Google Scholar]
  21. Knight, F.M.; Lombardi, J.; Wourms, J.P.; Burns, J.R. Follicular placenta and embryonic growth of the viviparous four-eyed fish (Anableps). J. Morphol. 1985, 185, 131–142. [Google Scholar] [CrossRef] [PubMed]
  22. Hollenberg, F.; Wourms, J.P. Ultrastructure and protein uptake of the embryonic trophotaeniae of four species of goodeid fishes (Teleostei: Atheriniformes). J. Morphol. 1994, 219, 105–129. [Google Scholar] [CrossRef]
  23. Reznick, D.N.; Mateos, M.; Springer, M.S. Independent origins and rapid evolution of the placenta in the fish genus Poeciliopsis. Science 2002, 298, 1018–1020. [Google Scholar] [CrossRef] [Green Version]
  24. Pollux, B.; Pires, M.; Banet, A.; Reznick, D. Evolution of placentas in the fish family Poeciliidae: An empirical study of macroevolution. Annu. Rev. Ecol. Evol. Syst. 2009, 40, 271–289. [Google Scholar] [CrossRef] [Green Version]
  25. Regus, J.U.; Johnson, J.B.; Webb, S.A.; Reznick, D.N. Comparative life histories of fishes in the genus Phallichthys (Pisces: Poeciliidae). J. Fish Biol. 2013, 83, 144–155. [Google Scholar] [CrossRef]
  26. Scrimshaw, N.S. Embryonic growth in the viviparous Poeciliid, Heterandria formosa. Biol. Bull. 1944, 87, 37–51. [Google Scholar] [CrossRef]
  27. Balon, E.K. Reproductive guilds of fishes: A proposal and definition. J. Fish. Res. Board Can. 1975, 32, 821–864. [Google Scholar] [CrossRef]
  28. Lima, A.R.A.; Barletta, M.; Dantas, D.V.; Ramos, J.A.A.; Costa, M.F. Early development of marine catfishes (Ariidae): From mouth brooding to the release of juveniles in nursery habitats. J. Fish Biol. 2013, 82, 1990–2014. [Google Scholar] [CrossRef]
  29. Whittington, C.M.; Buddle, A.L.; Griffith, O.W.; Carter, A.M. Embryonic specializations for vertebrate placentation. Philosoophical Trans. R. Soc. B Biol. Sci. 2022, 377, 20210261. [Google Scholar] [CrossRef] [PubMed]
  30. Stewart, J.R.; Castillo, R.E. Nutritional provision of the yolk of two species of viviparous reptiles. Physiol. Zool. 1984, 57, 377–383. [Google Scholar] [CrossRef]
  31. Stewart, J.R.; Thompson, M. A novel pattern of embryonic nutrition in a viviparous reptile. J. Exp. Biol. 1993, 174, 97–108. [Google Scholar] [CrossRef]
  32. Paiva, R.B.; Neves, A.; Sequeira, V.; Nunes, M.L.; Gordo, L.S.; Bandarra, N. Reproductive strategy of the female deep-water shark birdbeak dogfish, Deania calcea: Lecithotrophy or matrotrophy? J. Mar. Biol. Assoc. U. K. 2011, 92, 387–394. [Google Scholar] [CrossRef]
  33. Watanabe, S.; Watanabe, Y. Relationship between male size and newborn size in the Seaweed Pipefish, Syngnathus schlegeli. J. Appl. Phycol. 2002, 65, 319–325. [Google Scholar] [CrossRef]
  34. Riesch, R.; Plath, M.; Schlupp, I. Toxic hydrogen sulfide and dark caves: Life-history adaptations in a livebearing fish (Poecilia mexicana, Poeciliidae). Ecology 2010, 91, 1494–1505. [Google Scholar] [CrossRef]
  35. Huveneers, C.; Otway, N.M.; Harcourt, R.G.; Ellis, M. Quantification of the maternal-embryonal nutritional relationship of elasmobranchs: Case study of wobbegong sharks (genus Orectolobus). J. Fish Biol. 2011, 78, 1375–1389. [Google Scholar] [CrossRef]
  36. Boehlert, G.W.; Yamada, J. Rockfishes of the Genus Sebastes: Their Reproduction and Early Life History; Springer: Berlin/Heidelberg, Germany, 1991. [Google Scholar] [CrossRef]
  37. Edwards, T.M.; Miller, H.D.; Guillette, L.J. Water quality influences reproduction in female Mosquitofish (Gambusia holbrooki) from eight Florida springs. Environ. Health Perspect. 2006, 114, 69–75. [Google Scholar] [CrossRef] [PubMed] [Green Version]
  38. Frazer, H.A.; Ellis, M.; Huveneers, C. Can a threshold value be used to classify Chondrichthyan reproductive modes: Systematic review and validation using an oviparous species. PLoS ONE 2012, 7, e50196. [Google Scholar] [CrossRef] [PubMed]
  39. Constantz, G.D. Energetics of viviparity in the Gila topminnow (Pisces: Poeciliidae). Copeia 1980, 1980, 876. [Google Scholar] [CrossRef]
  40. Schrader, M.; Travis, J. Do embryos influence maternal investment? Evaluating maternal-fetal coadaptation and the potential for parent-offspring conflict in a placental fish. Evolution 2009, 63, 2805–2815. [Google Scholar] [CrossRef]
  41. Weldele, M.L.; Zúñiga-Vega, J.J.; Johnson, J.B. Life history of Gambusia vittate (Pisces: Poeciliidae). Southwest. Nat. 2014, 59, 449–460. [Google Scholar] [CrossRef]
  42. Fernandez-Delgado, C.; Rossomanno, S. Reproductive biology of the mosquitofish in a permanent natural lagoon in south-west Spain: Two tactics for one species. J. Fish Biol. 1997, 51, 80–92. [Google Scholar] [CrossRef]
  43. Thibault, R.E.; Schultz, R.J. Reproductive adaptations among viviparous fishes (Cyprinodontiformes: Poeciliidae). Evolution 1978, 32, 320–333. [Google Scholar] [CrossRef]
  44. Haynes, J.L. Standardized classification of Poeciliid development for life-history studies. Copeia 1995, 1995, 147. [Google Scholar] [CrossRef]
  45. Reznick, D. “Grandfather effects”: The genetics of interpopulation differences in offspring size in the Mosquito fish. Evolution 1981, 35, 941–953. [Google Scholar] [CrossRef]
  46. Gillooly, J.F.; Charnov, E.L.; West, G.B.; Savage, V.M.; Brown, J.H. Effects of size and temperature on developmental time. Nature 2002, 417, 70–73. [Google Scholar] [CrossRef]
  47. Mason, M.W.; Bertucci, E.M.; Leri, F.M.; Parrott, B.B. Transient copper exposure during embryogenesis and temperature affect developmental rate, survival, and fin regeneration in Japanese Medaka (Oryzias latipes). Environ. Toxicol. Chem. 2022, 41, 748–757. [Google Scholar] [CrossRef] [PubMed]
  48. Riesch, R.; Colston, T.J.; Joachim, B.L.; Schlupp, I. Natural history and life history of the Grijalva gambusia Heterophallus milleri Radda, 1987 (Teleostei: Poeciliidae). Aqua Int. J. Ichthyol. 2011, 17, 95–102. [Google Scholar]
  49. Reznick, D.; Hrbek, T.; Caura, S.; De Greef, J.; Roff, D. Life history of Xenodexia ctenolepis: Implications for life history evolution in the family Poeciliidae. Biol. J. Linn. Soc. 2007, 92, 77–85. [Google Scholar] [CrossRef]
  50. Gray, J. The growth of fish: I. The relationship between embryo and yolk in Salmo fario. J. Exp. Biol. 1926, 4, 215–226. [Google Scholar] [CrossRef]
  51. Saleh-Subaie, N.; Ramírez-Cruz, G.A.; Zúñiga-Vega, J.J. Examination of the Trexler-DeAngelis Model of maternal provisioning reveals that matrotrophy is costly. Front. Ecol. Evol. 2021, 9, 635. [Google Scholar] [CrossRef]
  52. Zúñiga-Vega, J.J.; Reznick, D.N.; Johnson, J.B. Habitat predicts reproductive superfetation and body shape in the livebearing fish Poeciliopsis turrubarensis. Oikos 2007, 116, 995–1005. [Google Scholar] [CrossRef]
  53. Gorini-Pacheco, B.; Zandonà, E.; Mazzoni, R. Predation effects on matrotrophy, superfetation and other life history traits in Phalloceros harpagos. Ecol. Freshw. Fish 2017, 27, 442–452. [Google Scholar] [CrossRef]
  54. Vincent, A.C.J. Reproductive Ecology of Seahorses. Ph.D. Dissertation, Cambridge University, Cambridge, UK, 1990. [Google Scholar]
  55. Kindsvater, H.K.; Bonsall, M.B.; Alonzo, S.H. Survival costs of reproduction predict age-dependent variation in maternal investment. J. Evol. Biol. 2011, 24, 2230–2240. [Google Scholar] [CrossRef]
  56. Kindsvater, H.K.; Rosenthal, G.G.; Alonzo, S.H. Correction: Maternal size and age shape offspring size in a live-bearing fish, Xiphophorus birchmanni. PLoS ONE 2012, 8, e48473. [Google Scholar] [CrossRef]
  57. Berkeley, S.A.; Chapman, C.; Sogard, S.M. Maternal age as a determinant of larval growth and survival in a marine fish, Sebastes melanops. Ecology 2004, 85, 1258–1264. [Google Scholar] [CrossRef] [Green Version]
  58. Cheong, R.T.; Henrich, S.; Farr, J.A.; Travis, J. Variation in fecundity and its relationship to body size in a population of the Least Killifish, Heterandria formosa (Pisces: Poeciliidae). Copeia 1984, 1984, 720. [Google Scholar] [CrossRef]
  59. Hagmayer, A.; Furness, A.I.; Reznick, D.N.; Pollux, B.J.A. Maternal size and body condition predict the amount of post-fertilization maternal provisioning in matrotrophic fish. Ecol. Evol. 2018, 8, 12386–12396. [Google Scholar] [CrossRef] [Green Version]
  60. Marshall, D.J.; Heppell, S.S.; Munch, S.B.; Warner, R.R. The relationship between maternal phenotype and offspring quality: Do older mothers really produce the best offspring? Ecology 2010, 91, 2862–2873. [Google Scholar] [CrossRef] [PubMed]
  61. Saleh-Subaie, N.; Johnson, J.B.; Zúñiga-Vega, J.J. Small sizes, big strategies: The relationship between female size, matrotrophy and superfetation throughout the reproductive lives of poeciliid fishes. J. Zool. 2021, 315, 261–275. [Google Scholar] [CrossRef]
  62. Hachicho, N.; Reithel, S.; Miltner, A.; Heipieper, H.J.; Küster, E.; Luckenbach, T. Body mass parameters, lipid profiles and protein contents of zebrafish embryos and effects of 2,4-Dinitrophenol exposure. PLoS ONE 2015, 10, e0134755. [Google Scholar] [CrossRef] [PubMed] [Green Version]
  63. Hislop, J.R.G.; Bell, M.A. Observations on the size, dry weight and energy content of the eggs of some demersal fish species from British marine waters. J. Fish Biol. 1987, 31, 1–20. [Google Scholar] [CrossRef]
  64. Frimpong, E.A.; Henebry, M.L. Short-term effects of Formalin and Ethanol fixation and preservation techniques on weight and size of fish eggs. Trans. Am. Fish. Soc. 2012, 141, 1472–1479. [Google Scholar] [CrossRef]
  65. Johnston, T.A.; Mathias, J.A. Length reduction and dry weight loss in frozen and formalin-preserved larval walleye, Stizostedion vitreum (Mitchill). Aquac. Res. 1993, 24, 365–371. [Google Scholar] [CrossRef]
  66. Leist, D.P.; Nettleton, G.S.; Feldhoff, R.C. Determination of lipid loss during aqueous and phase partition fixation using formalin and glutaraldehyde. J. Histochem. Cytochem. 1986, 34, 437–441. [Google Scholar] [CrossRef]
  67. Yang, F.; Xiang, W.; Sun, X.; Wu, H.; Li, T.; Long, L. A novel lipid extraction method from wet Microalga Picochlorum sp. at room temperature. Mar. Drugs 2014, 12, 1258–1270. [Google Scholar] [CrossRef] [Green Version]
  68. Arias, A.-L.; Reznick, D. Life History of Phalloceros caudiomaculatus: A novel variation on the theme of livebearing in the family Poeciliidae. Copeia 2000, 2000, 792–798. [Google Scholar] [CrossRef]
  69. Wetzel, M.A.; Leuchs, H.; Koop, J.H.E. Preservation effects on wet weight, dry weight, and ash-free dry weight biomass estimates of four common estuarine macro-invertebrates: No difference between ethanol and formalin. Helgol. Mar. Res. 2005, 59, 206–213. [Google Scholar] [CrossRef] [Green Version]
  70. Olivera-Tlahuel, C.; Ossip-Klein, A.G.; Espinosa-Pérez, H.S.; Zúñiga-Vega, J.J. Have superfetation and matrotrophy facilitated the evolution of larger offspring in poeciliid fishes? Biol. J. Linn. Soc. 2015, 116, 787–804. [Google Scholar] [CrossRef] [Green Version]
  71. Almeida-Silva, P.H.; Mazzoni, R. Life history aspects of Phalloceros anisophallos Lucinda, 2008 (Osteichthyes, Poeciliidae) from Córrego Andorinha, Ilha Grande (RJ, Brazil). Stud. Neotrop. Fauna Environ. 2014, 49, 191–198. [Google Scholar] [CrossRef]
  72. Pollux, B.J.A.; Meredith, R.W.; Springer, M.S.; Garland, T.; Reznick, D.N. The evolution of the placenta drives a shift in sexual selection in livebearing fish. Nature 2014, 513, 233–236. [Google Scholar] [CrossRef] [PubMed]
  73. Jennions, M.D.; Telford, S. Life-history phenotypes in populations of Brachyrhaphis episcopi (Poeciliidae) with different predator communities. Oecologia 2002, 132, 44–50. [Google Scholar] [CrossRef]
  74. Riesch, R.; Martin, R.A.; Langerhans, R.B. Predation’s role in life-history evolution of a livebearing fish and a test of the Trexler-DeAngelis Model of maternal provisioning. Am. Nat. 2013, 181, 78–93. [Google Scholar] [CrossRef] [Green Version]
  75. Torres-Mejia, R.M. Ecomorphology of Body Shape and Life History in Females of the Genus Gambusia (Poeciliidae) and in Guppies (Poecilia reticulata, Poeciliidae). Ph.D. Thesis, University of California, Berkeley, CA, USA, 2012. [Google Scholar]
  76. Pires, M.N.; Reznick, D.N. Life-history evolution in the fish genus Poecilia (Poeciliidae: Cyprinodontiformes: Subgenus Pamphorichthys): An evolutionary origin of extensive matrotrophy decoupled from superfetation. Biol. J. Linn. Soc. 2018, 125, 547–560. [Google Scholar] [CrossRef]
  77. Cohen, S.N.; Regus, J.U.; Reynoso, Y.; Mastro, T.; Reznick, D.N. Comparative life histories of fishes in the subgenus Limia (Pisces: Poeciliidae). J. Fish Biol. 2015, 87, 100–114. [Google Scholar] [CrossRef]
  78. Pires, M.N.; Arendt, J.; Reznick, D.N. The evolution of placentas and superfetation in the fish genus Poecilia (Cyprinodontiformes: Poeciliidae: Subgenera Micropoecilia and Acanthophacelus). Biol. J. Linn. Soc. 2010, 99, 784–796. [Google Scholar] [CrossRef]
  79. Trexler, J.C. Variation in the degree of viviparity in the Sailfin Molly, Poecilia latipinna. Copeia 1985, 1985, 999. [Google Scholar] [CrossRef]
  80. Pires, M.N. The evolution of placentas in Poeciliid fishes. Ph.D. Dissertation, University of California, Berkeley, CA, USA, 2007. [Google Scholar]
  81. Riesch, R.; Plath, M.; Schlupp, I.; Marsh-Matthews, E. Matrotrophy in the cave molly: An unexpected provisioning strategy in an extreme environment. Evol. Ecol. 2009, 24, 789–801. [Google Scholar] [CrossRef]
  82. Molina-Moctezuma, A.; Hernández-Rosas, A.L.; Zúñiga-Vega, J.J. Resource availability and its effects on mother to embryo nutrient transfer in two viviparous fish species. J. Exp. Zool. Part A Ecol. Integr. Physiol. 2020, 333, 181–193. [Google Scholar] [CrossRef] [PubMed]
  83. Reznick, D.; Callahan, H.; Llauredo, R. Maternal effects on offspring quality in Poeciliid fishes. Amer. Zool. 1996, 36, 147–156. [Google Scholar] [CrossRef] [Green Version]
  84. Paffenhöfer, G.A.; Rosenthal, H. Trockengewicht und Kaloriengehalt sich entwickelnder Heringseier. Helgol. Mar. Res. 1968, 18, 45–52. [Google Scholar] [CrossRef] [Green Version]
  85. Hayes, F.R.; Armstrong, F.H. Physical changes in the constituent parts of developing salmon eggs. Can. J. Res. 1942, 20d, 99–114. [Google Scholar] [CrossRef]
  86. Smith, S. Studies in the development of the rainbow trout (Salmo irideus) I. The heat production and nitrogenous excretion. J. Exp. Biol. 1947, 23, 357–378. [Google Scholar] [CrossRef]
  87. Gortner, R.A. Studies on the chemistry of embryonic growth I. certain changes in the nitrogen ratios of developing trout eggs. J. Am. Chem. Soc. 1913, 35, 632–645. [Google Scholar] [CrossRef] [Green Version]
  88. Veith, W. Reproduction in the live-bearing teleost Clinus superciliosus. S. Afr. J. Zool. 1979, 14, 208–211. [Google Scholar] [CrossRef]
  89. López-Rodríguez, N.C.; de Barros, C.M.; Petry, A.C. A macroscopic classification of the embryonic development of the one-sided livebearer Jenynsia multidentata (Teleostei: Anablepidae). Neotrop. Ichthyol. 2017, 15, e160170. [Google Scholar] [CrossRef] [Green Version]
  90. Zandonà, E.; Kajin, M.; Buckup, P.A.; Amaral, J.R.; Souto-Santos, I.C.A.; Reznick, D.N. Mode of maternal provisioning in the fish genus Phalloceros: A variation on the theme of matrotrophy. Biol. J. Linn. Soc. 2021, 134, 867–878. [Google Scholar] [CrossRef]
  91. Zúñiga-Vega, J.J.; Suárez-Rodríguez, M.; Espinosa-Pérez, H.; Johnson, J.B. Morphological and reproductive variation among populations of the Pacific molly Poecilia butleri. J. Fish Biol. 2011, 79, 1029–1046. [Google Scholar] [CrossRef]
  92. Turcotte, M.M.; Pires, M.N.; Vrijenhoek, R.C.; Reznick, D.N. Pre- and post-fertilization maternal provisioning in livebearing fish species and their hybrids (Poeciliidae: Poeciliopsis). Funct. Ecol. 2008, 22, 1118–1124. [Google Scholar] [CrossRef]
  93. Hagmayer, A.; Furness, A.I.; Reznick, D.N.; Dekker, M.L.; Pollux, B.J.A. Predation risk shapes the degree of placentation in natural populations of live-bearing fish. Ecol. Lett. 2020, 23, 831–840. [Google Scholar] [CrossRef] [PubMed]
  94. Marsh-Matthews, E.; Deaton, R. Resources and offspring provisioning: A test of the Trexler-DeAngelis model for matrotrophy evolution. Ecology 2006, 87, 3014–3020. [Google Scholar] [CrossRef]
  95. Trexler, J.C. Resource availability and plasticity in offspring provisioning: Embryo nourishment in Sailfin mollies. Ecology 1997, 78, 1370–1381. [Google Scholar] [CrossRef]
  96. Stewart, J.R. Facultative Placentotrophy and the Evolution of Squamate Placentation: Quality of Eggs and Neonates in Virginia striatula. Am. Nat. 1989, 133, 111–137. [Google Scholar] [CrossRef]
  97. Van Dyke, J.U.; Griffith, O.W.; Thompson, M.B. High food abundance permits the evolution of placentotrophy: Evidence from a placental lizard, Pseudemoia entrecasteauxii. Am. Nat. 2014, 184, 198–210. [Google Scholar] [CrossRef] [Green Version]
  98. Ramírez-Pinilla, M.P. Placental transfer of nutrients during gestation in an Andean population of the highly matrotrophic lizard genus Mabuya (Squamata: Scincidae). Herpetol. Monogr. 2006, 20, 194–204. [Google Scholar] [CrossRef]
  99. Swain, R.; Jones, S.M. Maternal-fetal transfer of 3H-labelled leucine in the viviparous lizard Niveoscincus metallicus (scincidae: Lygosominae). J. Exp. Zool. 1997, 277, 139–145. [Google Scholar] [CrossRef]
  100. Van Dyke, J.U.; Beaupre, S.J. Stable isotope tracer reveals that viviparous snakes transport amino acids to offspring during gestation. J. Exp. Biol. 2012, 215, 760–765. [Google Scholar] [CrossRef] [PubMed]
  101. Haresign, T.W.; Shumway, S. Permeability of the marsupium of the pipefish Syngnathus fuscus to [14C]-alpha amino isobutyric acid. Comp. Biochem. Physiol. Part A Physiol. 1981, 69, 603–604. [Google Scholar] [CrossRef]
  102. Marsh-Matthews, E. Matrotrophy. In Ecology and Evolution of Fishes; Evans, J., Pilastro, A., Eds.; Chicago Press: Chicago, IL, USA, 2011; pp. 18–22. [Google Scholar]
  103. Marsh-Matthews, E.; Brooks, M.; Deaton, R.; Tan, H. Effects of maternal and embryo characteristics on post-fertilization provisioning in fishes of the genus Gambusia. Oecologia 2005, 144, 12–24. [Google Scholar] [CrossRef] [PubMed]
  104. Ripley, J.L.; Foran, C.M. Direct evidence for embryonic uptake of paternally-derived nutrients in two pipefishes (Syngnathidae: Syngnathus spp.). J. Comp. Physiol. B 2008, 179, 325–333. [Google Scholar] [CrossRef]
  105. Kim, J.; Vallet, J. Secreted and Placental Membrane Forms of Folate-Binding Protein Occur Sequentially During Pregnancy in Swine1. Biol. Reprod. 2004, 71, 1214–1219. [Google Scholar] [CrossRef]
Figure 1. The variation in matrotrophy indices and parentotrophy classifications between populations of teleosts. Each species along the x-axis represents a single study, except for Poecilia latipinna (a & b), which come from a single study and represent two populations (population a & population b) one year apart. If there are multiple studies for a single species, each study is separated by species name followed by a number (1–3). Each plotted value for each species represents a separate population within a study, except for Poeciliopsis gracilis 1, which represents the same population across the wet season (classified as lecithotrophy) and dry season (classified as matrotrophy), and Poecilia latipinna. All viviparous MI values were estimated using regression models except for Poeciliopsis turrubararensis and all oviparous species, which used raw mean values. Poecilia caucana includes two populations with an MI of 0.77. The provisioning strategy presented was assigned by each paper based on their specified threshold and statistics. The varying threshold MI and PI values used to classify parentotrophy in different studies are >0.65, >0.7, or ≥1, represented by horizontal lines. There was either no statistics or confirmation of parentotrophy was done by determining whether the population MI was significantly different to 0.7 (refer to Table 1). (V.) represents viviparous species in which an MI has been calculated for at least two populations. (O.) represents oviparous, lecithotrophic species, which were included for comparison.
Biomolecules 13 00166 g001
Table 2. A non-exhaustive list of published parentotrophy indices for teleost species with MI < 0.6 or MI > 1.1, including examples from all known matrotrophic teleost families in which MI/PI studies have been conducted; Anablepidae; Clinidae; Goodeidae; Poeciliidae; Zenarchopteridae. All data are presented as in the resource, to 2 decimal places.
SpeciesMatrotrophy
Index
Classification of Nutrient
Provisioning Strategy
Resource
Ameca splendens150.00Matrotrophy[2]
Clinus superciliosus35.60Matrotrophy[88]
Dermogenys bispina152.00Matrotrophy[49]
Dermogenys orientalis18.35Matrotrophy[49]
Dermogenys sumatrana198.50Matrotrophy[49]
Gambusia rhizophorae1.24Matrotrophy[75]
Gambusia speciosa0.45Lecithotrophy[70]
Gambusia yucatana0.53Lecithotrophy[70]
Hemirhamphodon keukenthali0.58Lecithotrophy[49]
Heterandria formosa14.18Matrotrophy[40]
Jenysia multidentata606.14Matrotrophy[89]
Limia caymanensis0.57Lecithotrophy[77]
Micropoecilia bifurca55.06Matrotrophy[78]
Micropoecilia branneri86.84Matrotrophy[78]
Micropoecilia parae6.33Matrotrophy[78]
Nomorhamphus bakeri3.44Matrotrophy[49]
Nomorhamphus brembachi11.40Matrotrophy[49]
Nomorhamphus manifesta15.80Matrotrophy[49]
Nomorhamphus rossi22.00Matrotrophy[49]
Phallichthys amates0.52Lecithotrophy[25]
Phallichthys tico0.43Lecithotrophy[25]
Phalloceros anisophallos2.80Matrotrophy[71]
2.82Matrotrophy[90]
Phalloceros aspilos2.50Matrotrophy[90]
Phalloceros enneaktinos2.43Matrotrophy[90]
Phalloceros harpagos3.33Matrotrophy[53]
2.52Matrotrophy[90]
Phalloceros leptokeras1.52Matrotrophy[90]
Phalloceros tupinamba2.17Matrotrophy[90]
Phalloceros wai2.64Matrotrophy[90]
Pamphorichthys araguaiensis9.62Matrotrophy[76]
Pamphorichthys hasemani36.37Matrotrophy[76]
Pamphorichthys hollandi21.29Matrotrophy[76]
Pamphorichthys minor1.63Matrotrophy[76]
Pamphorichthys scalpridens16.58Matrotrophy[76]
Poecilia butleri2.30Matrotrophy[91]
Poeciliopsis elongata68.90Matrotrophy[23]
Poeciliopsis lucida1.34Matrotrophy[43]
1.79Matrotrophy[92]
Poeciliopsis occidentalis1.12Matrotrophy[23]
1.50Matrotrophy[39]
Poeciliopsis pleurospilus0.50Lecithotrophy[70]
Poeciliopsis presidionis21.5Matrotrophy[23]
Poeciliopsis prolifica5.40Matrotrophy[23]
7.01Matrotrophy[80]
Poeciliopsis retropinna22.39Matrotrophy[93]
Poeciliopsis turneri41.4Matrotrophy[23]
Xenodexia ctenolepis3.86Matrotrophy[49]
Disclaimer/Publisher’s Note: The statements, opinions and data contained in all publications are solely those of the individual author(s) and contributor(s) and not of MDPI and/or the editor(s). MDPI and/or the editor(s) disclaim responsibility for any injury to people or property resulting from any ideas, methods, instructions or products referred to in the content.

