
Dietary Choice Reshapes Metabolism in Drosophila by Affecting Consumption of Macronutrients

 ,
,  and
and 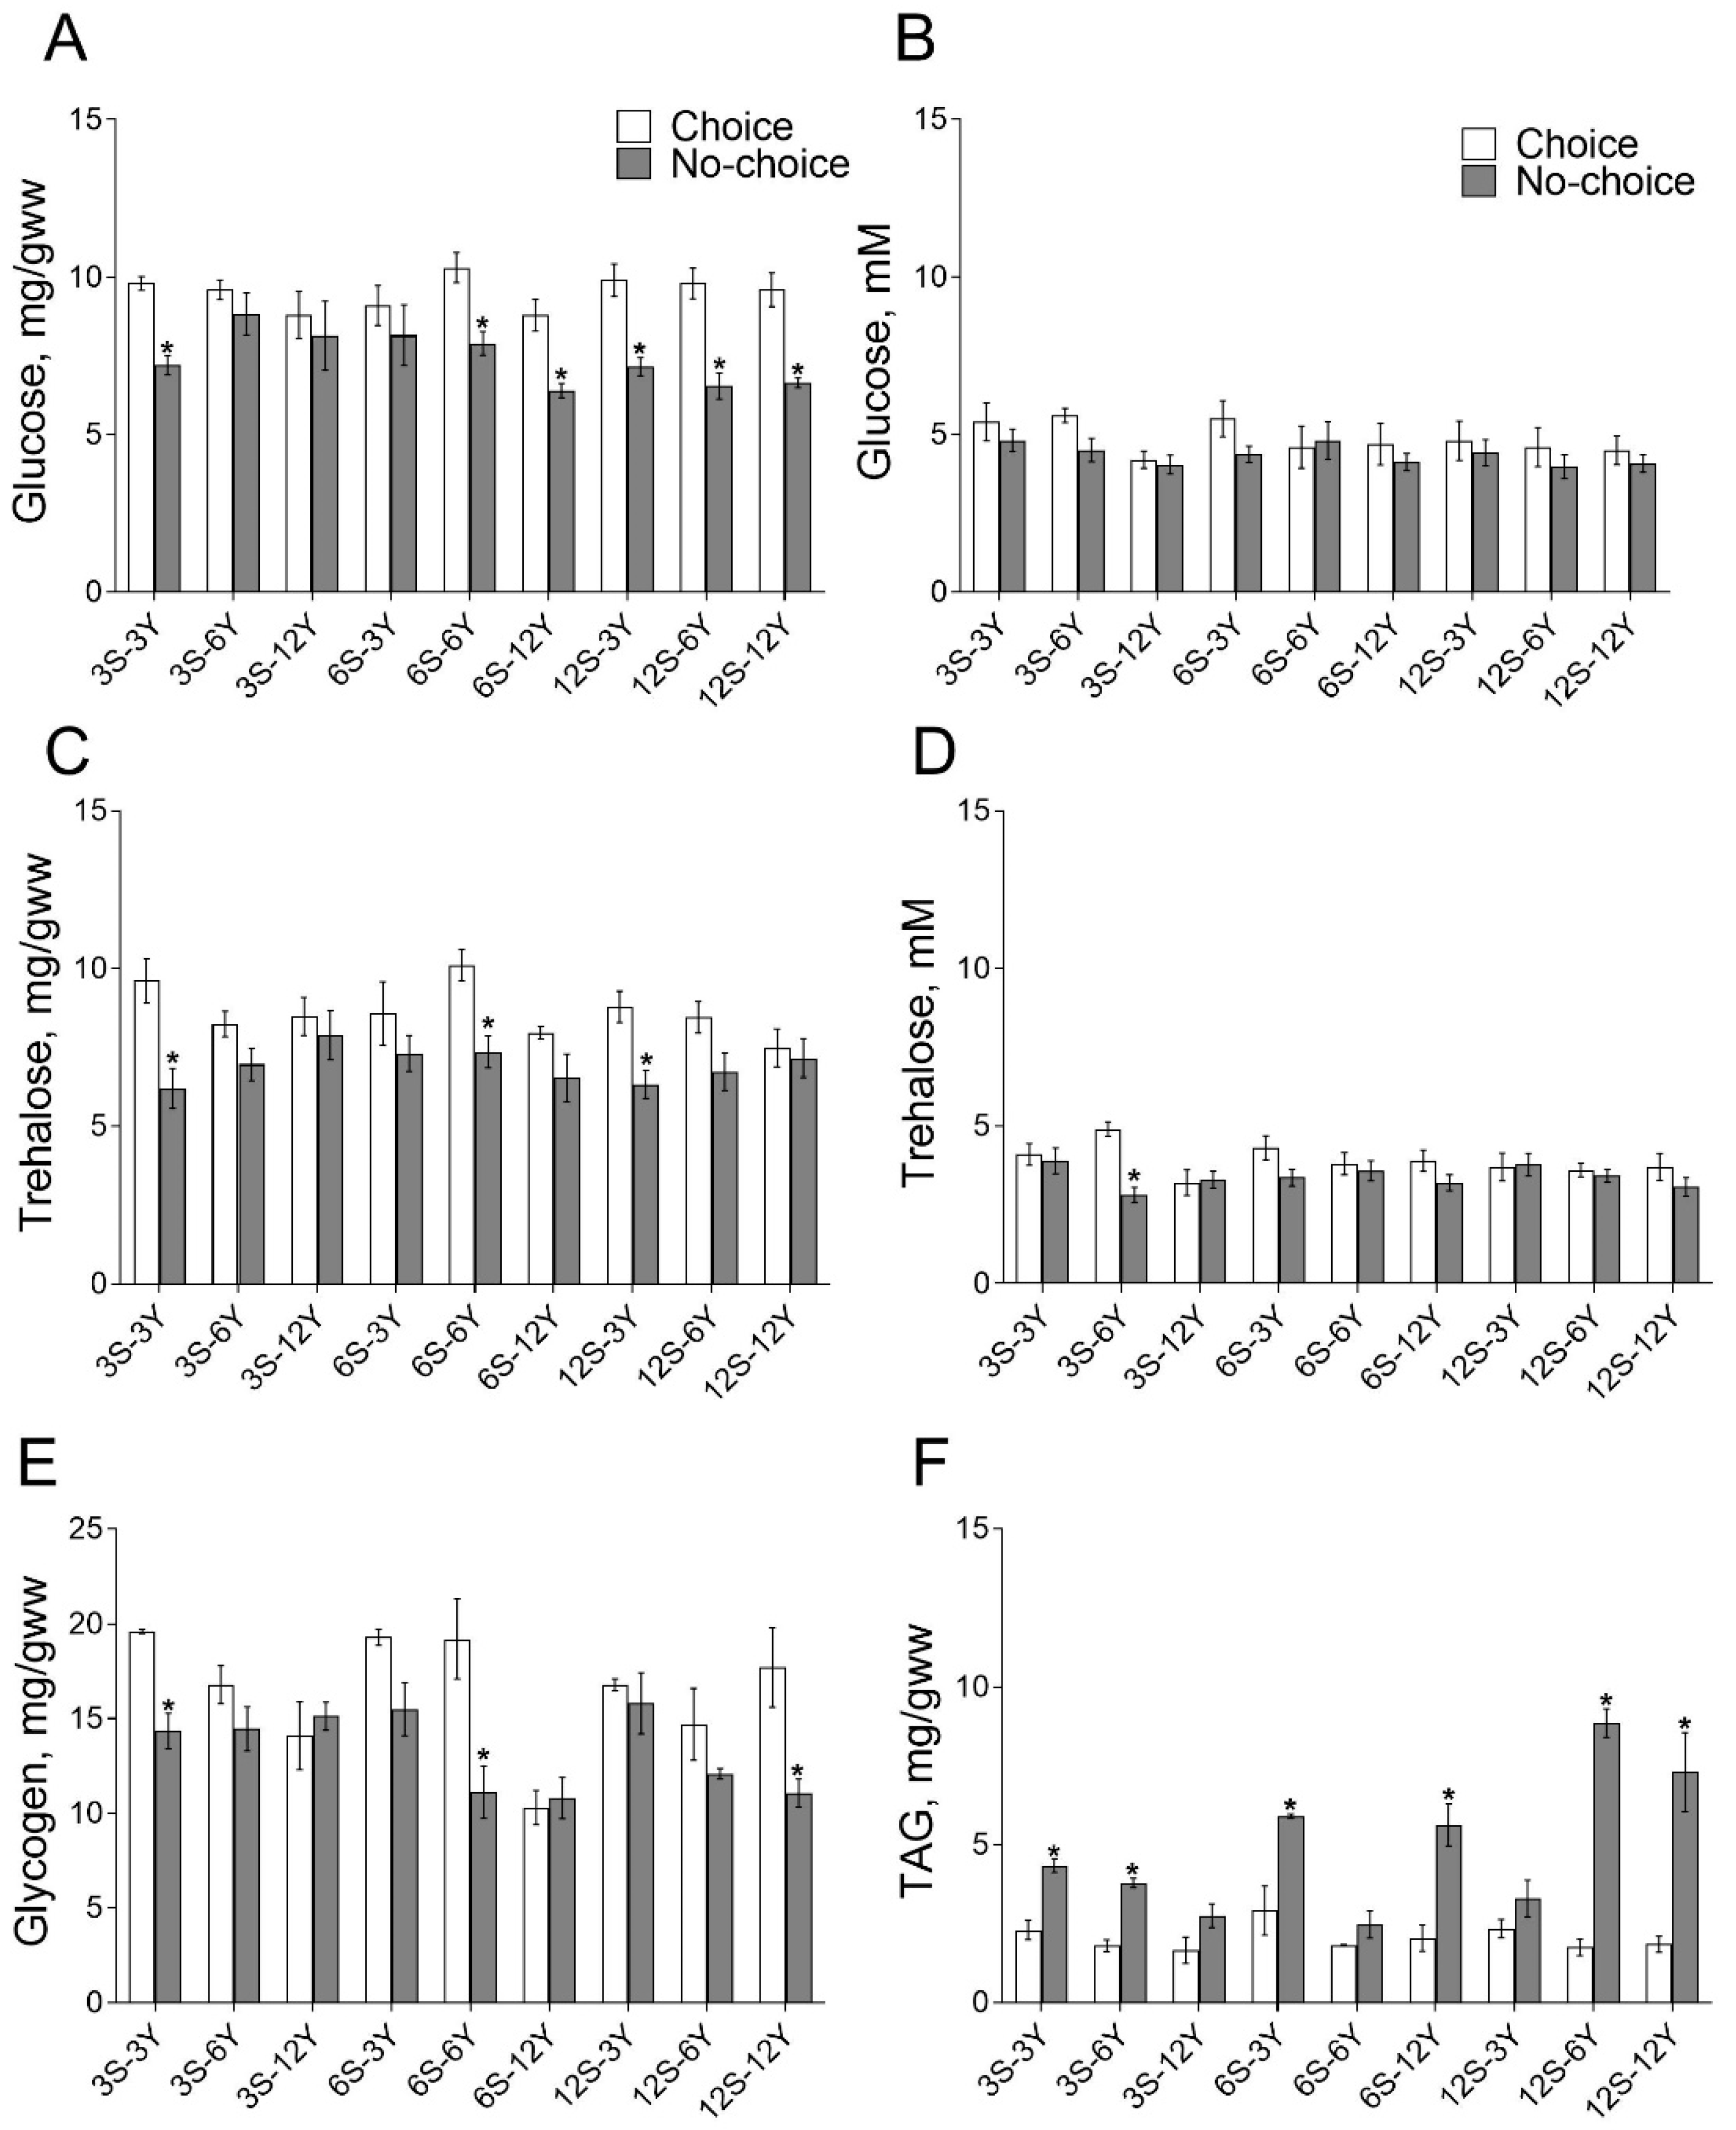
Abstract
:1. Introduction
2. Materials and Methods
2.1. Maintenance of Insects
2.2. Experimental Media
2.3. Feeding
2.4. Metabolites Pool
2.5. Data Analysis
3. Results
3.1. Choice Feeding Affects Metabolites Pools in Drosophila
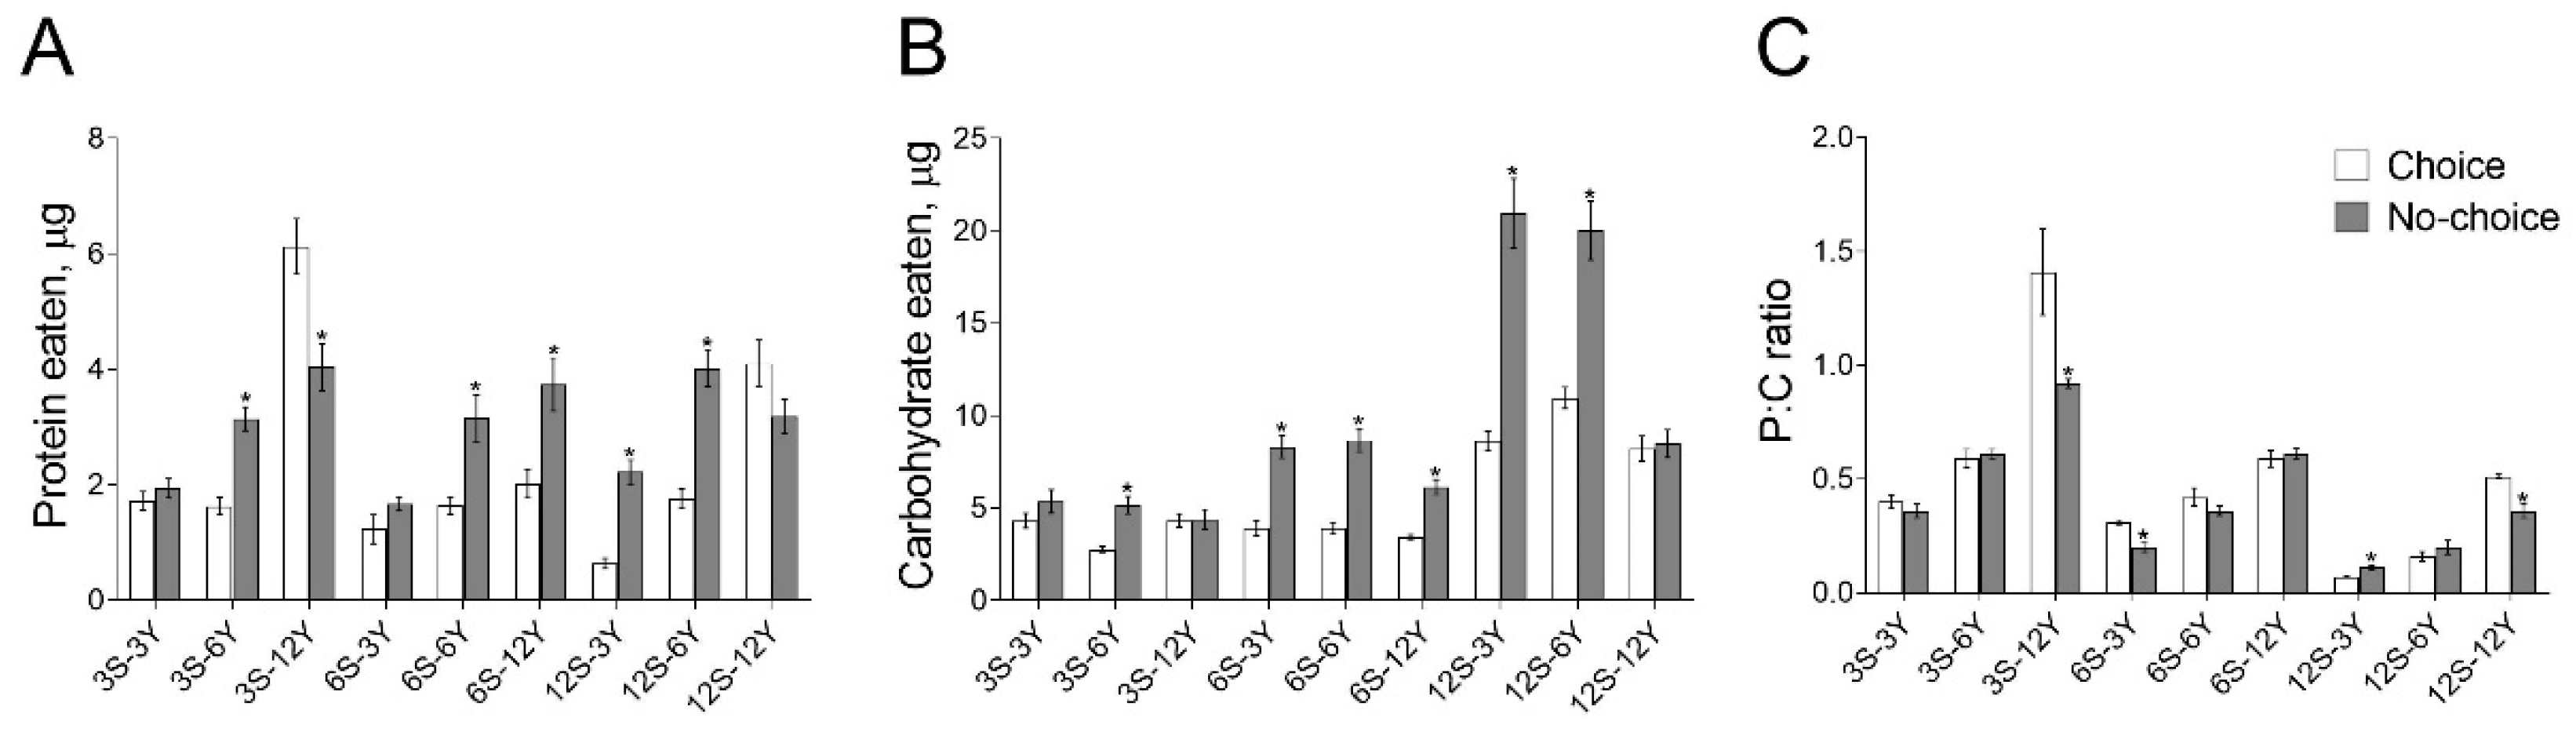
3.2. Food Intake Is Affected by the Choice Feeding
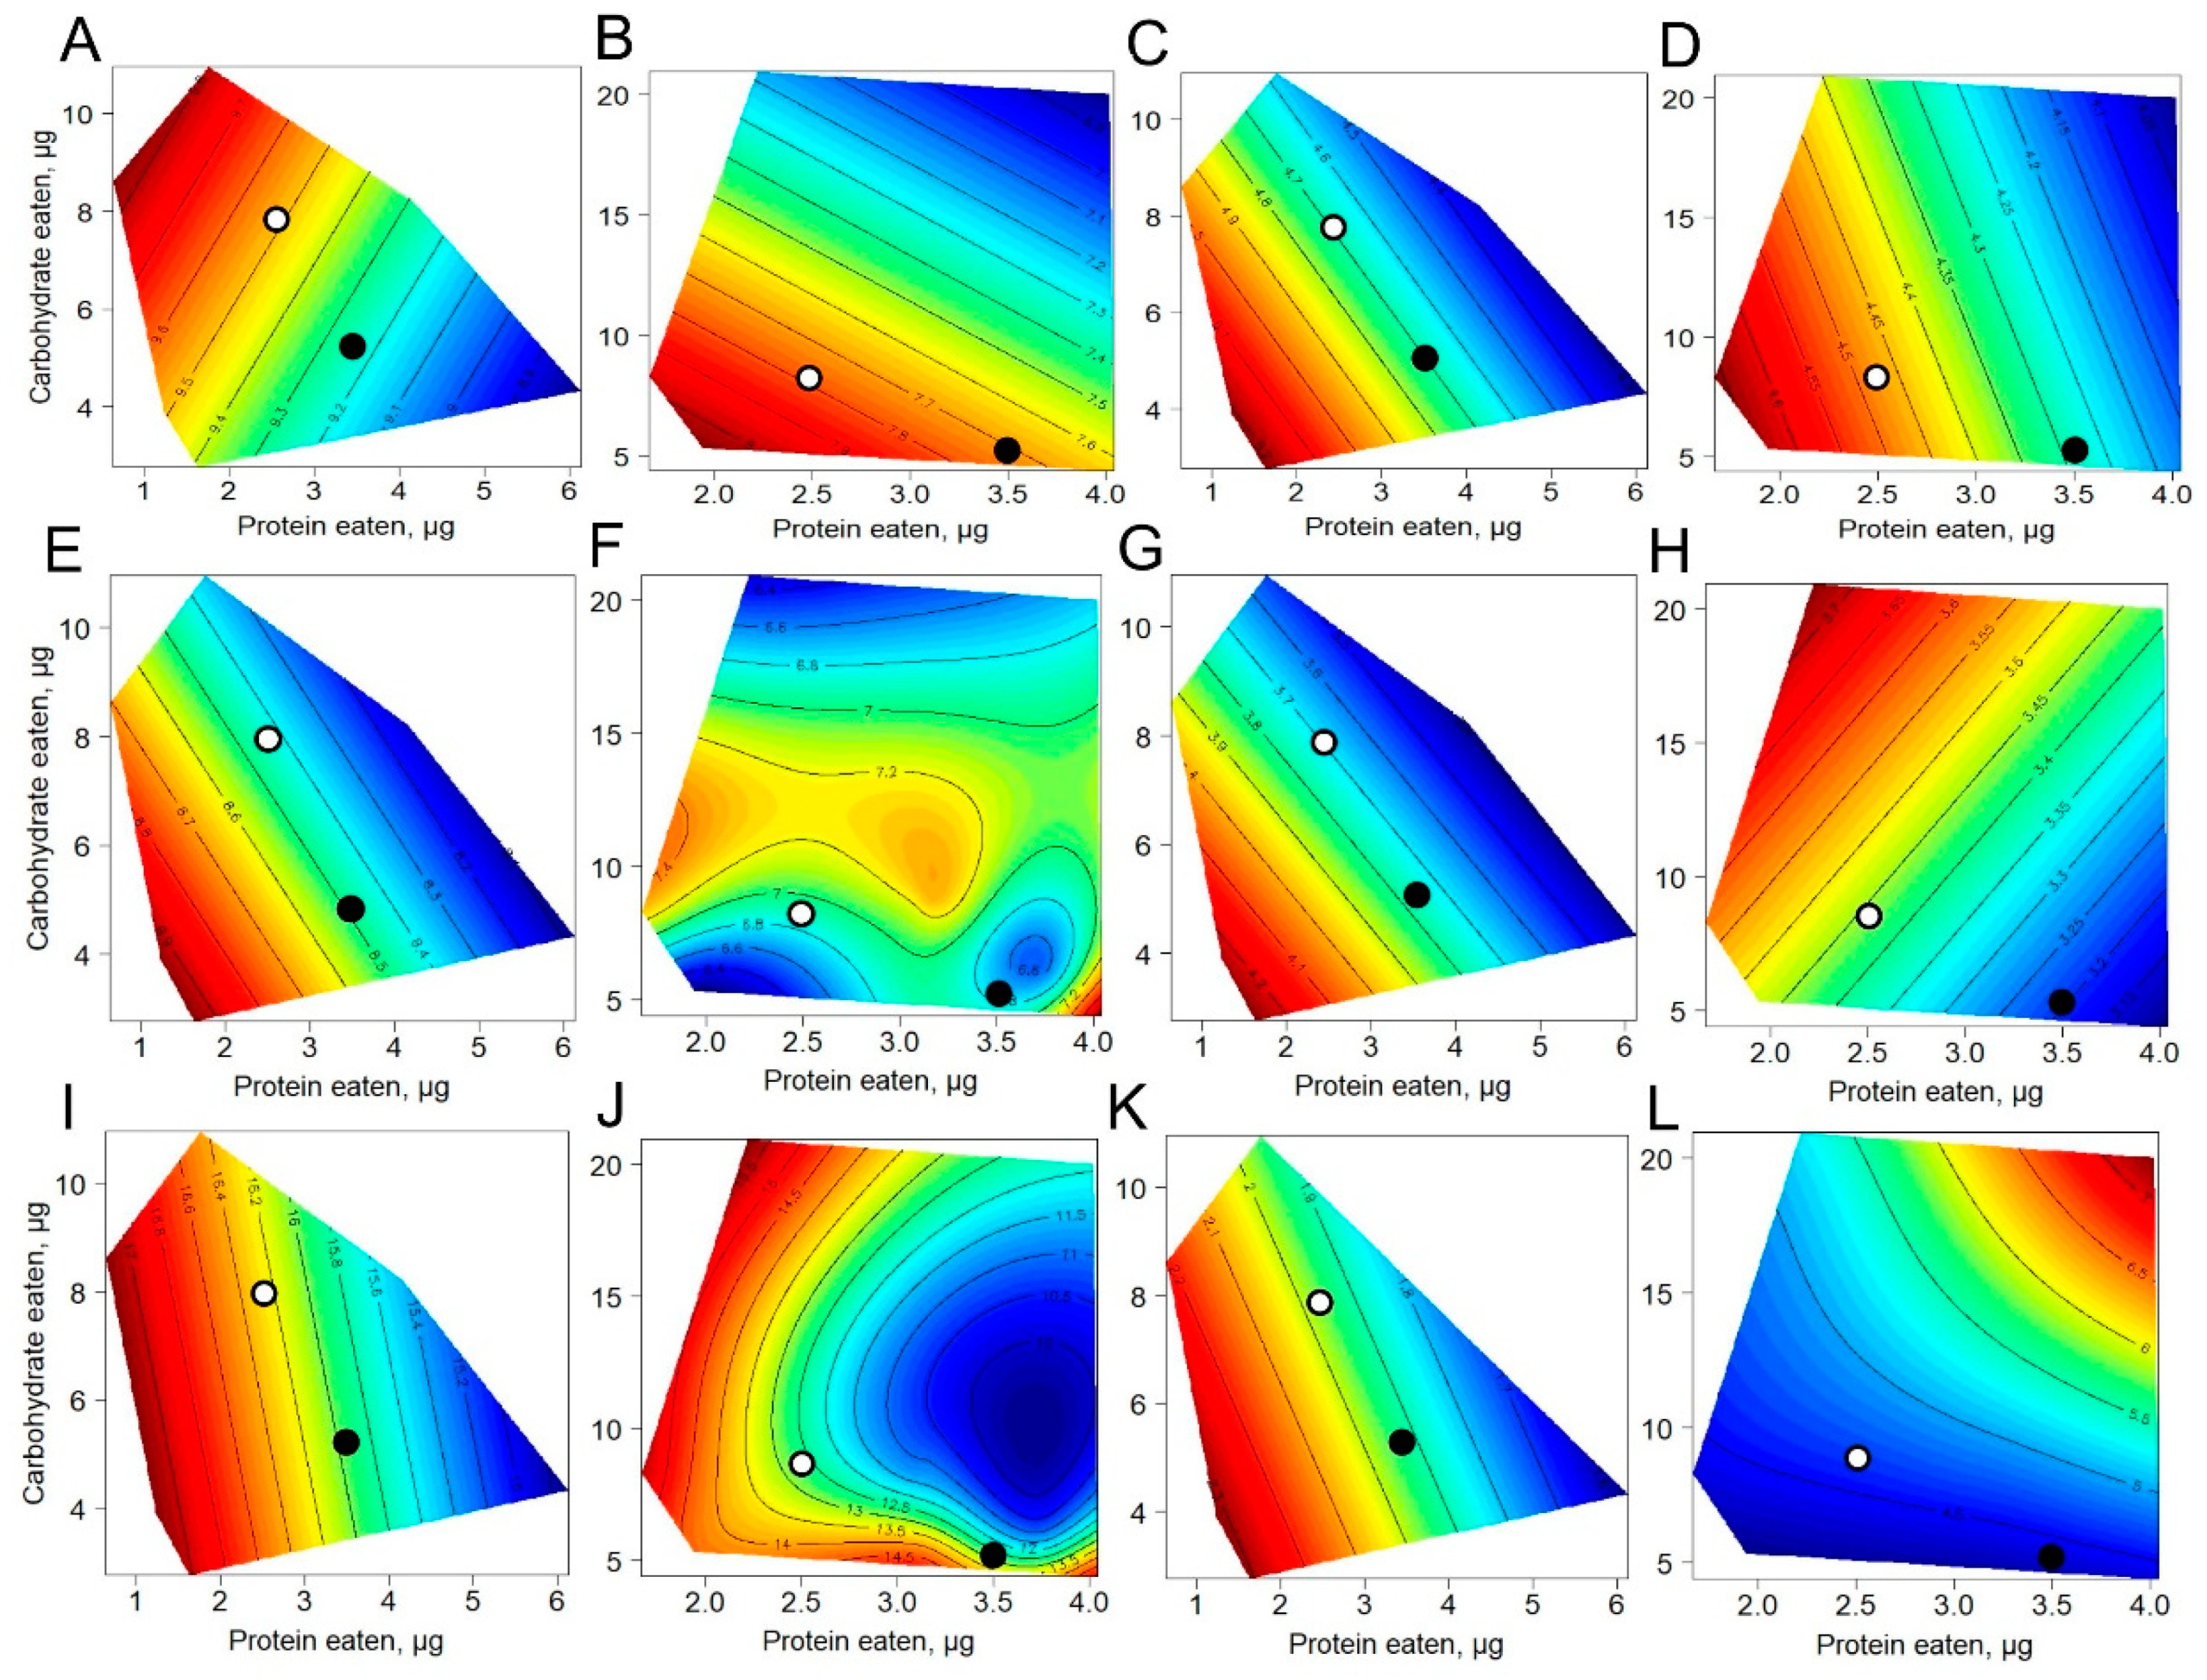
3.3. Effects of Protein and Carbohydrate Intake on Metabolites
4. Discussion
Author Contributions
Funding
Institutional Review Board Statement
Informed Consent Statement
Data Availability Statement
Acknowledgments
Conflicts of Interest
References
- Rovenko, B.; Perkhulyn, N.; Lushcha, K.O.; Storey, J.; Storey, K.; Lushchak, V. Molybdate partly mimics insulin-promoted metabolic effects in Drosophila melanogaster. Comp. Biochem. Physiol. C Toxicol. Pharmacol. 2014, 165, 76–82. [Google Scholar] [CrossRef] [PubMed]
- Semaniuk, U.; Gospodaryov, D.; Feden’ko, K.; Yurkevych, I.; Vaiserman, A.; Storey, K.; Simpson, S.; Lushchak, O. Insulin-like peptides regulate feeding preference and metabolism in Drosophila. Front. Physiol. 2018, 9, 1083. [Google Scholar] [CrossRef] [PubMed]
- Koliada, A.; Gavrilyuk, K.; Burdylyuk, N.; Strilbytska, O.; Storey, K.; Kuharskii, V.; Lushchak, O.; Vaiserman, A. Mating status affects Drosophila lifespan, metabolism and antioxidant system. Comp. Biochem. Physiol. A Mol. Integr. Physiol. 2020, 246, 110716. [Google Scholar] [CrossRef] [PubMed]
- Lushchak, O.; Carlsson, M.; Nässel, D. Food odors trigger an endocrine response that affects food ingestion and metabolism. Cell. Mol. Life Sci. 2015, 72, 3143–3155. [Google Scholar] [CrossRef] [PubMed]
- Strilbytska, O.; Velianyk, V.; Burdyliuk, N.; Yurkevych, I.; Vaiserman, A.; Storey, K.; Pospisilik, A.; Lushchak, O. Parental dietary protein-to-carbohydrate ratio affects offspring lifespan and metabolism in Drosophila. Comp. Biochem. Physiol. A Mol. Integr. Physiol. 2020, 241, 110622. [Google Scholar] [CrossRef] [PubMed]
- Lushchak, O.; Strilbytska, O.; Piskovatska, V.; Storey, K.; Koliada, A.; Vaiserman, A. The role of the TOR pathway in mediating the link between nutrition and longevity. Mech. Ageing Dev. 2017, 164, 127–138. [Google Scholar] [CrossRef] [PubMed]
- Lushchak, O.; Strilbytska, O.; Yurkevych, I.; Vaiserman, A.; Storey, K. Implications of amino acid sensing and dietary protein to the aging process. Exp. Gerontol. 2019, 115, 69–78. [Google Scholar] [CrossRef]
- Heier, C.; Klishch, S.; Stilbytska, O.; Semaniuk, U.; Lushchak, O. The Drosophila model to interrogate triacylglycerol biology. Biochim. Biophys. Acta Mol. Cell Biol. Lipids 2021, 1866, 158924. [Google Scholar] [CrossRef]
- Semaniuk, U.; Strilbytska, O.; Malinovska, K.; Storey, K.; Vaiserman, A.; Lushchak, V.; Lushchak, O. Factors that regulate expression patterns of insulin-like peptides and their association with physiological and metabolic traits in Drosophila. Insect Biochem. Mol. Biol. 2021, 135, 103609. [Google Scholar] [CrossRef]
- Ziegler, A.B.; Berthelot-Grosjean, M.; Grosjean, Y. The smell of love in Drosophila. Front. Physiol. 2013, 4, 72. [Google Scholar] [CrossRef] [Green Version]
- Amrein, H. Mechanism of Taste Perception in Drosophila. In Chemosensory Transduction; Academic Press: Cambridge, UK, 2016; pp. 245–269. [Google Scholar]
- He, L.; Gulyanon, S.; Mihovilovic Skanata, M.; Karagyozov, D.; Heckscher, E.S.; Krieg, M.; Tsechpenakis, G.; Gershow, M.; Tracey, W.D., Jr. Direction selectivity in Drosophila proprioceptors requires the mechanosensory channel Tmc. Curr. Biol. 2019, 29, 945–956.e3. [Google Scholar] [CrossRef] [PubMed]
- Hentze, J.L.; Carlsson, M.A.; Kondo, S.; Nässel, D.R.; Rewitz, K.F. The neuropeptide allatostatin A regulates metabolism and feeding decisions in Drosophila. Sci. Rep. 2015, 5, 11680. [Google Scholar] [CrossRef] [PubMed]
- Dus, M.; Lai, J.S.; Gunapala, K.M.; Min, S.; Tayler, T.D.; Hergarden, A.C.; Geraud, E.; Joseph, C.M.; Suh, G.S. Nutrient sensor in the brain directs the action of the brain-gut axis in Drosophila. Neuron 2015, 87, 139–151. [Google Scholar] [CrossRef] [PubMed]
- Zandawala, M.; Yurgel, M.E.; Texada, M.J.; Liao, S.; Rewitz, K.F.; Keene, A.C.; Nässel, D.R. Modulation of Drosophila post-feeding physiology and behavior by the neuropeptide leucokinin. PLoS Genet. 2018, 14, e1007767. [Google Scholar] [CrossRef] [PubMed]
- Sareen, P.F.; McCurdy, L.Y.; Nitabach, M.N. A neuronal ensemble encoding adaptive choice during sensory conflict in Drosophila. Nat. Commun. 2021, 12, 4131. [Google Scholar] [CrossRef] [PubMed]
- Lyu, Y.; Weaver, K.J.; Shaukat, H.A.; Plumoff, M.L.; Tjilos, M.; Promislow, D.E.; Pletcher, S.D. Drosophila serotonin 2A receptor signaling coordinates central metabolic processes to modulate aging in response to nutrient choice. Elife 2021, 10, e59399. [Google Scholar] [CrossRef]
- Simpson, S.J.; Sibly, R.M.; Lee, K.P.; Behmer, S.T.; Raubenheimer, D. Optimal foraging when regulating intake of multiple nutrients. Anim. Behav. 2004, 68, 1299–1311. [Google Scholar] [CrossRef]
- Lee, K.P.; Simpson, S.J.; Clissold, F.J.; Brooks, R.; Ballard, J.W.; Taylor, P.W.; Soran, N.; Raubenheimer, D. Lifespan and reproduction in Drosophila: New insights from nutritional geometry. Proc. Natl. Acad. Sci. USA 2008, 105, 2498–2503. [Google Scholar] [CrossRef]
- Solon-Biet, S.M.; McMahon, A.C.; Ballard, J.W.; Ruohonen, K.; Wu, L.E.; Cogger, V.C.; Warren, A.; Huang, X.; Pichaud, N.; Melvin, R.G.; et al. The ratio of macronutrients, not caloric intake, dictates cardiometabolic health, aging, and longevity in ad libitum-fed mice. Cell Metab. 2014, 19, 418–430. [Google Scholar] [CrossRef]
- Rovenko, B.M.; Perkhulyn, N.V.; Gospodaryov, D.V.; Sanz, A.; Lushchak, O.V.; Lushchak, V.I. High consumption of fructose rather than glucose promotes a diet-induced obese phenotype in Drosophila melanogaster. Comp. Biochem. Physiol. A Mol. Integr. Physiol. 2015, 180, 75–85. [Google Scholar] [CrossRef]
- Bharucha, K.N.; Tarr, P.; Zipursky, S.L. A glucagon-like endocrine pathway in Drosophila modulates both lipid and carbohydrate homeostasis. J. Exp. Biol. 2008, 211, 3103–3110. [Google Scholar] [CrossRef] [PubMed]
- Söderberg, J.A.; Carlsson, M.A.; Nässel, D.R. Insulin-producing cells in the Drosophila brain also express satiety-inducing cholecystokinin-like peptide, drosulfakinin. Front. Endocrinol. 2012, 3, 109. [Google Scholar] [CrossRef] [PubMed]
- Melcher, C.; Pankratz, M.J. Candidate gustatory interneurons modulating feeding behavior in the Drosophila brain. PLoS Biol. 2005, 3, e305. [Google Scholar] [CrossRef] [PubMed]
- Wu, Q.; Zhang, Y.; Xu, J.; Shen, P. Regulation of hunger-driven behaviors by neural ribosomal S6 kinase in Drosophila. Proc. Natl. Acad. Sci. USA 2005, 102, 13289–13294. [Google Scholar] [CrossRef] [PubMed]
- Carvalho, M.J.; Mirth, C.K. Food intake and food choice are altered by the developmental transition at critical weight in Drosophila melanogaster. Anim. Behav. 2017, 126, 195–208. [Google Scholar] [CrossRef]
- Talbert, M.E.; Barnett, B.; Hoff, R.; Amella, M.; Kuczynski, K.; Lavington, E.; Koury, S.; Brud, E.; Eanes, W.F. Genetic perturbation of key central metabolic genes extends lifespan in Drosophila and affects response to dietary restriction. Proc. Biol. Sci. 2015, 282, 20151646. [Google Scholar] [CrossRef] [PubMed]
- Smith, H.Q.; Li, C.; Stanley, C.A.; Smith, T.J. Glutamate dehydrogenase, a complex enzyme at a crucial metabolic branch point. Neurochem. Res. 2019, 44, 117–132. [Google Scholar] [CrossRef]


Publisher’s Note: MDPI stays neutral with regard to jurisdictional claims in published maps and institutional affiliations. |
© 2022 by the authors. Licensee MDPI, Basel, Switzerland. This article is an open access article distributed under the terms and conditions of the Creative Commons Attribution (CC BY) license (https://creativecommons.org/licenses/by/4.0/).
Share and Cite
Strilbytska, O.; Semaniuk, U.; Bubalo, V.; Storey, K.B.; Lushchak, O. Dietary Choice Reshapes Metabolism in Drosophila by Affecting Consumption of Macronutrients. Biomolecules 2022, 12, 1201. https://doi.org/10.3390/biom12091201
Strilbytska O, Semaniuk U, Bubalo V, Storey KB, Lushchak O. Dietary Choice Reshapes Metabolism in Drosophila by Affecting Consumption of Macronutrients. Biomolecules. 2022; 12(9):1201. https://doi.org/10.3390/biom12091201
Chicago/Turabian StyleStrilbytska, Olha, Uliana Semaniuk, Volodymyr Bubalo, Kenneth B. Storey, and Oleh Lushchak. 2022. "Dietary Choice Reshapes Metabolism in Drosophila by Affecting Consumption of Macronutrients" Biomolecules 12, no. 9: 1201. https://doi.org/10.3390/biom12091201
APA StyleStrilbytska, O., Semaniuk, U., Bubalo, V., Storey, K. B., & Lushchak, O. (2022). Dietary Choice Reshapes Metabolism in Drosophila by Affecting Consumption of Macronutrients. Biomolecules, 12(9), 1201. https://doi.org/10.3390/biom12091201