
Identification of the Antigens Recognised by Colorectal Cancer Patients Using Sera from Patients Who Exhibit a Crohn’s-like Lymphoid Reaction

 , , ,
, , ,  , and
, and 
Abstract

1. Introduction
2. Materials and Methods
2.1. Patient and Healthy Volunteer (HV) Serum Samples
2.2. Immunoscreening of the Testes cDNA Library and Identification of Positive Clones
2.3. Sequence Analysis of cDNA Inserts
2.4. Immunoscreening of Testes Responsive Clones with Sera from Immune-Responsive CRC Patients and HVs
2.5. Microarray Analysis
2.6. IHC
2.7. ELISA
3. Results
3.1. Eighteen Antigens Were Recognised by CLR-CRC Patient Sera
3.2. Two Proteins Were Recognised by CLR-CRC but Not HV Patient Sera
3.3. Confirmation of Ig Heavy Chain Recognition by Patient Sera
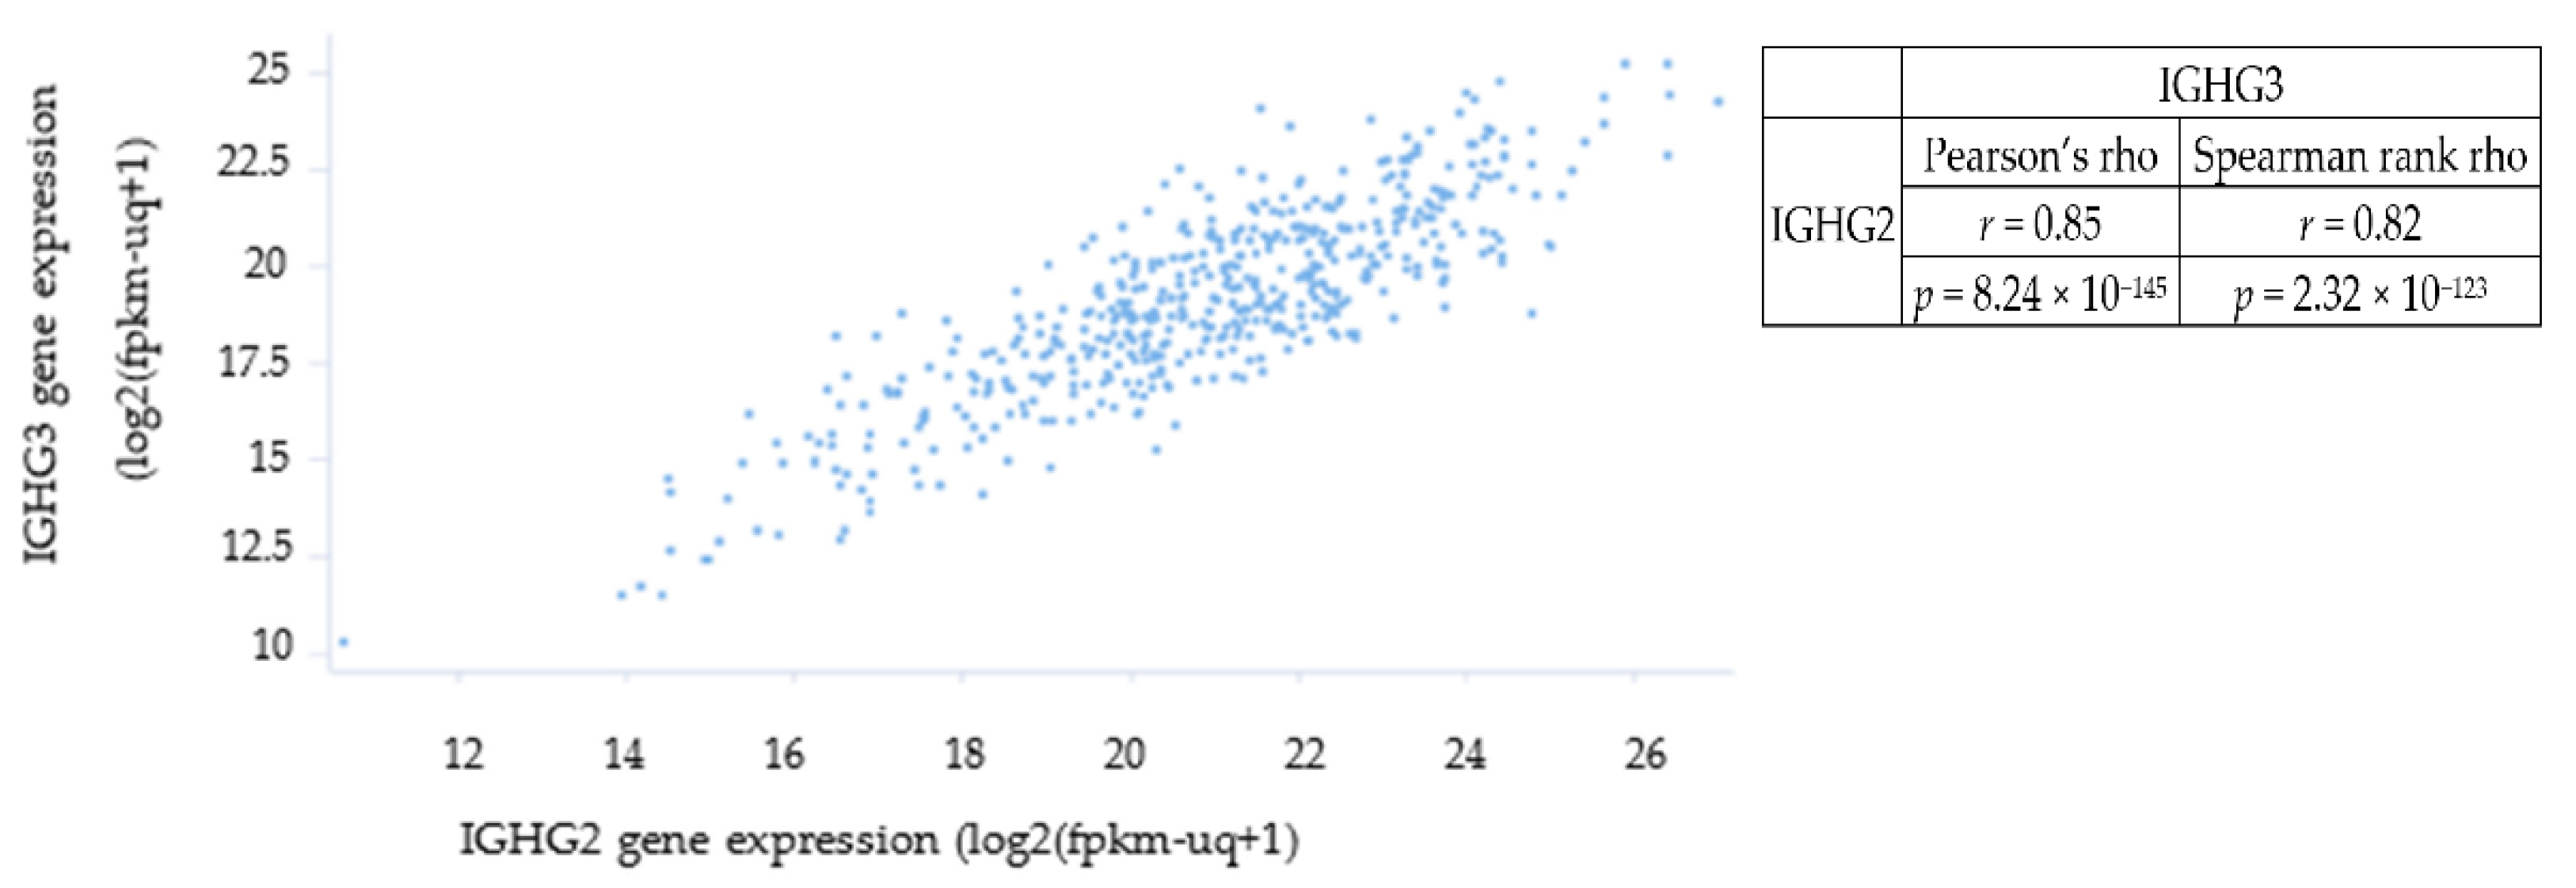
3.4. Only IGHG2 and IGHG3 Had Elevated Transcription in CRC Patient Tissue

| Name | Gene Symbol | Chromosome Localisation | General Function of the Encoded Protein # | SEREX Identified Antigen | Significance in Different Types of Cancer |
|---|---|---|---|---|---|
| UOB-COL-1 | IGHG3 | 14q32.33 | Involvement in a number of molecular, biological and cell-signalling pathways | No | Potential: Diagnostic marker in malignant mesothelioma [21]; Diagnostic and prognostic marker in prostate cancer [22]; Prognostic marker in breast cancer [23]; overexpressed in non-small cell lung carcinoma [24]. |
| UOB-COL-2 | IGHG2 | 14q32.33 | Involvement in a number of molecular, biological and cell-signalling pathways | No | No known tumour-associated properties. |
| UOB-COL-3 | AZFP | 2q21.2 | Novel family of genes with unidentified general function | Yes | Encodes a novel transmembrane zinc finger protein with a KRAB box domain. Found to be overexpressed in a patient with acute myeloid leukaemia and detected with autologous serum, SEREX id: GKT-AML8 [25]. Also found to be overexpressed in CML patients and several cancer cell lines but not in normal donor blood cells. |
| UOB-COL-4 | CYB5R3 | 22q13.2 | Desaturation and elongation of fatty acids, cholesterol biosynthesis, drug metabolism, and, in erythrocyte, methemoglobin reduction | No | Polymorphism associated with increased breast cancer risk [26]. |
| UOB-COL-5 | SLC34A2 | 4p15.2 | pH-sensitive sodium-dependent phosphate transporter | No | Downregulation in A549 (lung adenocarcinoma cells) promotes tumour development [27]; Overexpressed in breast cancer and could act as potential therapeutic target [28]; Its encoded protein (NaPi2b) is targeted by Rebmab200 (humanised monoclonal antibody) in cancer [29]; Potential diagnostic marker in ovarian cancer [30]. |
| UOB-COL-11 | RPL37A | 2q35 | Structural constituent of ribosome | Yes * | Showed to predict response to neoadjuvant doxorubicin and cyclophosphamide in breast cancer patients (as part of a panel of genes) [31]. |
| UOB-COL-16 | SH3RF2 | 5q32 | Promotes cell survival and apoptosis. Inhibits PPP1CA phosphatase activity. | No | Overexpressed in human cancers and regulates PAK4 in colon cancer. Acts as an oncogene and may represent an effective therapeutic target for cancer treatment [32]. |
| UOB-COL-17 | GTF2H5 | 6q25.3 | Functions in gene transcription and DNA repair | No | Likely to be involved in carcinogenesis [33]. |
| UOB-COL-18 | DAPK1 | 9q21.33 | Calcium/calmodulin-dependent serine/threonine kinase involved in multiple cellular signalling pathways that trigger cell survival, apoptosis, and autophagy | No | DAPK promoter methylation may be involved in NSCLC carcinogenesis [34]; DAPK promoter methylation and abnormal expression of DAPK mRNA in acute leukaemia patients [35]; DAPK as potential therapeutic target [36]. |
| SEREX ID | Recognition by CRC-CLR Sera during Immunoscreening | HV Sero-Screening | |||||||||||
|---|---|---|---|---|---|---|---|---|---|---|---|---|---|
| CC005 | CC010 | CC014 | Total | 1 | 2 | 3 | 4 | 5 | 6 | 7 | 8 | Total | |
| UOB-COL-1 | + | + | + | 3/3 | − | − | − | − | − | − | − | − | 0/8 |
| UOB-COL-2 | − | + | + | 2/3 | − | + | + | − | + | + | + | + | 6/8 |
| UOB-COL-3 | − | − | + | 1/3 | + | + | + | + | + | + | + | + | 8/8 |
| UOB-COL-4 | + | + | + | 3/3 | − | + | + | + | + | + | + | + | 7/8 |
| UOB-COL-5 | + | − | + | 2/3 | − | + | + | − | + | + | + | + | 6/8 |
| UOB-COL-6 | + | + | + | 3/3 | − | − | + | + | − | − | − | − | 2/8 |
| UOB-COL-7 | + | + | + | 3/3 | − | − | − | − | − | − | − | − | 0/8 |
| UOB-COL-8 | + | + | − | 2/3 | − | + | + | + | + | + | + | + | 7/8 |
| UOB-COL-9 | + | − | + | 2/3 | + | + | + | − | + | + | + | + | 7/8 |
| UOB-COL-10 | − | + | + | 2/3 | + | + | + | + | + | + | + | + | 8/8 |
| UOB-COL-11 | − | − | + | 1/3 | + | + | + | + | + | + | + | + | 8/8 |
| UOB-COL-12 | − | − | + | 1/3 | − | + | + | − | + | + | + | + | 6/8 |
| UOB-COL-13 | − | − | + | 1/3 | + | + | + | + | + | + | + | + | 8/8 |
| UOB-COL-14 | − | − | + | 1/3 | + | + | + | + | + | + | + | + | 8/8 |
| UOB-COL-15 | − | + | + | 2/3 | 6/14 | 11/14 | 12/14 | 8/14 | 11/14 | 11/14 | 12/14 | 11/14 | 12/14 |
| UOB-COL-16 | + | ND | + | 2/2 | |||||||||
| UOB-COL-17 | + | + | ND | 2/2 | |||||||||
| UOB-COL-18 | + | ND | ND | 1/1 | |||||||||
| Total number of antigens recognised by reactive sera | 10/18 | 9/16 | 15/16 | ||||||||||
| Probeset ID | Gene Symbol | p-Value | Fold-Change |
|---|---|---|---|
| 211868_x_at | IGH///IGHA1///IGHA2///IGHD///IGHG1///IGHG2///IGHG3///IGHM///IGHV4-31 | 2.13 × 10⁻⁵ | 2.69 |
| 211641_x_at | IGHA1///IGHA2///IGHD///IGHG1///IGHG3///IGHM///IGHV4-31 | 0.001 | 2.47 |
| 211637_x_at | IGH///IGHA1///IGHA2///IGHD///IGHG1///IGHG3///IGHG4///IGHM///IGHV3-23///IGHV4-31 | 0.001 | 3.09 |
| 214916_x_at | IGHA1///IGHA2///IGHG1///IGHG3///IGHM///IGHV3-23///IGHV4-31 | 0.002 | 2.62 |
| 211650_x_at | IGH///IGHA1///IGHD///IGHG1///IGHG3///IGHM///IGHV3-23///IGHV4-31 | 0.002 | 2.59 |
| 211639_x_at | IGH///IGHA1///IGHA2///IGHD///IGHG1///IGHG3///IGHG4///IGHM///IGHV4-31 | 0.006 | 2.09 |
| 217281_x_at | IGH///IGHA1///IGHA2///IGHG1///IGHG2///IGHG3///IGHM///IGHV4-31 | 0.0067 | 2.49 |
| 216557_x_at | IGHA1///IGHD///IGHG1///IGHG3///IGHM///IGHV4-31 | 0.007 | 2.49 |
| 211635_x_at | IGHA1///IGHA2///IGHD///IGHG1///IGHG3///IGHG4///IGHM///IGHV4-31 | 0.018 | 2.13 |
3.5. IgG3 Protein Was Not Detected in CRC Primary Tumour Cell Lines
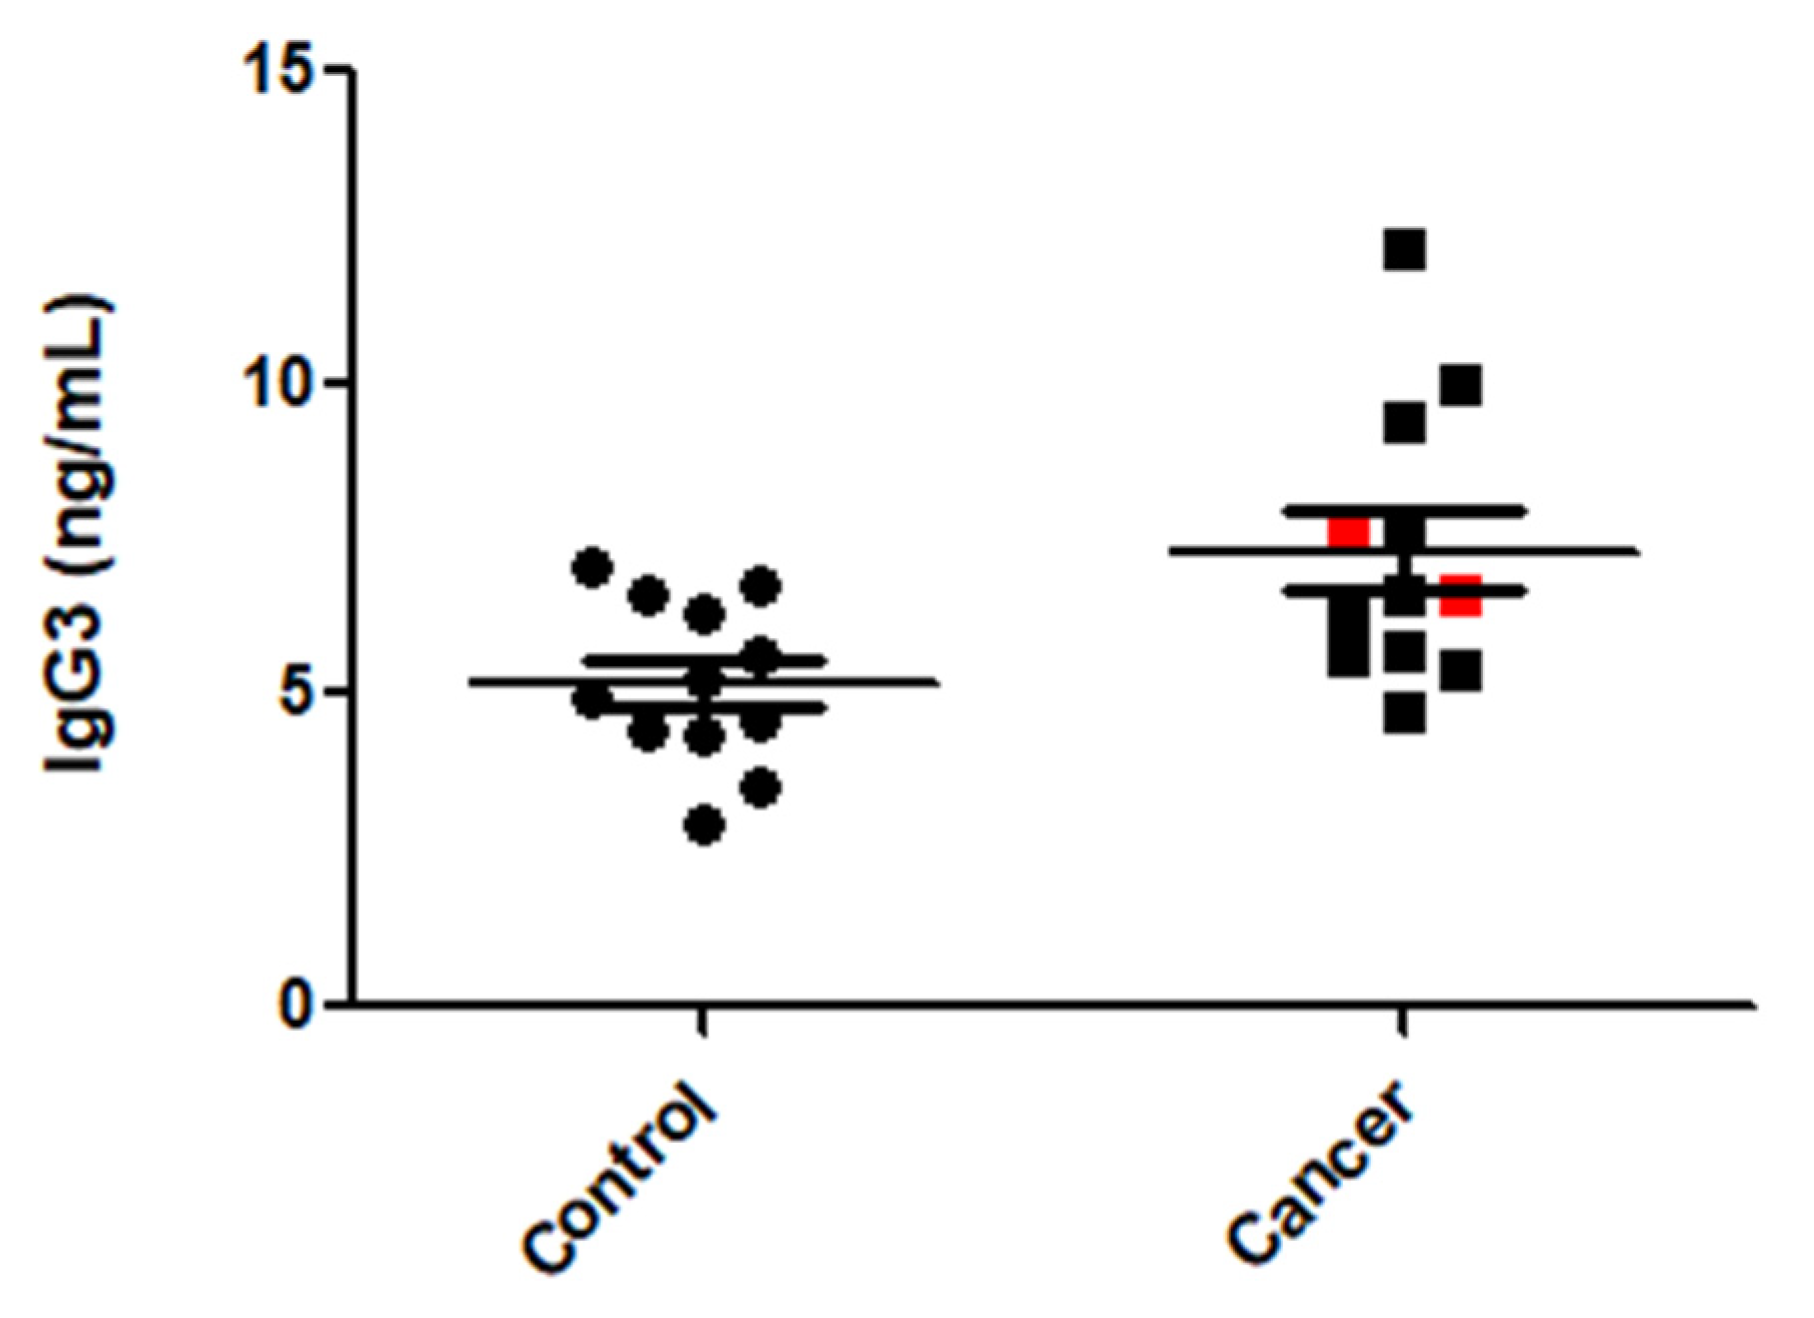
3.6. IgG3 Levels Were Elevated in CRC Patient Sera
3.7. IGH Transcription Was Indicative of Clinical Features of CRC
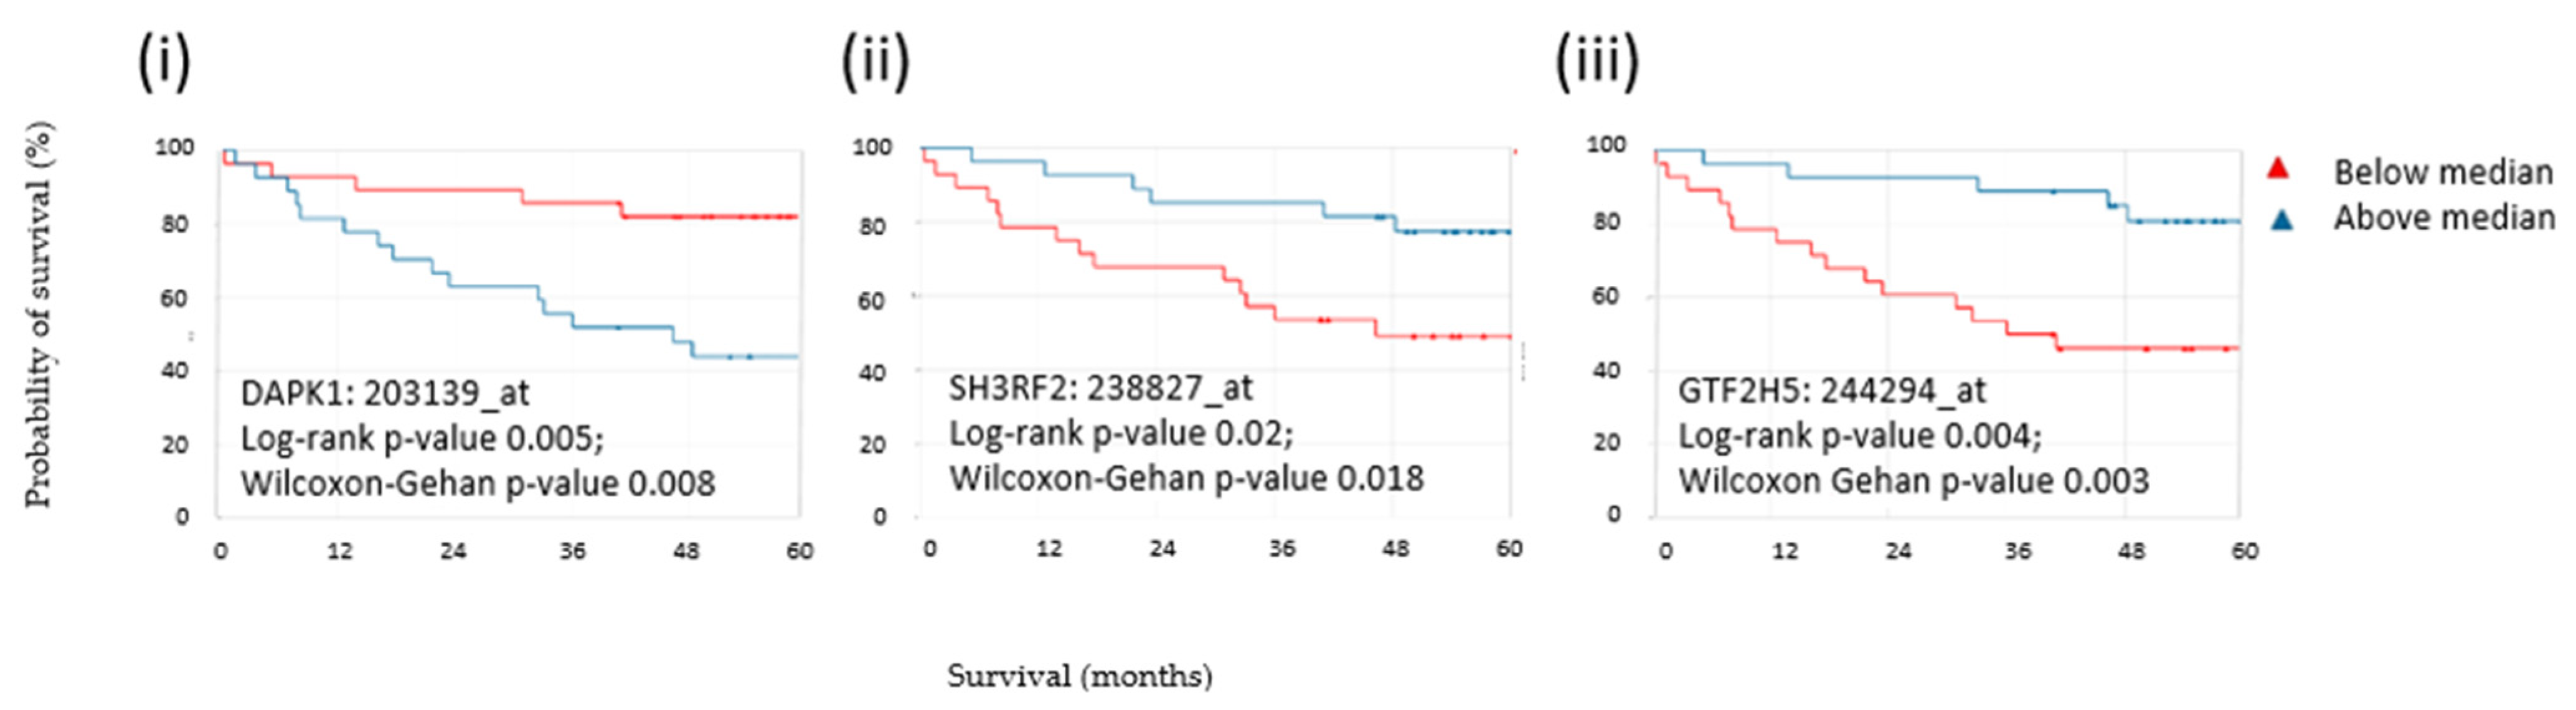
3.8. Expression of Three CLR CRC Antigens Indicated Overall Survival in CRC Patients
4. Discussion
Supplementary Materials
Author Contributions
Funding
Institutional Review Board Statement
Informed Consent Statement
Data Availability Statement
Acknowledgments
Conflicts of Interest
References
- Amin, M.B.; Greene, F.L.; Edge, S.B.; Compton, C.C.; Gershenwald, J.E.; Brookland, R.K.; Meyer, L.; Gress, D.M.; Byrd, D.R.; Winchester, D.P. The Eighth Edition AJCC Cancer Staging Manual: Continuing to build a bridge from a population-based to a more “personalized” approach to cancer staging. CA Cancer J. Clin. 2017, 67, 93–99. [Google Scholar] [CrossRef] [PubMed]
- Cancer Research UK. Bowel Cancer Statistics. 2020. Available online: https://www.cancerresearchuk.org/health-professional/cancer-statistics/statistics-by-cancer-type/bowel-cancer (accessed on 4 February 2020).
- Ganesh, K.; Stadler, Z.K.; Cercek, A.; Mendelsohn, R.B.; Shia, J.; Segal, N.H.; Diaz, L.A., Jr. Immunotherapy in colorectal cancer: Rationale, challenges and potential. Nat. Rev. Gastroenterol. Hepatol. 2019, 16, 361–375. [Google Scholar] [CrossRef] [PubMed]
- Sahin, I.; Ciombor, K.K.; Diaz, L.A.; Yu, J.; Kim, R. Immunotherapy for Microsatellite Stable Colorectal Cancers: Challenges and Novel Therapeutic Avenues. Am. Soc. Clin. Oncol. Educ. Book 2022, 42, 242–253. [Google Scholar] [CrossRef] [PubMed]
- Maoz, A.; Dennis, M.; Greenson, J.K. The Crohn’s-Like Lymphoid Reaction to Colorectal Cancer-Tertiary Lymphoid Structures with Immunologic and Potentially Therapeutic Relevance in Colorectal Cancer. Front. Immunol. 2019, 10, 1884. [Google Scholar] [CrossRef]
- Graham, D.M.; Appelman, H.D. Crohn’s-like lymphoid reaction and colorectal carcinoma: A potential histologic prognosticator. Mod. Pathol. 1990, 3, 332–335. [Google Scholar]
- Murphy, J.; O’Sullivan, G.C.; Lee, G.; Madden, M.; Shanahan, F.; Collins, J.K.; Talbot, I.C. The inflammatory response within Dukes’ B colorectal cancers: Implications for progression of micrometastases and patient survival. Am. J. Gastroenterol. 2000, 95, 3607–3614. [Google Scholar] [CrossRef]
- Boncheva, V.B. The Identification of Tumour Antigens Recognised by Patients with Dukes’ B (Stage II) Reactive Colorectal Cancers Using SEREX. Master’s Thesis, University of Bedfordshire, Luton, UK, 2013. [Google Scholar]
- Mullins, C.S.; Micheel, B.; Matschos, S.; Leuchter, M.; Burtin, F.; Krohn, M.; Huhns, M.; Klar, E.; Prall, F.; Linnebacher, M. Integrated Biobanking and Tumor Model Establishment of Human Colorectal Carcinoma Provides Excellent Tools for Preclinical Research. Cancers 2019, 11, 1520. [Google Scholar] [CrossRef]
- Sahin, U.; Tureci, O.; Schmitt, H.; Cochlovius, B.; Johannes, T.; Schmits, R.; Stenner, F.; Luo, G.; Schobert, I.; Pfreundschuh, M. Human neoplasms elicit multiple specific immune responses in the autologous host. Proc. Natl. Acad. Sci. USA 1995, 92, 11810–11813. [Google Scholar] [CrossRef]
- Liggins, A.P.; Guinn, B.A.; Banham, A.H. Identification of lymphoma-associated antigens using SEREX. Methods Mol. Med. 2005, 115, 109–128. [Google Scholar]
- Landsteiner, K. On agglutination of normal human blood. Transfusion 1961, 1, 5–8. [Google Scholar] [CrossRef]
- Department of Biochemistry, University of Cambridge. Available online: https://www.bioc.cam.ac.uk/dnasequencing/sanger-sequencing (accessed on 14 April 2016).
- Large-Scale Deployment of Embryonic Gene Programming in Human and Murine Colon Cancer: A New Target for Intervention. Available online: https://www.ncbi.nlm.nih.gov/geo/query/acc.cgi?acc=GSE5206 (accessed on 14 April 2016).
- Kaiser, S.; Park, Y.K.; Franklin, J.L.; Halberg, R.B.; Yu, M.; Jessen, W.J.; Freudenberg, J.; Chen, X.; Haigis, K.; Jegga, A.G.; et al. Transcriptional recapitulation and subversion of embryonic colon development by mouse colon tumor models and human colon cancer. Genome Biol. 2007, 8, R131. [Google Scholar] [CrossRef]
- The Cancer Genome Atlas (TCGA) Research Network. Comprehensive molecular characterization of human colon and rectal cancer. Nature 2012, 487, 330–337. [Google Scholar] [CrossRef]
- Li, X.F.; Ren, P.; Shen, W.Z.; Jin, X.; Zhang, J. The expression, modulation and use of cancer-testis antigens as potential biomarkers for cancer immunotherapy. Am. J. Transl. Res. 2020, 12, 7002–7019. [Google Scholar] [PubMed]
- Ramskold, D.; Wang, E.T.; Burge, C.B.; Sandberg, R. An abundance of ubiquitously expressed genes revealed by tissue transcriptome sequence data. PLoS Comput. Biol. 2009, 5, e1000598. [Google Scholar] [CrossRef]
- Chen, Y.T. The journey from autologous typing to SEREX, NY-ESO-1, and cancer/testis antigens. Cancer Immun. 2012, 12, 8. [Google Scholar]
- Guinn, B.A.; Bland, E.A.; Lodi, U.; Liggins, A.P.; Tobal, K.; Petters, S.; Wells, J.W.; Banham, A.H.; Mufti, G.J. Humoral detection of leukaemia-associated antigens in presentation acute myeloid leukaemia. Biochem. Biophys. Res. Commun. 2005, 335, 1293–1304. [Google Scholar] [CrossRef]
- Zhang, X.; Shen, W.; Dong, X.; Fan, J.; Liu, L.; Gao, X.; Kernstine, K.H.; Zhong, L. Identification of novel autoantibodies for detection of malignant mesothelioma. PLoS ONE 2013, 8, e72458. [Google Scholar] [CrossRef]
- Ledet, E.M.; Hu, X.; Sartor, O.; Rayford, W.; Li, M.; Mandal, D. Characterization of germline copy number variation in high-risk African American families with prostate cancer. Prostate 2013, 73, 614–623. [Google Scholar] [CrossRef]
- Bin Amer, S.M.; Maqbool, Z.; Nirmal, M.S.; Qattan, A.T.; Hussain, S.S.; Jeprel, H.A.; Tulbah, A.M.; Malik, O.A.; Al-Tweigeri, T.A. Gene expression profiling in women with breast cancer in a Saudi population. Saudi Med. J. 2008, 29, 507–513. [Google Scholar]
- Remmelink, M.; Mijatovic, T.; Gustin, A.; Mathieu, A.; Rombaut, K.; Kiss, R.; Salmon, I.; Decaestecker, C. Identification by means of cDNA microarray analyses of gene expression modifications in squamous non-small cell lung cancers as compared to normal bronchial epithelial tissue. Int. J. Oncol. 2005, 26, 247–258. [Google Scholar] [CrossRef]
- Collin, J.F.; Wells, J.W.; Czepulkowski, B.; Lyne, L.; Duriez, P.J.; Banham, A.H.; Mufti, G.J.; Guinn, B.A. A novel zinc finger gene, ZNF465, is inappropriately expressed in acute myeloid leukaemia cells. Genes Chromosomes Cancer 2015, 54, 288–302. [Google Scholar] [CrossRef] [PubMed]
- Blanke, K.L.; Sacco, J.C.; Millikan, R.C.; Olshan, A.F.; Luo, J.; Trepanier, L.A. Polymorphisms in the carcinogen detoxification genes CYB5A and CYB5R3 and breast cancer risk in African American women. Cancer Causes Control 2014, 25, 1513–1521. [Google Scholar] [CrossRef] [PubMed]
- Yang, W.; Wang, Y.; Pu, Q.; Ye, S.; Ma, Q.; Ren, J.; Zhong, G.; Liu, L.; Zhu, W. Elevated expression of SLC34A2 inhibits the viability and invasion of A549 cells. Mol. Med. Rep. 2014, 10, 1205–1214. [Google Scholar] [CrossRef] [PubMed]
- Chen, Z.; Li, M.; Yuan, Y.; Wang, Q.; Yan, L.; Gu, J. Cancer/testis antigens and clinical risk factors for liver metastasis of colorectal cancer: A predictive panel. Dis. Colon. Rectum 2010, 53, 31–38. [Google Scholar] [CrossRef]
- Lopes dos Santos, M.; Yeda, F.P.; Tsuruta, L.R.; Horta, B.B.; Pimenta, A.A., Jr.; Degaki, T.L.; Soares, I.C.; Tuma, M.C.; Okamoto, O.K.; Alves, V.A.; et al. Rebmab200, a humanized monoclonal antibody targeting the sodium phosphate transporter NaPi2b displays strong immune mediated cytotoxicity against cancer: A novel reagent for targeted antibody therapy of cancer. PLoS ONE 2013, 8, e70332. [Google Scholar] [CrossRef]
- Shyian, M.; Gryshkova, V.; Kostianets, O.; Gorshkov, V.; Gogolev, Y.; Goncharuk, I.; Nespryadko, S.; Vorobjova, L.; Filonenko, V.; Kiyamova, R. Quantitative analysis of SLC34A2 expression in different types of ovarian tumors. Exp. Oncol. 2011, 33, 94–98. [Google Scholar]
- Barros Filho, M.C.; Katayama, M.L.; Brentani, H.; Abreu, A.P.; Barbosa, E.M.; Oliveira, C.T.; Goes, J.C.; Brentani, M.M.; Folgueira, M.A. Gene trio signatures as molecular markers to predict response to doxorubicin cyclophosphamide neoadjuvant chemotherapy in breast cancer patients. Braz. J. Med. Biol. Res. 2010, 43, 1225–1231. [Google Scholar] [CrossRef]
- Kim, T.W.; Kang, Y.K.; Park, Z.Y.; Kim, Y.H.; Hong, S.W.; Oh, S.J.; Sohn, H.A.; Yang, S.J.; Jang, Y.J.; Lee, D.C.; et al. SH3RF2 functions as an oncogene by mediating PAK4 protein stability. Carcinogenesis 2014, 35, 624–634. [Google Scholar] [CrossRef]
- Zhang, Q.; Zhang, J.; Jin, H.; Sheng, S. Whole transcriptome sequencing identifies tumor-specific mutations in human oral squamous cell carcinoma. BMC Med. Genom. 2013, 6, 28. [Google Scholar] [CrossRef]
- Li, F.F.; Yang, Y.; Wang, X.L.; Hong, Y.Y.; Wang, N.F.; Chen, Z.D. Promoter methylation of DAPK gene may contribute to the pathogenesis of nonsmall cell lung cancer: A meta-analysis. Tumour Biol. 2014, 35, 6011–6020. [Google Scholar] [CrossRef]
- Niu, Y.M.; Wang, P.P.; Wang, Y.; Wang, Y.Z.; Cai, D.L.; Li, Y. Expression of death-associated protein kinase gene and methylation status of promoter region in acute leukemia. Zhongguo Shi Yan Xue Ye Xue Za Zhi 2014, 22, 30–34. [Google Scholar] [CrossRef]
- Huang, Y.; Chen, L.; Guo, L.; Hupp, T.R.; Lin, Y. Evaluating DAPK as a therapeutic target. Apoptosis 2014, 19, 371–386. [Google Scholar] [CrossRef]
- Zheng, H.; Li, M.; Ren, W.; Zeng, L.; Liu, H.D.; Hu, D.; Deng, X.; Tang, M.; Shi, Y.; Gong, J.; et al. Expression and secretion of immunoglobulin alpha heavy chain with diverse VDJ recombinations by human epithelial cancer cells. Mol. Immunol. 2007, 44, 2221–2227. [Google Scholar] [CrossRef]
- Leibovitz, A.; Stinson, J.C.; McCombs, W.B., III; McCoy, C.E.; Mazur, K.C.; Mabry, N.D. Classification of human colorectal adenocarcinoma cell lines. Cancer Res. 1976, 36, 4562–4569. [Google Scholar]
- Brattain, M.G.; Brattain, D.E.; Fine, W.D.; Khaled, F.M.; Marks, M.E.; Kimball, P.M.; Arcolano, L.A.; Danbury, B.H. Initiation and characterization of cultures of human colonic carcinoma with different biological characteristics utilizing feeder layers of confluent fibroblasts. Oncodevelopmental Biol. Med. 1981, 2, 355–366. [Google Scholar]
- Smith, J.J.; Deane, N.G.; Wu, F.; Merchant, N.B.; Zhang, B.; Jiang, A.; Lu, P.; Johnson, J.C.; Schmidt, C.; Bailey, C.E.; et al. Experimentally derived metastasis gene expression profile predicts recurrence and death in patients with colon cancer. Gastroenterology 2010, 138, 958–968. [Google Scholar] [CrossRef]
- Lawrance, I.C.; Fiocchi, C.; Chakravarti, S. Ulcerative colitis and Crohn’s disease: Distinctive gene expression profiles and novel susceptibility candidate genes. Hum. Mol. Genet. 2001, 10, 445–456. [Google Scholar] [CrossRef]
- Qiu, X.; Zhu, X.; Zhang, L.; Mao, Y.; Zhang, J.; Hao, P.; Li, G.; Lv, P.; Li, Z.; Sun, X.; et al. Human epithelial cancers secrete immunoglobulin g with unidentified specificity to promote growth and survival of tumor cells. Cancer Res. 2003, 63, 6488–6495. [Google Scholar]
- Li, M.; Feng, D.Y.; Ren, W.; Zheng, L.; Zheng, H.; Tang, M.; Cao, Y. Expression of immunoglobulin kappa light chain constant region in abnormal human cervical epithelial cells. Int. J. Biochem. Cell Biol. 2004, 36, 2250–2257. [Google Scholar] [CrossRef]
- Chen, Z.; Gu, J. Immunoglobulin G expression in carcinomas and cancer cell lines. FASEB J. 2007, 21, 2931–2938. [Google Scholar] [CrossRef]
- Wang, J.; Lin, D.; Peng, H.; Huang, Y.; Huang, J.; Gu, J. Cancer-derived immunoglobulin G promotes tumor cell growth and proliferation through inducing production of reactive oxygen species. Cell Death Dis. 2013, 4, e945. [Google Scholar] [CrossRef] [PubMed]
- Jiang, C.; Huang, T.; Wang, Y.; Huang, G.; Wan, X.; Gu, J. Immunoglobulin G expression in lung cancer and its effects on metastasis. PLoS ONE 2014, 9, e97359. [Google Scholar] [CrossRef] [PubMed]
- Liao, Q.; Liu, W.; Liu, Y.; Wang, F.; Wang, C.; Zhang, J.; Chu, M.; Jiang, D.; Xiao, L.; Shao, W.; et al. Aberrant high expression of immunoglobulin G in epithelial stem/progenitor-like cells contributes to tumor initiation and metastasis. Oncotarget 2015, 6, 40081–40094. [Google Scholar] [CrossRef] [PubMed]
- Tang, J.; Zhang, J.; Liu, Y.; Liao, Q.; Huang, J.; Geng, Z.; Xu, W.; Sheng, Z.; Lee, G.; Zhang, Y.; et al. Lung squamous cell carcinoma cells express non-canonically glycosylated IgG that activates integrin-FAK signaling. Cancer Lett. 2018, 430, 148–159. [Google Scholar] [CrossRef]
- Sheng, Z.; Liu, Y.; Qin, C.; Liu, Z.; Yuan, Y.; Hu, F.; Du, Y.; Yin, H.; Qiu, X.; Xu, T. IgG is involved in the migration and invasion of clear cell renal cell carcinoma. J. Clin. Pathol. 2016, 69, 497–504. [Google Scholar] [CrossRef]
- Barbera-Guillem, E.; Nyhus, J.K.; Wolford, C.C.; Friece, C.R.; Sampsel, J.W. Vascular endothelial growth factor secretion by tumor-infiltrating macrophages essentially supports tumor angiogenesis, and IgG immune complexes potentiate the process. Cancer Res. 2002, 62, 7042–7049. [Google Scholar]
- Geng, Z.H.; Ye, C.X.; Huang, Y.; Jiang, H.P.; Ye, Y.J.; Wang, S.; Zhou, Y.; Shen, Z.L.; Qiu, X.Y. Human colorectal cancer cells frequently express IgG and display unique Ig repertoire. World J. Gastrointest. Oncol. 2019, 11, 195–207. [Google Scholar] [CrossRef]
- Hsu, H.M.; Chu, C.M.; Chang, Y.J.; Yu, J.C.; Chen, C.T.; Jian, C.E.; Lee, C.Y.; Chiang, Y.T.; Chang, C.W.; Chang, Y.T. Six novel immunoglobulin genes as biomarkers for better prognosis in triple-negative breast cancer by gene co-expression network analysis. Sci. Rep. 2019, 9, 4484. [Google Scholar] [CrossRef]
- Niu, N.; Zhang, J.; Huang, T.; Sun, Y.; Chen, Z.; Yi, W.; Korteweg, C.; Wang, J.; Gu, J. IgG expression in human colorectal cancer and its relationship to cancer cell behaviors. PLoS ONE 2012, 7, e47362. [Google Scholar] [CrossRef]
- Xu, Q.; Zhang, Z.; Chen, Z.; Zhang, B.; Zhao, C.; Zhang, Y.; Zhao, C.; Deng, X.; Zhou, Y.; Wu, Y.; et al. Nonspecific immunoglobulin G is effective in preventing and treating cancer in mice. Cancer Manag. Res. 2019, 11, 2073–2085. [Google Scholar] [CrossRef]
- Shoenfeld, Y.; Katz, U. IVIg therapy in autoimmunity and related disorders: Our experience with a large cohort of patients. Autoimmunity 2005, 38, 123–137. [Google Scholar] [CrossRef]
- Krause, I.; Shoenfeld, Y. Intravenous immunoglobulin treatment for fibrosis, atherosclerosis, and malignant conditions. Methods Mol. Med. 2005, 109, 403–408. [Google Scholar] [CrossRef]
- Sobieszczanska, M.; Tubek, S.; Poplicha, D.; Grabelus, A.; Pawelczak, J. Henoch-Schonlein purpura (HSP) and high-dose immunoglobulin treatment in patient with familiar prostatic adenocarcinoma. Hum. Vaccines Immunother. 2014, 10, 358–359. [Google Scholar] [CrossRef]
- Shang, Y.; Zhang, X.; Lu, L.; Jiang, K.; Krohn, M.; Matschos, S.; Mullins, C.S.; Vollmar, B.; Zechner, D.; Gong, P.; et al. Pharmaceutical immunoglobulin G impairs anti-carcinoma activity of oxaliplatin in colon cancer cells. Br. J. Cancer 2021, 124, 1411–1420. [Google Scholar] [CrossRef]
- Mon, M.M.; Srisomsap, C.; Chokchaichamnankit, D.; Watcharatanyatip, K.; Weeraphan, C.; Svasti, J.; Maneechai, K.; Thongsuksai, P.; Raungrut, P. Serum Proteomic Profiling Reveals Differentially Expressed IGHG3 and A1AG1 as Potential Predictors of Chemotherapeutic Response in Advanced Non-small Cell Lung Cancer. Anticancer Res. 2021, 41, 1871–1882. [Google Scholar] [CrossRef]
- Rhoads, K.; Sacco, J.C.; Drescher, N.; Wong, A.; Trepanier, L.A. Individual variability in the detoxification of carcinogenic arylhydroxylamines in human breast. Toxicol. Sci. 2011, 121, 245–256. [Google Scholar] [CrossRef][Green Version]
- Lund, R.R.; Leth-Larsen, R.; Caterino, T.D.; Terp, M.G.; Nissen, J.; Laenkholm, A.V.; Jensen, O.N.; Ditzel, H.J. NADH-Cytochrome b5 Reductase 3 Promotes Colonization and Metastasis Formation and Is a Prognostic Marker of Disease-Free and Overall Survival in Estrogen Receptor-Negative Breast Cancer. Mol. Cell Proteom. 2015, 14, 2988–2999. [Google Scholar] [CrossRef]
- MacDonald, T.J.; Pollack, I.F.; Okada, H.; Bhattacharya, S.; Lyons-Weiler, J. Progression-associated genes in astrocytoma identified by novel microarray gene expression data reanalysis. Methods Mol. Biol. 2007, 377, 203–222. [Google Scholar] [CrossRef]
- Serao, N.V.; Delfino, K.R.; Southey, B.R.; Beever, J.E.; Rodriguez-Zas, S.L. Cell cycle and aging, morphogenesis, and response to stimuli genes are individualized biomarkers of glioblastoma progression and survival. BMC Med. Genom. 2011, 4, 49. [Google Scholar] [CrossRef]
- Liu, L.; Yang, Y.; Zhou, X.; Yan, X.; Wu, Z. Solute carrier family 34 member 2 overexpression contributes to tumor growth and poor patient survival in colorectal cancer. Biomed. Pharmacother. 2018, 99, 645–654. [Google Scholar] [CrossRef]
- Satoh, A.; Toyota, M.; Itoh, F.; Kikuchi, T.; Obata, T.; Sasaki, Y.; Suzuki, H.; Yawata, A.; Kusano, M.; Fujita, M.; et al. DNA methylation and histone deacetylation associated with silencing DAP kinase gene expression in colorectal and gastric cancers. Br. J. Cancer 2002, 86, 1817–1823. [Google Scholar] [CrossRef] [PubMed]
- Zhao, W.-H.; Meng, F.Y.; Lai, Y.-R.; Peng, Z.-G.; Ma, J. Promoter methylation and expression of death-associated protein kinase gene in acute leukemia. Nan Fang Yi Ke Da Xue Xue Bao (Natl. Libr. Med.) 2017, 37, 407–410. [Google Scholar] [CrossRef]
- Steinmann, S.; Kunze, P.; Hampel, C.; Eckstein, M.; Bertram Bramsen, J.; Muenzner, J.K.; Carle, B.; Ndreshkjana, B.; Kemenes, S.; Gasparini, P.; et al. DAPK1 loss triggers tumor invasion in colorectal tumor cells. Cell Death Dis. 2019, 10, 895. [Google Scholar] [CrossRef] [PubMed]
- Ivanovska, J.; Zlobec, I.; Forster, S.; Karamitopoulou, E.; Dawson, H.; Koelzer, V.H.; Agaimy, A.; Garreis, F.; Soder, S.; Laqua, W.; et al. DAPK loss in colon cancer tumor buds: Implications for migration capacity of disseminating tumor cells. Oncotarget 2015, 6, 36774–36788. [Google Scholar] [CrossRef]
- Urrutia, R. KRAB-containing zinc-finger repressor proteins. Genome Biol. 2003, 4, 231. [Google Scholar] [CrossRef]
- Yang, H.; Yuan, W.; Wang, Y.; Zhu, C.; Liu, B.; Wang, Y.; Yang, D.; Li, Y.; Wang, C.; Wu, X.; et al. ZNF649, a novel Kruppel type zinc-finger protein, functions as a transcriptional suppressor. Biochem. Biophys. Res. Commun. 2005, 333, 206–215. [Google Scholar] [CrossRef]
- Maier, T.; Guell, M.; Serrano, L. Correlation of mRNA and protein in complex biological samples. FEBS Lett. 2009, 583, 3966–3973. [Google Scholar] [CrossRef]


| Sample ID | Molecular Subtype | Control | IgG3 | Observations Regarding IgG3 Staining |
|---|---|---|---|---|
| HROC40 | CIMP-H, non MSI | − | −/+ | Very slight background staining |
| HROC54 | CIMP-H, non MSI | − | + | Very slight background staining |
| HROC60 | CIMP-H, non MSI | − | + | Very slight background staining |
| HROC62 | spStd | − | − | Diffusely in necrosis |
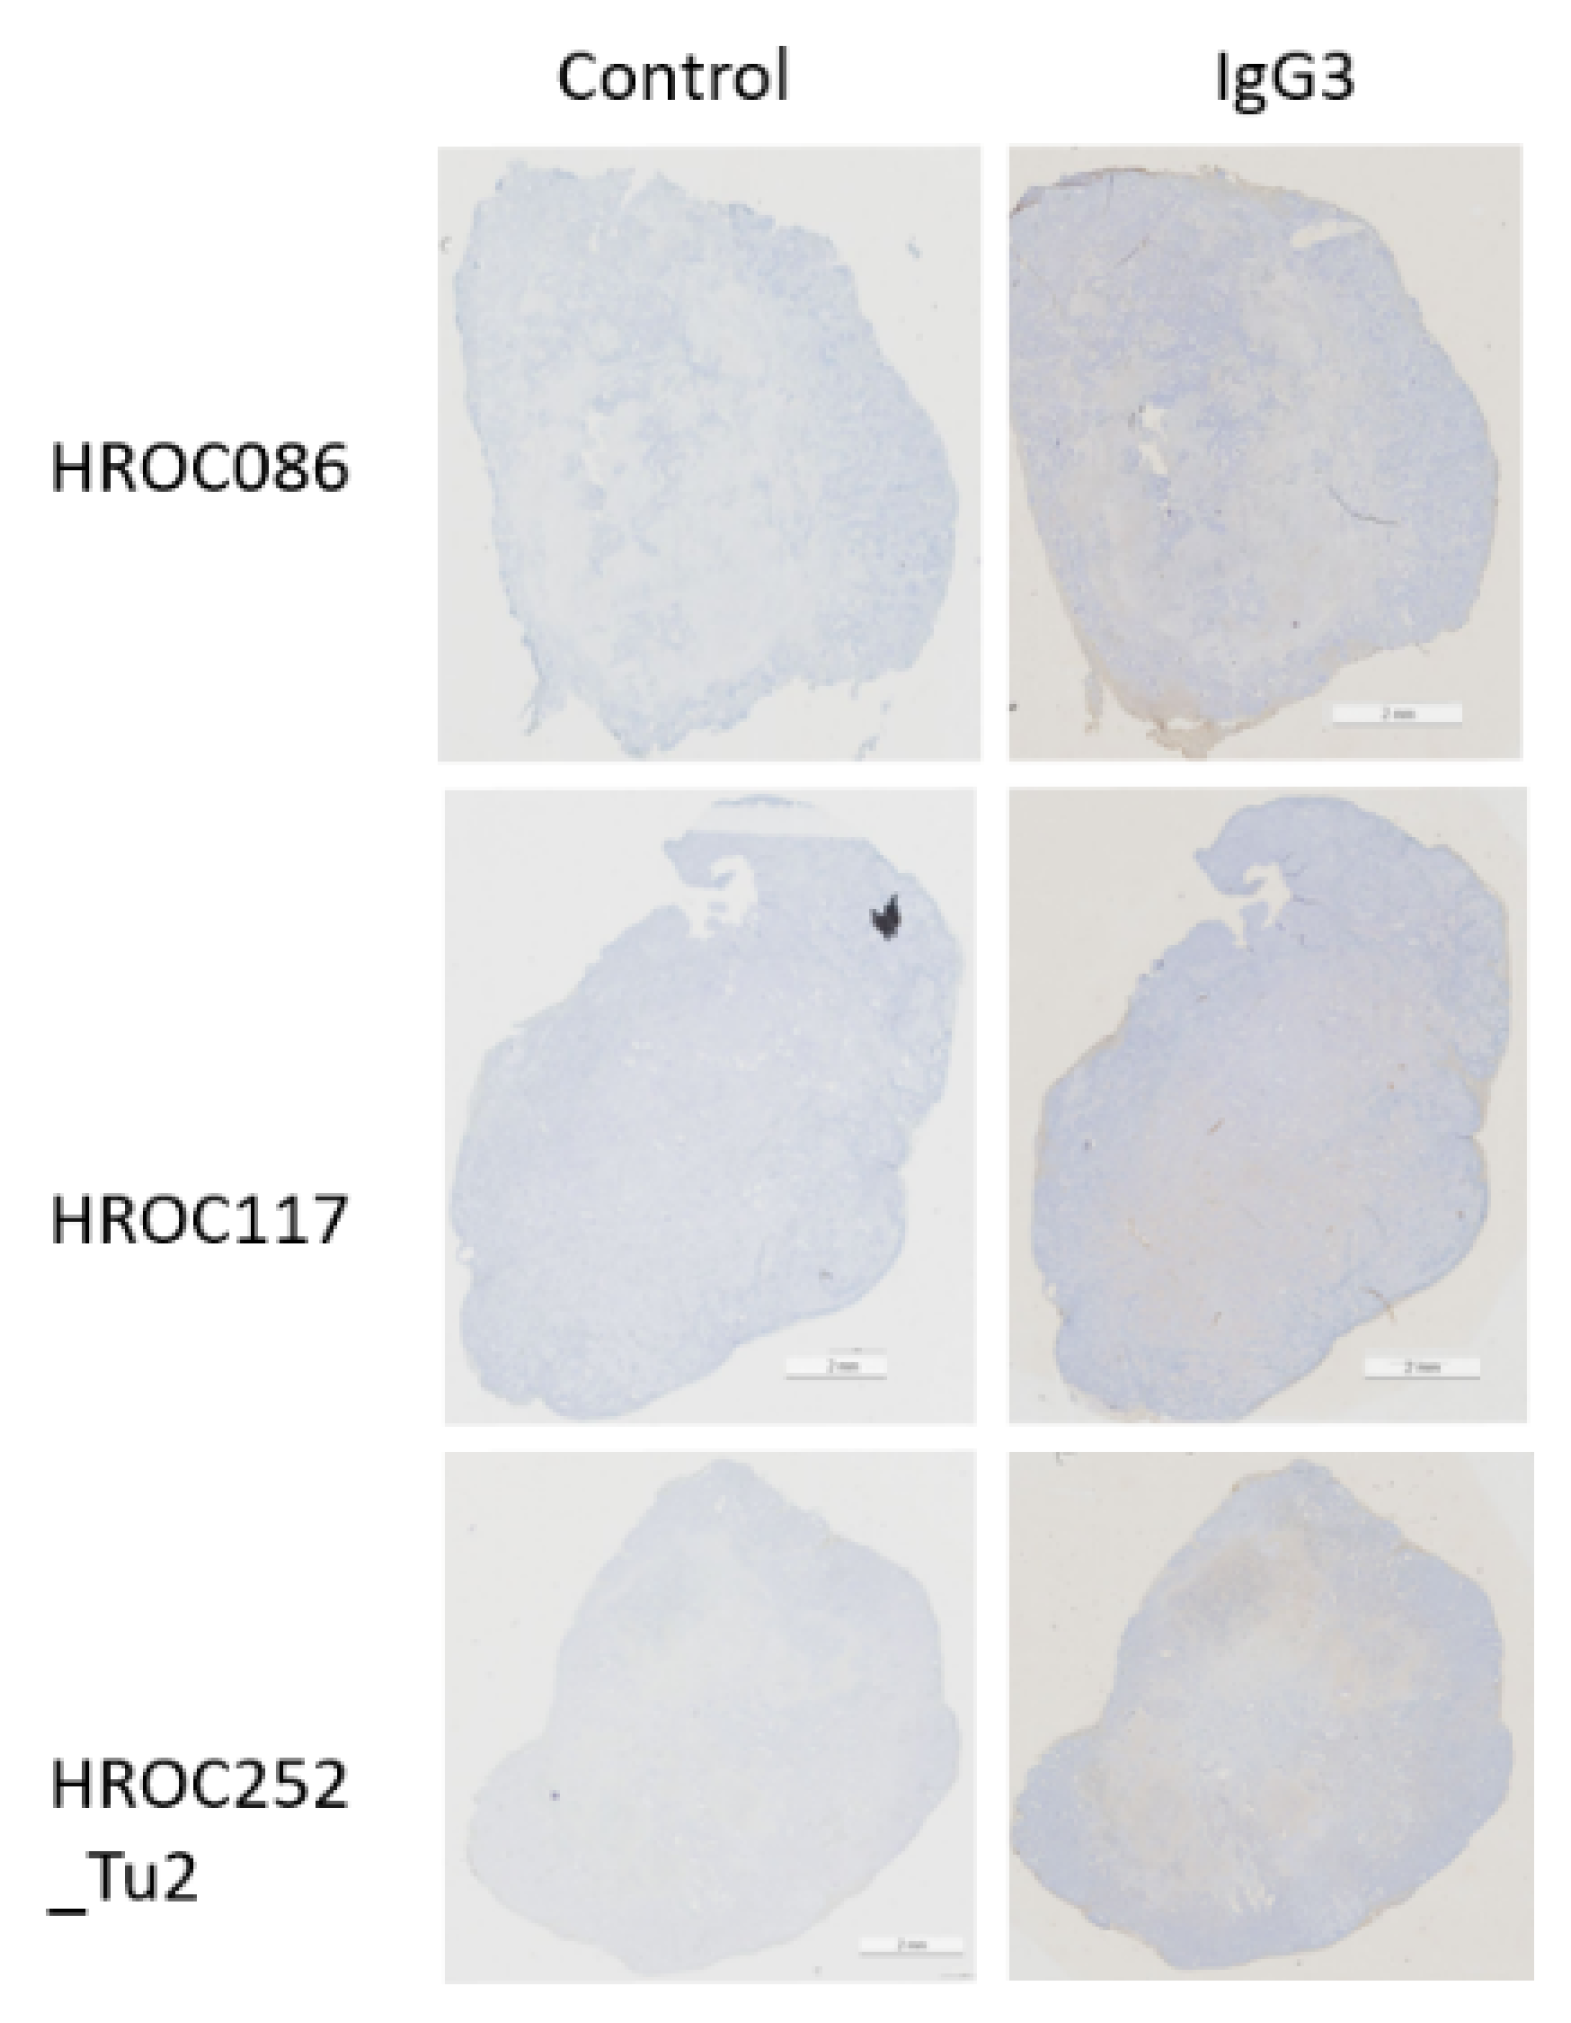
| HROC86 | spStd | − | ++ | Single cells strong in stroma |
| HROC117 | CIMP-H, non MSI | − | ++ | Very slight background staining |
| HROC126 | spStd | − | − | Weak and diffusely in necrosis |
| HROC131 | spMSI-H | − | − | |
| HROC155 | spStd | − | − | Single cells moderate in stroma |
| HROC159 | spMSI-H | − | + | Moderate staining in stroma |
| HROC169 | CIMP-H, non MSI | − | − | |
| HROC212 | spMSI-H | − | + | Single cells in stroma |
| HROC252_Tu1 | Lynch | − | + | Diffusely IgG3 in stroma |
| HROC252_Tu2 | − | ++ | Single cells in stroma, also in parenchyma | |
| HROC252_Tu3 | − | + | Single cells in stroma, low in parenchyma | |
| HROC257 | spMSI-H | − | + | Weak and diffusely IgG3 in necrosis, weak in stroma |
| HROC260 | spStd | − | − | Single cells weak in stroma |
| HROC269 | spMSI-H | − | − | Weak in necrosis |
| HROC315 | Lynch | − | + | Necrotic tumour, IgG3 strong in single cells in stroma |
| HROC324 | Lynch | − | − | Weak in necrosis |
| Tonsil | − | +++/++++ | Regions of heavily brown staining |
| Probeset ID | Gene Symbol | Stage 0 down vs. Stage | Stage 2B down vs. Stage 3B | |||
|---|---|---|---|---|---|---|
| 2 | 2B | 3B | 4 | |||
| 213459_at | RPL37A | 1.42 | 2.41 | 1.04 | 1.27 | −2.31 |
| 211650_x_at | IGH family members | 2.25 | 2.73 | 1.77 | 1.89 | −1.54 |
| 214916_x_at | 2.19 | 2.86 | 1.63 | 2.05 | −1.75 | |
| 216557_x_at | 2.14 | 2.11 | 1.60 | 1.77 | −1.32 | |
| 217281_x_at | 1.91 | 2.04 | 1.50 | 1.60 | −1.36 | |
| Probeset ID | Gene Symbol | Stage Comparisons | ||||
|---|---|---|---|---|---|---|
| 1 vs. 3 | 1 vs. 4 | 1 vs. IS | 1 vs. X | 3 vs. IS | ||
| 213459_at | RPL37A | 2.57 | 2.38 | 1.77 | 2.52 | −1.45 |
| 211639_x_at | IGH family members | −1.24 | −1.26 | −2.20 | −1.32 | −1.77 |
| 211650_x_at | 1.13 | 1.01 | −1.78 | 1.04 | −2.00 | |
| 214916_x_at | 1.16 | 1.11 | −1.77 | −1.01 | −2.04 | |
| Probeset ID | Gene Symbol | COLON (ASCENDING) vs. COLON (NOS) | COLON (ASCENDING) | COLON (DESCENDING) | COLON (DESCENDING) | COLON (NOS) | |||||||
|---|---|---|---|---|---|---|---|---|---|---|---|---|---|
| vs. COLON (SPLENIC FLEXURE) | vs. HEPATIC FLEXURE | vs. COLON (NOS) | vs. RECTUM (NOS) | vs. COLON (SPLENIC FLEXURE) | vs. HEPATIC FLEXURE | vs. COLON (SIGMOID) | vs. COLON (SPLENIC FLEXURE) | vs COLON (TRANSVERSE) | vs. HEPATIC FLEXURE | vs. RECTOSIGMOID JUNCTION | |||
| 211430_s_at | IGH family members | 2.26 | −1.81 | −1.2 | 1.29 | −2.06 | −3.19 | −2.11 | −2.38 | −4.1 | −1.5 | −2.71 | −2.00 |
| 211635_x_at | 1.91 | −2.17 | 1.16 | 1.26 | −1.64 | −3.3 | −1.31 | −2.37 | −4.15 | −1.56 | −1.65 | −1.46 | |
| 211637_x_at | 4.23 | −2.56 | 2.14 | 2.89 | −1.63 | −3.75 | 1.46 | −3.86 | −10.8 | −3.6 | −1.98 | −2.74 | |
| 211639_x_at | 2.62 | −1.94 | 1.66 | 2.2 | −1.37 | −2.31 | 1.39 | −2.86 | −5.08 | −2.46 | −1.58 | −2.08 | |
| 211641_x_at | 1.62 | −1.87 | 1.82 | 1.38 | −1.27 | −2.19 | 1.55 | −1.59 | −3.03 | −1.37 | 1.12 | −1.18 | |
| 211650_x_at | 3.04 | −2.13 | 2.27 | 2.53 | −1.5 | −2.56 | 1.89 | −3.01 | −6.47 | −2.58 | −1.34 | −2.26 | |
| 211868_x_at | 2.5 | −1.54 | 1.43 | 1.91 | −1.35 | −2.02 | 1.09 | −2.52 | −3.86 | −2.26 | −1.75 | −2.20 | |
| 214916_x_at | 2.8 | −1.96 | 2.76 | 1.98 | −1.76 | −2.78 | 1.95 | −2.73 | −5.5 | −2.16 | −1.01 | −1.92 | |
| 216557_x_at | 3.68 | −2.22 | 2.34 | 2.26 | −1.86 | −3.61 | 1.44 | −3.31 | −8.15 | −2.93 | −1.57 | −2.47 | |
| 217236_x_at | 1.33 | −1.67 | 1.97 | 1.16 | −1.19 | −1.91 | 1.72 | −1.31 | −2.22 | −1.19 | 1.48 | −1.12 | |
| 217281_x_at | 2.95 | −2.12 | 2.56 | 1.98 | −1.69 | −3.15 | 1.72 | −2.81 | −6.26 | −2.3 | −1.15 | −2.23 | |
| 217360_x_at | 1.33 | −1.75 | 1.33 | 1.34 | −1.09 | −1.73 | 1.34 | −1.4 | −2.33 | −1.21 | 1.0 | −1.16 | |
| Probeset ID | Gene Symbol | COLON (CECUM) vs. COLON (NOS) | COLON (CECUM) | COLON (CECUM) vs. COLON (NOS) | COLON (NOS) vs. RECTUM (NOS) | COLON (SIGMOID) | COLON (SPLENIC FLEXURE) | COLON (TRANSVERSE) vs. HEPATIC FLEXURE | HEPATIC FLEXURE vs. RECTUM (NOS) | ||||
|---|---|---|---|---|---|---|---|---|---|---|---|---|---|
| vs. COLON (SPLENIC FLEXURE) | vs. COLON (SPLENIC FLEXURE) | vs. HEPATIC FLEXURE | vs. COLON (TRANSVERSE) | vs. HEPATIC FLEXURE | vs. RECTOSIGMOID JUNCTION | vs. RECTUM (NOS) | |||||||
| 211430_s_at | IGH family members | 2.46 | −1.67 | 2.46 | −2.65 | −1.72 | −1.14 | 2.74 | 1.51 | 2.05 | 1.55 | −1.81 | 1.02 |
| 211635_x_at | 1.95 | −2.13 | 1.95 | −2.06 | −1.75 | 1.44 | 2.67 | 2.51 | 2.84 | 2.02 | −1.06 | −1.25 | |
| 211637_x_at | 3.85 | −2.81 | 3.85 | −4.71 | −2.81 | 1.95 | 3.01 | 5.47 | 3.95 | 2.30 | 1.82 | −2.38 | |
| 211639_x_at | 2.66 | −1.91 | 2.66 | −3.02 | −1.78 | 1.81 | 2.07 | 3.22 | 2.45 | 1.68 | 1.55 | −1.91 | |
| 211641_x_at | 1.49 | −2.03 | 1.49 | −1.75 | −1.90 | 1.78 | 2.21 | 3.40 | 2.56 | 1.73 | 1.54 | −1.96 | |
| 211650_x_at | 2.87 | −2.25 | 2.87 | −3.79 | −2.15 | 2.26 | 2.51 | 4.85 | 2.87 | 1.71 | 1.93 | −2.84 | |
| 211868_x_at | 2.29 | −1.69 | 2.29 | −2.58 | −1.53 | 1.44 | 1.70 | 2.20 | 1.75 | 1.50 | 1.29 | −1.47 | |
| 214916_x_at | 2.34 | −2.35 | 2.34 | −3.49 | −2.02 | 2.69 | 2.55 | 5.43 | 2.87 | 1.58 | 2.12 | −3.44 | |
| 216557_x_at | 3.29 | −2.48 | 3.29 | −4.20 | −2.46 | 2.11 | 2.79 | 5.19 | 3.31 | 1.94 | 1.86 | −2.68 | |
| 217236_x_at | 1.28 | −1.73 | 1.28 | −1.39 | −1.69 | 1.94 | 1.87 | 3.29 | 1.97 | 1.60 | 1.76 | −2.06 | |
| 217281_x_at | 2.75 | −2.27 | 2.75 | −3.36 | −2.23 | 2.44 | 2.71 | 5.43 | 2.80 | 1.86 | 2.00 | −2.92 | |
| 217360_x_at | 1.33 | −1.75 | 1.33 | −1.47 | −1.67 | 1.40 | 1.93 | 2.33 | 2.01 | 1.58 | 1.21 | −1.47 | |
| Probset ID | Gene Symbol | DIST RECUR TO PERITONEUM OR ASCITES | DIST SITE OF RECUR, BEHAV NOS (40) | DIST SITE OF RECUR, BEHAV NOS (40) | LOCAL RECURRENCE, BEHAV NOS (10) | NEVER DISEASE FREE SINCE DX (70) | REGIONAL RECURRENCE, BEHAV NOS (20) | |||||||
|---|---|---|---|---|---|---|---|---|---|---|---|---|---|---|
| vs. DIST SITE OF RECUR, BEHAV NOS (40) | vs. LOCAL RECURRENCE, BEHAV NOS (10) | vs. NEVER DISEASE FREE SINCE DX (70) | vs. REGIONAL RECURRENCE, BEHAV NOS (20) | vs. REGIONAL TISSUE RECUR OF INVAS CA (21) | vs LOCAL RECURRENCE, BEHAV NOS (10) | vs REGIONAL RECURRENCE, BEHAV NOS (20) | vs REGIONAL TISSUE RECUR OF INVAS CA (21) | vs NEVER DISEASE FREE SINCE DX (70) | vs REGIONAL RECURRENCE, BEHAV NOS (20) | vs REGIONAL TISSUE RECUR OF INVAS CA (21) | vs REGIONAL TISSUE RECUR OF INVAS CA (21) | vs REGIONAL TISSUE RECUR OF INVAS CA (21) | ||
| 1554574_a_at | CYB5R3 | −2.31 | −2.78 | −2.58 | −2.02 | −1.85 | −1.2 | 1.15 | 1.25 | 1.08 | 1.38 | 1.5 | 1.39 | 1.09 |
| 211430_s_at | IGH family members | 1.06 | −2 | 1.38 | −1.38 | 3.2 | −2.11 | −1.46 | 3.03 | 2.76 | 1.45 | 6.4 | 2.32 | 4.42 |
| 211635_x_at | −1.02 | −10.57 | −1.32 | −1.61 | −2.26 | −10.35 | −1.58 | −2.21 | 7.99 | 6.57 | 4.68 | −1.7 | −1.4 | |
| 211637_x_at | −1.39 | −10.91 | −1.92 | −2.70 | −2.02 | −7.83 | −1.94 | −1.45 | 5.69 | 4.03 | 5.4 | −1.05 | 1.34 | |
| 211639_x_at | −1.09 | −3.63 | −1.25 | −1.73 | −1.47 | −3.31 | −1.58 | −1.34 | 2.9 | 2.1 | 2.47 | −1.17 | 1.18 | |
| 211641_x_at | −1.26 | −4.86 | −1.34 | −1.74 | −1.59 | −3.86 | −1.38 | −1.26 | 3.62 | 2.8 | 3.06 | −1.18 | 1.09 | |
| 211650_x_at | −1.39 | −9.01 | −1.45 | −2.01 | −2.01 | −6.48 | −1.44 | −1.45 | 6.2 | 4.49 | 4.48 | −1.38 | −1.00 | |
| 211868_x_at | 1.20 | −2.47 | 1.09 | −1.25 | 1.08 | −2.97 | −1.51 | −1.12 | 2.69 | 1.97 | 2.66 | −1.01 | 1.35 | |
| 214916_x_at | −1.2 | −11.5 | −1.40 | −1.84 | −1.88 | −9.58 | −1.53 | −1.57 | 8.19 | 6.26 | 6.1 | −1.34 | −1.03 | |
| 216557_x_at | −1.47 | −12.9 | −1.67 | −2.55 | −1.82 | −8.38 | −1.74 | −1.24 | 7.36 | 4.82 | 6.75 | −1.09 | 1.4 | |
| 217236_x_at | −1.3 | −2.13 | −1.43 | −1.59 | −1.71 | −1.63 | −1.22 | −1.31 | 1.49 | 1.33 | 1.24 | −1.2 | −1.07 | |
| 217281_x_at | −1.18 | −10.01 | −1.32 | −1.99 | −1.82 | −8.5 | −1.69 | −1.55 | 7.59 | 5.04 | 5.49 | −1.38 | 1.09 | |
| 217360_x_at | −1.17 | −3.25 | −1.06 | −1.57 | −1.75 | −2.78 | −1.34 | −1.49 | 3.07 | 2.07 | 1.86 | −1.65 | −1.11 | |
| 234419_x_at | −1.02 | −2.24 | −1.04 | −1.24 | −1.6 | −2.21 | −1.22 | −1.58 | 2.15 | 1.8 | 1.4 | −1.54 | −1.29 | |
Publisher’s Note: MDPI stays neutral with regard to jurisdictional claims in published maps and institutional affiliations. |
© 2022 by the authors. Licensee MDPI, Basel, Switzerland. This article is an open access article distributed under the terms and conditions of the Creative Commons Attribution (CC BY) license (https://creativecommons.org/licenses/by/4.0/).
Share and Cite
Boncheva, V.B.; Linnebacher, M.; Kdimati, S.; Draper, H.; Orchard, L.; Mills, K.I.; O’Sullivan, G.; Tangney, M.; Guinn, B.-a. Identification of the Antigens Recognised by Colorectal Cancer Patients Using Sera from Patients Who Exhibit a Crohn’s-like Lymphoid Reaction. Biomolecules 2022, 12, 1058. https://doi.org/10.3390/biom12081058
Boncheva VB, Linnebacher M, Kdimati S, Draper H, Orchard L, Mills KI, O’Sullivan G, Tangney M, Guinn B-a. Identification of the Antigens Recognised by Colorectal Cancer Patients Using Sera from Patients Who Exhibit a Crohn’s-like Lymphoid Reaction. Biomolecules. 2022; 12(8):1058. https://doi.org/10.3390/biom12081058
Chicago/Turabian StyleBoncheva, Viktoriya B., Michael Linnebacher, Said Kdimati, Hannah Draper, Laurence Orchard, Ken I. Mills, Gerald O’Sullivan, Mark Tangney, and Barbara-ann Guinn. 2022. "Identification of the Antigens Recognised by Colorectal Cancer Patients Using Sera from Patients Who Exhibit a Crohn’s-like Lymphoid Reaction" Biomolecules 12, no. 8: 1058. https://doi.org/10.3390/biom12081058
APA StyleBoncheva, V. B., Linnebacher, M., Kdimati, S., Draper, H., Orchard, L., Mills, K. I., O’Sullivan, G., Tangney, M., & Guinn, B.-a. (2022). Identification of the Antigens Recognised by Colorectal Cancer Patients Using Sera from Patients Who Exhibit a Crohn’s-like Lymphoid Reaction. Biomolecules, 12(8), 1058. https://doi.org/10.3390/biom12081058