
The Expression and Activity of Rhodanese, 3-Mercaptopyruvate Sulfurtransferase, Cystathionine γ-Lyase in the Most Frequently Chosen Cellular Research Models


Abstract
:1. Introduction
2. Materials and Methods
2.1. Cell Culture
2.2. Cell Homogenization
2.3. TST Activity Assay
2.4. MPST Activity Assay
2.5. CTH Activity Assay
2.6. The Sulfane Sulfur Level
2.7. The Protein Content Determination
2.8. Determination of Concentration of Low-Molecular-Weight Sulfur-Containing Compounds Using RP-HPLC
2.9. Total RNA Isolation
2.10. Reverse Transcription of RNA
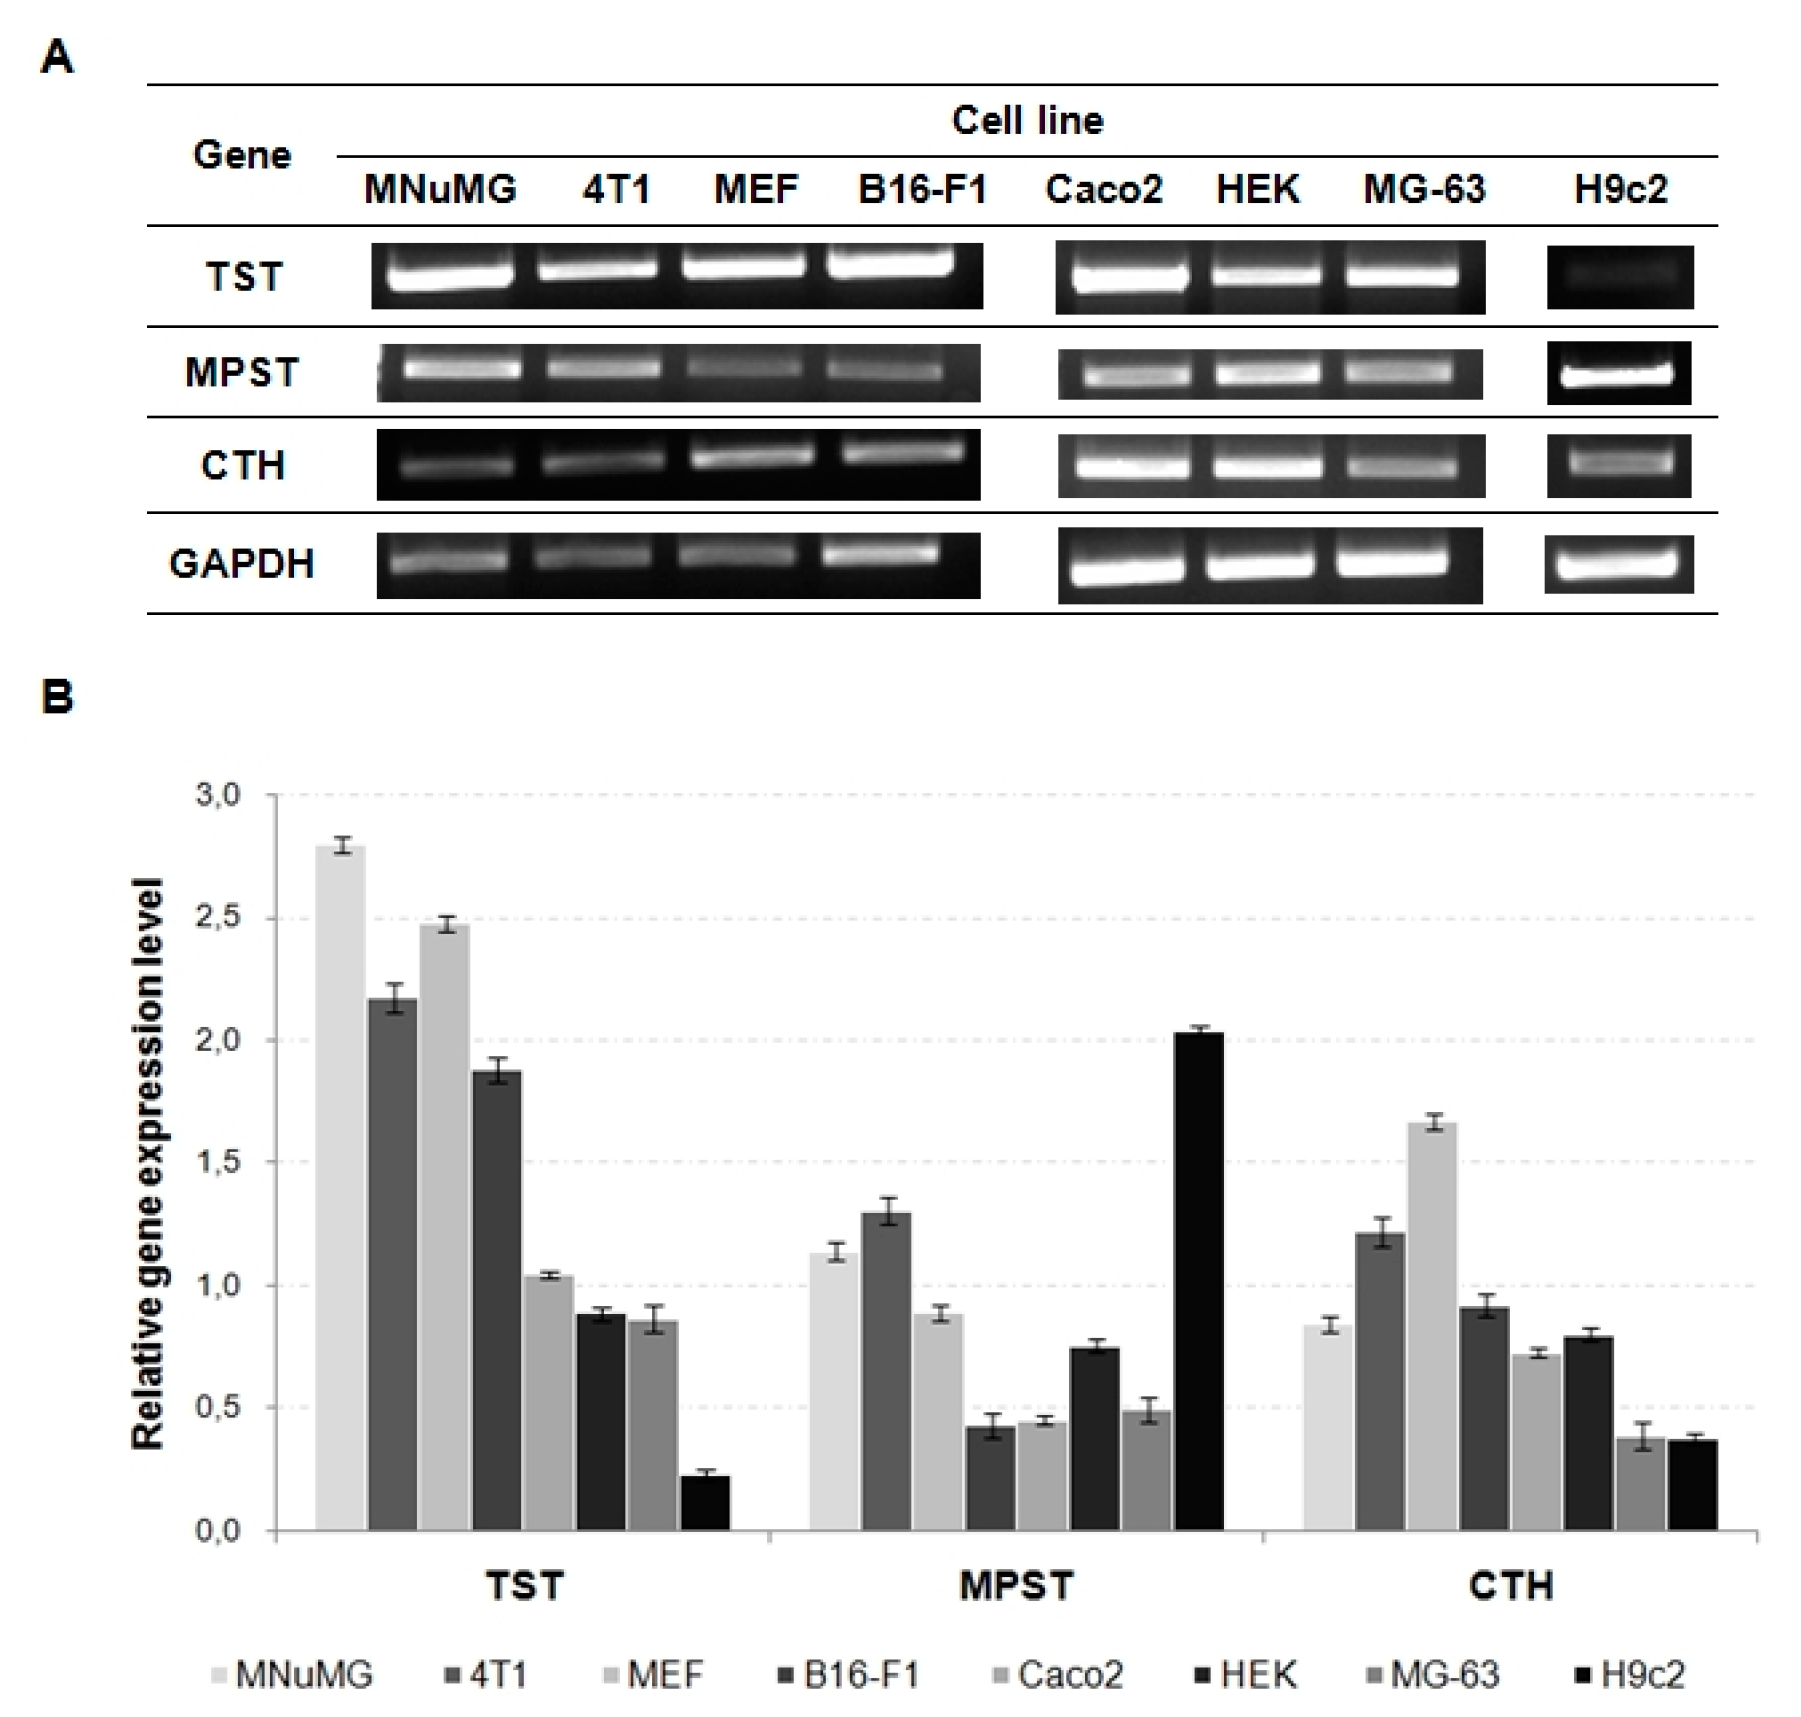
2.11. Polymerase Chain Reaction (PCR)
3. Results and Discussion
4. Conclusions
Author Contributions
Funding
Institutional Review Board Statement
Informed Consent Statement
Data Availability Statement
Conflicts of Interest
References
- Abe, K.; Kimura, H. The possible role of hydrogen sulfide as an endogenous neuromodulator. J. Neurosci. 1996, 16, 1066–1071. [Google Scholar] [CrossRef] [Green Version]
- Toohey, J.I. Possible involvement of sulfane sulfur in homocysteine-induced arteriosclerosis. Med. Hypotheses 2001, 56, 259–261. [Google Scholar] [CrossRef]
- Chiku, T.; Padovani, D.; Zhu, W.; Singh, S.; Vitvitsky, V.; Banerjee, R. H2S biosynthesis by human cystathionine gamma-lyase leads to the novel sulfur metabolites lanthionine and homolanthionine and is responsible to the grade of hyperhomocysteinemia. J. Biol. Chem. 2009, 284, 11601–11612. [Google Scholar] [CrossRef] [Green Version]
- Sun, Q.; Collins, R.; Huang, S.; Holmberg-Schiavone, L.; Anand, G.S.; Tan, C.H.; van-den-Berg, S.; Deng, L.W.; Moore, P.K.; Karlberg, T.; et al. Structural basis for the inhibition mechanism of human cystathionine gamma-lyase, an enzyme responsible for the production of H2S. J. Biol. Chem. 2009, 284, 3076–3085. [Google Scholar] [CrossRef] [Green Version]
- Bronowicka-Adamska, P.; Bentke, A.; Wróbel, M. Hydrogen sulfide generation from L-cysteine in the human glioblastoma-astrocytoma U-87 MG and neuroblastoma SHSY5Y cell lines. Acta Biochim. Pol. 2017, 64, 171–176. [Google Scholar] [CrossRef]
- Landry, A.P.; Roman, J.; Banerjee, R. Structural perspectives on H2S homeostasis. Curr. Opin. Struct. Biol. 2021, 71, 27–35. [Google Scholar] [CrossRef]
- Nagahara, N.; Okazaki, T.; Nishino, T. Cytosolic mercaptopyruvate sulfurtransferase is evolutionary related to mitochondrial rodanese. Striking similarity in active site amino acid sequence and the increase in the mercaptopyruvate sulfurtransferase activity of rhodanese by site-directed mutagenesis. J. Biol. Chem. 1995, 270, 16230–16235. [Google Scholar] [CrossRef] [Green Version]
- Alphey, M.S.; Williams, R.A.M.; Mottram, J.C.; Coombs, G.H.; Hunter, W.N. The crystal structure of Leishmania major 3-mercaptopyruvate sulfurtransferase. A three-domain architecture with a serine protease-like triad at the active site. J. Biol. Chem. 2003, 278, 48219–48227. [Google Scholar] [CrossRef] [Green Version]
- Kessler, D. Enzymatic activation of sulfur for incorporation into biomolecules in prokaryotes. Microbiol. Rev. 2006, 30, 825–840. [Google Scholar] [CrossRef] [Green Version]
- Nagahara, N. Catalytic site cysteine of thiol enzyme sulfurtransferase. J. Amino Acids 2011, 2011, 1–7. [Google Scholar] [CrossRef] [Green Version]
- Nagahara, N.; Nishino, T. Role of amino acid residues in the active site of rat liver mercaptopyruvate sulfurtransferase. CDNA cloning, overexpression, and site-directed mutagenesis. J. Biol. Chem. 1996, 271, 27395–27401. [Google Scholar] [CrossRef] [Green Version]
- Wróbel, M.; Jurkowska, H.; Kaczor, M.; Uchacz, T. Rhodanese and 3-mercaptopyruvate sulfurtransferase—Evolutionary related enzymes. KOSMOS 2012, 61, 233–244. (In Polish) [Google Scholar]
- Nagahara, N.; Ito, T.; Minami, M. Mercaptopyruvate sulfurtransferase as a defense against cyanide toxication: Molecular properties and mode of detoxication. Histol. Histopathol. 1999, 14, 1277–1286. [Google Scholar] [CrossRef] [PubMed]
- Nandi, D.L.; Horowitz, P.M.; Westley, J. Rhodanese as a thioredoxin oxidase. Int. J. Biochem. Cell Biol. 2000, 32, 465–473. [Google Scholar] [CrossRef]
- Nagahara, N.; Yoshii, T.; Abe, Y.; Matsumura, T. Thioredoxin-dependent enzymatic activation of mercaptopyruvate sulfurtransferase. An intersubmit disulfide bond severs as a redox switch for activation. J. Biol. Chem. 2007, 282, 1561–1569. [Google Scholar] [CrossRef] [Green Version]
- Isom, G.E.; Borowitz, J.L.; Mukhopadhyay, S. Sulfurtransferases enzymes involved in cyanide metabolism. In Comprehensive Toxicology; Charlene, A.M., Ed.; Elsevier: Oxford, UK, 2010; pp. 485–500. [Google Scholar]
- Cipollone, R.; Ascenzi, P.; Visca, P. Common themes and variations in the rhodanese superfamily. IUBMB Life 2007, 59, 51–59. [Google Scholar] [CrossRef] [PubMed]
- Wróbel, M. Comparative Study on Physiological Roles of Enzymes That Participate in Sulfane Sulfur Production and Metabolism in Animal Tissues; Jagiellonian University Press: Kraków, Poland, 2000. [Google Scholar]
- Stipanuk, M.H. Sulfur amino acid metabolism pathways for production and removal of homocysteine and cysteine. Ann. Rev. Nutr. 2004, 24, 539–577. [Google Scholar] [CrossRef] [PubMed]
- Stipanuk, M.H.; Ueki, I. Dealing with methionine/homocysteine sulfur: Cysteine metabolism to taurine and inorganic sulfur. J. Inherit. Metab. Dis. 2011, 34, 17–32. [Google Scholar] [CrossRef] [PubMed] [Green Version]
- Sörbo, B. Rhodanese. In Methods in Enzymology; Colowick, S.P., Kaplan, N.O., Eds.; Academy Press: New York, NY, USA, 1955; Volume 2, pp. 334–337. [Google Scholar]
- Wróbel, M.; Jurkowska, H.; Śliwa, L.; Srebro, Z. Sulfurtransferases and cyanide detoxification in mouse liver, kidney and brain. Toxicol. Mech. Methods 2004, 14, 331–337. [Google Scholar] [CrossRef]
- Valentine, W.N.; Frankenfeld, J.K. 3-Mercaptopyruvate sulfur transferase (EC: 2.8.1.2): A simple assay adapted to human blood cells. Clin. Chim. Acta 1974, 51, 205–210. [Google Scholar] [CrossRef]
- Matsuo, Y.; Greenberg, D.M. A crystalline enzyme that cleaves homoserine and cystathionine. J. Biol. Chem. 1958, 230, 545–560. [Google Scholar] [CrossRef]
- Wood, J.L. Sulfane sulfur. Methods Enzymol. 1987, 143, 25–29. [Google Scholar] [CrossRef]
- Lowry, O.H.; Rosenbrough, N.J.; Farr, A.L.; Randall, R.I. Protein measurement with the Folin phenol reagent. J. Biol. Chem. 1951, 193, 265–275. [Google Scholar] [CrossRef]
- Dominic, P.K.; Cassidy, P.B.; Roberts, J.C. A new and versatile method for determination of thiolamines of biological importance. J. Chromatogr. B Biomed. Sci. 2001, 761, 1–12. [Google Scholar] [CrossRef]
- Bronowicka-Adamska, P.; Zagajewski, J.; Czubak, J.; Wróbel, M. RP-HPLC method for quantitative determination of cystathionine, cysteine and glutathione: An application for the study of the metabolism of cysteine in human brain. J. Chromatogr. B. 2011, 8, 2005–2009. [Google Scholar] [CrossRef]
- Jurkowska, H.; Kaczor-Kamińska, M.; Bronowicka-Adamska, P.; Wróbel, M. Cystathionine γ-lyase. Adv. Hyg. Exp. Med. 2014, 68, 1–9. [Google Scholar] [CrossRef]
- Kraus, J.P.; Hašek, J.; Kožich, V.; Collard, R.; Venezia, S.; Janošíková, B.; Wang, J.; Stabler, S.P.; Allen, R.H.; Jakobs, C.; et al. Cystathionine γ-lyase: Clinical, metabolic, genetic, and structural studies. Mol. Genet. Metab. 2009, 97, 250–259. [Google Scholar] [CrossRef] [PubMed] [Green Version]
- Yang, G.; Pei, Y.; Teng, H.; Cao, Q.; Wang, R. Specificity protein-1 as a critical regulator of human cystathionine gamma-lyase in smooth muscle cells. J. Biol. Chem. 2011, 286, 26450–26460. [Google Scholar] [CrossRef] [PubMed] [Green Version]
- Giannakopoulou, E.; Konstantinoi, F.; Ragia, G.; Gerontits, Z.; Tavridou, A.; Papapetropoulos, A.; Mikroulis, D.; Manolopoulos, V.G. Association study of the CTH1364 G>T polymorphism with coronary artery disease in the Greek population. Drug Metab. Pers. Ther. 2019, 34, 20180033. [Google Scholar] [CrossRef]
- Lu, Y.-F.; Mauger, D.M.; Goldstein, D.B.; Urban, T.J.; Weeks, K.M.; Bradrick, S.S. IFNL3 mRNA structure is remodeled by a functional non-coding polymorphism associated with hepatitis C virus clearance. Sci. Rep. 2015, 5, 16037. [Google Scholar] [CrossRef] [PubMed] [Green Version]
- Li, G.; Pan, T.; Guo, D.; Li, L.-C. Regulatory variants and disease: The E-cadherin-160C/A SNP as an example. Mol. Biol. Int. 2014, 2014, 967565. [Google Scholar] [CrossRef] [PubMed] [Green Version]
- Jurkowska, H.; Placha, W.; Nagahara, N.; Wróbel, M. The expression and activity of cystathionine-γ-lyase and 3-mercaptopyruvate sulfurtransferase in human neoplastic cell lines. Amino Acids 2011, 41, 151–158. [Google Scholar] [CrossRef]
- Kaczor-Kamińska, M.; Stalińska, K.; Kamiński, K.; Pisarek, A.; Maziarz, U.; Feldman, A.; Wróbel, M. Murine cellular model of mucopolysaccharidosis, type IIIB (MPS IIIB)—A preliminary study with particular emphasis on the non-oxidative L-cysteine metabolism. Biochimie 2020, 174, 84–94. [Google Scholar] [CrossRef]
- Jurkowska, H.; Wróbel, M. N-acetyl-l-cysteine as a source of sulfane sulfur in astrocytoma and astrocyte cultures: Correlations with cell proliferation. Amino Acids 2008, 34, 231–237. [Google Scholar] [CrossRef]
- Jurkowska, H.; Wróbel, M.; Kaczor-Kamińska, M.; Jasek-Gajda, E. A possible mechanism of inhibition of U87MG and SH-SY5Y cancer cell proliferation by diallyl trisulfide and other aspects of its activity. Amino Acids 2017, 49, 1855–1866. [Google Scholar] [CrossRef] [PubMed] [Green Version]
- Kaczor-Kamińska, M.; Sura, P.; Wróbel, M. Multidirectional changes in parameters related to sulfur metabolism in frog tissues exposed to heavy metal-stress. Biomolecules 2020, 10, 574. [Google Scholar] [CrossRef] [PubMed] [Green Version]
- Kaczor-Kamińska, M.; Kamiński, K.; Stalińska, K.; Wróbel, M.; Feldman, A. Effect of glycosaminoglycans accumulation on the non-oxidative sulfur metabolism in mouse model of Sanfilippo syndrome, type B. Acta Biochim. Pol. 2018, 66, 567–576. [Google Scholar] [CrossRef] [PubMed] [Green Version]
- Tietze, F. Enzymatic method for quantitative determination of nanogram amounts of total and oxidized glutathione: Applications to mammalian blood and other tissues. Anal. Biochem. 1969, 27, 502–522. [Google Scholar] [CrossRef]
- Wróbel, M.; Wlodek, L. Effects of thiazolidine-4(R)-carboxylates and other low-molecular-weight sulphur compounds on the activity of mercaptopyruvate sulphurtransferase, rhodanese and cystathionase in Ehrlich ascites tumor cells and tumor-bearing mouse liver. Amino Acids 1997, 12, 309–314. [Google Scholar] [CrossRef]
- Kruithof, P.D.; Lunev, S.; Aguilar Lorenzo, S.P.; de Assis Batista, F.; Al-dahmani, Z.M.; Joles, J.A.; Dolga, A.M.; Groves, M.R.; van Goor, H. Unraveling the role of thiosulfate sulfurtransferase in metabolic diseases. BBA-Mol. Basis Dis. 2020, 1866, 165716. [Google Scholar] [CrossRef]
- Cagianut, B.; Schnebli, H.P.; Rhyner, K.; Furrer, J. Decreased thiosulfate sulfur transferase (rhodanese) in Leber’s hereditary optic atrophy. Klin. Wochenschr. 1984, 62, 850–854. [Google Scholar] [CrossRef] [PubMed]
- Poole, C.J.; Kind, P.R. Deficiency of thiosulphate sulfurtransferase (rhodanese) in Leber’s hereditary optic neuropathy. Br. Med. J. 1986, 292, 1229–1230. [Google Scholar] [CrossRef] [PubMed] [Green Version]
- Wróbel, M.; Czubak, J.; Bronowicka-Adamska, P.; Jurkowska, H.; Adamek, D.; Papla, B. Is development of high-grade gliomas sulfur dependent? Molecules 2014, 19, 21350–21362. [Google Scholar] [CrossRef] [PubMed] [Green Version]
- Krueger, K.; Koch, K.; Jűhling, A.; Tepel, M.; Scholze, A. Low expression of thiosulfurtransferase (rhodanese) predicts mortality in hemodialysis patients. Clin. Biochem. 2010, 43, 95–101. [Google Scholar] [CrossRef] [PubMed]


| TST | MPST | CTH | |
|---|---|---|---|
| Subcellular (mammals) localization |
|
|
|
| Amino acids in the catalytic center of the enzyme | Arg-186, Cys-248, Lys-249 | Arg-187; Arg-196; Cys-247; Ser-249 | Ser-89; Gly-90; Leu-91; Met-110; Tyr-114; Asn-118; Thr-211; Lys-212; Met-214 |
| Molecular function |
|
|
|
| Biological process participation |
|
|
|
| Homo Sapiens | TST | MPST | CTH |
|---|---|---|---|
| Gene location | 22q12.3 | 22q13.3 | 1p31.1 |
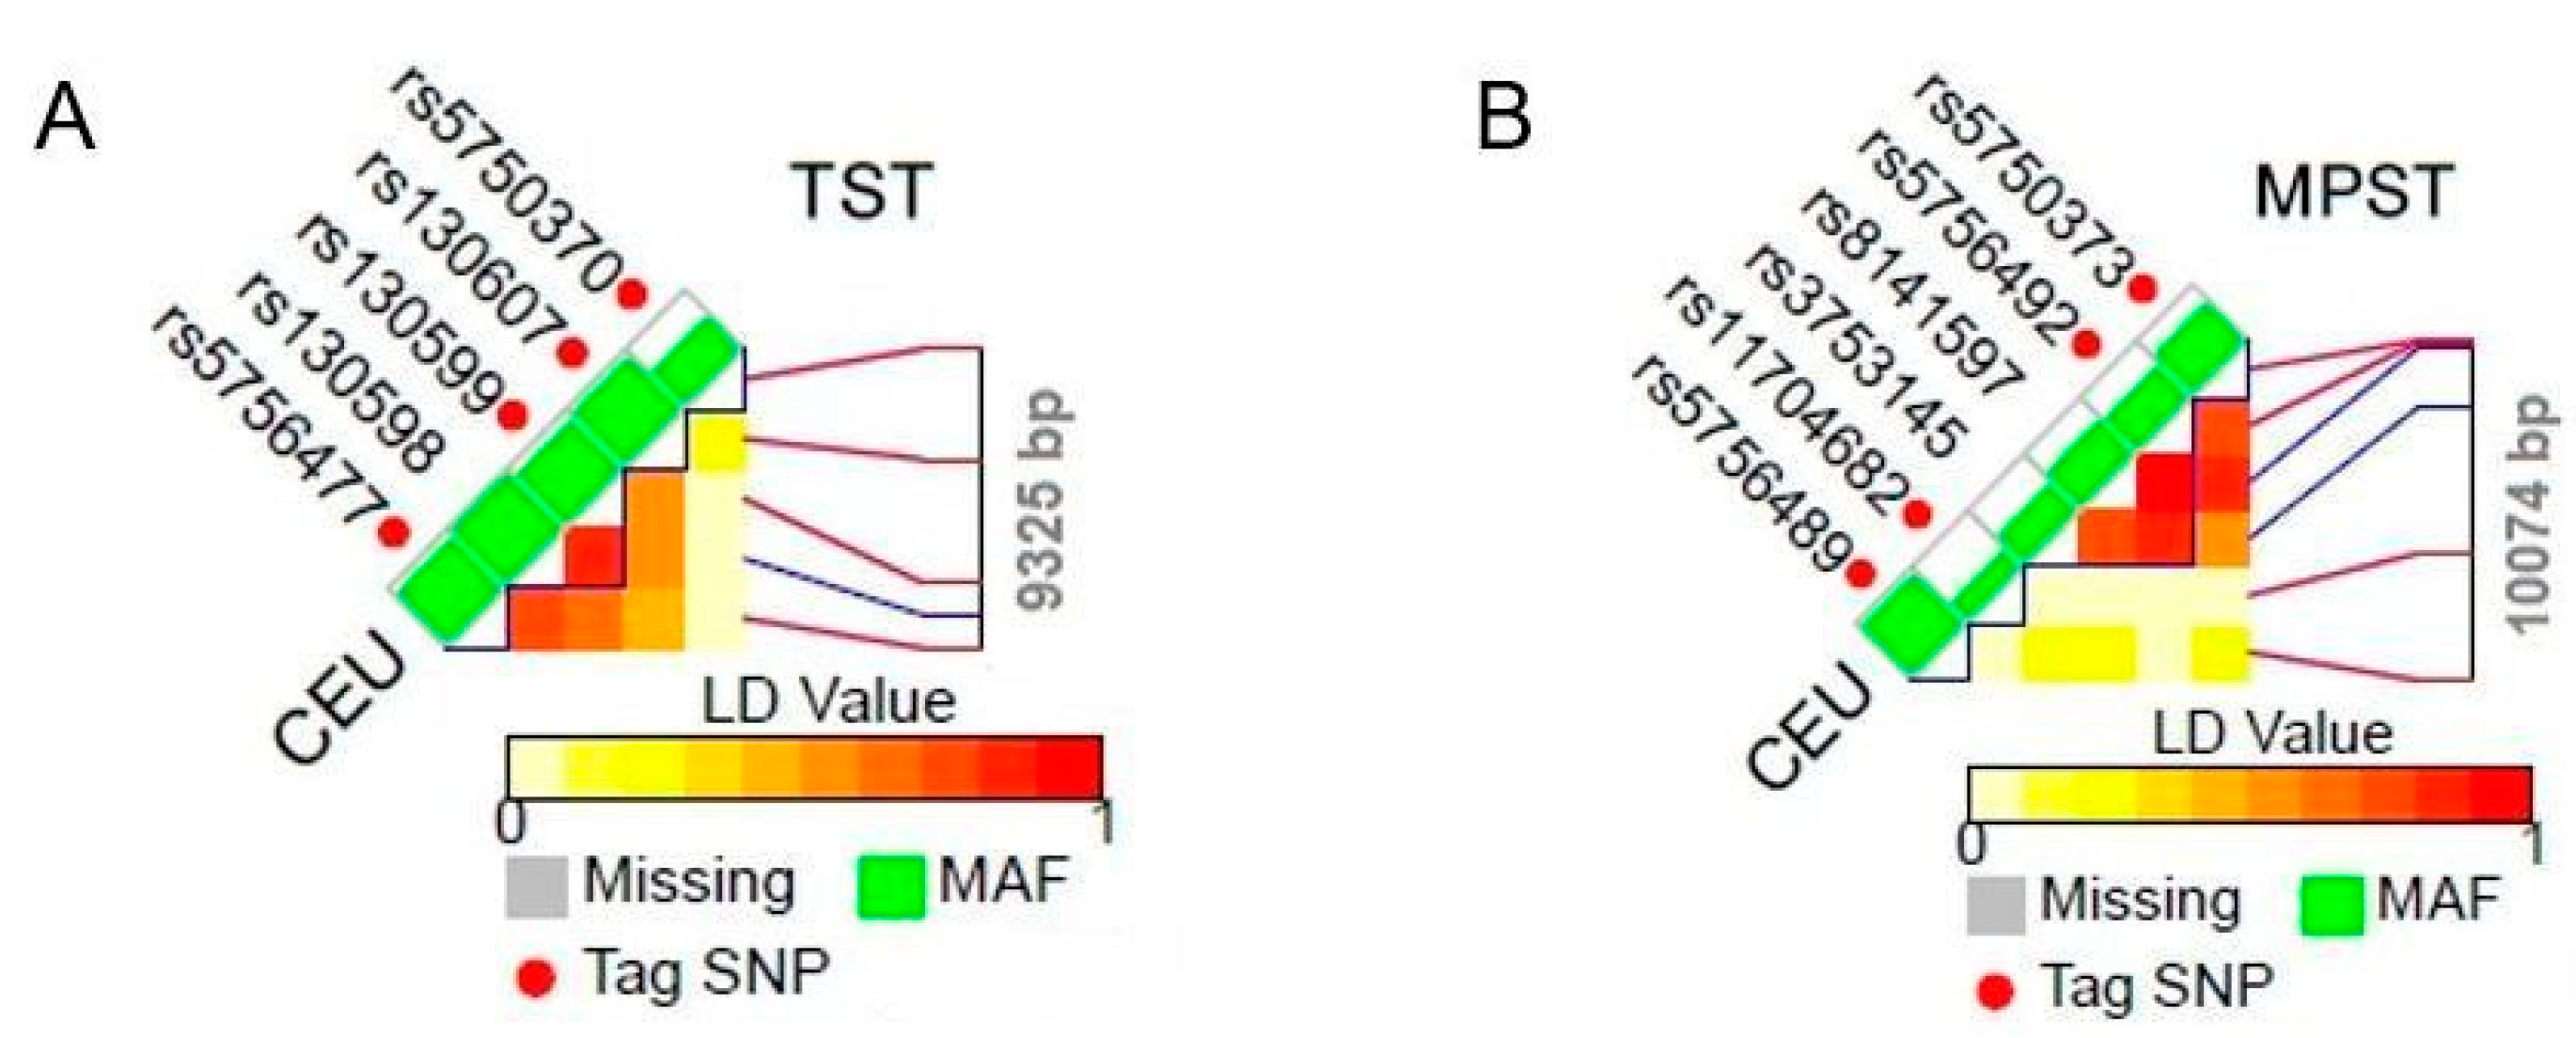
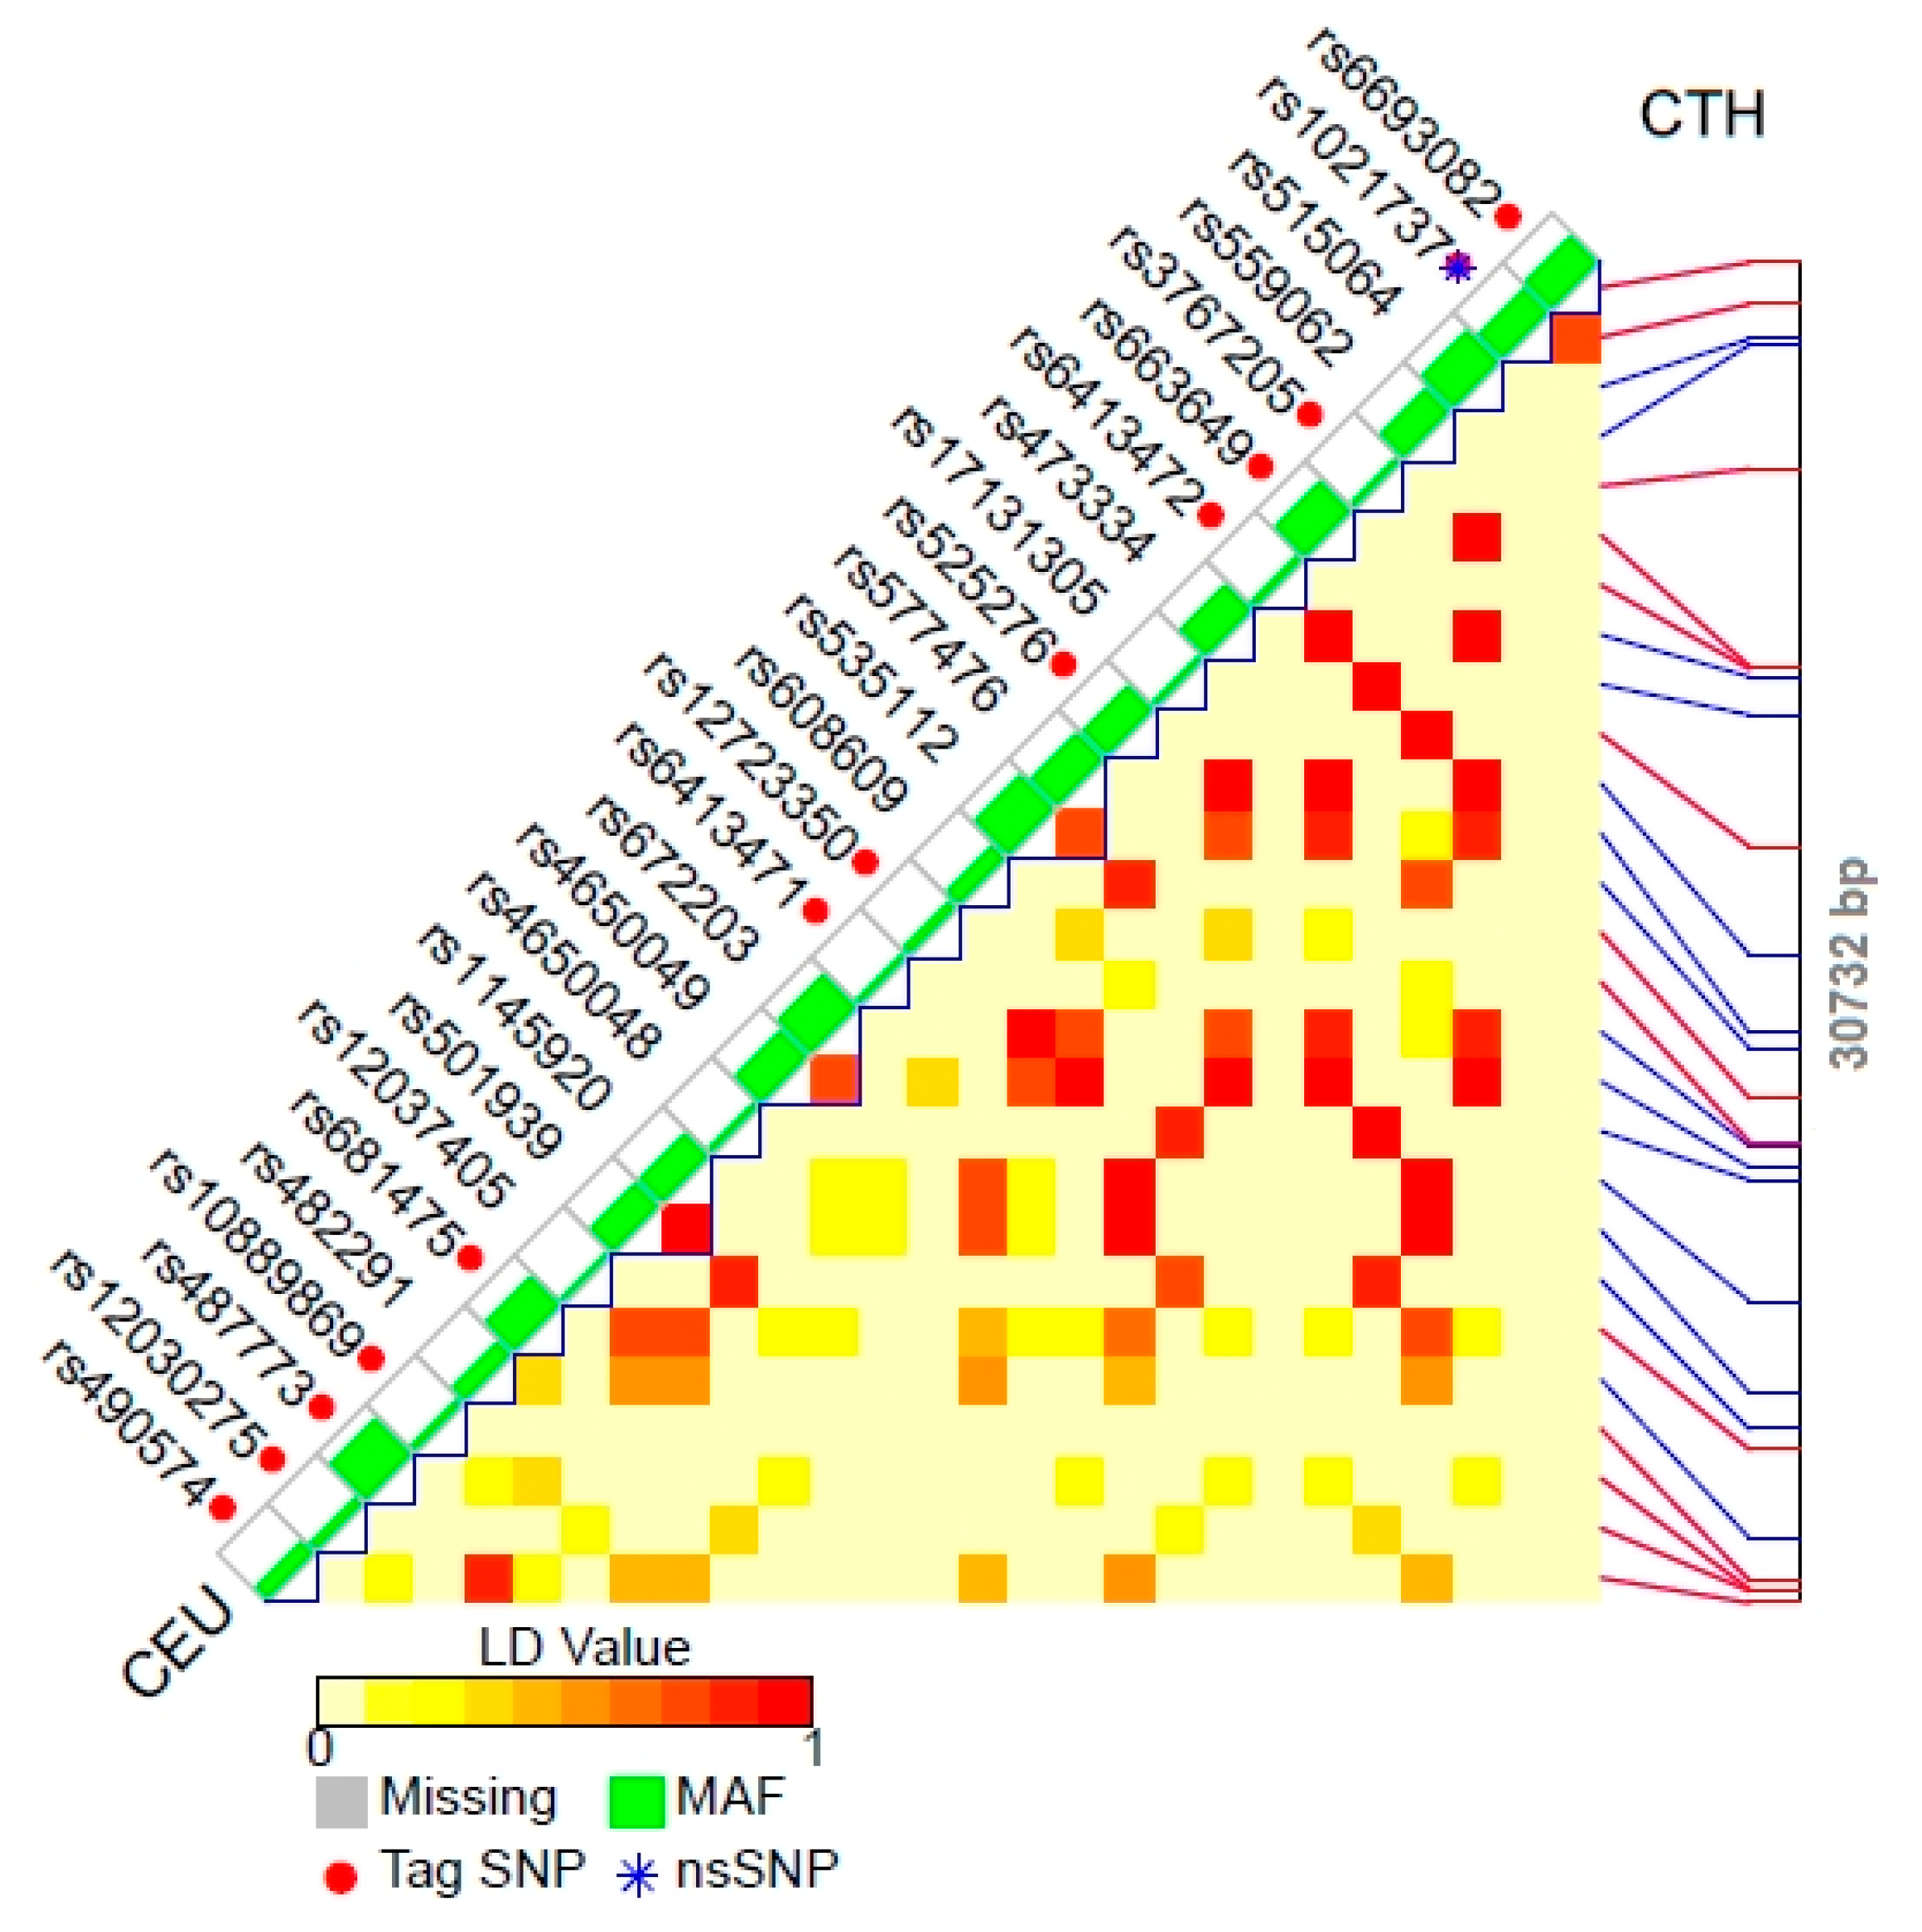
| Gene length | 9325 bp (NC_000022.11) | 10074 bp (NC_000022.11) | 30732 bp (NC_000001.11) |
| Number of exons | 4 | 6 | 13 |
| Number of isoforms (length of their mRNA and protein sequence encoded by them) | 2 isoforms:
| 3 isoforms (5 different transcript variants):
| 3 isoforms:
|
| Amount of single nucleotide polymorphism in whole gene and its coding regions (cSNP) | In whole gene: 2896 SNP
| In whole gene: 3138 SNP
| In whole gene: 6835 SNP
|
| Type of mutation in the longest isoform coding region: | Isoform 1:
| Isoform 1:
| Isoform 1:
|
| Tag SNPs (localization and effect) | rs130599 (intron, T > C transversion); rs5750370 (intron, G > A transversion); rs5756477 (intron, T > A/C transversion); rs130607 (intron, T > A/C/G transversion); | rs5756492 (intron, G > A transversion); rs5750373 (intron, G > A transversion); rs5756489 (intron, T > A/C/G transversion); rs11704682 (intron, C > A/G transversion); | rs663649 (intron, G > T transversion); rs525276 (intron, G > C/T transversion); rs3767205 (intron, G > A/C/T transversion); rs490574 (intron, T > A/G transversion); rs6413471 (intron, A > C transversion); rs487773 (intron, G > A/T transversion); rs10889869 (intron, G > A transversion); rs12030275 (intron, T > A/C transversion); rs681475 (intron, T > C transversion); rs12723350 (intron, T > C transversion); rs1021737 (exon, G > T transversion, pathogenic mutation); rs6693082 (3’ near gene, T > C/G transversion); rs6413472 (intron, C > T transversion) |
| Polymorphisms inherited in conjunction | rs130599 is inherited with: rs130598 | rs5756492 is inherited with: rs3753145, rs8141597; rs5750373 is inherited with: rs8141597 | rs663649 is inherited with: rs4650049, rs473334, rs515064, rs535112, rs577476, rs672203; rs525276 is inherited with: rs1145920, rs501939, rs559062, rs608609; rs3767205 is inherited with: rs12037405, rs17131305, rs4650048; rs490574 is inherited with: 482291 |
| Polymorphisms responsible for pathogenic state | not revealed | not revealed | rs1021737 (exon, G > T transversion, missense mutation) rs28941785 (exon, C > T/A transversion) missense mutation) rs28941786 (exon, C > G transversion, missense mutation or C > T transversion, nonsense mutation) rs773107808 (exon, C > T transversion, nonsense mutation) |
| Gene | Primer (5′ → 3′) | Product Size (bp) | PCR Conditions | |||||
|---|---|---|---|---|---|---|---|---|
| Predenaturation | Denaturation | Annealing | Elongation | Extension | Cycle | |||
| Mouse cell lines | ||||||||
| TST | F: AACCTGGGCATAAGCAACGA R: GGTCCACCTTCTTGTCCTGG | 460 | 94 °C, 5 min | 94 °C, 30 s | 58 °C, 30 s | 72 °C, 2 min | 72 °C, 8 min | 29 |
| MPST | F: AACCTGGGCATAAGCAACGA R: GGTCCACCTTCTTGTCCTGG | 420 | 62 °C, 30 s | 30 | ||||
| CTH | F: CAGCAAGACCCGATGCAAAG R: CAAAGCAACACCTCGCACTC | 304 | 60 °C, 30 s | |||||
| GAPDH | F: GCTCCAGCTTAGGTTCATCAG R: TTTGGCTCCACCCTTCAAGT | 404 | 59 °C, 30 s | 28 | ||||
| Human cell lines | ||||||||
| TST | F: GTCCGGGGCGAGTGACA R: GGCCAAACACACGGAACAT | 393 | 94°C, 5 min | 94°C, 30 s | 59 °C, 30 s | 72 °C, 2 min | 72 °C, 8 min | 30 |
| MPST | F: CCAGGTACCGTGAACATCCC R: ATGTACCACTCCACCCAGGA | 227 | 56 °C, 30 s | 29 | ||||
| CTH | F: AATCGCTGTGTGCCGCCTTA R: TGAACGTGGTGGACAGTGAG | 301 | 60 °C, 30 s | 72 °C, 10 min | 31 | |||
| GAPDH | F: GCTCTCTGCTCCTCCTGTTC R: TTCCCGTTCTCAGCCTTGAC | 273 | 72 °C, 8 min | 30 | ||||
| Rat cell line | ||||||||
| TST | F: ACATCCGTGGCTCTGTCAAC R: TCGTAAACAGCCACATCGGG | 208 | 94 °C, 5 min | 94 °C, 30 s | 62 °C, 30 s | 72 °C, 2 min | 72 °C, 10 min | 30 |
| MPST | F: GTATCTGCTCAGTGGGTGGC R: CAGGGATGTGTCCAGGTTCG | 589 | ||||||
| CTH | F: CCGACGAGGAATTGCTTGGA R: ACATCACTGTGGCCGTTCAT | 464 | 60 °C, 30 s | 28 | ||||
| GAPDH | F: AGTGCCAGCCTCGTCTCATA R: GATGGTGATGGGTTTCCCGT | 248 | 30 | |||||
| Cell Line | TST | MPST | CTH | References |
|---|---|---|---|---|
| nmole/mg·min−1 | ||||
| Mouse cell lines | ||||
| MNuMG | 61 ± 16 | 145 ± 34 | 0.6 ± 0.2 | |
| 4T1 | 14 ± 5 | 84 ± 19 | 1.6 ± 0.6 | |
| MEF | 31 ± 7 | 93 ± 14 | 0.8 ± 0.4 | |
| B16-F1 | 25 ± 7 | 61 ± 14 | 0.4 ± 0.03 | |
| WT | 45 ± 5 | 81 ± 16 | 1.6 ± 0.5 | [36] |
| Naglu−/− | 26 ± 4 | 49 ± 15 | 0.9 ± 0.2 | |
| Human cell lines | ||||
| Caco-2 | 502 ± 21 | 89 ± 44 | 1.8 ± 0.6 | |
| HEK | 182 ± 13 | 227 ± 54 | 0.8 ± 0.4 | |
| MG-63 | 76 ± 18 | 77 ± 17 | 5.5 ± 0.7 | |
| U373 | 70 ± 12 | 164 ± 20 | no data | [37] |
| SH-SY5Y | 67 ± 7 | 674 ± 93 | 5.2 ± 1.5 | [5,38] |
| U87MG | 26 ± 1 | 196 ± 23 | 3.3 ± 0.4 | |
| Rat cell line | ||||
| H9c2 | 59 ± 16 | 110 ± 19 | 2.7 ± 0.8 | |
| Cell Line | Sulfane Sulfur | Cysteine | GSH | GSSG | [GSH]/ [GSSG] | References |
|---|---|---|---|---|---|---|
| nmole/mg Protein | ||||||
| Mouse cell lines | ||||||
| MNuMG | 190 ± 42 | <LOQ | 64 ± 2 | 3 ± 0.2 | 21 ± 2 | |
| 4T1 | 83 ± 9 | 0.3 ± 0.2 | 17 ± 3 | 1 ± 0.1 | 12 ± 2 | |
| MEF | 94 ± 17 | 0.2 ± 0.1 | 28 ± 6 | 2 ± 0.5 | 15 ± 5 | |
| B16-F1 | 124 ± 5 | 1 ± 0.1 | 37 ± 1 | 1 ± 0.3 | 33 ± 9 | |
| WT | 176 ± 23 | 2 ± 0.04 | 38 ± 4 | 4 ± 0.4 | 11 ± 0.04 | [36] |
| Naglu−/− | 126 ± 18 | 2 ± 0.01 | 7 ± 1 | 1 ± 0.1 | 10 ± 2 | |
| Human cell lines | ||||||
| Caco-2 | 93 ± 12 | 0.5 ± 0.1 | 60 ± 7 | 7 ± 1 | 8 ± 1 | |
| HEK | 140 ± 7 | 0.2 a | 35 ± 2 | 3 ± 0.2 | 11 ± 1 | |
| MG-63 | 65 ± 12 | 0.2 a | 15 ± 2 | 1 ± 0.1 | 20 ± 4 | |
| U373 | 147 ± 23 | no data | 13 ± 2 # | no data | no data | [37] |
| SH-SY5Y | 41 ± 15 | no data | 1.8 | no data | no data | [5] |
| U87MG | 139 ± 47 | no data | 2.4 | no data | no data | |
| Rat cell line | ||||||
| H9c2 | 69 ± 17 | 0.5 a | 14 ± 2 | 0.3 a | NA | |
Publisher’s Note: MDPI stays neutral with regard to jurisdictional claims in published maps and institutional affiliations. |
© 2021 by the authors. Licensee MDPI, Basel, Switzerland. This article is an open access article distributed under the terms and conditions of the Creative Commons Attribution (CC BY) license (https://creativecommons.org/licenses/by/4.0/).
Share and Cite
Kaczor-Kamińska, M.; Kaminski, K.; Wróbel, M. The Expression and Activity of Rhodanese, 3-Mercaptopyruvate Sulfurtransferase, Cystathionine γ-Lyase in the Most Frequently Chosen Cellular Research Models. Biomolecules 2021, 11, 1859. https://doi.org/10.3390/biom11121859
Kaczor-Kamińska M, Kaminski K, Wróbel M. The Expression and Activity of Rhodanese, 3-Mercaptopyruvate Sulfurtransferase, Cystathionine γ-Lyase in the Most Frequently Chosen Cellular Research Models. Biomolecules. 2021; 11(12):1859. https://doi.org/10.3390/biom11121859
Chicago/Turabian StyleKaczor-Kamińska, Marta, Kamil Kaminski, and Maria Wróbel. 2021. "The Expression and Activity of Rhodanese, 3-Mercaptopyruvate Sulfurtransferase, Cystathionine γ-Lyase in the Most Frequently Chosen Cellular Research Models" Biomolecules 11, no. 12: 1859. https://doi.org/10.3390/biom11121859
APA StyleKaczor-Kamińska, M., Kaminski, K., & Wróbel, M. (2021). The Expression and Activity of Rhodanese, 3-Mercaptopyruvate Sulfurtransferase, Cystathionine γ-Lyase in the Most Frequently Chosen Cellular Research Models. Biomolecules, 11(12), 1859. https://doi.org/10.3390/biom11121859