
Sequential Dynamics of Stearoyl-CoA Desaturase-1(SCD1)/Ligand Binding and Unbinding Mechanism: A Computational Study


Abstract
:1. Introduction
2. Materials and Methods
2.1. Model Construction and Simulations
2.2. Molecular Dynamics Analysis
3. Results
3.1. Structure and Dynmaics of Substrate, Product, Apoprotein, and CoA Models
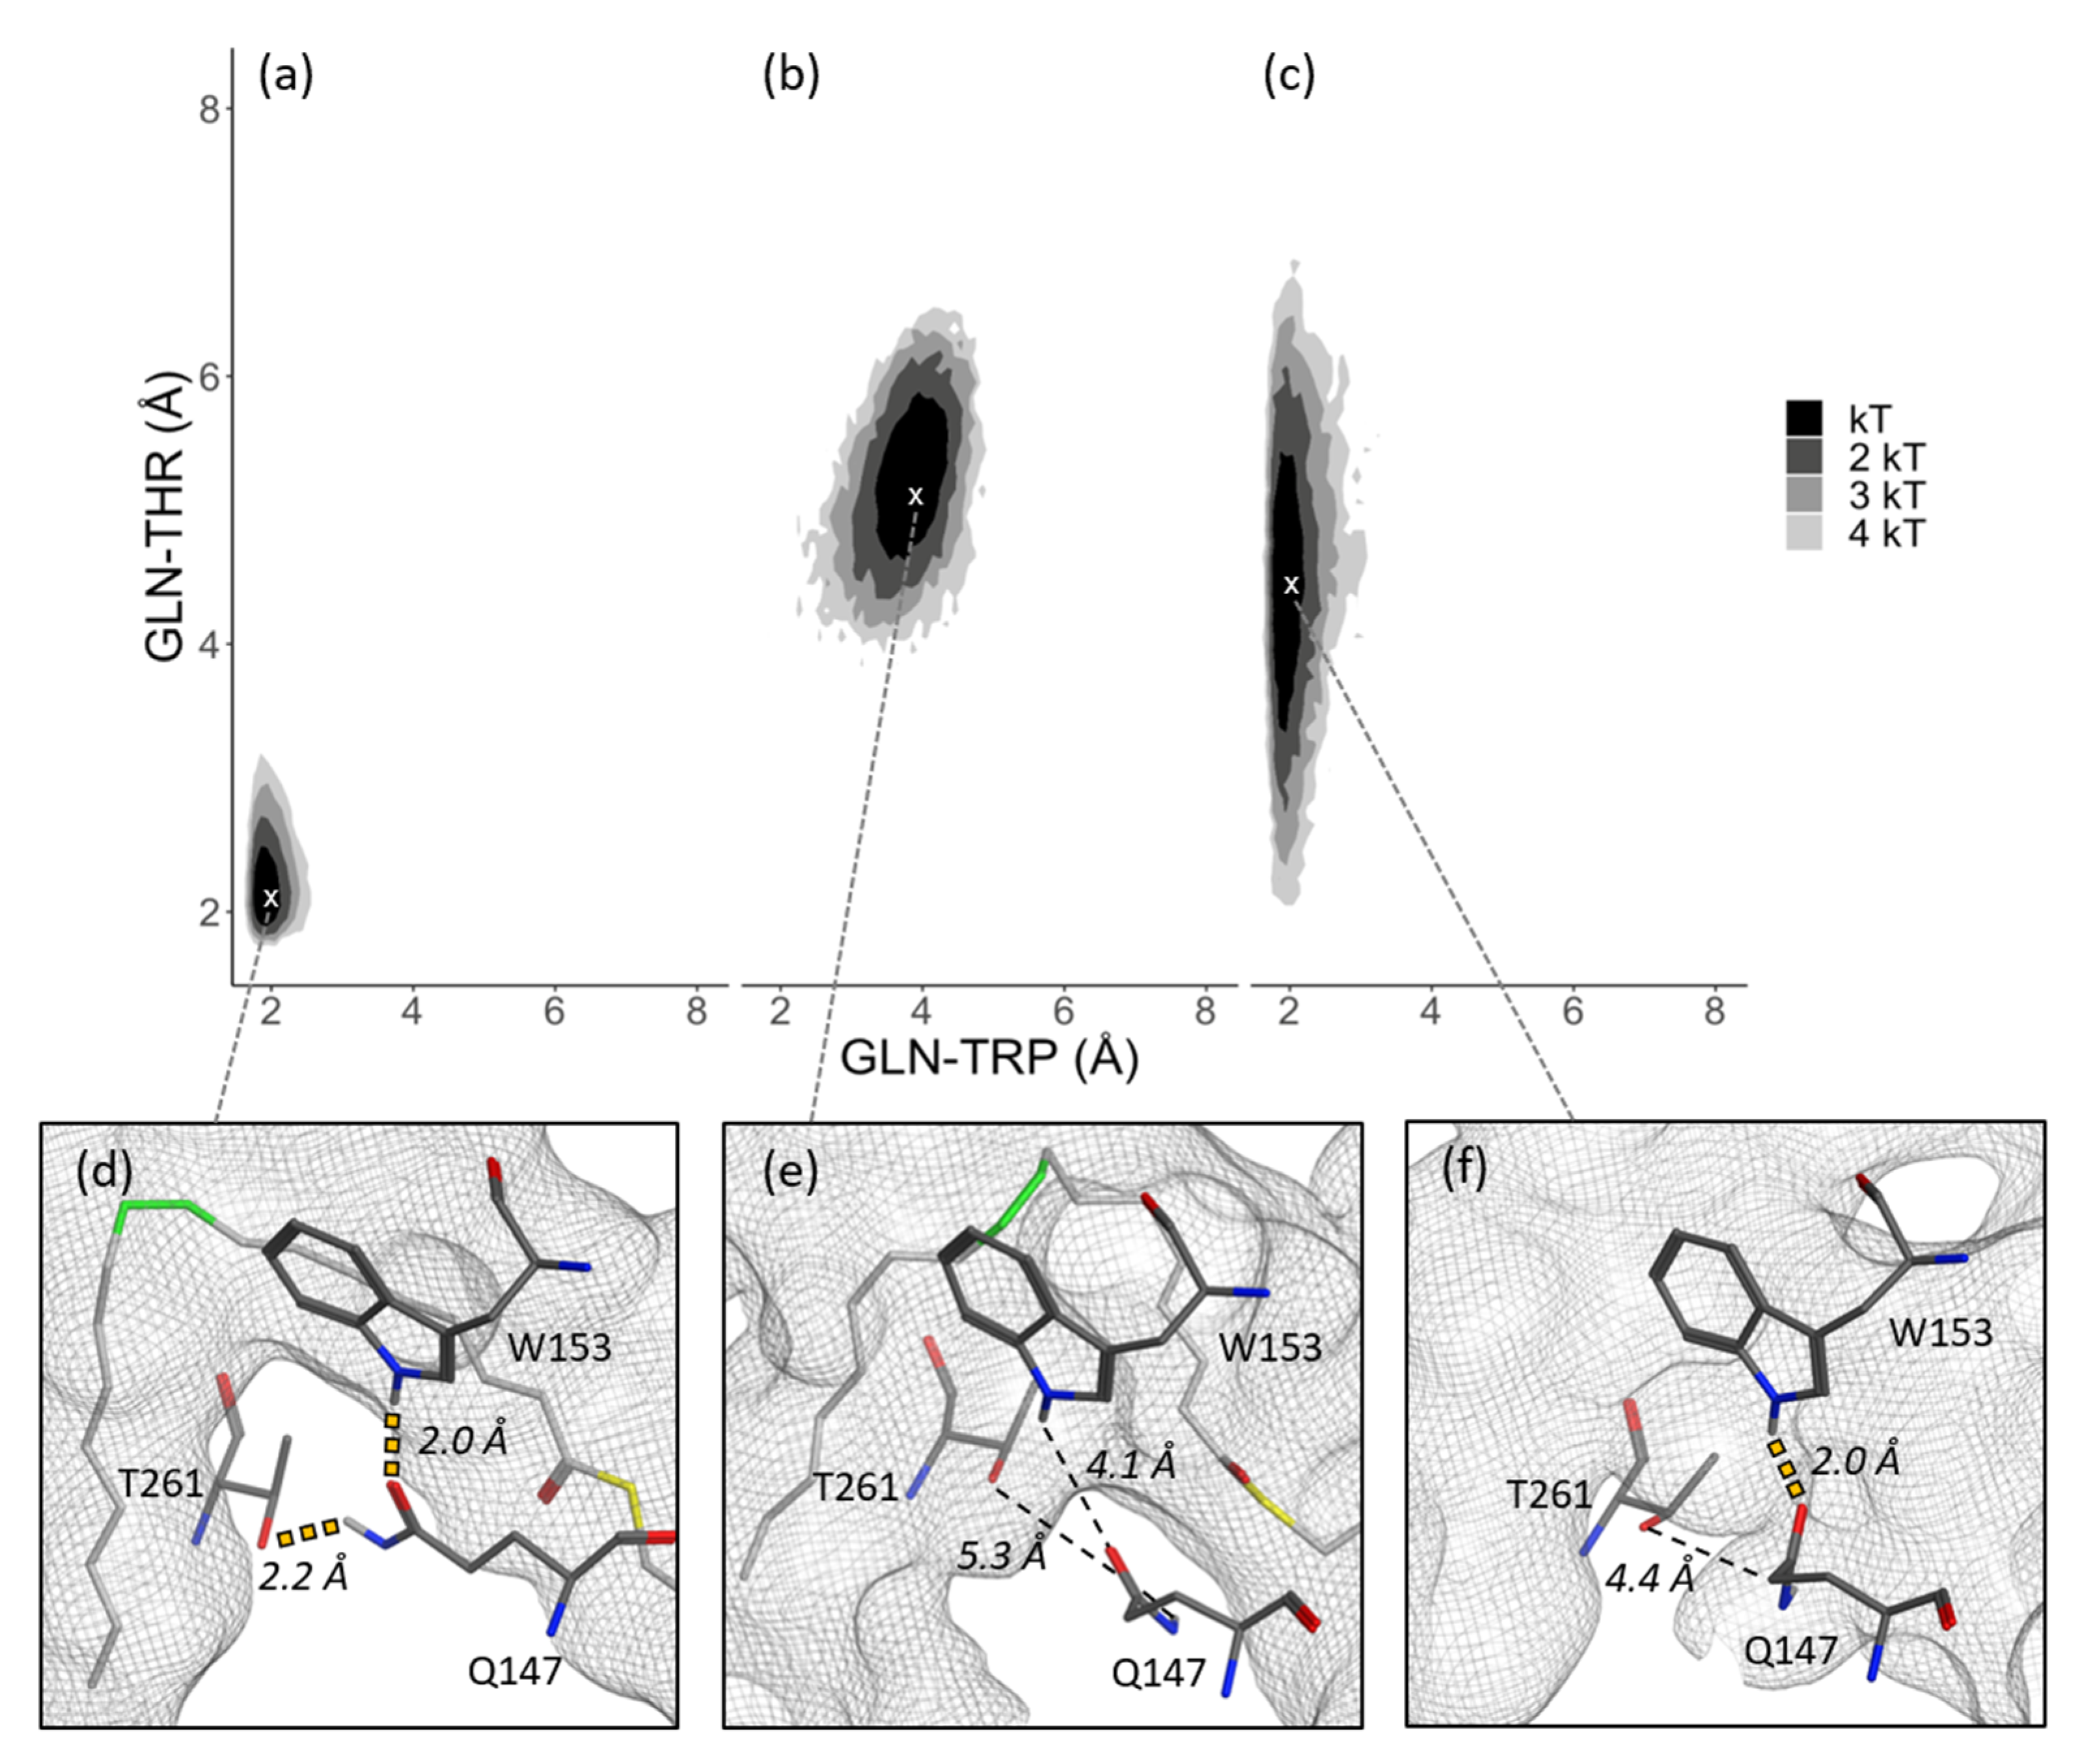
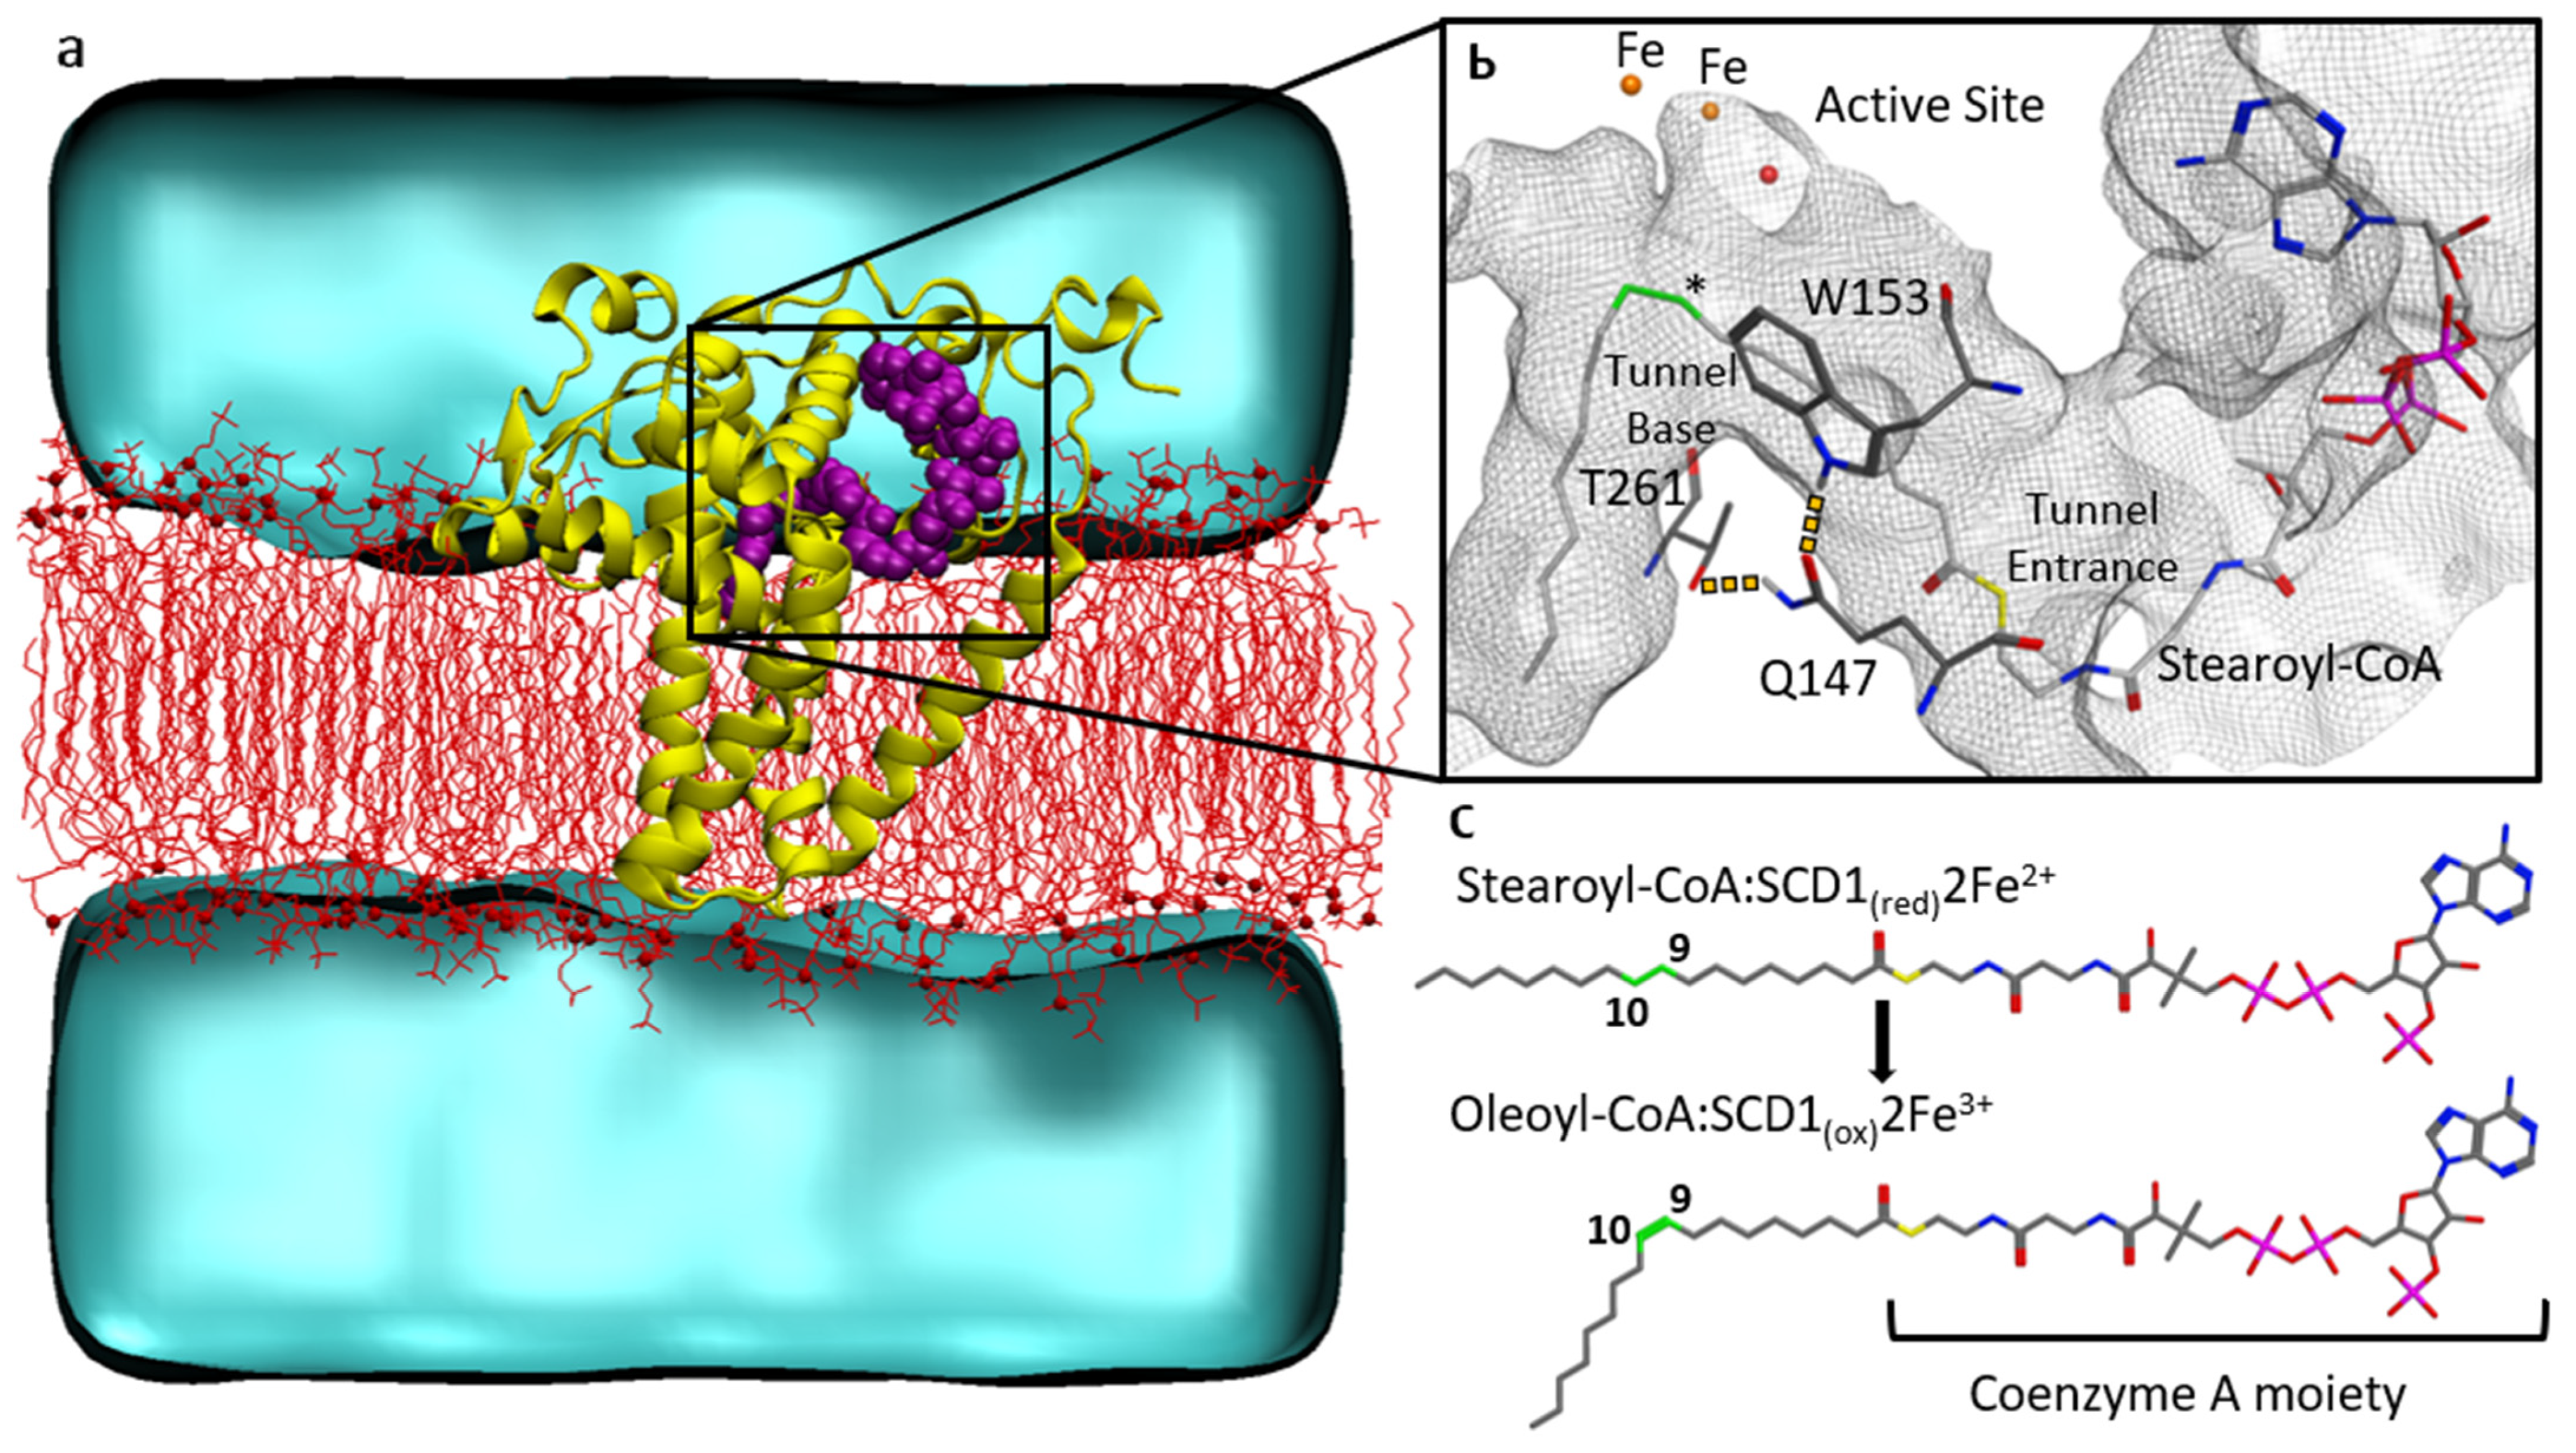
3.2. Substrate Tunnel Kink and Protein’s Hydrogen Bond Network
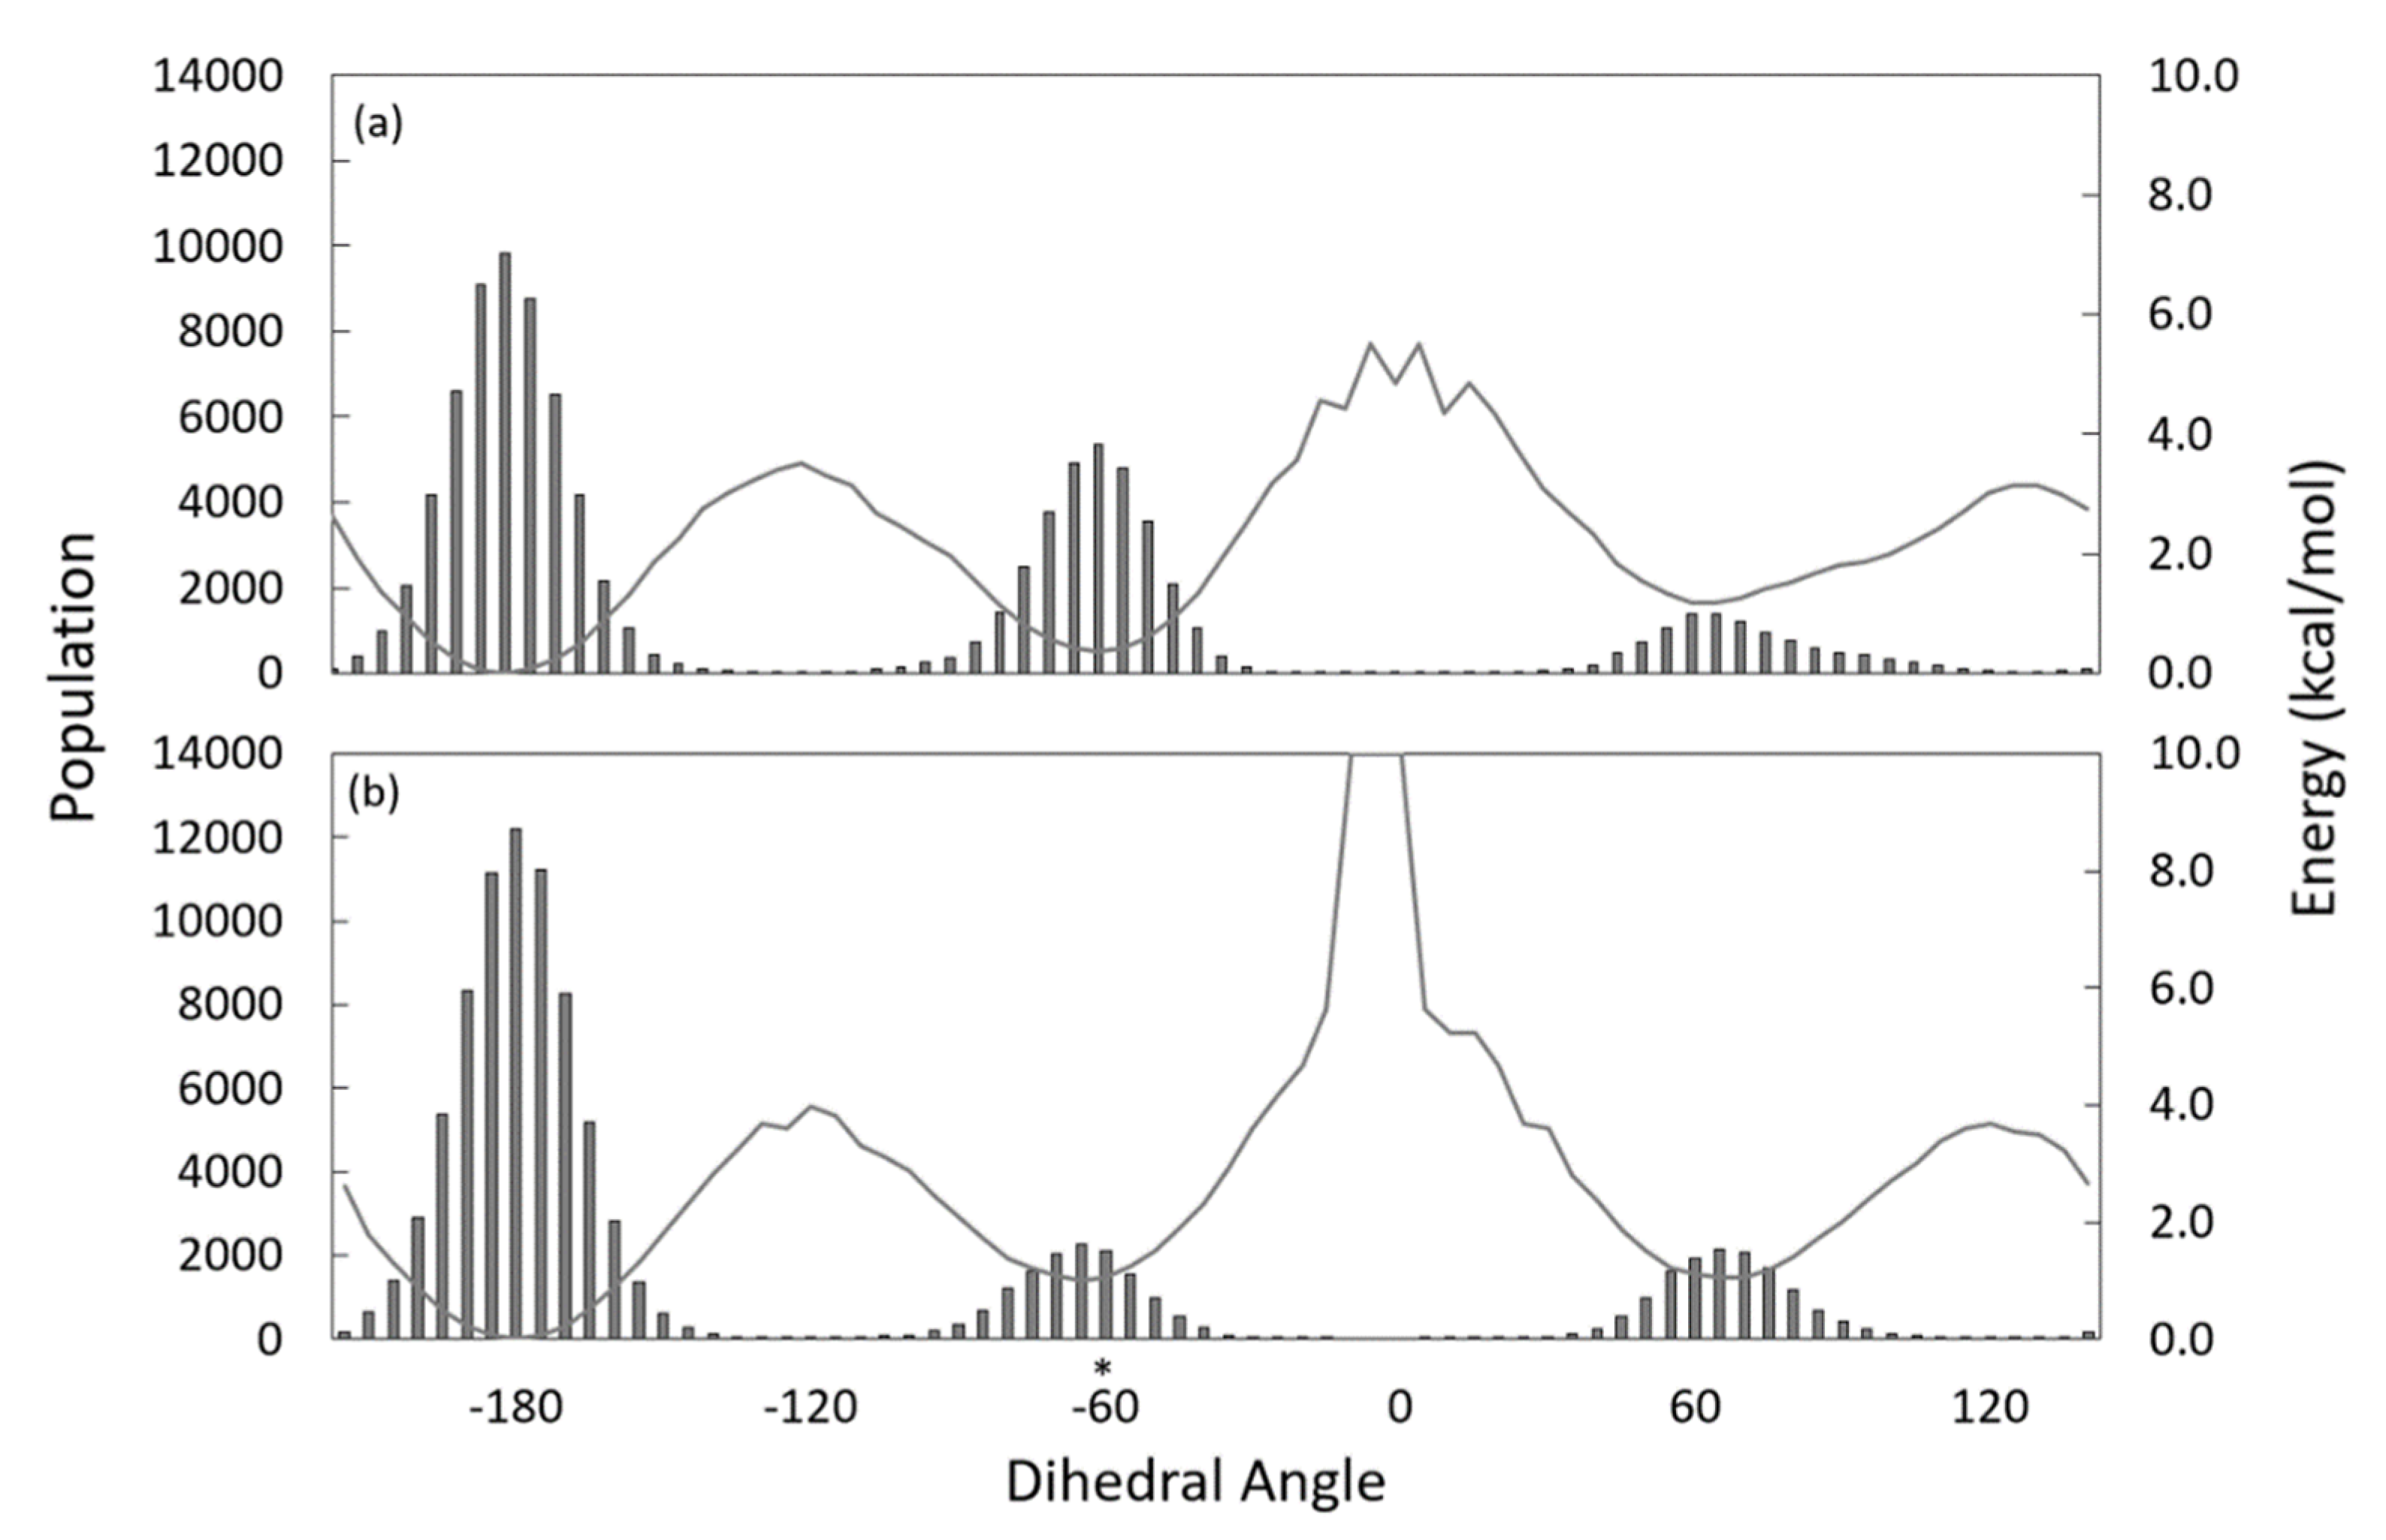
3.3. Substrate Tunnel Kink and C9-C10 Dihedral
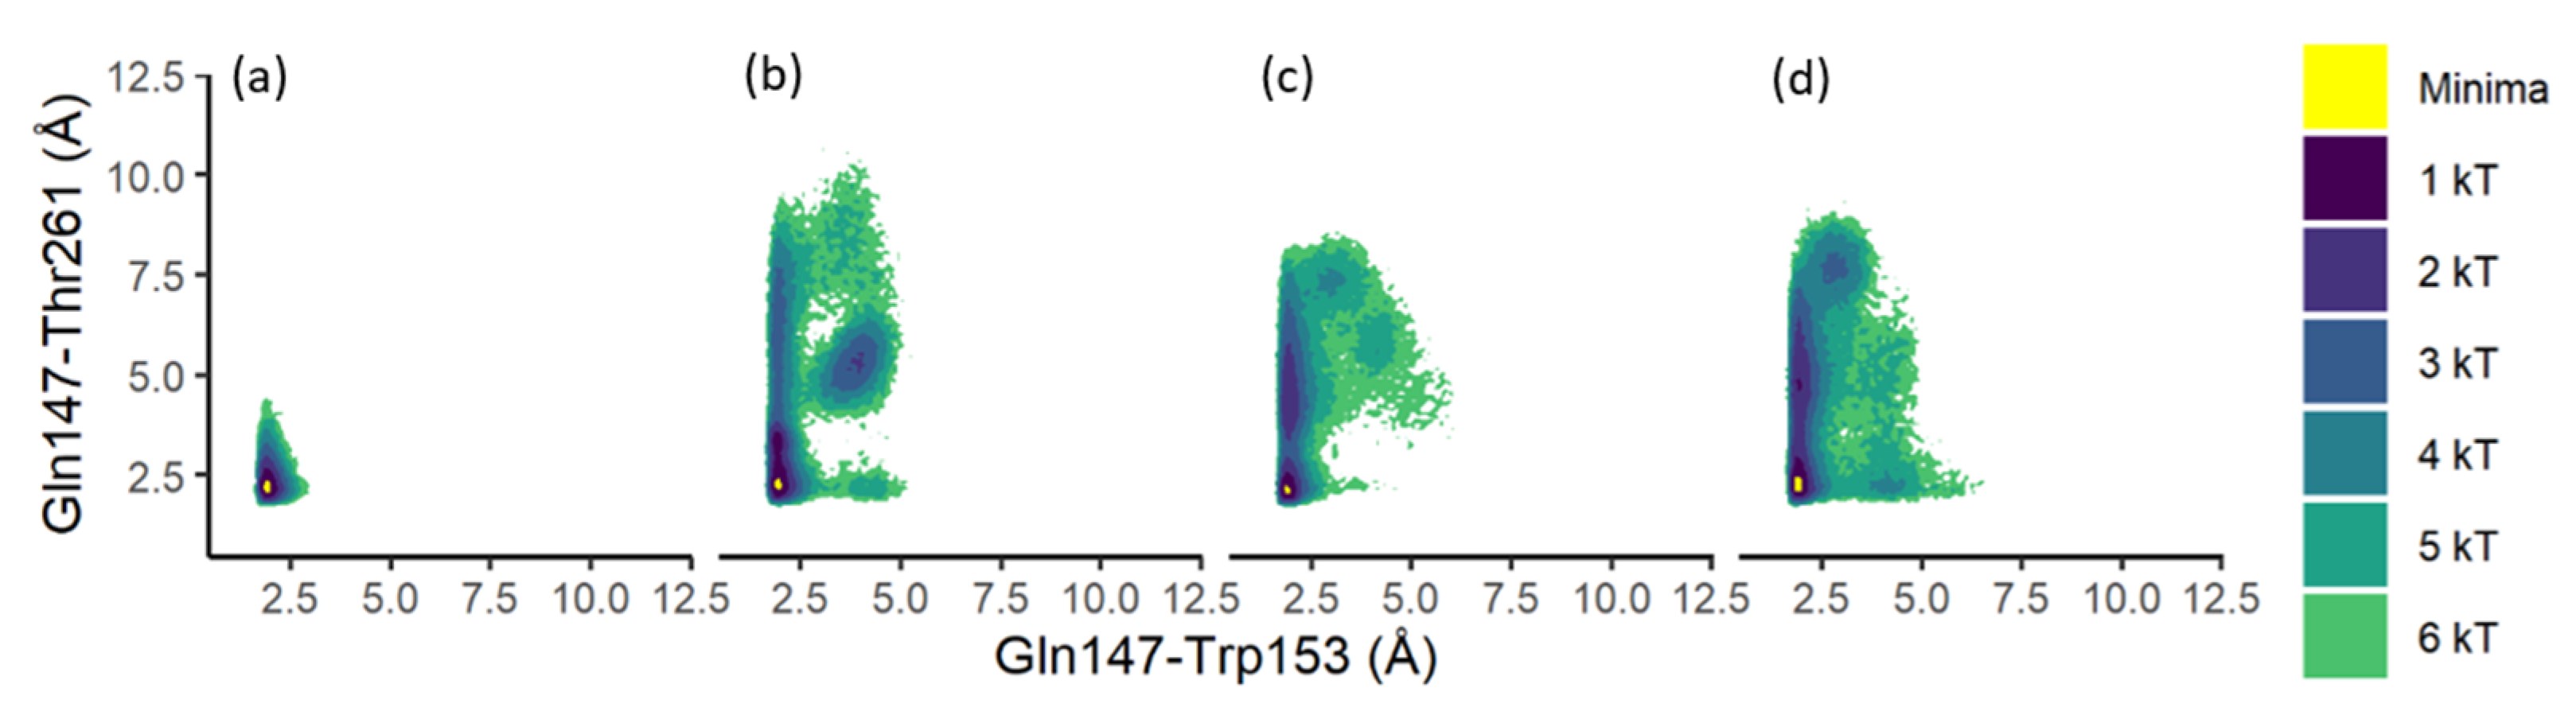
3.4. Residue Distance and Tunnel Shape
4. Discussion
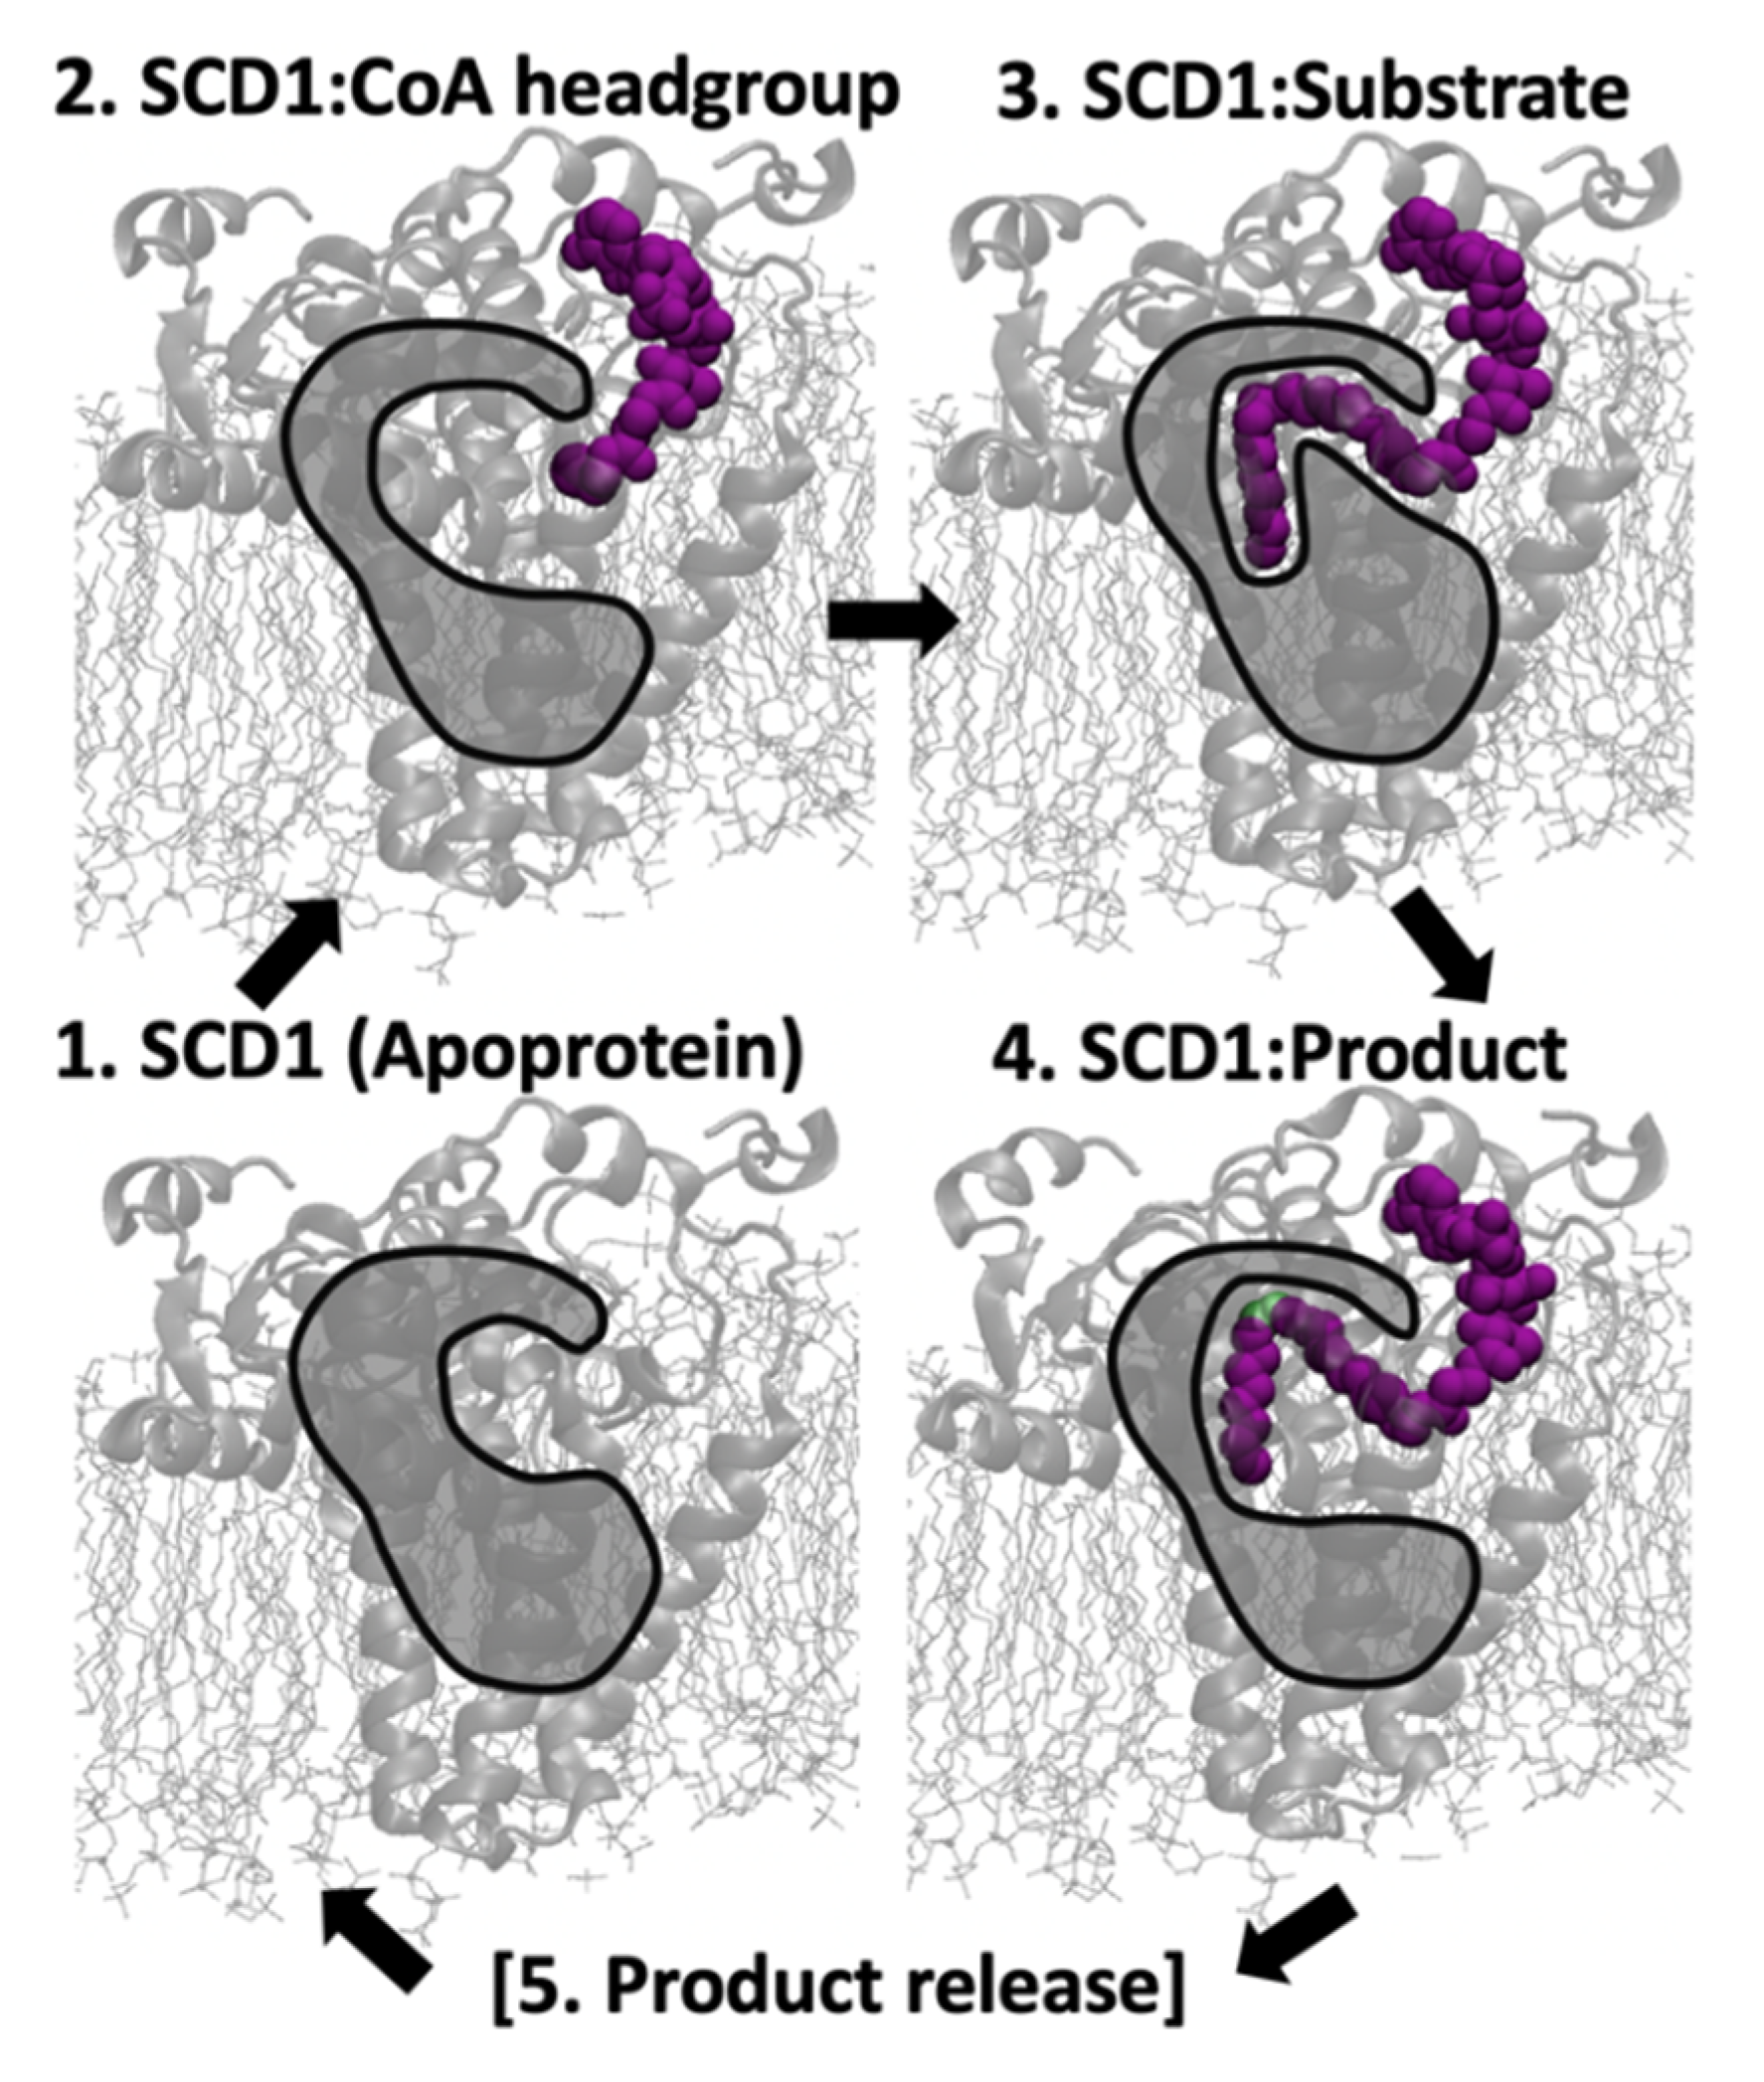
4.1. From Apoprotein to Substrate Insertion
4.2. From Inserted Substrate to Product
5. Conclusions
Supplementary Materials
Author Contributions
Funding
Institutional Review Board Statement
Informed Consent Statement
Data Availability Statement
Acknowledgments
Conflicts of Interest
References
- AL Johani, A.M.; Syed, D.N.; Ntambi, J.M. Insights into Stearoyl-CoA Desaturase-1 Regulation of Systemic Metabolism. Trends Endocrinol. Metab. 2017, 28, 831–842. [Google Scholar] [CrossRef]
- Enoch, H.G.; Catala, A.; Strittmatter, P. Mechanism of Rat Liver Microsomal Stearyl-CoA Desaturase. J. Biol. Chem. 1976, 251, 5095–5103. [Google Scholar] [CrossRef]
- Paton, C.M.; Ntambi, J.M. Biochemical and physiological function of stearoyl-CoA desaturase. Am. J. Physiol.—Endocrinol. Metab. 2009, 297, 28–37. [Google Scholar] [CrossRef] [Green Version]
- Mauvoisin, D.; Mounier, C. Hormonal and nutritional regulation of SCD1 gene expression. Biochimie 2011, 93, 78–86. [Google Scholar] [CrossRef]
- Liu, X.; Strable, M.S.; Ntambi, J.M. Stearoyl CoA Desaturase 1: Role in Cellular Inflammation and Stress. Adv. Nutr. 2011, 2, 15–22. [Google Scholar] [CrossRef] [Green Version]
- Miyazaki, M.; Sampath, H.; Liu, X.; Flowers, M.T.; Chu, K.; Dobrzyn, A.; Ntambi, J.M. Stearoyl-CoA Desaturase Attenuates Obesity and Insulin Resistance in Leptin-Resistant Obese Mice. Biochem. Biophys. Res. Comm. 2010, 380, 818–822. [Google Scholar] [CrossRef] [Green Version]
- Ntambi, J.M.; Miyazaki, M.; Stoehr, J.P.; Lan, H.; Kendziorski, C.M.; Yandell, B.S.; Song, Y.; Cohen, P.; Friedman, J.M.; Attie, A.D. Loss of stearoyl-CoA desaturase-1 function protects mice against adiposity. Proc. Natl. Acad. Sci. USA 2002, 99, 11482–11486. [Google Scholar] [CrossRef] [Green Version]
- Warensjö, E.; Risérus, U.; Vessby, B. Fatty acid composition of serum lipids predicts the development of the metabolic syndrome in men. Diabetologia 2005, 48, 1999–2005. [Google Scholar] [CrossRef] [Green Version]
- Igal, R.A. Stearoyl CoA desaturase-1: New insights into a central regulator of cancer metabolism. Biochim. Biophys. Acta—Mol. Cell Biol. Lipids 2016, 1861, 1865–1880. [Google Scholar] [CrossRef]
- Tracz-Gaszewska, Z.; Dobrzyn, P. Stearoyl-CoA desaturase 1 as a therapeutic target for the treatment of cancer. Cancers 2019, 11, 948. [Google Scholar] [CrossRef] [Green Version]
- She, K.; Fang, S.; Du, W.; Fan, X.; He, J.; Pan, H.; Huang, L.; He, P.; Huang, J. SCD1 is required for EGFR-targeting cancer therapy of lung cancer via re-activation of EGFR/PI3K/AKT signals. Cancer Cell Int. 2019, 19, 103–114. [Google Scholar] [CrossRef]
- Oballa, R.M.; Belair, L.; Black, W.C.; Bleasby, K.; Chan, C.C.; Desroches, C.; Du, X.; Gordon, R.; Guay, J.; Guiral, S.; et al. Development of a liver-targeted stearoyl-CoA desaturase (SCD) inhibitor (MK-8245) to establish a therapeutic window for the treatment of diabetes and dyslipidemia. J. Med. Chem. 2011, 54, 5082–5096. [Google Scholar] [CrossRef]
- Chen, L.; Ren, J.; Yang, L.; Li, Y.; Fu, J.; Li, Y.; Fu, J.; Li, Y.; Tian, Y.; Qiu, F.; et al. Stearoyl-CoA desaturase-1 mediated cell apoptosis in colorectal cancer by promoting ceramide synthesis. Sci. Rep. 2016, 6, 19665. [Google Scholar] [CrossRef] [Green Version]
- Imamura, K.; Tomita, N.; Kawakita, Y.; Ito, Y.; Ono, K.; Nii, N.; Miyazaki, T.; Yonemori, K.; Tawakita, Y.; Tawada, M.; et al. Discovery of Novel and Potent Stearoyl Coenzyme A Desaturase 1 (SCD1) Inhibitors as Anticancer Agents. Bioorg. Med. Chem. 2017, 25, 3768–3779. [Google Scholar] [CrossRef]
- Manni, A.; Richie, J.P.; Schetter, S.E.; Calcagnotto, A.; Trushin, N.; Aliaga, C.; El-Bayoumy, K. Stearoyl-CoA desaturase-1, a novel target of omega-3 fatty acids for reducing breast cancer risk in obese postmenopausal women. Eur. J. Clin. Nutr. 2017, 71, 762–765. [Google Scholar] [CrossRef]
- Xiao, J.; Liong, E.C.; Ching, Y.P.; Chang, R.C.C.; Fung, M.L.; Xu, A.M.; So, K.F.; Tipoe, G.L. Lycium barbarum polysaccharides protect rat liver from non-alcoholic steatohepatitis-induced injury. Nutr. Diabetes 2013, 3, e81. [Google Scholar] [CrossRef]
- Zhang, Z.; Dales, N.A.; Winther, M.D. Opportunities and challenges in developing stearoyl-coenzyme A desaturase-1 inhibitors as novel therapeutics for human disease. J. Med. Chem. 2014, 57, 5039–5056. [Google Scholar] [CrossRef]
- Wang, H.; Klein, M.G.; Zou, H.; Lane, W.; Snell, G.; Levin, I.; Li, K.; Sang, B. Crystal structure of human stearoyl-coenzyme A desaturase in complex with substrate. Nat. Struct. Mol. Biol. 2015, 22, 581–585. [Google Scholar] [CrossRef]
- Bai, Y.; McCoy, J.G.; Levin, E.J.; Sobrado, P.; Rajashankar, K.R.; Fox, B.G.; Zhou, M. X-ray structure of a mammalian stearoyl-CoA desaturase. Nature 2015, 524, 252–256. [Google Scholar] [CrossRef] [Green Version]
- Bloch, K. Enzymatic Synthesis of Monounsaturated Fatty Acids. Acc. Chem. Res. 1969, 2, 193–202. [Google Scholar] [CrossRef]
- Abdelmagid, S.A.; Clarke, S.E.; Wong, J.; Roke, K.; Nielsen, D.; Badawi, A.; El-Sohemy, A.; Mutch, D.M.; Ma, D.W.L. Plasma concentration of cis9trans11 CLA in males and females is influenced by SCD1 genetic variations and hormonal contraceptives: A cross-sectional study. Nutr. Metab. 2013, 10, 50. [Google Scholar] [CrossRef] [Green Version]
- Tian, H.; Luo, J.; Zhang, Z.; Wu, J.; Zhang, T.; Busato, S.; Huang, L.; Song, N.; Bionaz, M. CRISPR/Cas9-mediated Stearoyl-CoA Desaturase 1 (SCD1) Deficiency Affects Fatty Acid Metabolism in Goat Mammary Epithelial Cells. J. Agric. Food Chem. 2018, 66, 10041–10052. [Google Scholar] [CrossRef]
- Zhang, M.; Sun, W.; Zhou, M.; Tang, Y. MicroRNA-27a regulates hepatic lipid metabolism and alleviates NAFLD via repressing FAS and SCD1. Sci. Rep. 2017, 7, 14493. [Google Scholar] [CrossRef]
- Shanklin, J.; Whittle, E.; Fox, B.G. Eight Histidine Residues Are Catalytically Essential in a Membrane-Associated Iron Enzyme, Stearoyl-CoA Desaturase, and Are Conserved in Alkane Hydroxylase and Xylene Monooxygenase. Biochemistry 1994, 33, 12787–12794. [Google Scholar] [CrossRef]
- Mziaut, H.; Korza, G.; Benraiss, A.; Ozols, J. Selective mutagenesis of lysyl residues leads to a stable and active form of delta 9 stearoyl-CoA desaturase. Biochim. Biophys. Acta—Mol. Cell Biol. Lipids 2002, 1583, 45–52. [Google Scholar] [CrossRef]
- Watanabe, K.; Ohno, M.; Taguchi, M.; Kawamoto, S.; Ono, K.; Aki, T. Identification of amino acid residues that determine the substrate specificity of mammalian membrane-bound front-end fatty acid desaturases. J. Lipid Res. 2016, 57, 89–99. [Google Scholar] [CrossRef] [Green Version]
- Vanhercke, T.; Shrestha, P.; Green, A.G.; Singh, S.P. Mechanistic and structural insights into the regioselectivity of an Acyl-CoA fatty acid desaturase via directed molecular evolution. J. Biol. Chem. 2011, 286, 12860–12869. [Google Scholar] [CrossRef] [Green Version]
- Whittle, E.J.; Tremblay, A.E.; Buist, P.H.; Shanklin, J. Revealing the catalytic potential of an acyl-ACP desaturase: Tandem selective oxidation of saturated fatty acids. Proc. Natl. Acad. Sci. USA 2008, 105, 14738–14743. [Google Scholar] [CrossRef] [Green Version]
- Vanommeslaeghe, K.; Hatcher, E.; Acharya, C.; Kundu, S.; Zhong, S.; Shim, J.; Darian, E.; Guvench, O.; Lopes, P.; Vorobyov, I.; et al. CHARMM General Force Field (CGenFF): A force field for drug-like molecules compatible with the CHARMM all-atom additive biological force fields. J. Comput. Chem. 2011, 31, 671–690. [Google Scholar] [CrossRef]
- Huang, J.; MacKerell, A.D. CHARMM36 all-atom additive protein force field: Validation based on comparison to NMR data. J. Comput. Chem. 2013, 34, 2135–2145. [Google Scholar] [CrossRef] [Green Version]
- Ribeiro, J.V.; Bernardi, R.C.; Rudack, T.; Stone, J.E.; Phillips, J.C.; Freddolino, P.L.; Schulten, K. QwikMD—Integrative Molecular Dynamics Toolkit for Novices and Experts. Sci. Rep. 2016, 6, 26536. [Google Scholar] [CrossRef] [Green Version]
- Kal, L.; Skeel, R.; Bhandarkar, M.; Brunner, R.; Gursoy, A.; Krawetz, N.; Phillips, J.; Shinozaki, A.; Varadarajan, K.; Schulten, K. NAMD2: Greater Scalability for Parallel Molecular Dynamics. J. Comput. Phys. 1999, 151, 283–312. [Google Scholar] [CrossRef]
- Verlet, L. Computer “experiments” on classical fluids. I. Thermodynamical properties of Lennard-Jones Molecules. Phys. Rev. 1967, 159, 98–103. [Google Scholar] [CrossRef]
- Swope, W.C.; Andersen, H.C.; Berens, P.H.; Wilson, K.R. A computer simulation method for the calculation of equilibrium constants for the formation of physical clusters of molecules: Application to small water clusters. J. Chem. Phys. 1982, 76, 637–649. [Google Scholar] [CrossRef]
- Berendsen, H.J.C.; Van Gunsteren, W.F. Molecular Dynamics Simulations: Techniques and Approaches; Molecular Liquids NATO ASI Series (Series C: Mathematical and Physical, Sciences); Barnes, A.J., Orville-Thomas, W.J., Yarwood, J., Eds.; Springer: Dordrecht, The Netherlands, 1984; Volume 135, pp. 475–500. [Google Scholar]
- Miyamoto, S.; Kollman, P.A. Settle: Analytical version of the SHAKE and RATTLE algorithm for rigid water models. J. Comput. Chem. 1992, 13, 952–962. [Google Scholar] [CrossRef]
- Lomize, M.A.; Lomize, A.L.; Pogozheva, I.D.; Mosberg, H.I. OPM: Orientations of proteins in membranes database. Bioinformatics 2006, 22, 623–625. [Google Scholar] [CrossRef]
- van Meer, G. Membrane Lipids: Where they are and how they behave. Nat. Rev. Mol. Cell Biol. 2008, 9, 112–124. [Google Scholar] [CrossRef]
- Wagner, J.R.; Sørensen, J.; Hensley, N.; Wong, C.; Zhu, C.; Perison, T.; Amaro, R.E. POVME 3.0: Software for Mapping Binding Pocket Flexibility. J. Chem. Theory Comput. 2017, 13, 4584–4592. [Google Scholar] [CrossRef]


| Name | Description | Ligand Figure |
|---|---|---|
| a. Substrate | Stearoyl-CoA with SCD1 | 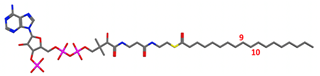 |
| b. Product | Oleoyl-CoA with SCD1 |  |
| c. Apoprotein | SCD1 | NA |
| d. CoA | CoA moiety with SCD1 |  |
| e. Substrate-waterbox | Stearoyl-CoA in waterbox (no membrane or protein) | 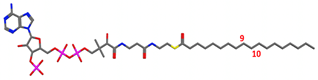 |
| kT | Substrate | Product |
|---|---|---|
| Minimum | 3.6 | 1.2 |
| 1 kT: <0.6 | 54.0 | 31.4 |
| 2 kT: 0.6–1.19 | 25.1 | 17.8 |
| 3 kT: 1.2–1.79 | 9.3 | 23.5 |
| 4 kT: 1.8–2.39 | 4.6 | 12.9 |
| 5 kT: 2.4–2.99 | 1.7 | 6.8 |
| 6 kT: 3.0–3.59 | 0.9 | 5.1 |
| 7 kT: 3.6–4.19 | 0.4 | 0.7 |
| 8 kT: 4.2–4.79 | 0.2 | 0.6 |
| 9 kT: 4.8–5.39 | 0.2 | 0.0 |
Publisher’s Note: MDPI stays neutral with regard to jurisdictional claims in published maps and institutional affiliations. |
© 2021 by the authors. Licensee MDPI, Basel, Switzerland. This article is an open access article distributed under the terms and conditions of the Creative Commons Attribution (CC BY) license (https://creativecommons.org/licenses/by/4.0/).
Share and Cite
Petroff, A.B.; Weir, R.L.; Yates, C.R.; Ng, J.D.; Baudry, J. Sequential Dynamics of Stearoyl-CoA Desaturase-1(SCD1)/Ligand Binding and Unbinding Mechanism: A Computational Study. Biomolecules 2021, 11, 1435. https://doi.org/10.3390/biom11101435
Petroff AB, Weir RL, Yates CR, Ng JD, Baudry J. Sequential Dynamics of Stearoyl-CoA Desaturase-1(SCD1)/Ligand Binding and Unbinding Mechanism: A Computational Study. Biomolecules. 2021; 11(10):1435. https://doi.org/10.3390/biom11101435
Chicago/Turabian StylePetroff, Anna B., Rebecca L. Weir, Charles R. Yates, Joseph D. Ng, and Jerome Baudry. 2021. "Sequential Dynamics of Stearoyl-CoA Desaturase-1(SCD1)/Ligand Binding and Unbinding Mechanism: A Computational Study" Biomolecules 11, no. 10: 1435. https://doi.org/10.3390/biom11101435
APA StylePetroff, A. B., Weir, R. L., Yates, C. R., Ng, J. D., & Baudry, J. (2021). Sequential Dynamics of Stearoyl-CoA Desaturase-1(SCD1)/Ligand Binding and Unbinding Mechanism: A Computational Study. Biomolecules, 11(10), 1435. https://doi.org/10.3390/biom11101435