Hyperoxia Alters Ultrastructure and Induces Apoptosis in Leukemia Cell Lines
Abstract
1. Introduction
2. Material and Methods
2.1. Cell Lines
2.2. Protein Extraction and Western Blot
2.3. Caspase-3
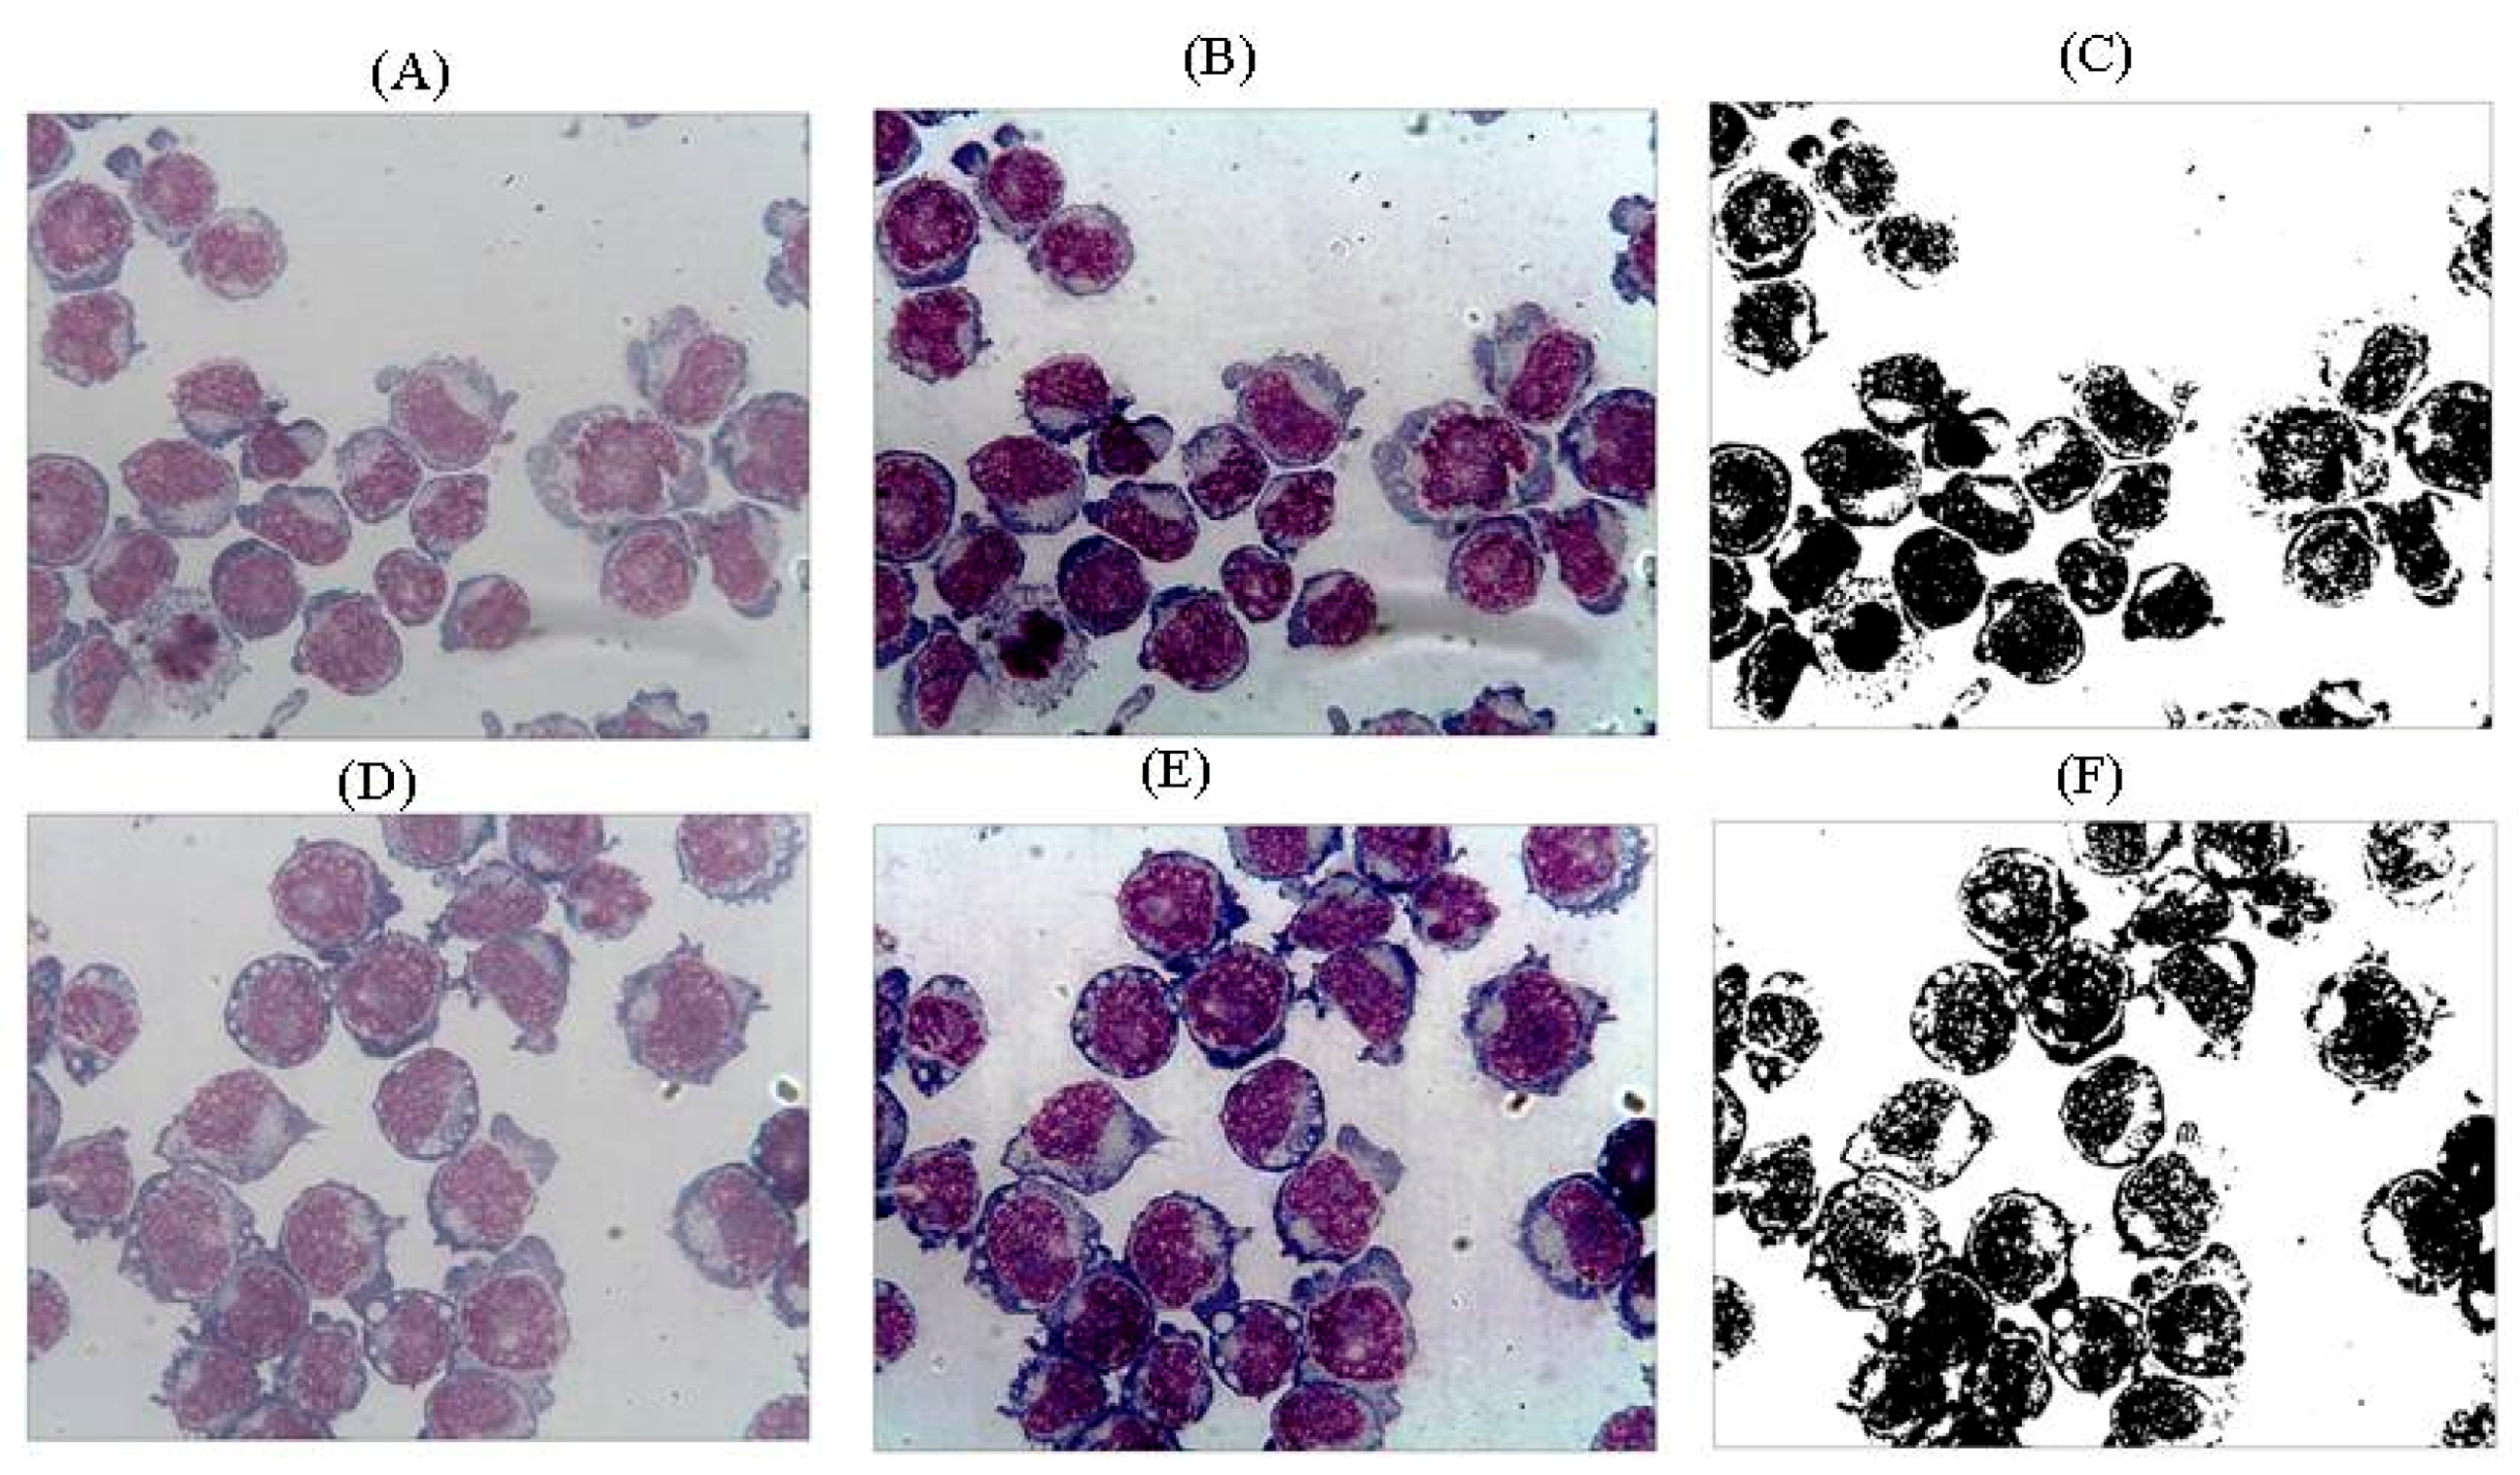
2.4. Pictures of Thin Layer Cell Preparation
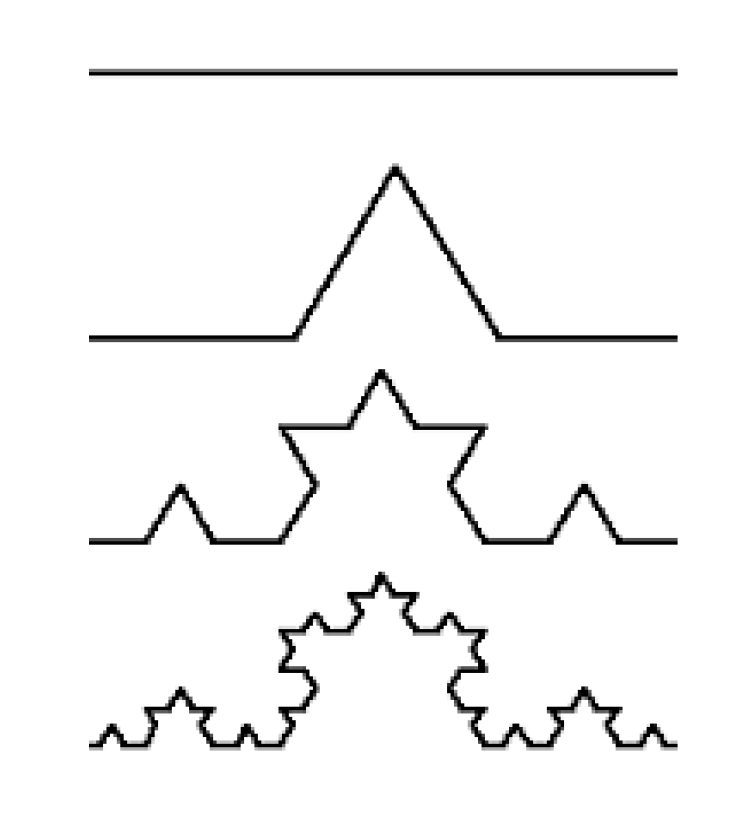
2.5. Fractals
2.6. Statistics
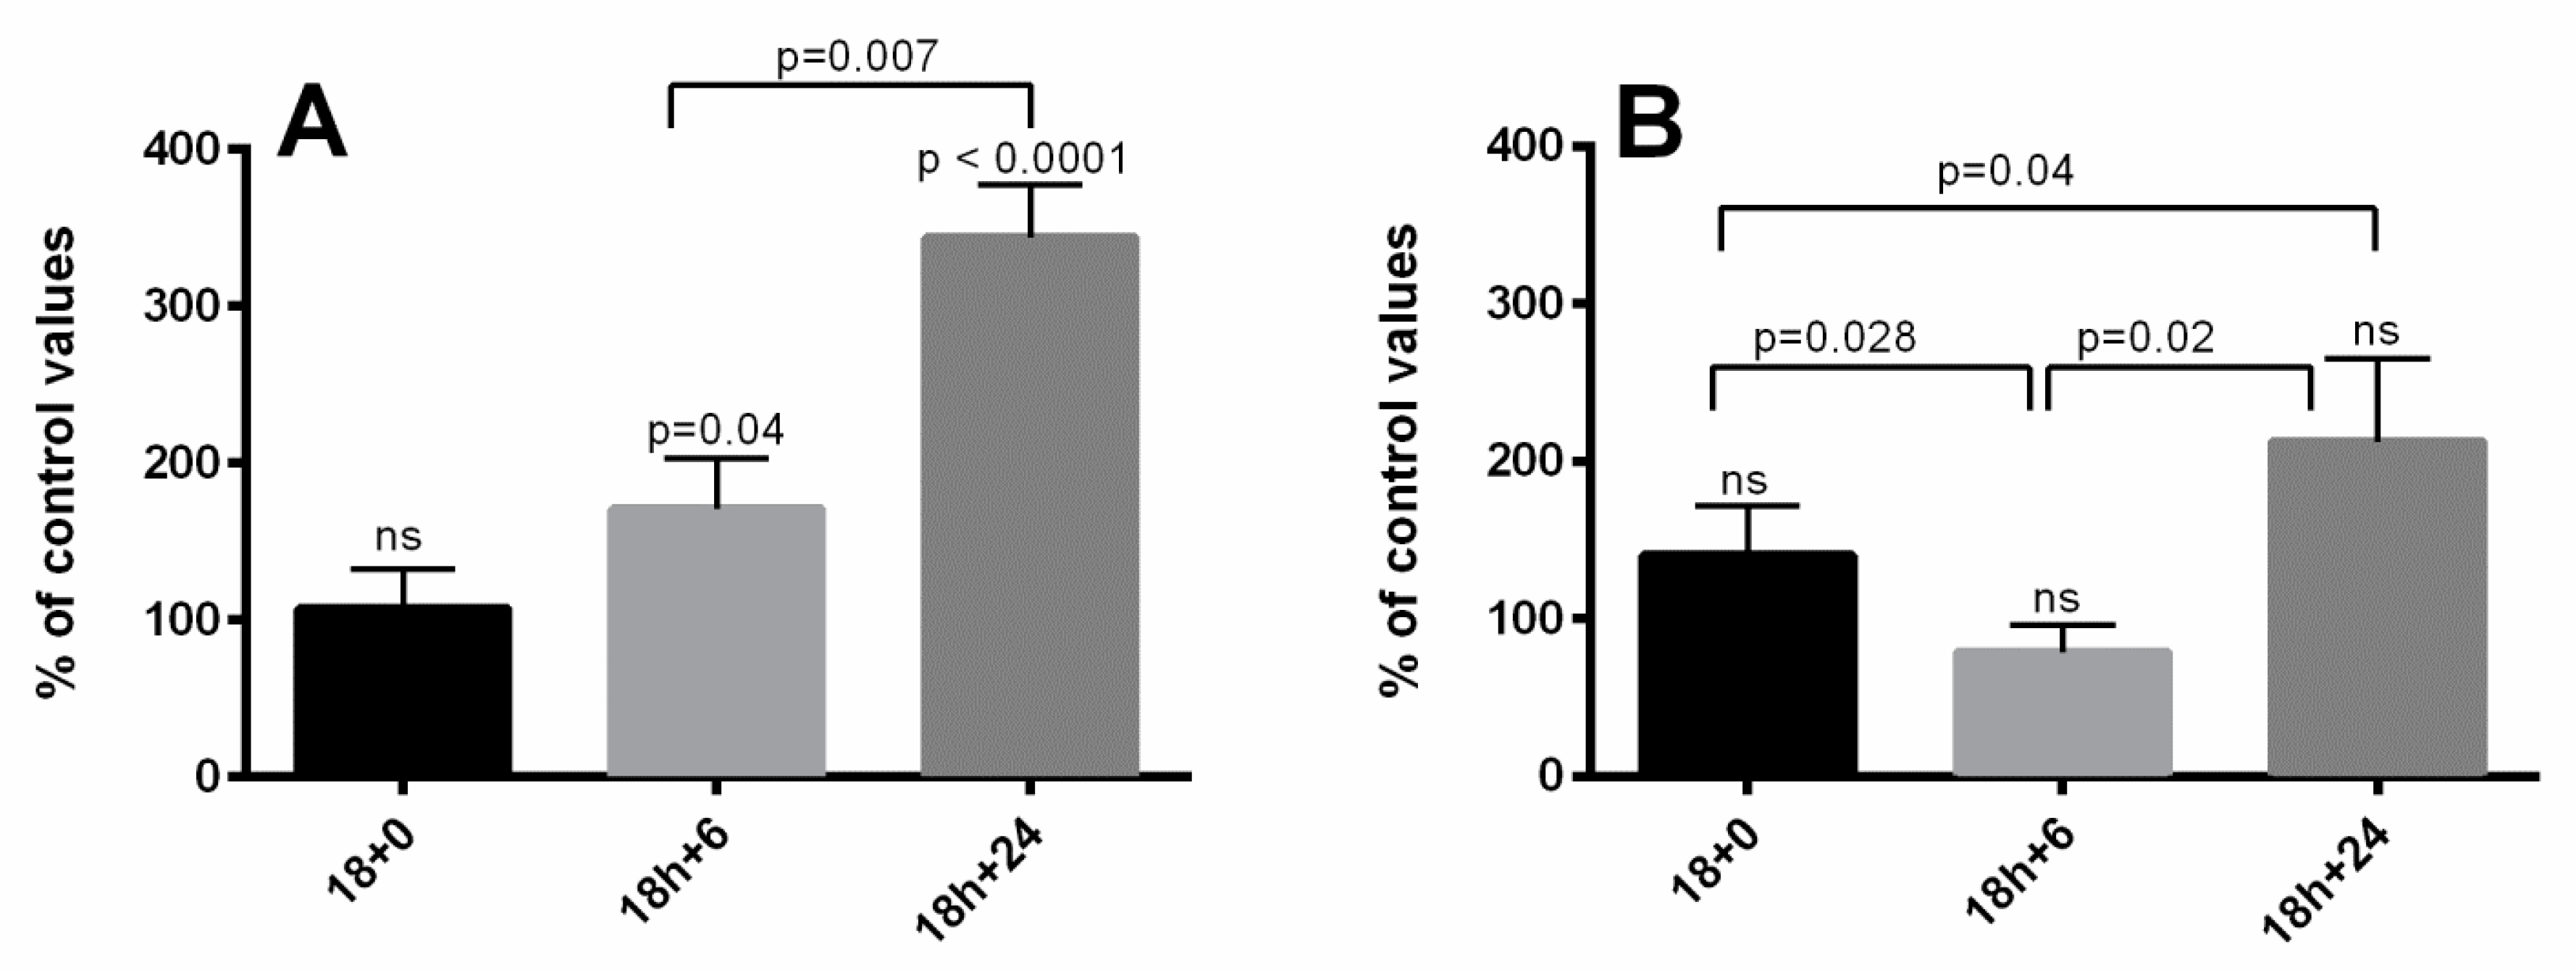
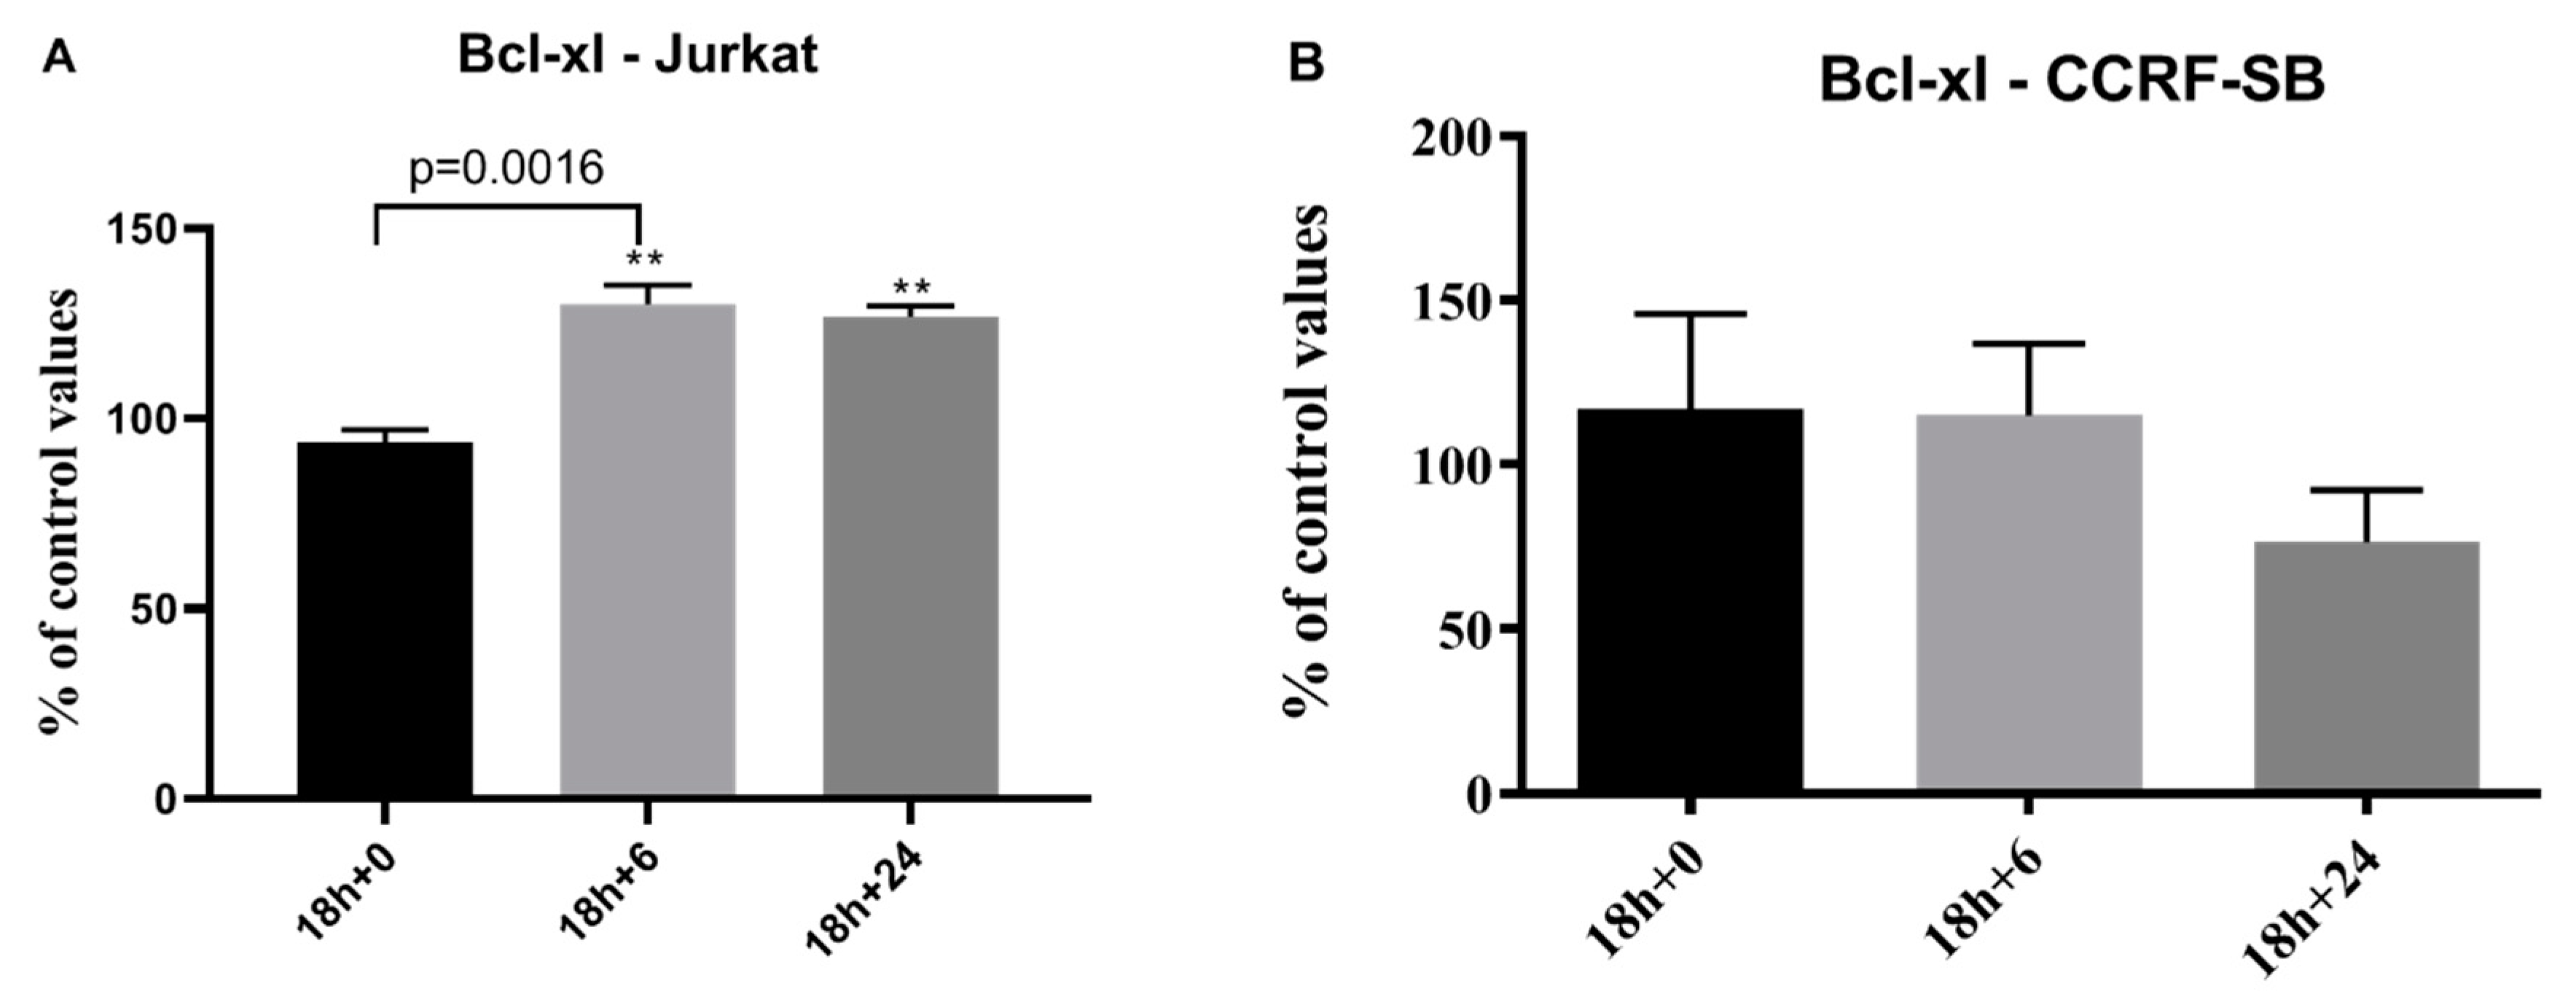
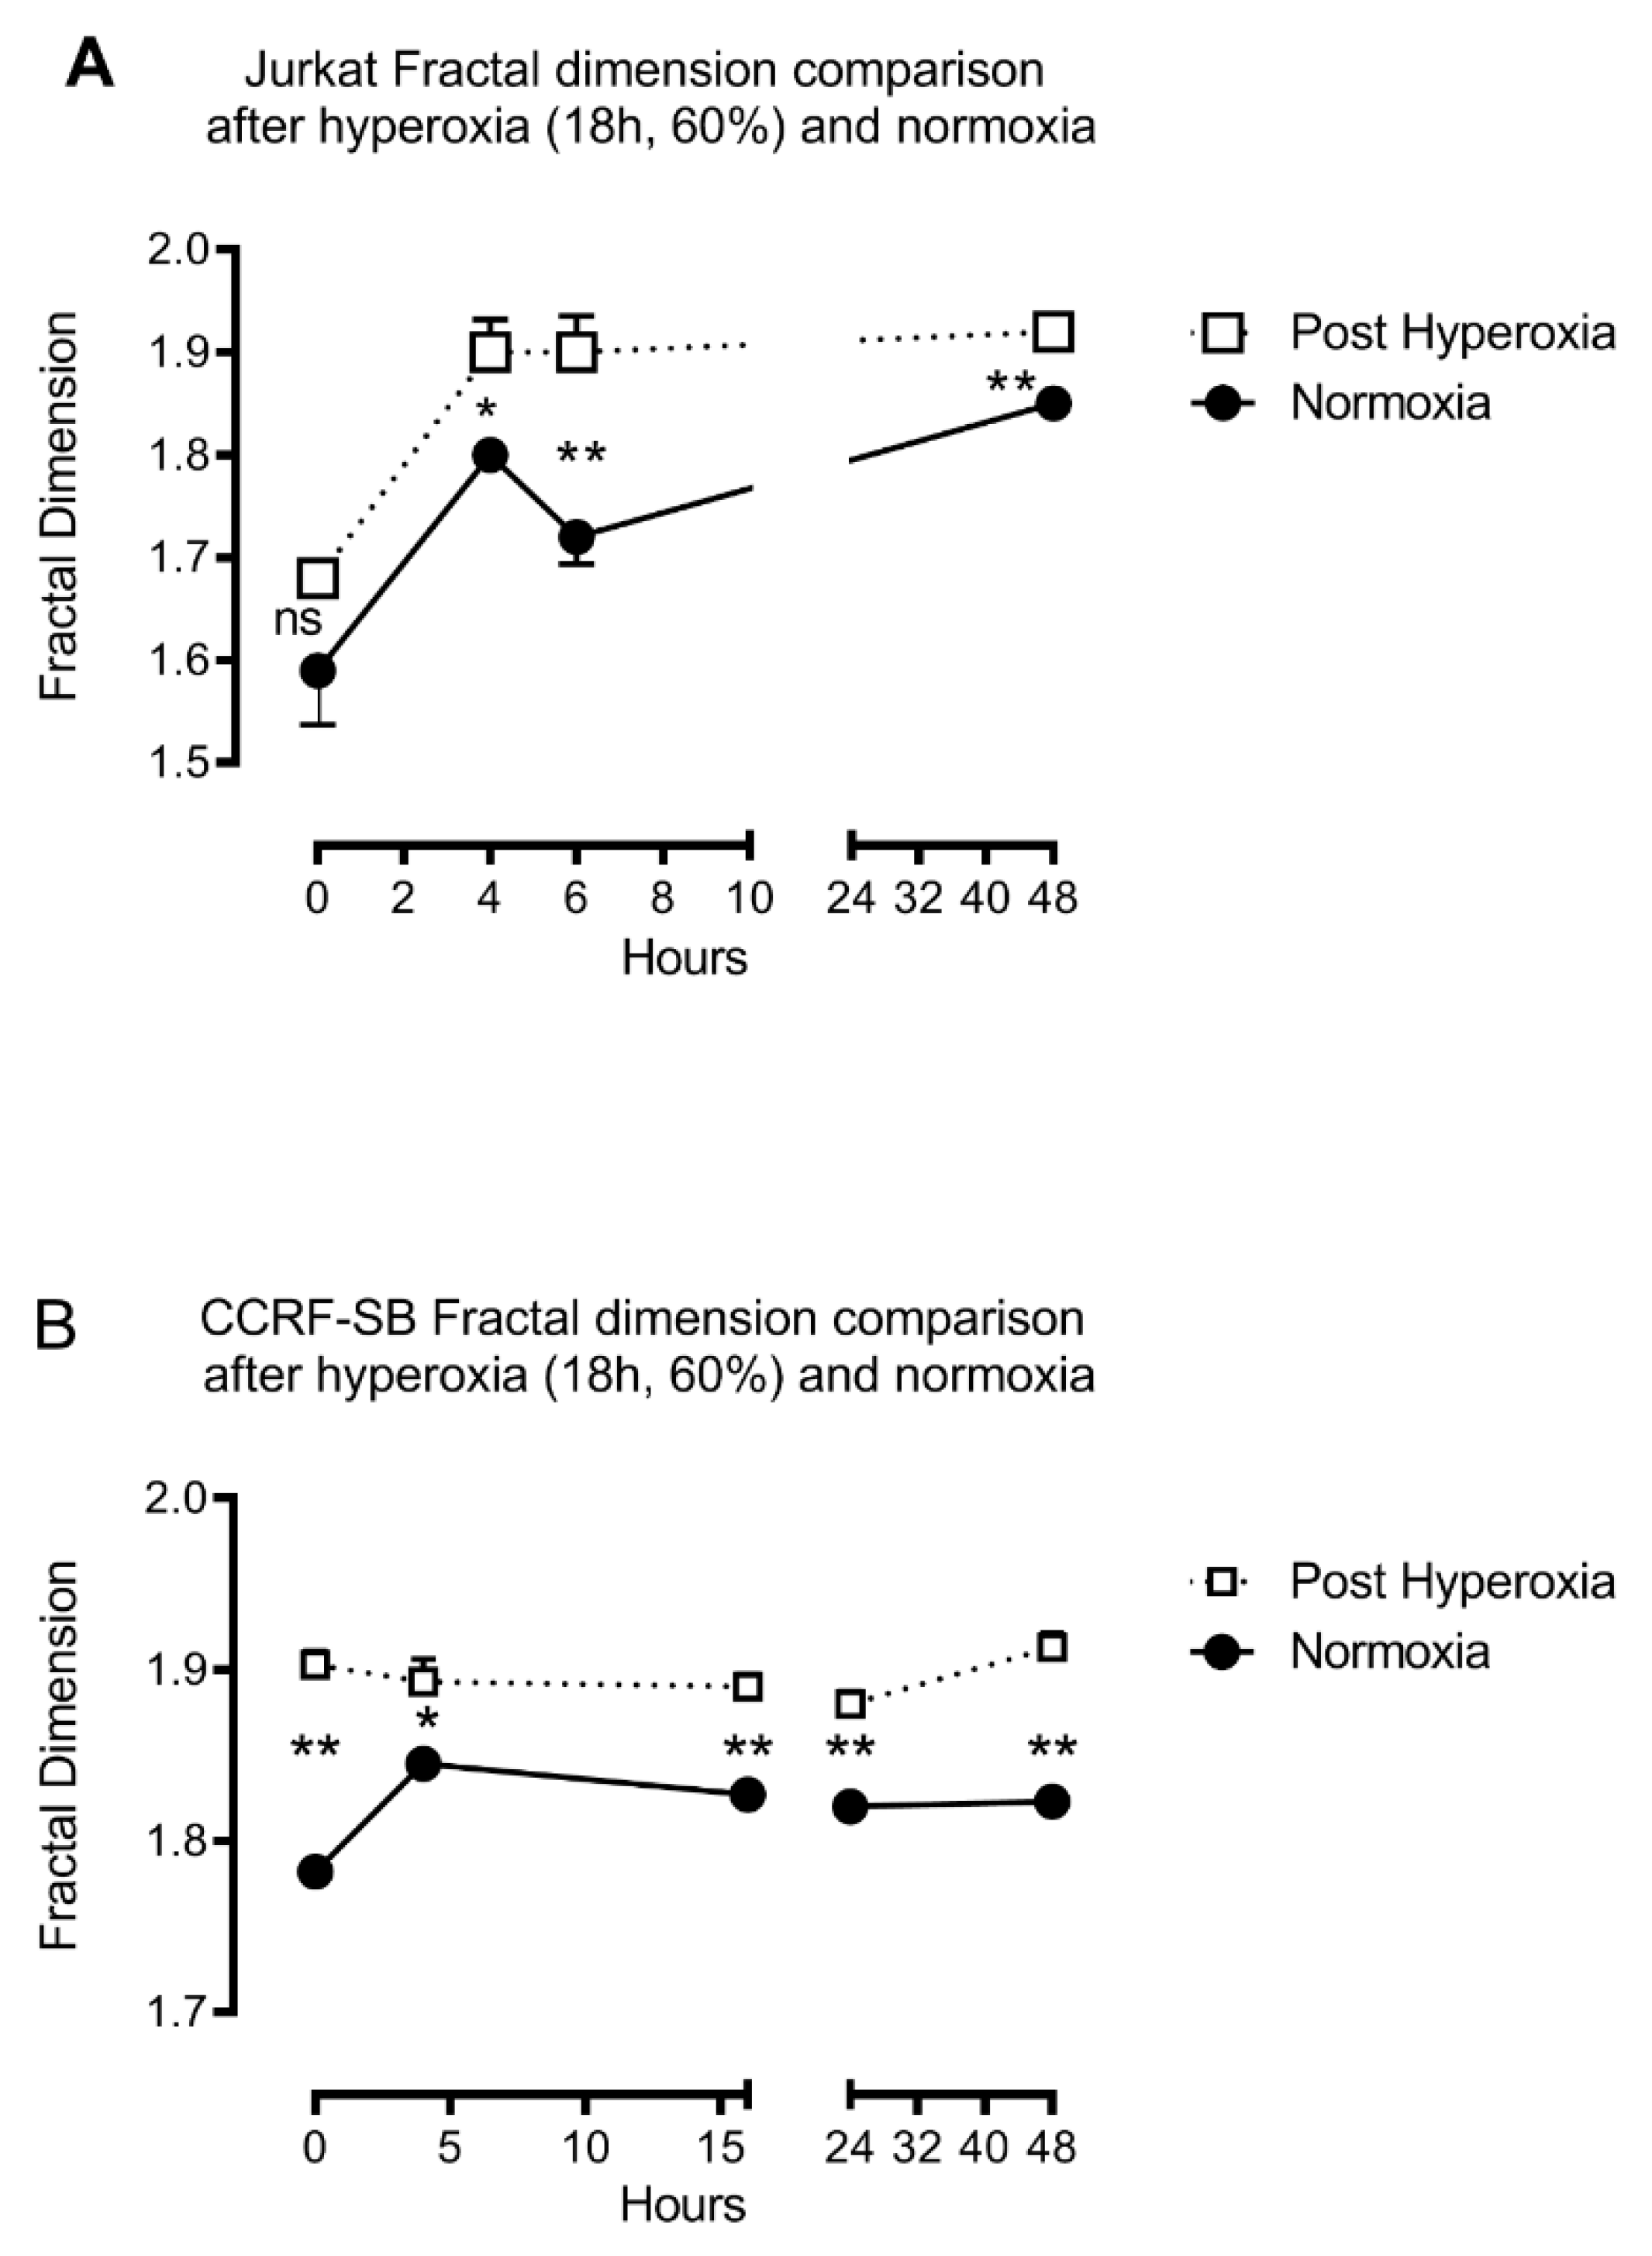
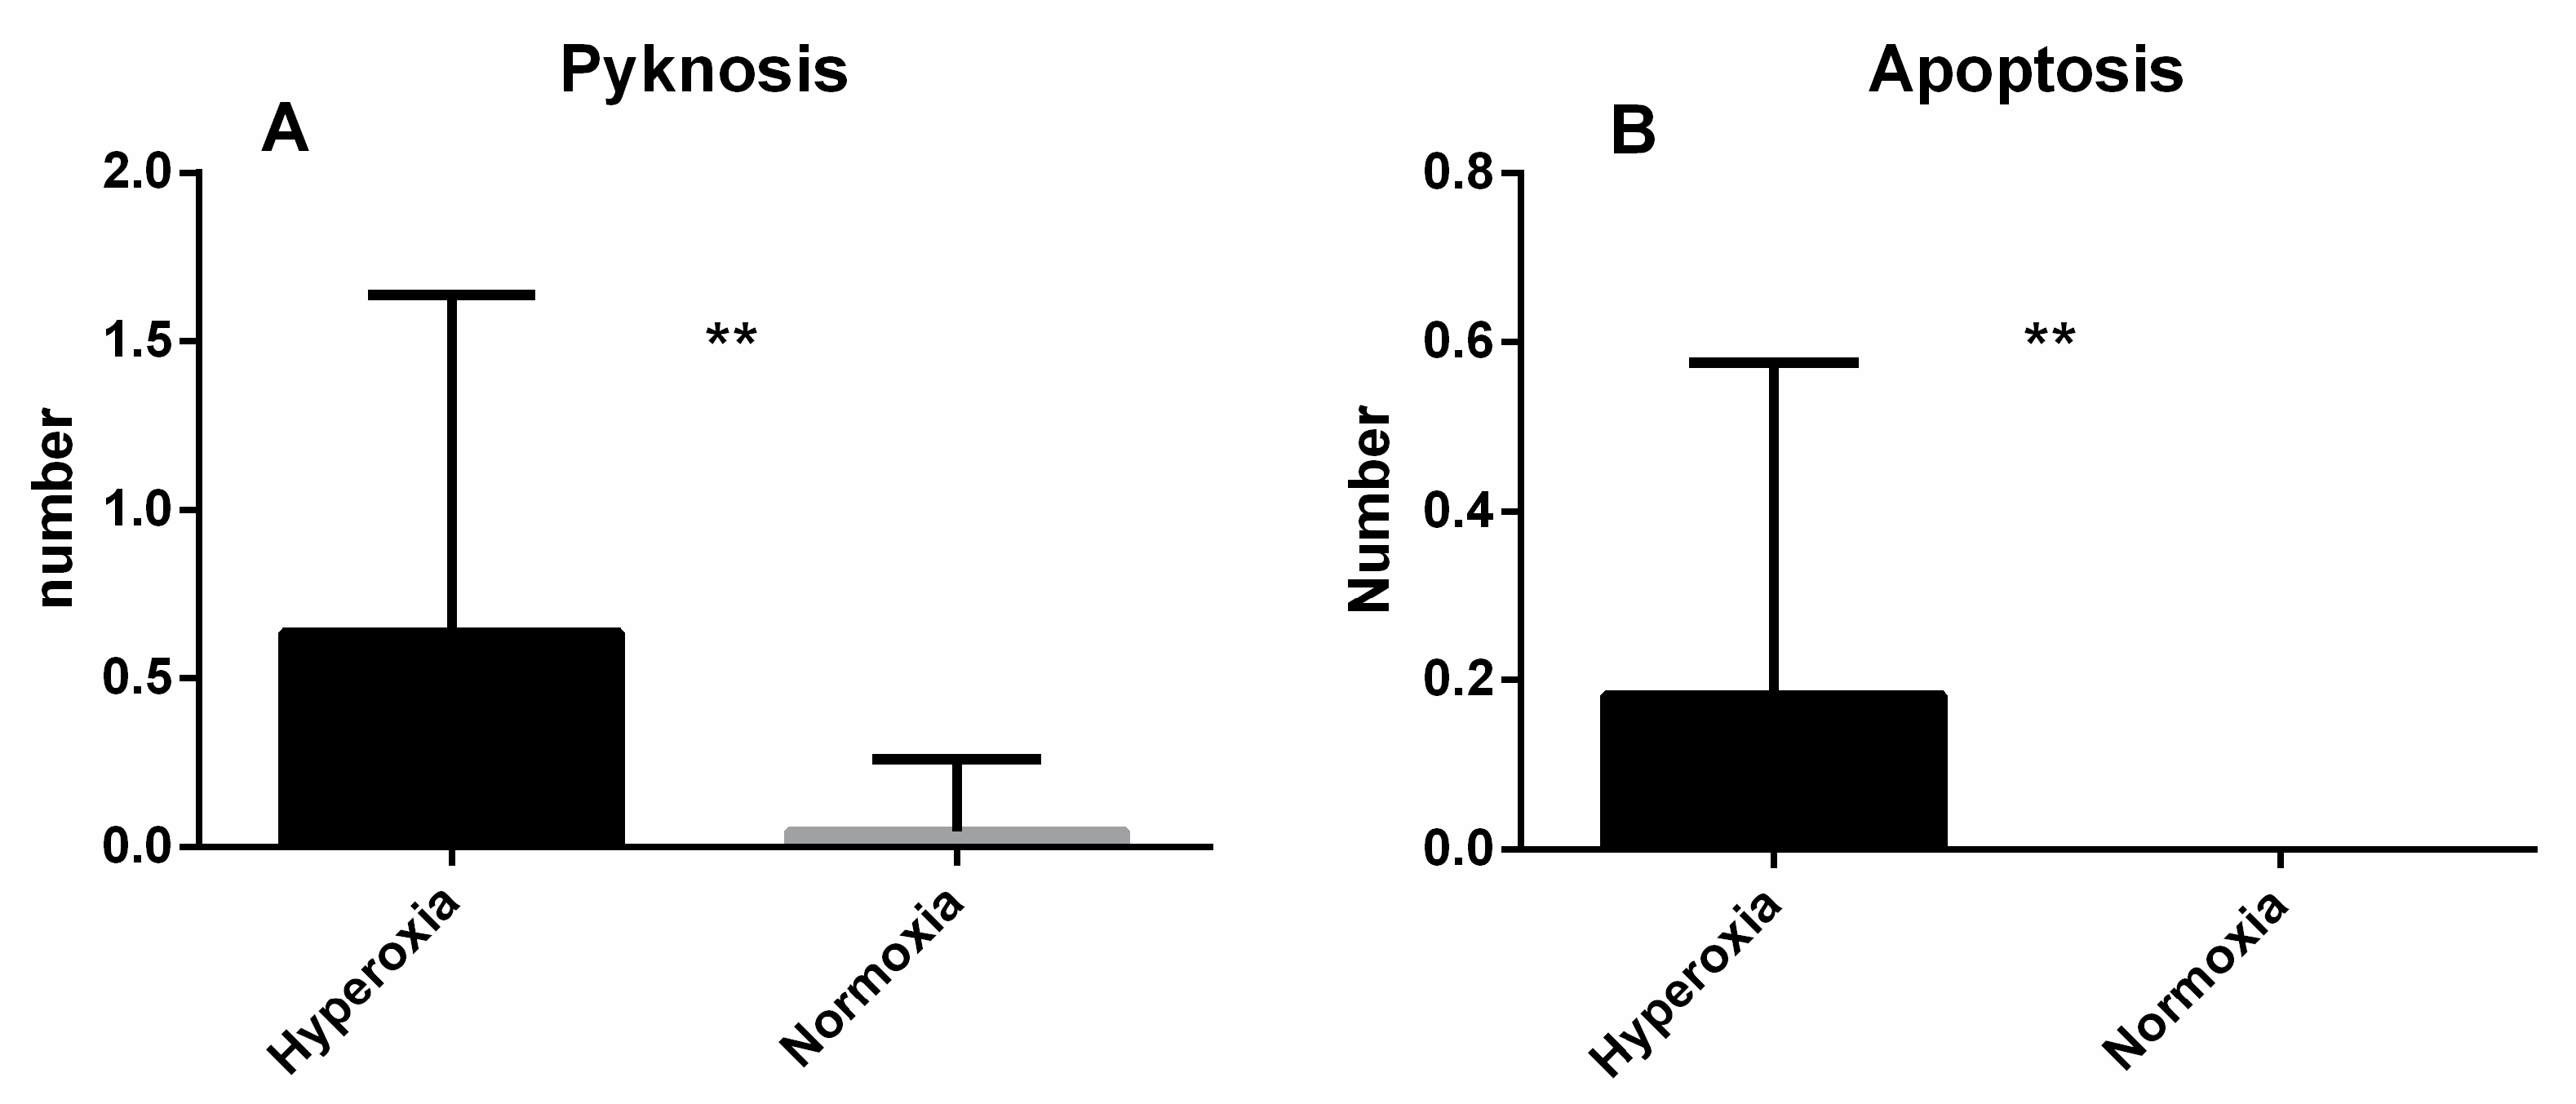
3. Results
4. Discussion
4.1. Apoptosis Hypothesis
4.2. Fractal Analysis
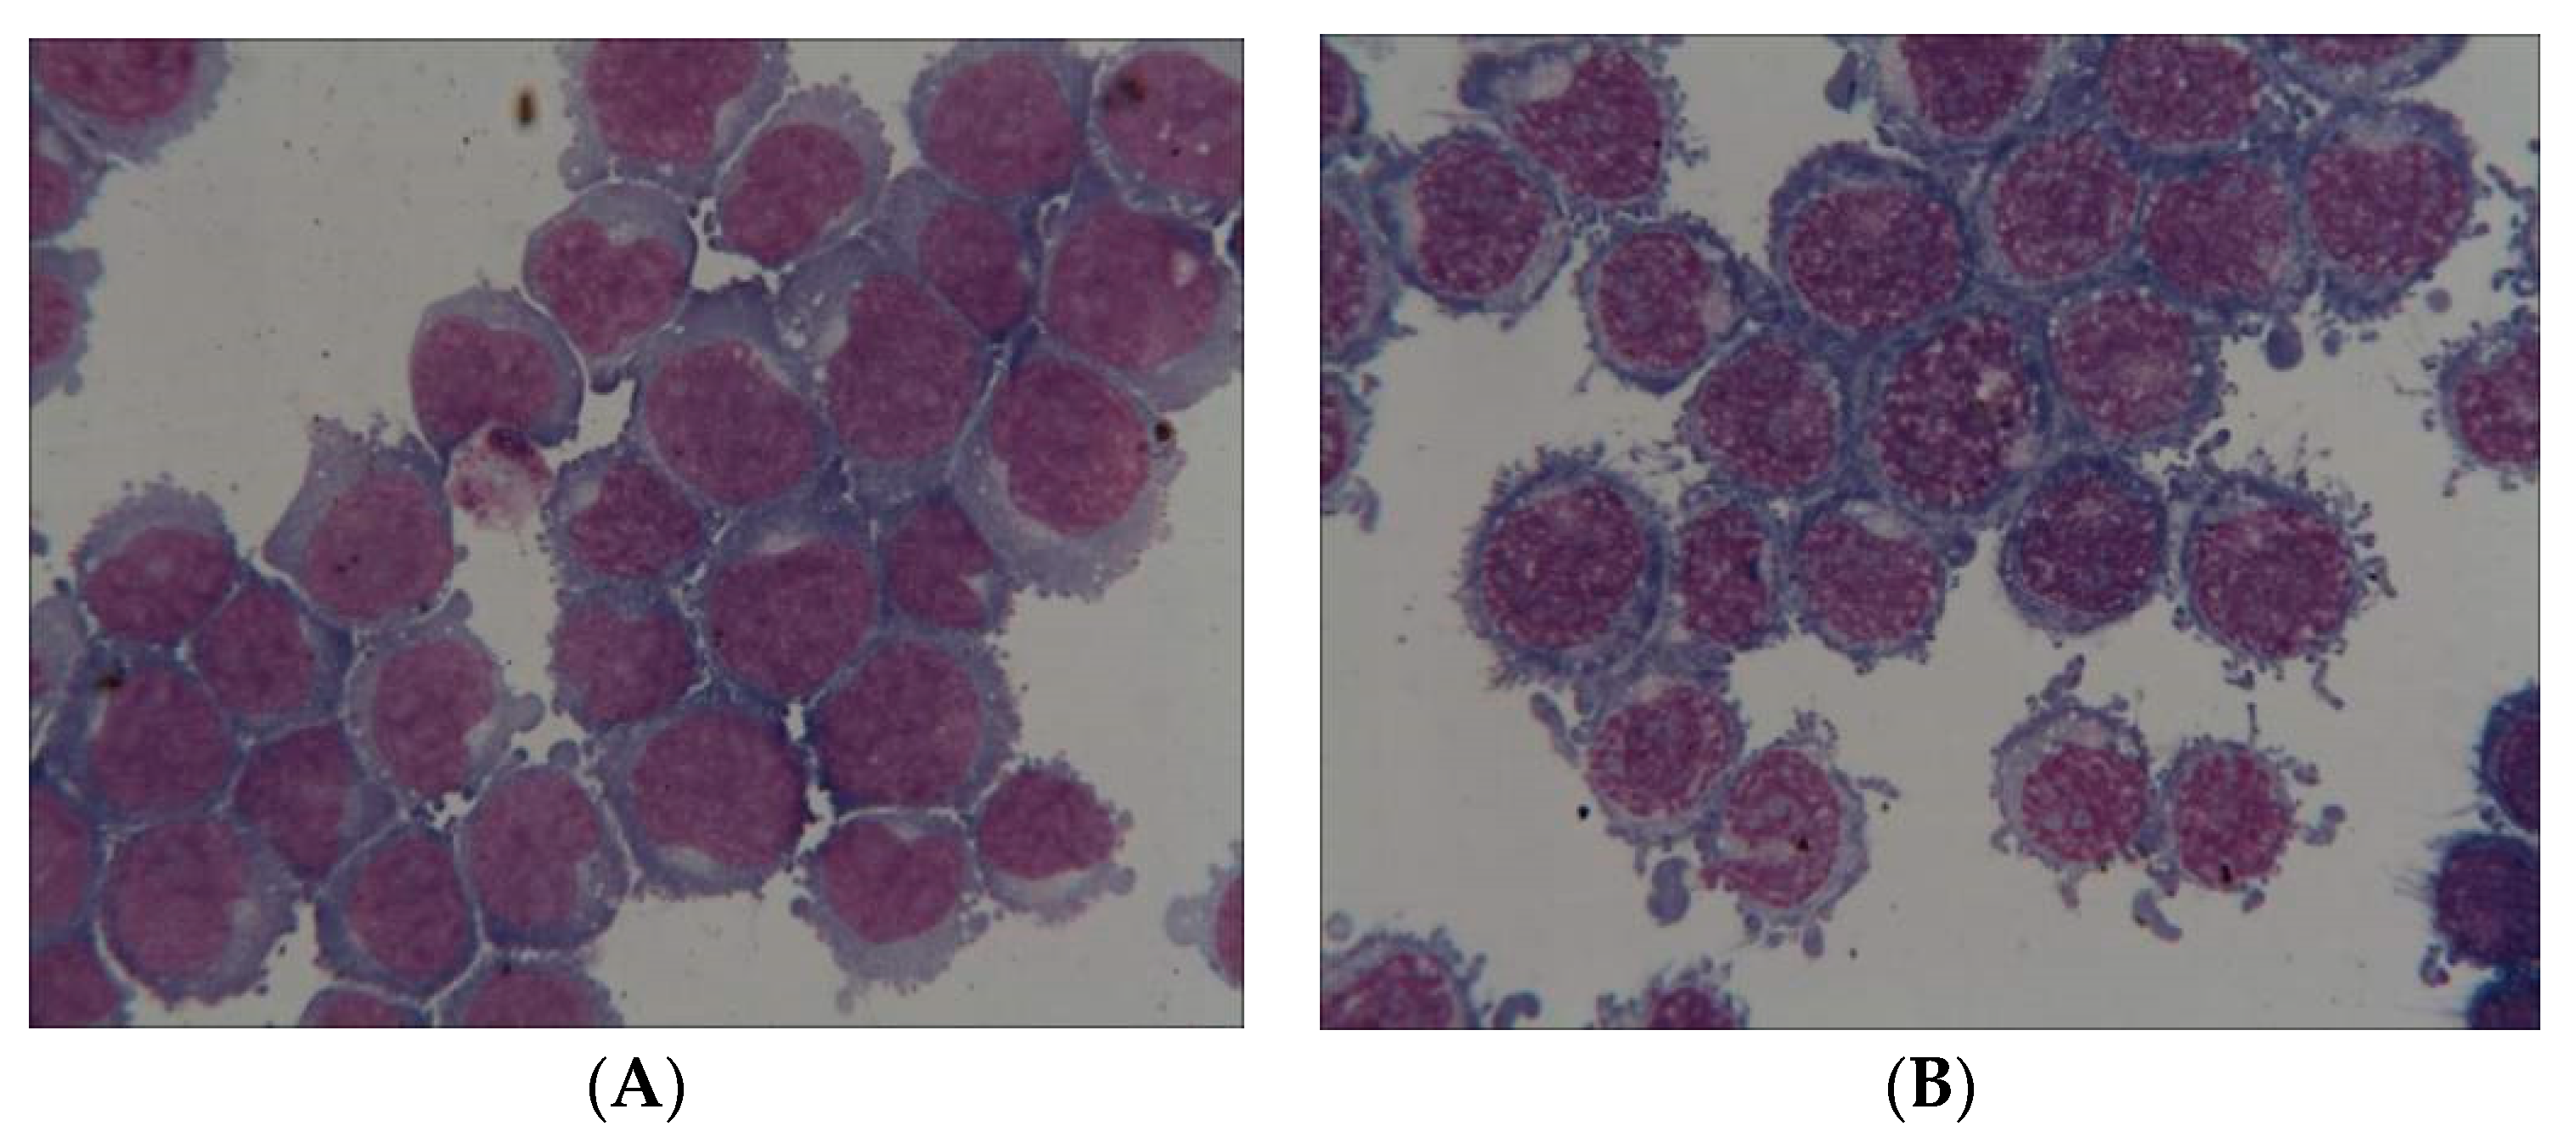
4.3. Microscopic Analysis
4.4. Caspase-3
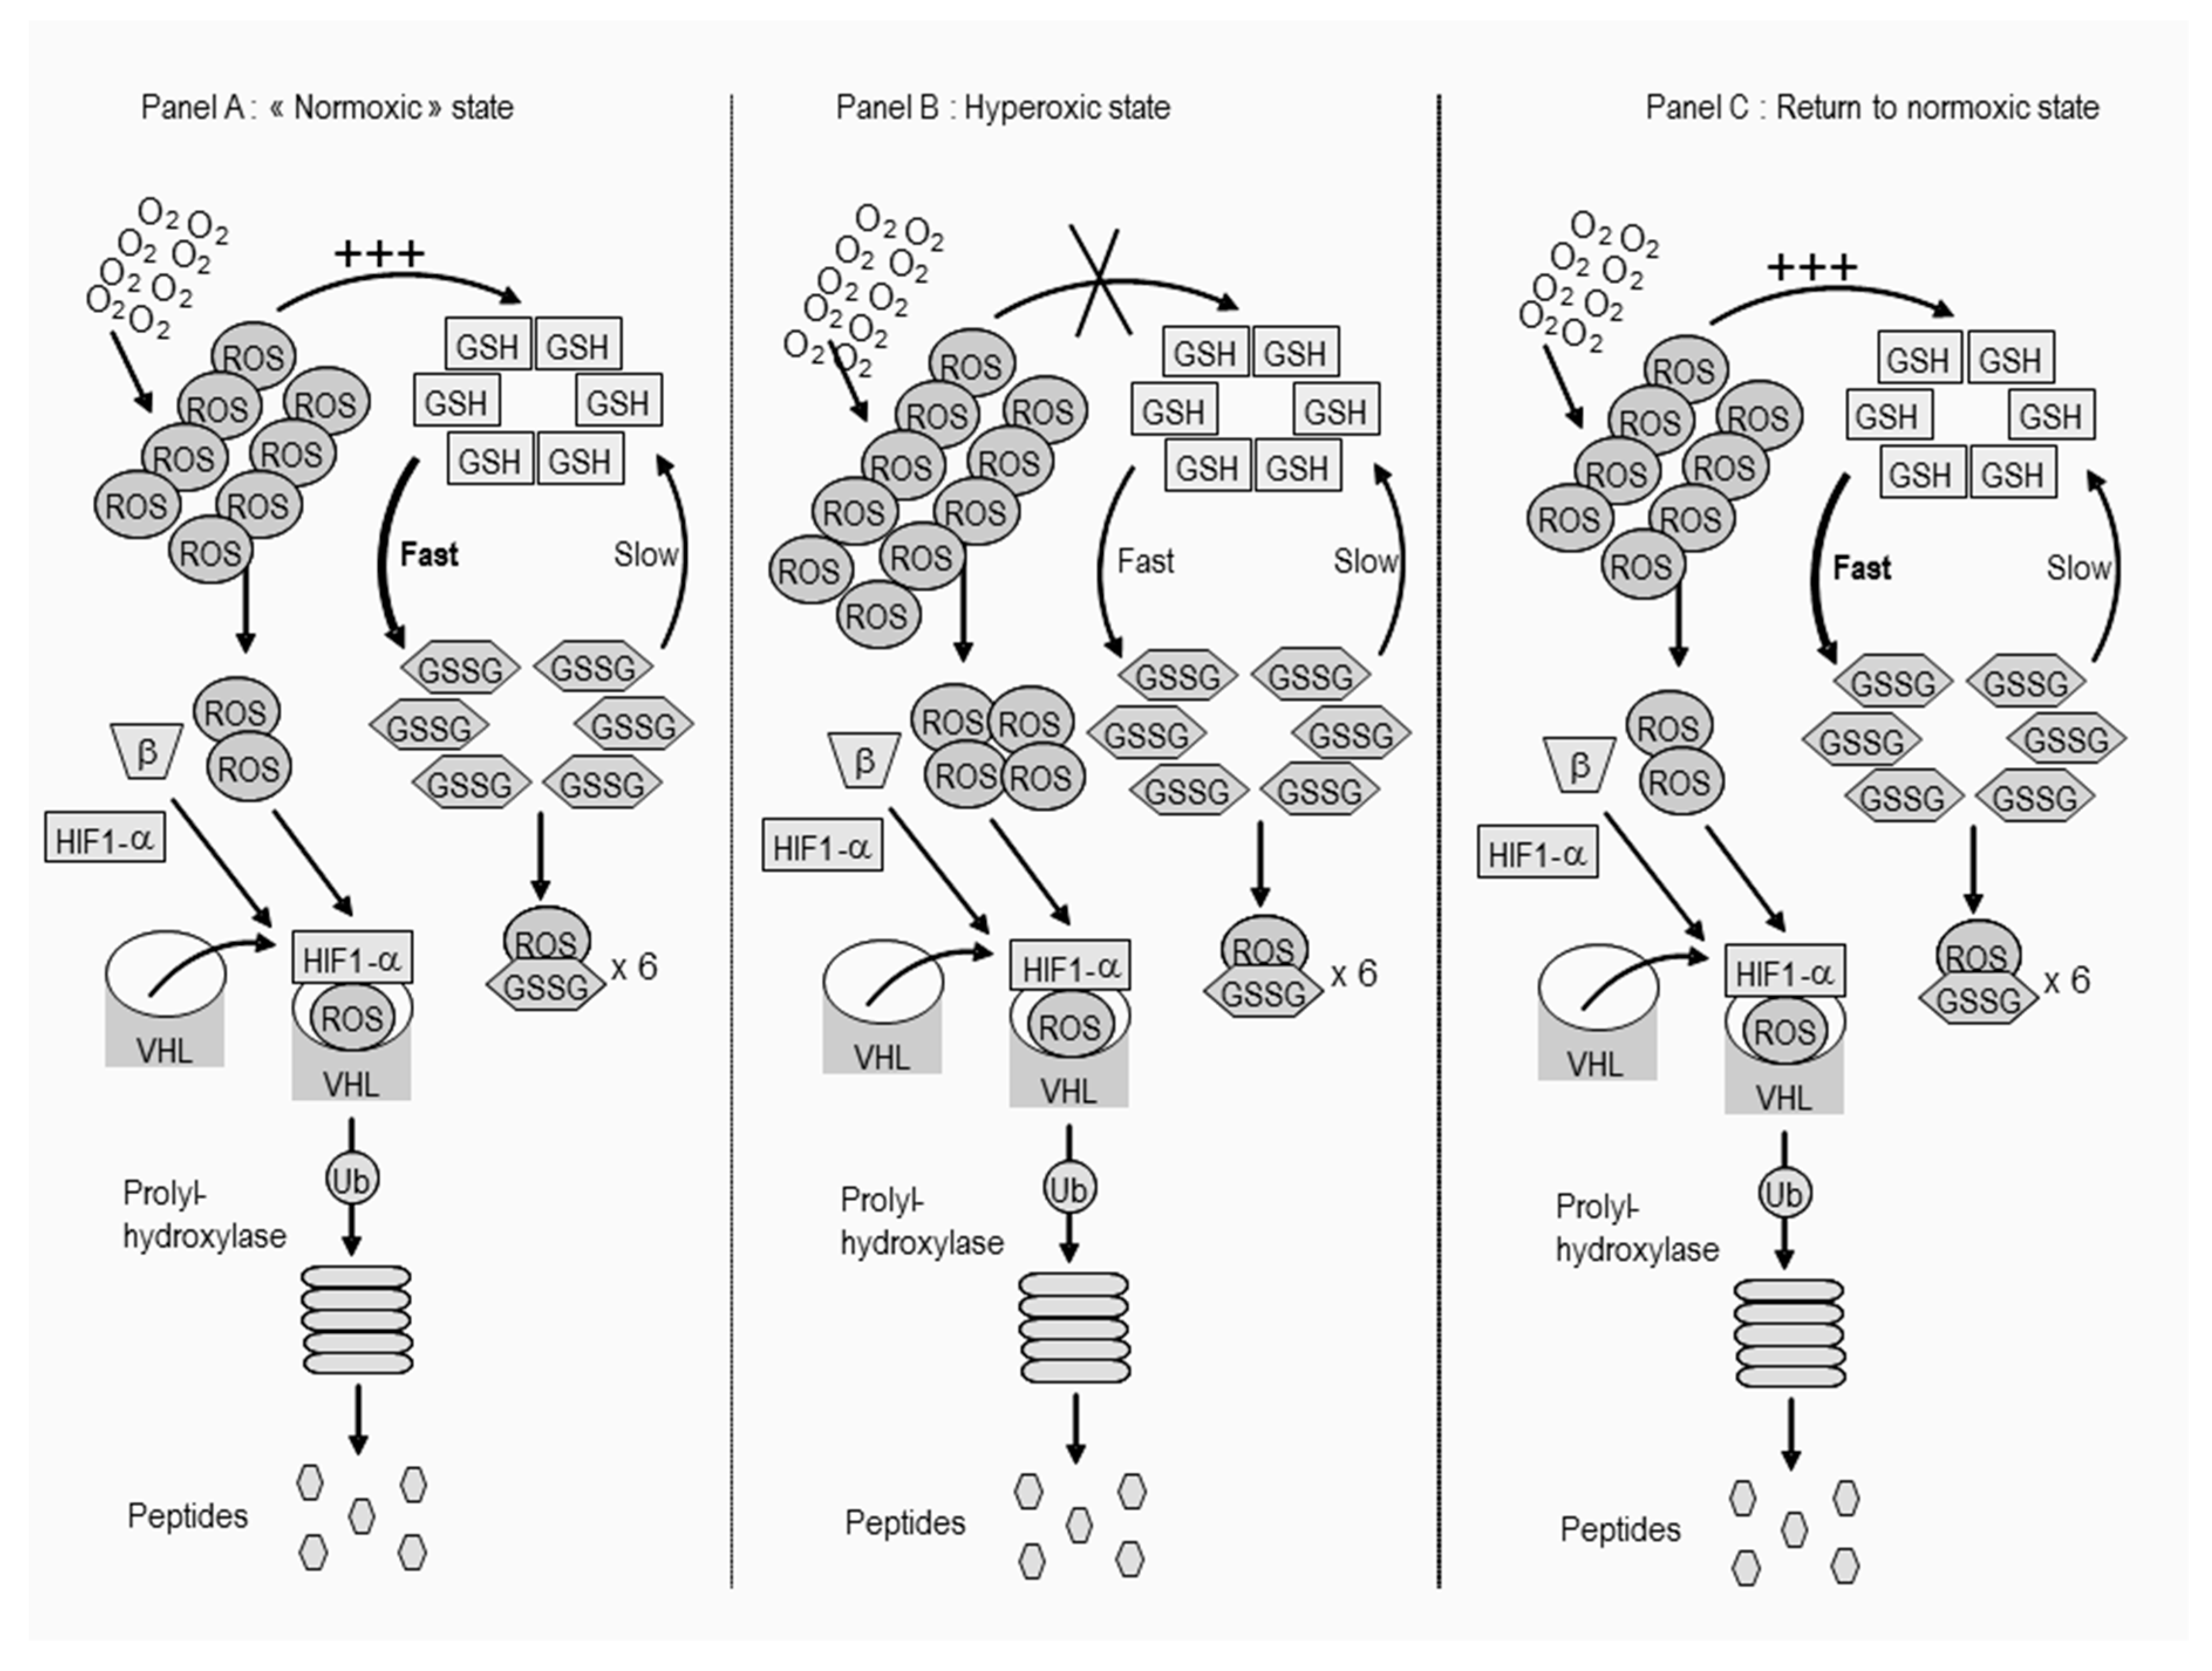
4.5. Oxygen Toxicity
5. Conclusions
Author Contributions
Funding
Acknowledgments
Conflicts of Interest
References
- D’Anselmi, F.; Valerio, M.; Cucina, A.; Galli, L.; Proietti, S.; Dinicola, S.; Pasqualato, A.; Manetti, C.; Ricci, G.; Giuliani, A.; et al. Metabolism and cell shape in cancer: A fractal analysis. Int. J. Biochem Cell Biol. 2011, 43, 1052–1058. [Google Scholar] [CrossRef] [PubMed]
- Semenza, G.L. Oxygen sensing, homeostasis, and disease. N Engl. J. Med. 2011, 365, 537–547. [Google Scholar] [CrossRef] [PubMed]
- Cannizzaro, A.; Verga Falzacappa, C.V.; Martinelli, M.; Misiti, S.; Brunetti, E.; Bucci, B. O(2/3) exposure inhibits cell progression affecting cyclin B1/cdk1 activity in SK-N-SH while induces apoptosis in SK-N-DZ neuroblastoma cells. J. Cell Physiol. 2007, 213, 115–125. [Google Scholar] [CrossRef] [PubMed]
- Raa, A.; Stansberg, C.; Steen, V.M.; Bjerkvig, R.; Reed, R.K.; Stuhr, L.E. Hyperoxia retards growth and induces apoptosis and loss of glands and blood vessels in DMBA-induced rat mammary tumors. BMC Cancer 2007, 7, 23. [Google Scholar] [CrossRef][Green Version]
- Bilodeau, J.F.; Faure, R.; Piedboeuf, B.; Mirault, M.E. Hyperoxia induces S-phase cell-cycle arrest and p21(Cip1/Waf1)-independent Cdk2 inhibition in human carcinoma T47D-H3 cells. Exp. Cell Res. 2000, 256, 347–357. [Google Scholar] [CrossRef]
- Hatfield, S.M.; Kjaergaard, J.; Lukashev, D.; Schreiber, T.H.; Belikoff, B.; Abbott, R.; Sethumadhavan, S.; Philbrook, P.; Ko, K.; Cannici, R.; et al. Immunological mechanisms of the antitumor effects of supplemental oxygenation. Sci. Transl. Med. 2015, 7, 277. [Google Scholar] [CrossRef]
- Bartek, J.; Lukas, C.; Lukas, J. Checking on DNA damage in S phase. Nat. Rev. Mol. Cell Biol. 2004, 5, 792–804. [Google Scholar] [CrossRef]
- Chavez, J.C.; Baranova, O.; Lin, J.; Pichiule, P. The transcriptional activator hypoxia inducible factor 2 (HIF-2/EPAS-1) regulates the oxygen-dependent expression of erythropoietin in cortical astrocytes. J. Neurosci. 2006, 26, 9471–9481. [Google Scholar] [CrossRef]
- Morita, M.; Ohneda, O.; Yamashita, T.; Takahashi, S.; Suzuki, N.; Nakajima, O.; Kawauchi, S.; Ema, M.; Shibahara, S.; Udono, T.; et al. HLF/HIF-2alpha is a key factor in retinopathy of prematurity in association with erythropoietin. EMBO J. 2003, 22, 1134–1146. [Google Scholar] [CrossRef]
- Percy, M.J.; Furlow, P.W.; Lucas, G.S.; Li, X.; Lappin, T.R.; McMullin, M.F.; Lee, F.S. A gain-of-function mutation in the HIF2A gene in familial erythrocytosis. N Engl. J. Med. 2008, 358, 162–168. [Google Scholar] [CrossRef]
- Rankin, E.B.; Biju, M.P.; Liu, Q.; Unger, T.L.; Rha, J.; Johnson, R.S.; Simon, M.C.; Keith, B.; Haase, V.H. Hypoxia-inducible factor-2 (HIF-2) regulates hepatic erythropoietin in vivo. J. Clin. Invest. 2007, 117, 1068–1077. [Google Scholar] [CrossRef] [PubMed]
- Warnecke, C.; Zaborowska, Z.; Kurreck, J.; Erdmann, V.A.; Frei, U.; Wiesener, M.; Eckardt, K.U. Differentiating the functional role of hypoxia-inducible factor (HIF)-1alpha and HIF-2alpha (EPAS-1) by the use of RNA interference: Erythropoietin is a HIF-2alpha target gene in Hep3B and Kelly cells. FASEB J. 2004, 18, 1462–1464. [Google Scholar] [CrossRef] [PubMed]
- Jang, G.Y.; Jeon, J.H.; Cho, S.Y.; Shin, D.M.; Kim, C.W.; Jeong, E.M.; Bae, H.C.; Kim, T.W.; Lee, S.H.; Choi, Y.; et al. Transglutaminase 2 suppresses apoptosis by modulating Caspase-3 and NF-kappaB activity in hypoxic tumor cells. Oncogene 2010, 29, 356–367. [Google Scholar] [CrossRef] [PubMed]
- Carmeliet, P.; Dor, Y.; Herbert, J.M.; Fukumura, D.; Brusselmans, K.; Dewerchin, M.; Neeman, M.; Bono, F.; Abramovitch, R.; Maxwell, P.; et al. Role of HIF-1alpha in hypoxia-mediated apoptosis, cell proliferation and tumour angiogenesis. Nature 1998, 394, 485–490. [Google Scholar] [CrossRef] [PubMed]
- Koshiji, M.; Huang, L.E. Dynamic balancing of the dual nature of HIF-1alpha for cell survival. Cell Cycle 2004, 3, 853–854. [Google Scholar] [CrossRef]
- Koshiji, M.; To, K.K.; Hammer, S.; Kumamoto, K.; Harris, A.L.; Modrich, P.; Huang, L.E. HIF-1alpha induces genetic instability by transcriptionally downregulating MutSalpha expression. Mol. Cell 2005, 17, 793–803. [Google Scholar] [CrossRef]
- Savai, R.; Schermuly, R.T.; Voswinckel, R.; Renigunta, A.; Reichmann, B.; Eul, B.; Grimminger, F.; Seeger, W.; Rose, F.; Hanze, J. HIF-1alpha attenuates tumor growth in spite of augmented vascularization in an A549 adenocarcinoma mouse model. Int. J. Oncol 2005, 27, 393–400. [Google Scholar]
- Scortegagna, M.; Martin, R.J.; Kladney, R.D.; Neumann, R.G.; Arbeit, J.M. Hypoxia-inducible factor-1alpha suppresses squamous carcinogenic progression and epithelial-mesenchymal transition. Cancer Res. 2009, 69, 2638–2646. [Google Scholar] [CrossRef]
- Sowter, H.M.; Ratcliffe, P.J.; Watson, P.; Greenberg, A.H.; Harris, A.L. HIF-1-dependent regulation of hypoxic induction of the cell death factors BNIP3 and NIX in human tumors. Cancer Res. 2001, 61, 6669–6673. [Google Scholar]
- Cimino, F.; Balestra, C.; Germonpre, P.; De Bels, D.; Tillmans, F.; Saija, A.; Speciale, A.; Virgili, F. Pulsed high oxygen induces a hypoxic-like response in Human Umbilical Endothelial Cells (HUVECs) and in humans. J. Appl. Physiol. 2012, 113, 1684–1689. [Google Scholar] [CrossRef]
- De Bels, D.; Corazza, F.; Balestra, C. Oxygen sensing, homeostasis, and disease. N Engl. J. Med. 2011, 365, 1845. [Google Scholar] [PubMed]
- Balestra, C.; Germonpre, P.; Poortmans, J.R.; Marroni, A. Serum erythropoietin levels in healthy humans after a short period of normobaric and hyperbaric oxygen breathing: The “normobaric oxygen paradox”. J. Appl. Physiol. 2006, 100, 512–518. [Google Scholar] [CrossRef] [PubMed]
- De Bels, D.; Theunissen, S.; Devriendt, J.; Germonpre, P.; Lafere, P.; Valsamis, J.; Snoeck, T.; Meeus, P.; Balestra, C. The ’normobaric oxygen paradox’: Does it increase haemoglobin? Diving Hyperb. Med. 2012, 42, 67–71. [Google Scholar] [PubMed]
- Laugsch, M.; Metzen, E.; Svensson, T.; Depping, R.; Jelkmann, W. Lack of functional erythropoietin receptors of cancer cell lines. Int. J. Cancer 2008, 122, 1005–1011. [Google Scholar] [CrossRef]
- Nangaku, M.; Inagi, R.; Miyata, T.; Fujita, T. Hypoxia and hypoxia-inducible factor in renal disease. Nephron Exp. Nephrol 2008, 110, e1–e7. [Google Scholar] [CrossRef]
- Lee, H.Y.; Kim, I.K.; Lee, H.I.; Lee, H.Y.; Kang, H.S.; Yeo, C.D.; Kang, H.H.; Moon, H.S.; Lee, S.H. Combination of carboplatin and intermittent normobaric hyperoxia synergistically suppresses benzo[a]pyrene-induced lung cancer. Korean J. Intern. Med. 2018, 33, 541–551. [Google Scholar] [CrossRef]
- De Bels, D.; Corazza, F.; Germonpre, P.; Balestra, C. The normobaric oxygen paradox: A novel way to administer oxygen as an adjuvant treatment for cancer? Med. Hypotheses 2011, 76, 467–470. [Google Scholar] [CrossRef]
- Jayaprakash, P.; Ai, M.; Liu, A.; Budhani, P.; Bartkowiak, T.; Sheng, J.; Ager, C.; Nicholas, C.; Jaiswal, A.R.; Sun, Y.; et al. Targeted hypoxia reduction restores T cell infiltration and sensitizes prostate cancer to immunotherapy. J. Clin. Invest. 2018, 128, 5137–5149. [Google Scholar] [CrossRef]
- MacLaughlin, K.J.; Barton, G.P.; Braun, R.K.; Eldridge, M.W. Effect of intermittent hyperoxia on stem cell mobilization and cytokine expression. Med. Gas. Res. 2019, 9, 139–144. [Google Scholar] [CrossRef]
- Groger, M.; Scheuerle, A.; Wagner, F.; Simon, F.; Matallo, J.; McCook, O.; Seifritz, A.; Stahl, B.; Wachter, U.; Vogt, J.A.; et al. Effects of Pretreatment Hypothermia During Resuscitated Porcine Hemorrhagic Shock. Crit. Care Med. 2013, 41, e105–e117. [Google Scholar] [CrossRef]
- Bain, B.J. Classification of acute leukaemia: The need to incorporate cytogenetic and molecular genetic information. J. Clin. Pathol. 1998, 51, 420–423. [Google Scholar] [CrossRef] [PubMed]
- Peitgen, H.-O.; Jürgens, H.; Saupe, D. Chaos and Fractals; Springer Science and Business Media LLC: Berlin/Heidelberg, Germany, 1992. [Google Scholar]
- MandelBrot, B.B. Self-affine fractals and fractal dimension. Physica Scripta 1985, 32, 257–260. [Google Scholar] [CrossRef]
- Sagan, H. Space-Filling Curves; Springer Science and Business Media LLC: Berlin/Heidelberg, Germany, 1994. [Google Scholar]
- Chalut, K.J.; Ostrander, J.H.; Giacomelli, M.G.; Wax, A. Light scattering measurements of subcellular structure provide noninvasive early detection of chemotherapy-induced apoptosis. Cancer Res. 2009, 69, 1199–1204. [Google Scholar] [CrossRef] [PubMed]
- Scatena, R.; Messana, I.; Martorana, G.E.; Gozzo, M.L.; Lippa, S.; Maccaglia, A.; Bottoni, P.; Vincenzoni, F.; Nocca, G.; Castagnola, M.; et al. Mitochondrial damage and metabolic compensatory mechanisms induced by hyperoxia in the U-937 cell line. J. Biochem. Mol. Biol. 2004, 37, 454–459. [Google Scholar] [PubMed]
- Santoro, R.; Marinelli, F.; Turchetti, G. Fractal analysis of Chromatin during apoptosis. In Biology and Medicine; Losa, G.A., Merlin, i.D., Nonnenmacher, T.F., Weibel, E.R., Eds.; Birkhauser: Basel, Switzerland, 2002; Volume III, pp. 77–84. [Google Scholar]
- Baum, M. Why Does the Weeping Willow Weep? Reconceptualizing Oncogenesis in Breast Cancer. N. Engl. J. Med. 2015, 373, 1267–1269. [Google Scholar] [CrossRef] [PubMed]
- Cross, S.S. The application of fractal geometric analysis to microscopic images. Micron 1994, 25, 101–113. [Google Scholar] [CrossRef]
- Baish, J.W.; Jain, R.K. Fractals and cancer. Cancer Res. 2000, 60, 3683–3688. [Google Scholar]
- Cross, S.S.; McDonagh, A.J.; Stephenson, T.J.; Cotton, D.W.; Underwood, J.C. Fractal and integer-dimensional geometric analysis of pigmented skin lesions. Am. J. Dermatopathol. 1995, 17, 374–378. [Google Scholar] [CrossRef]
- Carbonetto, S.H.; Lew, S.E. Characterization of border structure using fractal dimension in melanomas. Conf. Proc. IEEE Eng. Med. Biol. Soc. 2010, 2010, 4088–4091. [Google Scholar]
- Claridge, E.; Hall, P.N.; Keefe, M.; Allen, J.P. Shape analysis for classification of malignant melanoma. J. Biomed. Eng. 1992, 14, 229–234. [Google Scholar] [CrossRef]
- Adam, R.L.; Silva, R.C.; Pereira, F.G.; Leite, N.J.; Lorand-Metze, I.; Metze, K. The fractal dimension of nuclear chromatin as a prognostic factor in acute precursor B lymphoblastic leukemia. Cell Oncol. 2006, 28, 55–59. [Google Scholar] [PubMed]
- Ferreira, R.C.; de Matos, P.S.; Adam, R.L.; Leite, N.J.; Metze, K. Application of the Minkowski-Bouligand fractal dimension for the differential diagnosis of thyroid follicular neoplasias. Cell Oncol. 2006, 28, 331–333. [Google Scholar]
- Nielsen, B.; Danielsen, H.E. Prognostic value of adaptive textural features--the effect of standardizing nuclear first-order gray level statistics and mixing information from nuclei having different area. Cell Oncol. 2006, 28, 85–95. [Google Scholar] [PubMed]
- Pasqualato, A.; Palombo, A.; Cucina, A.; Mariggio, M.A.; Galli, L.; Passaro, D.; Dinicola, S.; Proietti, S.; D’Anselmi, F.; Coluccia, P.; et al. Quantitative shape analysis of chemoresistant colon cancer cells: Correlation between morphotype and phenotype. Exp. Cell Res. 2012, 318, 835–846. [Google Scholar] [CrossRef] [PubMed]
- Giorgio, B. Differential Diagnosis: Shape and Function, Fractal Tools in the Pathology Lab. Nonlinear Dyn. Psychol. Life Sci. 2015, 19, 437–464. [Google Scholar]
- Ainsworth, C. Cells go fractal. Available online: https://www.scientificamerican.com/article/cells-go-fractal/ (accessed on 12 February 2020).
- Allen, R.T.; Hunter, W.J., 3rd; Agrawal, D.K. Morphological and biochemical characterization and analysis of apoptosis. J. Pharmacol Toxicol Methods 1997, 37, 215–228. [Google Scholar] [CrossRef]
- Elmore, S. Apoptosis: A review of programmed cell death. Toxicol. Pathol. 2007, 35, 495–516. [Google Scholar] [CrossRef]
- Eidet, J.R.; Pasovic, L.; Maria, R.; Jackson, C.J.; Utheim, T.P. Objective assessment of changes in nuclear morphology and cell distribution following induction of apoptosis. Diagn. Pathol. 2014, 9, 92. [Google Scholar] [CrossRef]
- Hale, L.P.; Braun, R.D.; Gwinn, W.M.; Greer, P.K.; Dewhirst, M.W. Hypoxia in the thymus: Role of oxygen tension in thymocyte survival. Am. J. Physiol. Heart Circ. Physiol. 2002, 282, 1467–1477. [Google Scholar] [CrossRef]
- Ari, C.; Koutnik, A.P.; DeBlasi, J.; Landon, C.; Rogers, C.Q.; Vallas, J.; Bharwani, S.; Puchowicz, M.; Bederman, I.; Diamond, D.M.; et al. Delaying latency to hyperbaric oxygen-induced CNS oxygen toxicity seizures by combinations of exogenous ketone supplements. Physiol. Rep. 2019, 7, e13961. [Google Scholar] [CrossRef]
- Arieli, R. Calculated risk of pulmonary and central nervous system oxygen toxicity: A toxicity index derived from the power equation. Diving Hyperb. Med. 2019, 49, 154–160. [Google Scholar] [CrossRef] [PubMed]
- Arieli, R. Pulmonary oxygen toxicity in saturation dives with PO2 close to the lower end of the toxic range - A quantitative approach. Respir. Physiol. Neurobiol. 2019, 268, 103243. [Google Scholar] [CrossRef] [PubMed]
- Wingelaar, T.T.; van Ooij, P.A.M.; Brinkman, P.; van Hulst, R.A. Pulmonary Oxygen Toxicity in Navy Divers: A Crossover Study Using Exhaled Breath Analysis After a One-Hour Air or Oxygen Dive at Nine Meters of Sea Water. Front. Physiol. 2019, 10, 10. [Google Scholar] [CrossRef] [PubMed]
- Kiboub, F.Z.; Balestra, C.; Loennechen, O.; Eftedal, I. Hemoglobin and Erythropoietin After Commercial Saturation Diving. Front. Physiol. 2018, 9, 1176. [Google Scholar] [CrossRef] [PubMed]
- Kiboub, F.Z.; Mollerlokken, A.; Hjelde, A.; Flatberg, A.; Loennechen, O.; Eftedal, I. Blood Gene Expression and Vascular Function Biomarkers in Professional Saturation Diving. Front. Physiol. 2018, 9, 937. [Google Scholar] [CrossRef] [PubMed]
- Stuhr, L.E.; Raa, A.; Oyan, A.M.; Kalland, K.H.; Sakariassen, P.O.; Petersen, K.; Bjerkvig, R.; Reed, R.K. Hyperoxia retards growth and induces apoptosis, changes in vascular density and gene expression in transplanted gliomas in nude rats. J. Neurooncol. 2007, 85, 191–202. [Google Scholar] [CrossRef] [PubMed]
- Calzia, E.; Asfar, P.; Hauser, B.; Matejovic, M.; Ballestra, C.; Radermacher, P.; Georgieff, M. Hyperoxia may be beneficial. Crit. Care Med. 2010, 38, 559–568. [Google Scholar] [CrossRef]
- Demiselle, J.; Wepler, M.; Hartmann, C.; Radermacher, P.; Schortgen, F.; Meziani, F.; Singer, M.; Seegers, V.; Asfar, P.; investigators, H.S. Hyperoxia toxicity in septic shock patients according to the Sepsis-3 criteria: A post hoc analysis of the HYPER2S trial. Ann. Intensive Care 2018, 8, 90. [Google Scholar] [CrossRef]
- Katerji, M.; Filippova, M.; Duerksen-Hughes, P. Approaches and Methods to Measure Oxidative Stress in Clinical Samples: Research Applications in the Cancer Field. Oxid. Med. Cell Longev. 2019, 2019, 1279250. [Google Scholar] [CrossRef]
© 2020 by the authors. Licensee MDPI, Basel, Switzerland. This article is an open access article distributed under the terms and conditions of the Creative Commons Attribution (CC BY) license (http://creativecommons.org/licenses/by/4.0/).
Share and Cite
De Bels, D.; Tillmans, F.; Corazza, F.; Bizzarri, M.; Germonpre, P.; Radermacher, P.; Orman, K.G.; Balestra, C. Hyperoxia Alters Ultrastructure and Induces Apoptosis in Leukemia Cell Lines. Biomolecules 2020, 10, 282. https://doi.org/10.3390/biom10020282
De Bels D, Tillmans F, Corazza F, Bizzarri M, Germonpre P, Radermacher P, Orman KG, Balestra C. Hyperoxia Alters Ultrastructure and Induces Apoptosis in Leukemia Cell Lines. Biomolecules. 2020; 10(2):282. https://doi.org/10.3390/biom10020282
Chicago/Turabian StyleDe Bels, David, Frauke Tillmans, Francis Corazza, Mariano Bizzarri, Peter Germonpre, Peter Radermacher, Keziban Günce Orman, and Costantino Balestra. 2020. "Hyperoxia Alters Ultrastructure and Induces Apoptosis in Leukemia Cell Lines" Biomolecules 10, no. 2: 282. https://doi.org/10.3390/biom10020282
APA StyleDe Bels, D., Tillmans, F., Corazza, F., Bizzarri, M., Germonpre, P., Radermacher, P., Orman, K. G., & Balestra, C. (2020). Hyperoxia Alters Ultrastructure and Induces Apoptosis in Leukemia Cell Lines. Biomolecules, 10(2), 282. https://doi.org/10.3390/biom10020282


