Article

Metabolic Effects of Selective Deletion of Group VIA Phospholipase A2 from Macrophages or Pancreatic Islet Beta-Cells

1
Mass Spectrometry Facility, Division of Endocrinology, Metabolism, and Lipid Research, Department of Medicine, Department of Pathology and Immunology, Washington University School of Medicine, St. Louis, MO 63110, USA
2
Sigma-Aldrich Corporation, St. Louis, MO 63118, USA
3
Department of Cell, Developmental, and Integrative Biology, Comprehensive Diabetes Center, University of Alabama at Birmingham, Birmingham, AL 35294, USA
*
Authors to whom correspondence should be addressed.
All three of these authors contributed equally to this manuscript and are co-primary authors.
Biomolecules 2020, 10(10), 1455; https://doi.org/10.3390/biom10101455
Submission received: 30 August 2020 / Revised: 8 October 2020 / Accepted: 13 October 2020 / Published: 17 October 2020
(This article belongs to the Special Issue Phospholipases: From Structure to Biological Function)

Abstract

:
To examine the role of group VIA phospholipase A2 (iPLA2β) in specific cell lineages in insulin secretion and insulin action, we prepared mice with a selective iPLA2β deficiency in cells of myelomonocytic lineage, including macrophages (MØ-iPLA2β-KO), or in insulin-secreting β-cells (β-Cell-iPLA2β-KO), respectively. MØ-iPLA2β-KO mice exhibited normal glucose tolerance when fed standard chow and better glucose tolerance than floxed-iPLA2β control mice after consuming a high-fat diet (HFD). MØ-iPLA2β-KO mice exhibited normal glucose-stimulated insulin secretion (GSIS) in vivo and from isolated islets ex vivo compared to controls. Male MØ-iPLA2β-KO mice exhibited enhanced insulin responsivity vs. controls after a prolonged HFD. In contrast, β-cell-iPLA2β-KO mice exhibited impaired glucose tolerance when fed standard chow, and glucose tolerance deteriorated further when introduced to a HFD. β-Cell-iPLA2β-KO mice exhibited impaired GSIS in vivo and from isolated islets ex vivo vs. controls. β-Cell-iPLA2β-KO mice also exhibited an enhanced insulin responsivity compared to controls. These findings suggest that MØ iPLA2β participates in HFD-induced deterioration in glucose tolerance and that this mainly reflects an effect on insulin responsivity rather than on insulin secretion. In contrast, β-cell iPLA2β plays a role in GSIS and also appears to confer some protection against deterioration in β-cell functions induced by a HFD.

Graphical Abstract

1. Introduction

Glycerophospholipids are the most abundant molecular components of biological membrane bilayers and are both critical determinants of membrane structure and the source of signaling molecules produced from their hydrolysis by phospholipase enzymes. Glycerophospholipids consist of a glycerol backbone with a phosphate ester in the sn-3 position that may form a phosphodiester linkage to a polar head-group, such as choline, ethanolamine, serine, inositol, or glycerol, inter alia. A fatty acid is esterified to the glycerol backbone in the sn-2 position of phospholipids, and in the sn-1 position there is an ester, ether, or vinyl ether linkage to a fatty acid, fatty alcohol, or fatty aldehyde residue, respectively. Phospholipase A2 (PLA2) enzymes hydrolyze the phospholipid sn-2 ester bond to yield a free fatty acid and a 2-lysophospholipid as products [1,2]. The PLA2 superfamily consists of at least 16 groups of structurally and functionally diverse enzymes that include secreted (sPLA2), cytosolic (cPLA2), calcium-independent (iPLA2), lipoprotein-associated (Lp-PLA2), and adipose-PLA2 (AdPLA). These enzymes play central roles in cellular lipid metabolism and signaling [1].
The enzyme that is now designated as Group VIA PLA2 was the first recognized mammalian member of the Ca2+-independent PLA2 enzymes [3,4,5], and its abbreviated designation is iPLA2β [6,7]. Akin to the plant lipase patatin, iPLA2β contains a GXSXG lipase consensus sequence in the enzyme catalytic center, in which the central Ser is a component of a Ser-Asp catalytic dyad [8]. Enzymes with patatin-like phospholipase domains comprise the PNPLA family, and the human genome expresses nine members of this family, of which iPLA2β is PNPLA9 [9,10]. The phenotypic properties of experimental mouse models with induced mutations in the genes that encode PNPLA family members and the clinical phenotypes of patients with corresponding mutations indicate that several of these lipases play important metabolic roles in mammalian lipid and energy homeostasis [9,10].
Global iPLA2β-null mice produced by homologous recombination exhibit several phenotypic abnormalities, including greatly impaired male fertility [11] and the development of a neurodegenerative condition [12] that is similar to the human genetic disease Infantile Neuroaxonal Dystrophy (INAD), which arises from mutations in the Group VIA PLA2 gene [13,14]. Consistent with previous evidence that iPLA2β participates in signaling events leading to glucose-stimulated insulin secretion (GSIS) from pancreatic islet β-cells [15,16,17,18,19,20,21,22], islets isolated from male [23] or female [24] iPLA2β-null mice exhibit impaired GSIS ex vivo, and male iPLA2β-null mice exhibit impaired glucose tolerance in vivo [23]. In contrast, female iPLA2β-null mice exhibit normal glucose tolerance in the unstressed state [24] but develop a more severe glucose intolerance than wild-type littermates after exposure to the β-cell toxin streptozotocin or after the introduction of a high-fat diet (HFD) [24]. Surprisingly, female iPLA2β-null mice experienced less deterioration in insulin sensitivity than did wild-type littermates after being introduced to a HFD, although pancreatic islets isolated from HFD-fed female iPLA2β-null mice exhibited a much more severe impairment of GSIS than did islets isolated from HFD-fed wild-type littermates [24].
This discordance of the effects of a HFD on insulin secretion and insulin sensitivity in global iPLA2β-null mice suggests that iPLA2β plays distinct roles in the molecular mechanisms underlying insulin secretion and insulin action and in the impact of a HFD on these processes. Evidence indicates that iPLA2β amplifies glucose-induced Ca2+ entry into β-cells [23], suggesting that this is one component of the mechanism(s) through which iPLA2β participates in signaling events underlying GSIS, and iPLA2β also participates in the repair of β-cell mitochondrial membranes that are oxidized upon exposure to high concentrations of palmitic acid [25]. This might represent a mechanism whereby iPLA2β mitigates β-cell injury in HFD-fed mice and accounts for the fact that loss of iPLA2β results in a greater impairment of insulin secretion in HFD-fed iPLA2β-null mice compared to HFD-fed wild-type littermates [24].
Macrophages and their precursor monocytes also express iPLA2β [26,27,28,29], and its expression level affects the macrophage phenotype [30]. Migration of monocytes into extravascular sites, including adipose tissue, and their differentiation into macrophages that elaborate cytokines, including TNFα and IL-6, which impair insulin sensitivity, are thought to represent a critical series of events in the development of diet-induced insulin resistance in diabetes and obesity and to involve tissue elaboration of the cytokine Monocyte Chemoattractant-1 (MCP-1) and its interaction with the monocyte MCP-1 receptor CCR2 [31,32,33,34,35,36]. Genetic and pharmacologic evidence indicates that the monocyte chemotactic response to MCP-1 requires the action of iPLA2β [37,38,39] to generate the lipid mediator 2-lysophosphatidic acid (LPA) [29,37,39]. These observations suggest the possibility that the relative insensitivity of iPLA2β-null mice to high-fat diet (HFD)-induced insulin resistance might reflect the failure of iPLA2β-null monocytes to migrate into adipose tissue and other extravascular sites in response to HFD-induced tissue elaboration of MCP-1.
A plausible hypothesis is thus that the net metabolic effects of global deletion of iPLA2β might reflect opposing effects on β-cells and monocyte-macrophages. A loss of iPLA2β in β-cells would result in impaired insulin secretion and increased sensitivity to lipid-induced injury, but loss of iPLA2β in macrophages might provide relative protection against the HFD-induced deterioration of insulin sensitivity because of an impaired migration of monocytes into extravascular tissues, differentiation into macrophages, and elaboration of cytokines that result in insulin resistance. To test this hypothesis, we generated mice with floxed-iPLA2β alleles and mated them with mice that express Cre recombinase under control of LysM or RIP2 promoters to produce mice with selective iPLA2β deficiency in macrophages (MØ-iPLA2β-KO) or insulin-secreting β-cells (β-cell-iPLA2β-KO), respectively. The metabolic phenotypes of these mice were then characterized and are described in this report.

2. Materials and Methods

2.1. Materials

Enhanced chemiluminescence reagents were obtained from Amersham Biosciences (Piscataway, NJ, USA); SDS-PAGE supplies from Bio-Rad (Richmond, CA, USA); ATP, common reagents, and salts from Sigma (St. Louis, MO, USA); culture media, penicillin, streptomycin, Hanks’ balanced salt solution, L-glutamine, agarose, and RT-PCR reagents from Invitrogen (Carlsbad, CA, USA); fetal bovine serum from Hyclone (Logan, UT); Pentex bovine serum albumin (BSA, fatty acid-free, fraction V) from ICN Biomedical (Aurora, OH, USA); forskolin from Calbiochem (La Jolla, CA, USA). Krebs–Ringer bicarbonate (KRB) buffer contained (in mM) 25 HEPES (pH 7.4), 115 NaCl, 24 NaHCO3, 5 KCl, 1 MgCl2, and 2.5 CaCl2.

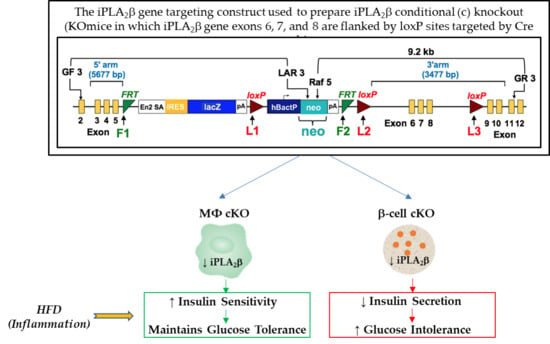
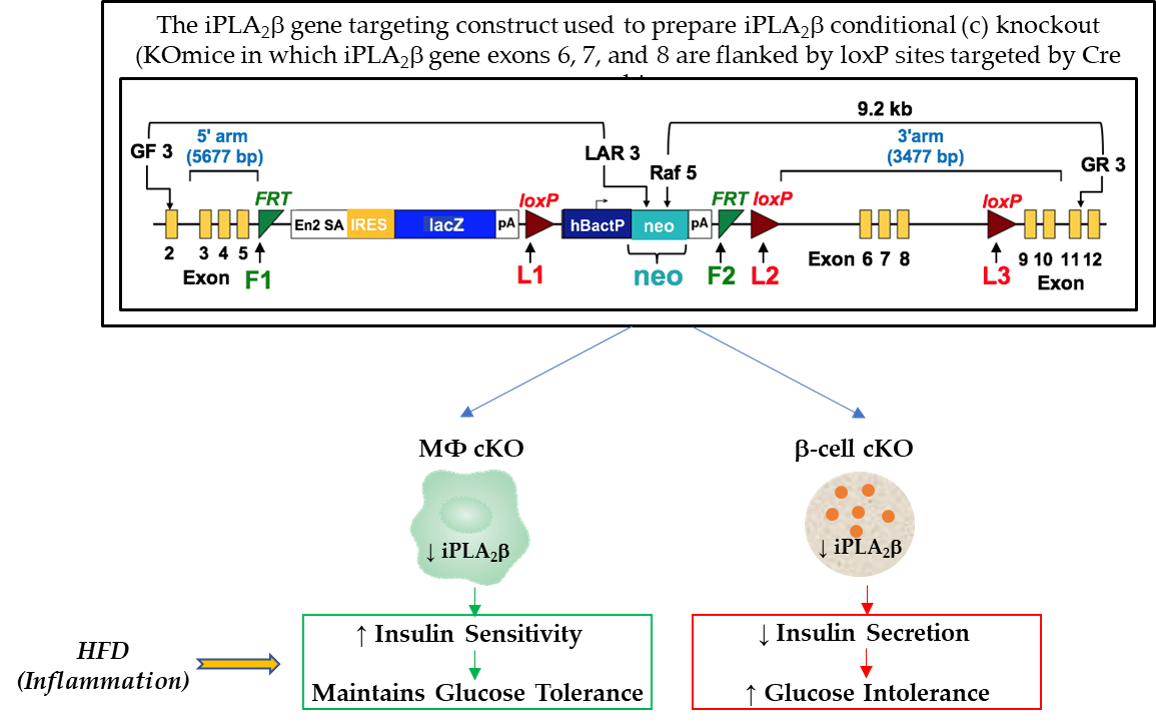
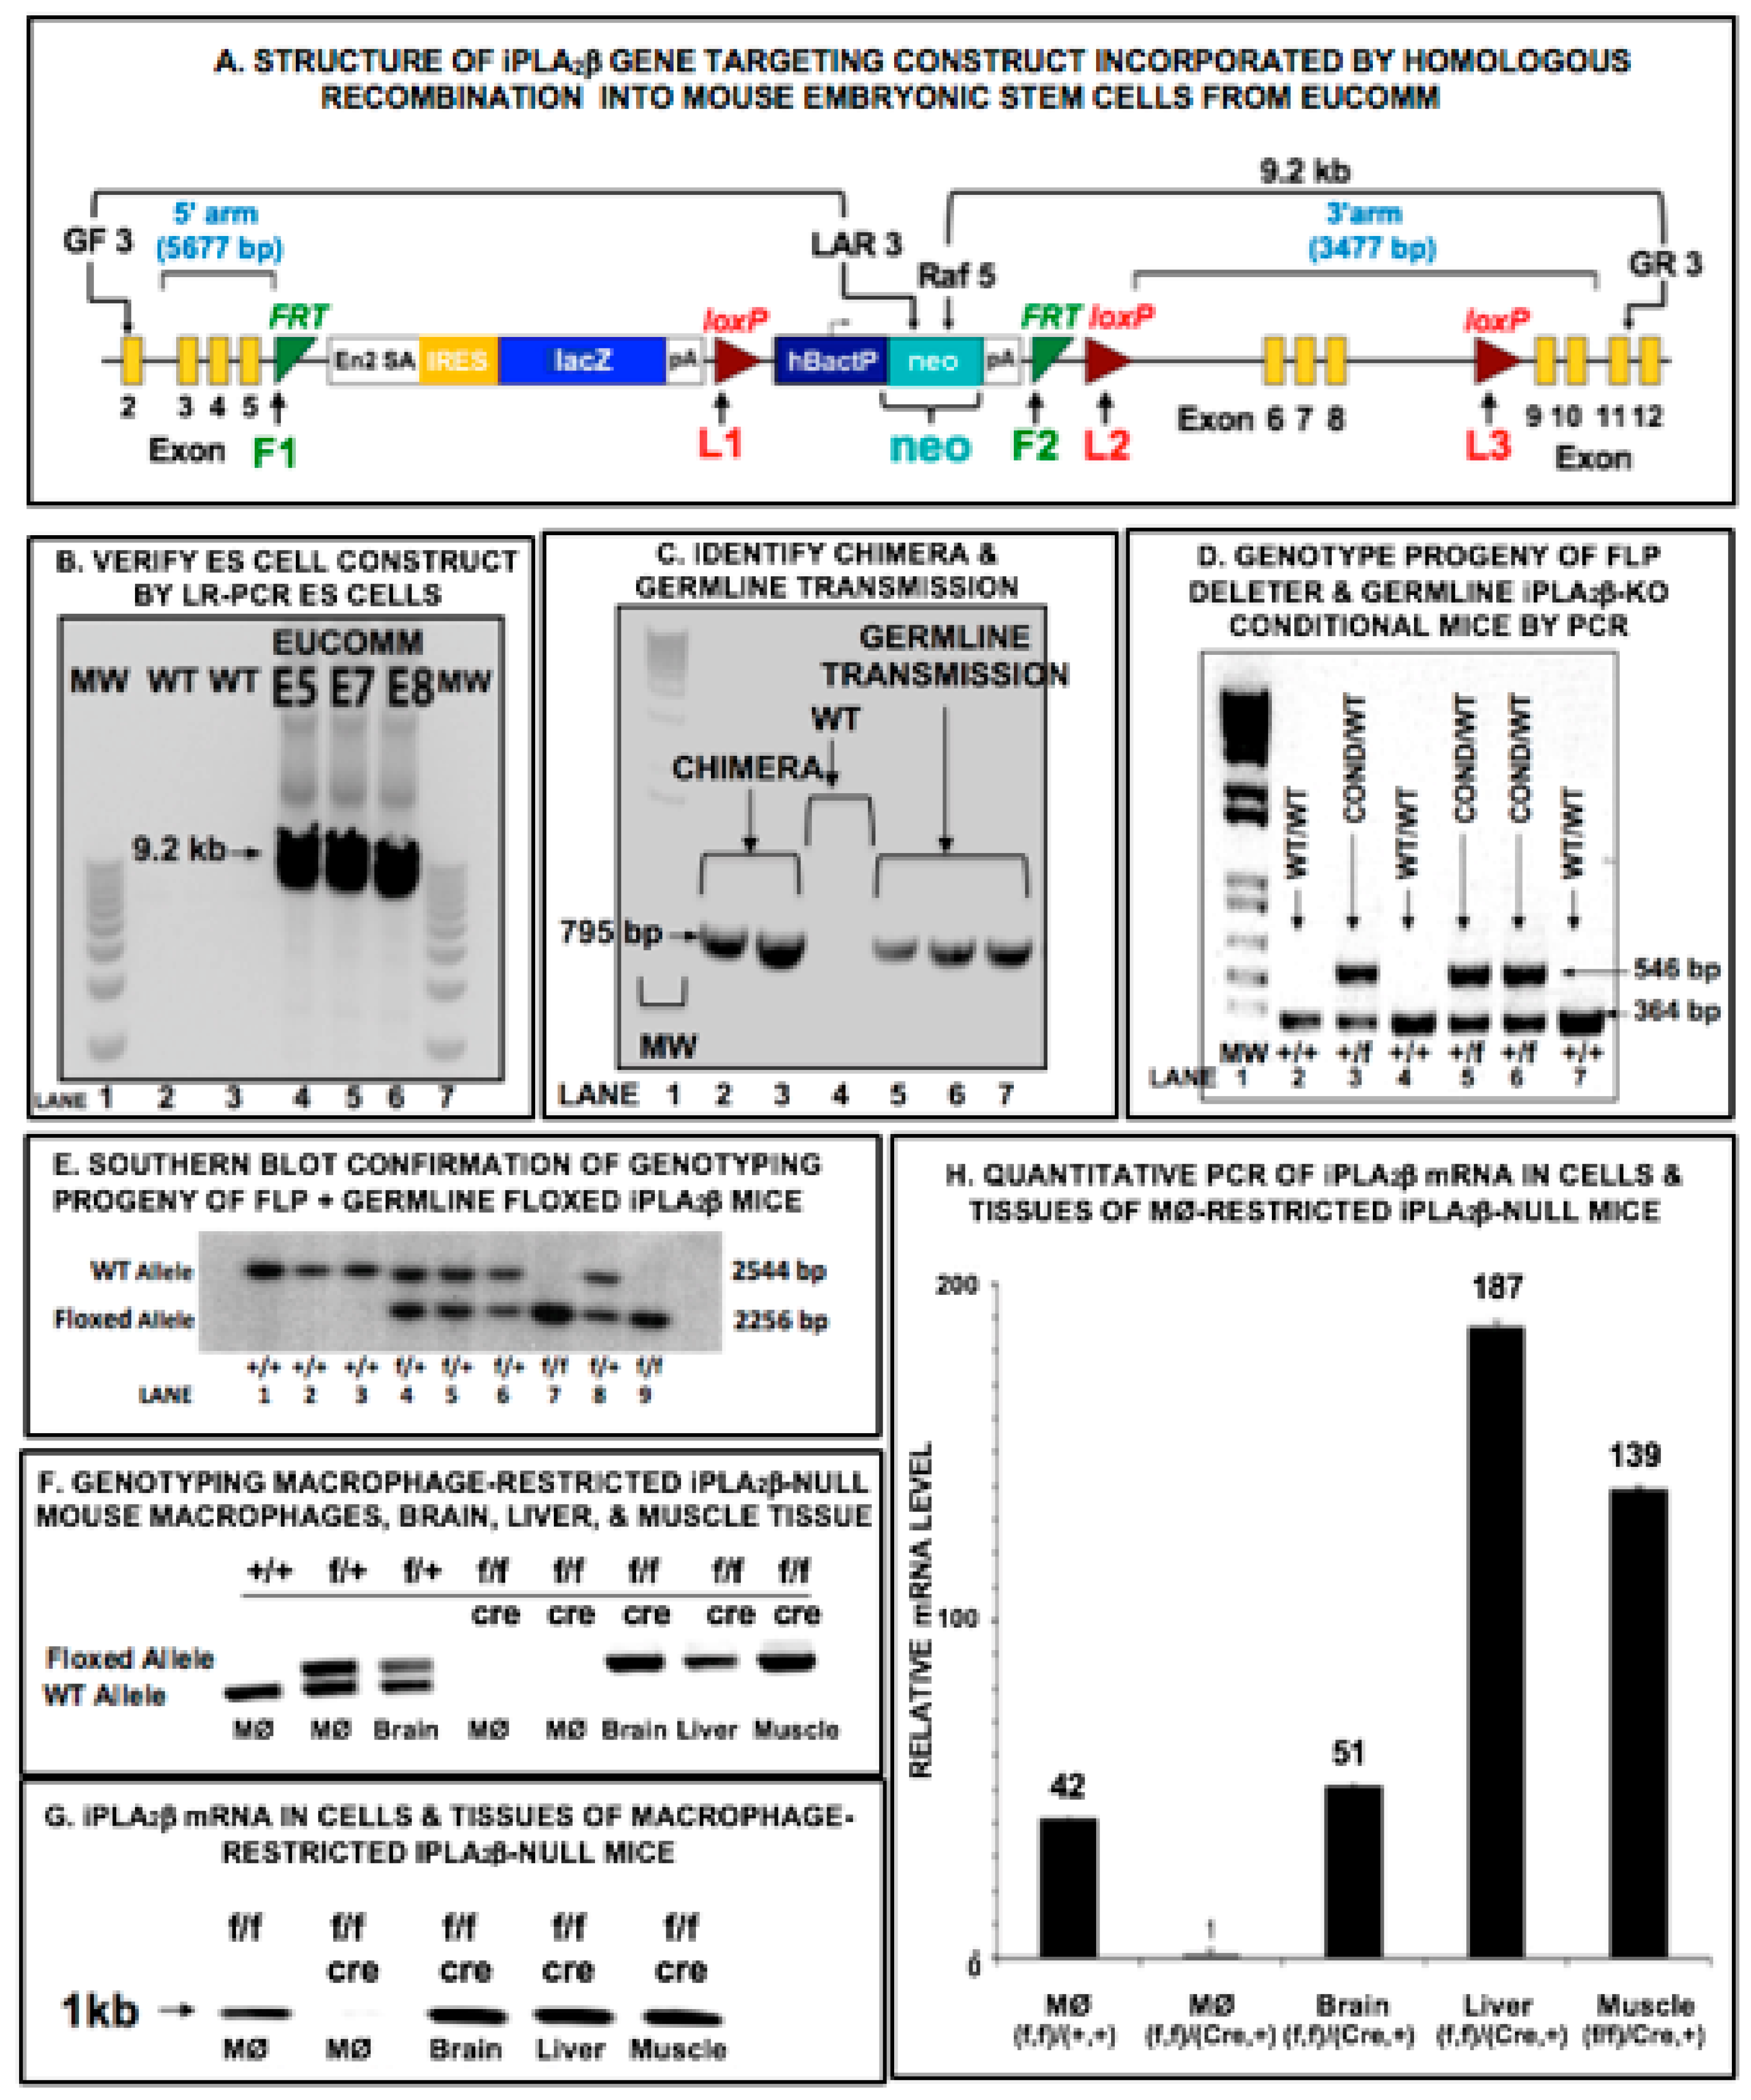
2.2. Preparation of Mice with Selective Deletion of iPLA2β from Restricted Cell Lineages

The Washington University Animal Studies Committee approved all animal studies. Mice with floxed-iPLA2β alleles were prepared and mated with mice expressing Cre recombinase under control of cell type-restricted promoters to generate conditionally iPLA2β-deficient mice. European Conditional Mouse Mutagenesis (EUCOMM) embryonic stem (ES) cells with an iPLA2β-targeting construct incorporated by homologous recombination [40] were purchased (Figure 1A). In this construct, LoxP sites L2 and L3 were recognized by Cre recombinase [41,42] flank critical iPLA2β gene exons 6–8 (Figure 1A). Removing this “floxed” segment results in a truncated mRNA species eliminated by nonsense mediated decay. The 5′ fragment with the neo cassette is flanked by FRT (flippase recognition target) sites F1 and F2 (Figure 1A) that are recognized by FLP (flippase) recombinase [43,44]. Correct integration of 5′ and 3′ arms was confirmed by PCR (Figure 1B) using primer sets that recognize sequences external to the construct and within the neo cassette, respectively. Primer set Raf 5 and GR3 for the 3′ arm yielded a 9.2 kb product (Figure 1A). Two clones (G05, G07) with normal karyotypes were injected into blastocysts that were then implanted into pseudo-pregnant females. Both yielded chimeric mice that transmitted the targeted allele in the germ line to yield heterozygotes for wild-type (WT) and EUCOMM iPLA2β alleles [45], as verified by PCR with primers within the neo cassette and the intron between L2 and exon 6, respectively, that yield a 795 bp product (Figure 1C).
These mice were mated with FLP deleter mice to excise the F1-F2 region that contained the neo cassette [43,44,45] to yield a conditional iPLA2β allele in which loxP sites L2 and L3 flank exons 6–8 (Figure 1A). Progeny included heterozygotes for conditional and WT iPLA2β alleles, as verified by PCR genotyping with primers in introns between exon 5 and F2 and between L2 and exon 6, respectively, which yielded products of 546 and 364 bp for conditional and WT alleles, respectively (Figure 1D). Genotypes were confirmed by Southern blotting after digestion with restriction endonuclease Bam H1, which cleaves at sites B1, B2 (conditional allele), and B3 (WT allele) to yield fragments of 2544 and 2256 bp for WT and conditional alleles (Figure 1E), respectively, recognized by a probe to the 3′ end of exon 4 and the following intron. Heterozygous (conditional/WT) mice were mated with mice that express Cre recombinase under control of RIP2 or LysM promoters to direct Cre expression in β-cells or macrophages [46,47,48,49,50,51,52,53], respectively. FLP-negative offspring were mated with Cre mice to produce mice homozygous for iPLA2β conditional alleles that express Cre recombinase (Figure 1F) and produce no iPLA2β mRNA in macrophages but do so in other tissues (Figure 1G,H).
Mice were housed in a specific pathogen-free barrier facility with unrestricted access to water and standard mouse chow containing 6% fat. For mice with a β-cell-specific inactivation of iPLA2β (β-iPLA2β-KO), RIP2-Cre mice (The Jackson Laboratory, number 003573) were crossed with mice carrying iPLA2β alleles with exons 6–8 flanked by loxP recombination sites (iPLA2βlox/lox) [46]. First, generation animals hemizygous for the RIP-Cre gene and bearing one “floxed” LPL allele (iPLA2βlox/wt Cre+) were crossed with iPLA2βlox/lox animals to generate β-cell iPLA2β-deficient (iPLA2βlox/lox Cre+) and β-cell iPLA2β wild-type (iPLA2βlox/lox Cre-) littermates that were at least N5 in the C57BL/6 background with a conditional deletion of iPLA2β in β-cells. The following primers were used to document iPLA2β gene rearrangement: primer A, 5′-CCCAGCTCTGTGTCTTAGTATG-3′; primer B, 5′-TTCTTGGCCCAATGGAGTG-3′. Amplification of WT DNA yields a product of 673 bp; amplification of non-rearranged floxed DNA allele yields a product of 855 bp, whereas the amplification of appropriately rearranged DNA will not show a band since the exon 5 is deleted. For mice with a myelomonocytic cell-specific inactivation of iPLA2β (MØ-iPLA2β-KO), mice with loxP-flanked iPLA2β alleles were mated with lysozyme M-Cre mice [51] and crossbred to yield iPLA2β knock-out in macrophage (MØ-iPLA2β-KO) mice that were at least N5 in the C57BL/6 background with conditional deletion of iPLA2β in the myelomonocytic lineage. Mice were genotyped using iPLA2β- and Cre-specific primer sets [54], weaned to chow providing 6% calories as fat, and subsequently fed a high-fat diet (HFD), as described below.

2.3. Analyses of iPLA2β mRNA in Mouse Tissues

Northern blots of iPLA2β mRNA were performed as described in [11]. For RT-PCR, total RNA was isolated with an RNeasy kit (Qiagen Inc.). A SuperScript First Strand Synthesis System (Invitrogen) was used to synthesize cDNA in 20 µL reactions that contained DNase I-treated total RNA (2 µg). The cDNA product was treated (20 min, 37 °C) with RNase H (2 units, Invitrogen), and was heat inactivated (70 °C for 15 min). A reaction without reverse transcriptase was performed to verify the absence of genomic DNA. The PCR performed with the pair of primers 1 and 2 was designed to amplify a fragment that spans the neomycin cassette insertion site. The PCR performed with the pair of primers 3 and 2 was designed to amplify a fragment downstream from the neomycin cassette insertion site. The sequence of primer 1 is tgtgacgtggacagcactagc; that of primer 2 is ccccagagaaacgactatgga; that of primer 3 is tatgcgtggtgtgtacttccg.

2.4. High-Fat Dietary Intervention Studies

Mice were housed in a pathogen-free barrier facility with unrestricted access to water and standard mouse chow (Purina Mills Rodent Chow 5053) with a caloric content of 13.025% fat, 62.144% carbohydrate, and 24.651% protein. For dietary intervention studies, mice were fed standard chow until 8 weeks of age and thereafter were randomized into groups that were fed either standard chow or a HFD continuously until they reached the age of three or six months, respectively, as described in [55]. The HFD (Harlan Teklad catalog TD88137) had a caloric content of 42% fat, 42.7% carbohydrate, and 15.2% protein.

2.5. Blood Glucose and Insulin Concentrations

As described previously [56], blood samples were obtained from the lateral saphenous vein in heparinized capillary tubes, and glucose concentrations were measured in whole blood with a blood-glucose monitor (Becton Dickenson) or an Ascensia ELITE XL blood-glucose meter. Plasma was prepared from heparinized blood by centrifugation, and insulin levels were determined in aliquots (5 µL) with a rat insulin ELISA kit (Crystal Chem). Fasting blood samples were obtained after an overnight fast, and fed blood samples were obtained between 9:00 and 10:00 a.m.

2.6. Glucose and Insulin Tolerance Tests

As described in [23], intraperitoneal glucose tolerance tests (IPGTTs) were performed on mice that fasted overnight from which a baseline blood sample was obtained, followed by intraperitoneal injection of D-glucose (2 mg/g body weight) and collection of blood for measurement of glucose level after 30, 60, and 120 min. Insulin tolerance tests were performed in mice with free access to water and chow that received an intraperitoneal injection (0.75 U/kg body weight) of human regular insulin (Lilly, Indianapolis, IN, USA), followed by collection of blood after 30, 60, and 120 min for glucose level determinations [24,26].

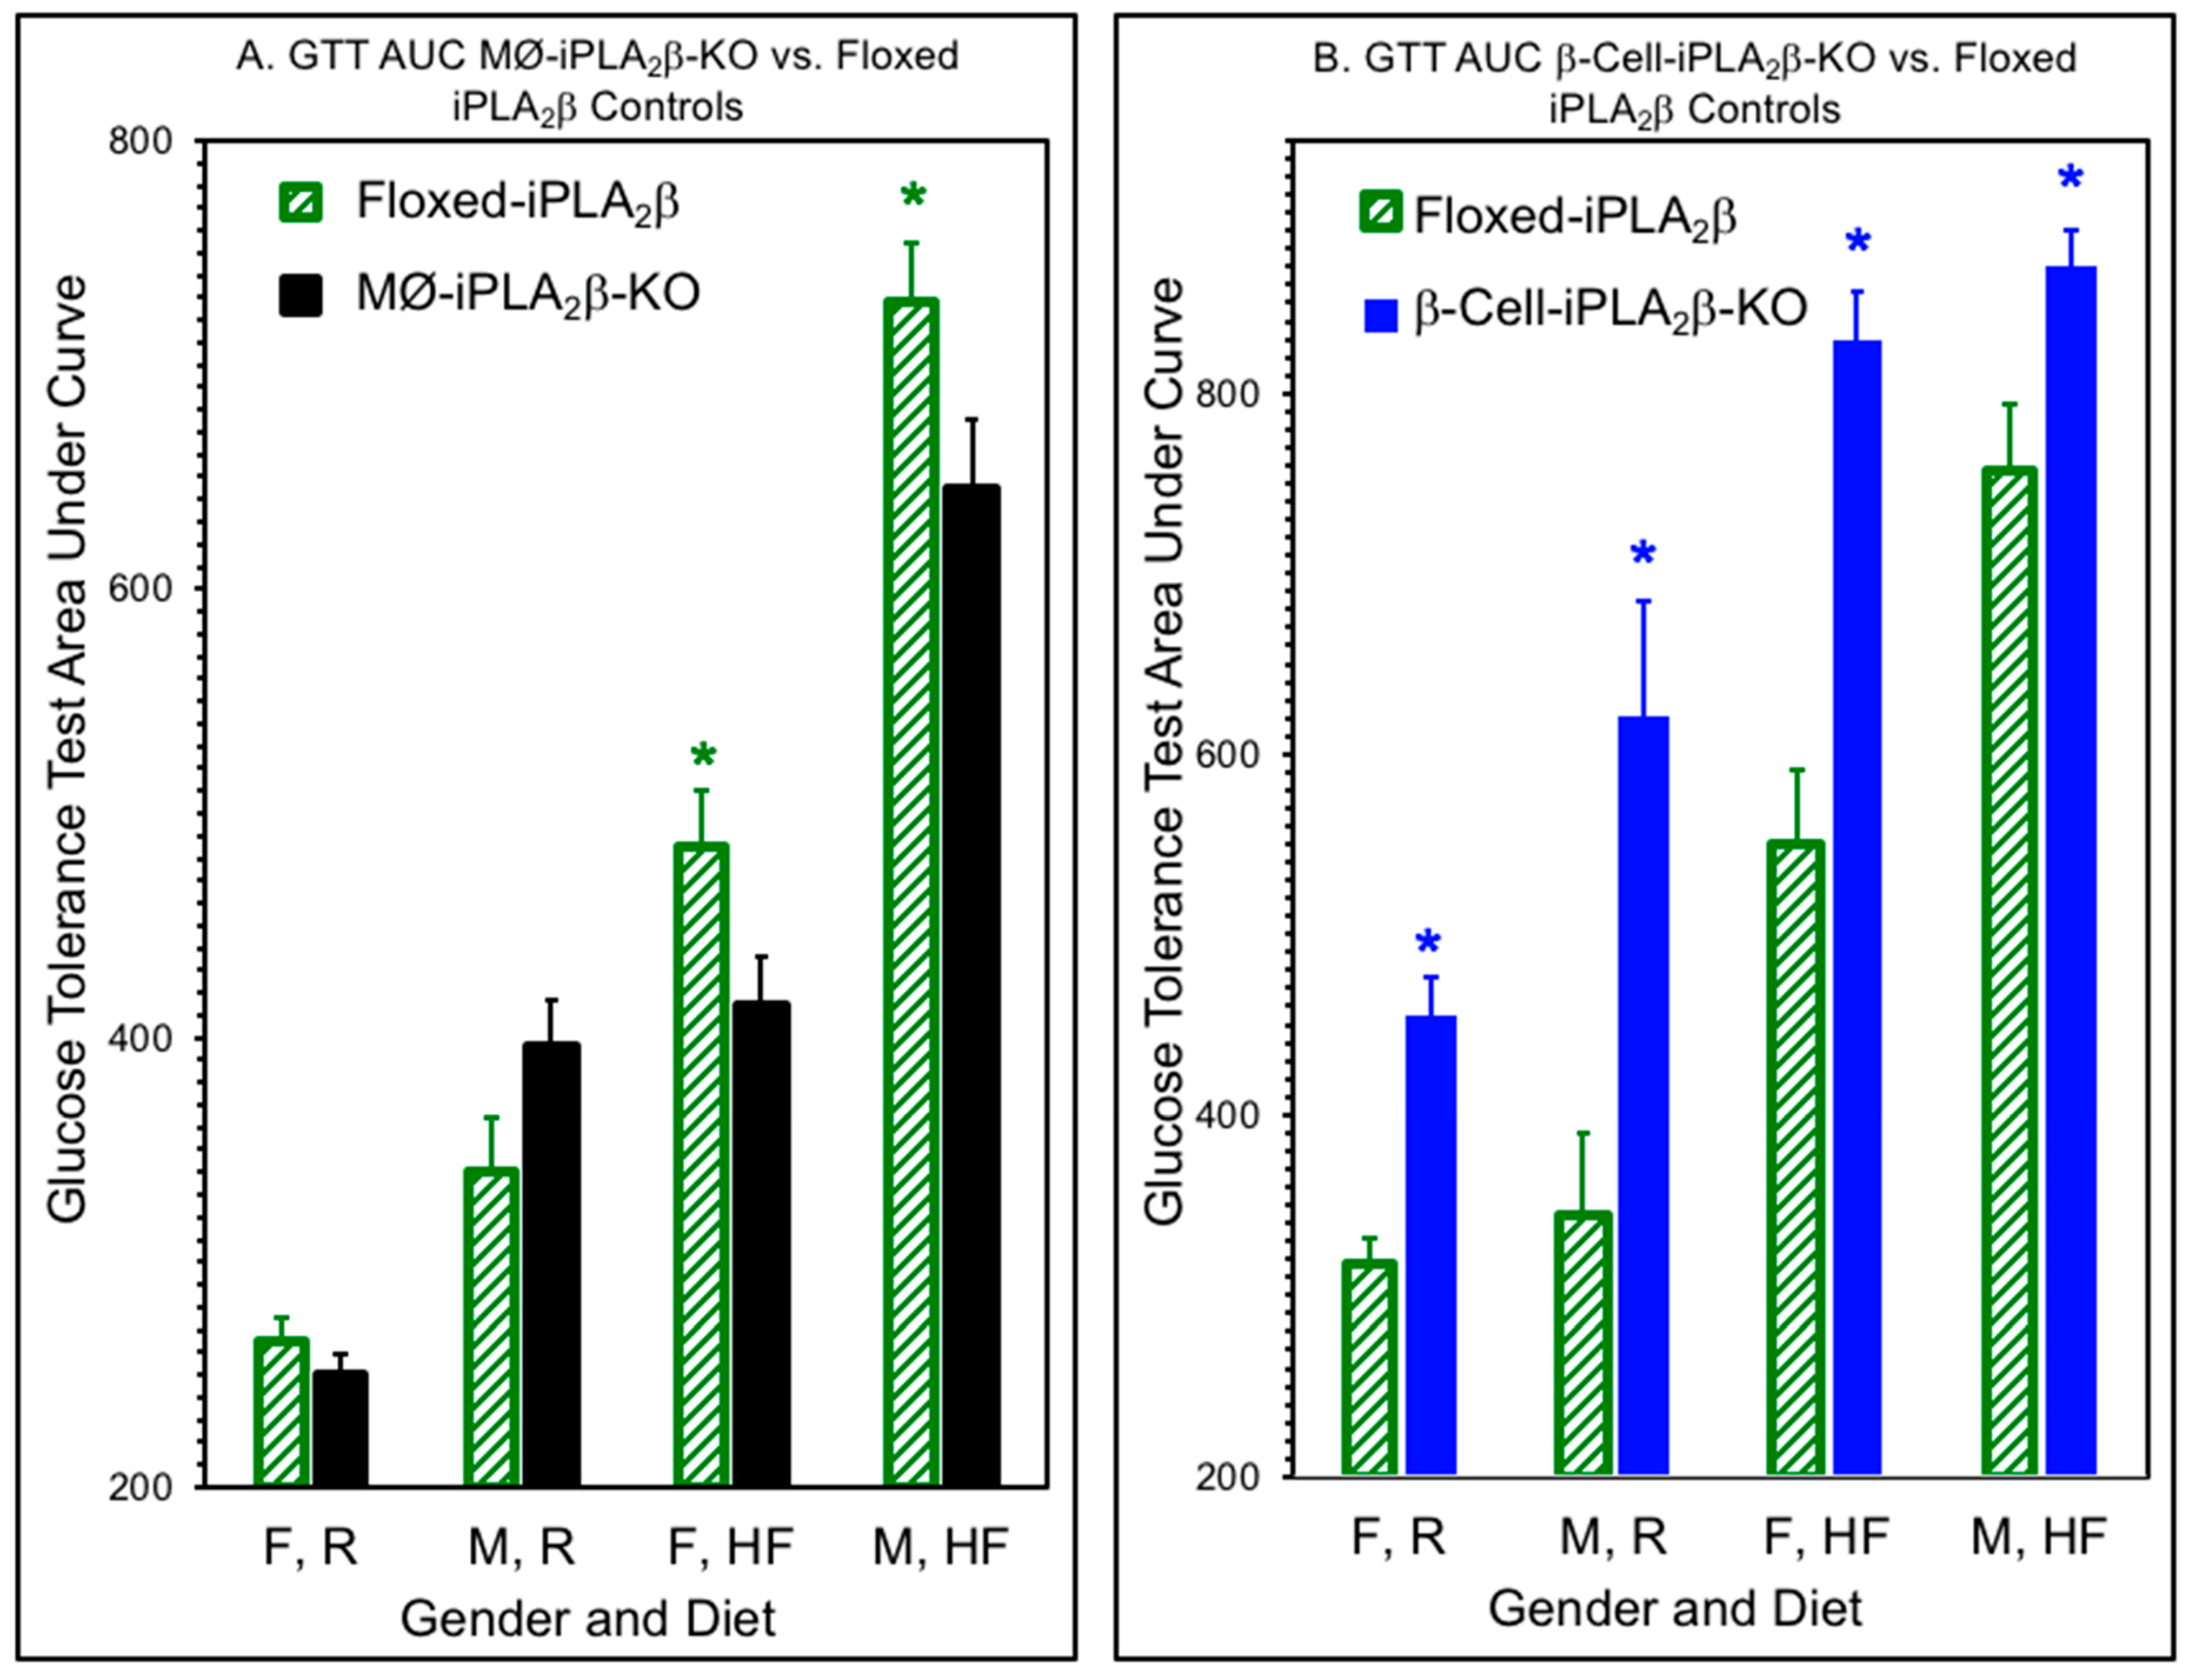
2.7. Area Under the Curve (AUC) Calculations for Glucose Tolerance Tests (GTTs)

As described previously [23,24,57], the AUC for the GTT curves was calculated by the method of Sakaguchi et al. [58], where the blood glucose concentration at t = x min is designated G(x):
AUC = [0.25 × G(0)] + [0.5 × G(30)] + [0.75 × G(60)] + [0.5 × G(120)]

2.8. Insulin Secretion In Vivo

Mice were fasted overnight, and baseline blood samples were obtained from the saphenous vein, followed by intraperitoneal injection of D-glucose (3 mg/kg body weight), and a blood sample was obtained 30 min thereafter for the measurement of plasma insulin levels, as described in [57].

2.9. Pancreatic Islet Isolation

Islets were isolated from pancreata removed from mice by collagenase digestion after mincing, followed by Ficoll step density gradient separation, and manual selection under stereomicroscopic visualization to exclude contaminating tissues [46,59].

2.10. Insulin Secretion Ex Vivo from Isolated Pancreatic Islets in Static Incubations

Islets were rinsed with KRB medium containing 3 mM glucose and 0.1% bovine serum albumin and placed in silanized tubes (12 × 75 mm) in the same buffer, through which 95% air/5% CO2 was bubbled before the incubation. The tubes were capped and incubated (37 °C, 30 min) in a shaking water bath, as described in [24,46,59]. The buffer was then replaced with KRB medium containing 1, 11, or 20 mM glucose and 0.1% BSA without or with forskolin (2.5 µM), and the samples were incubated for 30 min. Insulin secreted into the medium was measured, as described in [46,57].

2.11. Other Analytical Procedures

Serum glucose was measured using reagents from Sigma, and serum insulin was measured by an enzyme-linked immunosorbent assay (Crystal Chem. Inc., Downer’s Grove, IL, USA), as described in [46].

2.12. Statistical Methods

Results are presented as mean ± SEM. Data were evaluated by an unpaired, two-tailed Student’s t test or by an analysis of variance with appropriate post-hoc tests. Significance levels are described in the figure legends.

3. Results

3.1. Mouse Genotype Characterization

As described in the experimental procedures and illustrated in Figure 1, mice homozygous for a floxed-iPLA2β allele were prepared and mated with mice that express Cre recombinase in a restricted set of tissues to produce offspring with conditional iPLA2β gene deletions. Such mice fail to express iPLA2β in tissues that express Cre because the floxed gene is excised by the action of the recombinase, but those mice do express iPLA2β in all other tissues. Two breeding lines of mice with a tissue-selective expression of Cre were used, one of which expresses Cre under control of the Rat Insulin Promoter (RIP) which is active in insulin-secreting pancreatic islet β-cells and in a limited number of other cells but not in the vast majority of cells [46,47,48,49,50]. When mated with mice homozygous for a floxed-iPLA2β allele, some progeny, which are identified by genotyping, fail to express iPLA2β in β-cells, and their genotype is designated β-cell-iPLA2 β-KO. The second breeding line expresses Cre under control of the Lysozyme-M (Lys) promoter that is active in myelomonocytic lineage cells, including monocyte/macrophages [51,52]. When mated with mice homozygous for a floxed-iPLA2β allele, some progeny, again identified by genotyping, fail to express iPLA2β in monocyte/macrophages (MØ), and their genotype is designated MØ-iPLA2β-KO. β-Cell-iPLA2β-KO mice are thus selectively deficient in iPLA2β in β-cells, and MØ-iPLA2β-KO mice are selectively deficient in iPLA2β in monocyte/macrophages. Mice homozygous for a floxed-iPLA2β allele that do not express Cre are designated “Floxed-iPLA2β” and serve as controls when examining the metabolic behavior of the conditional iPLA2β-KO mice.

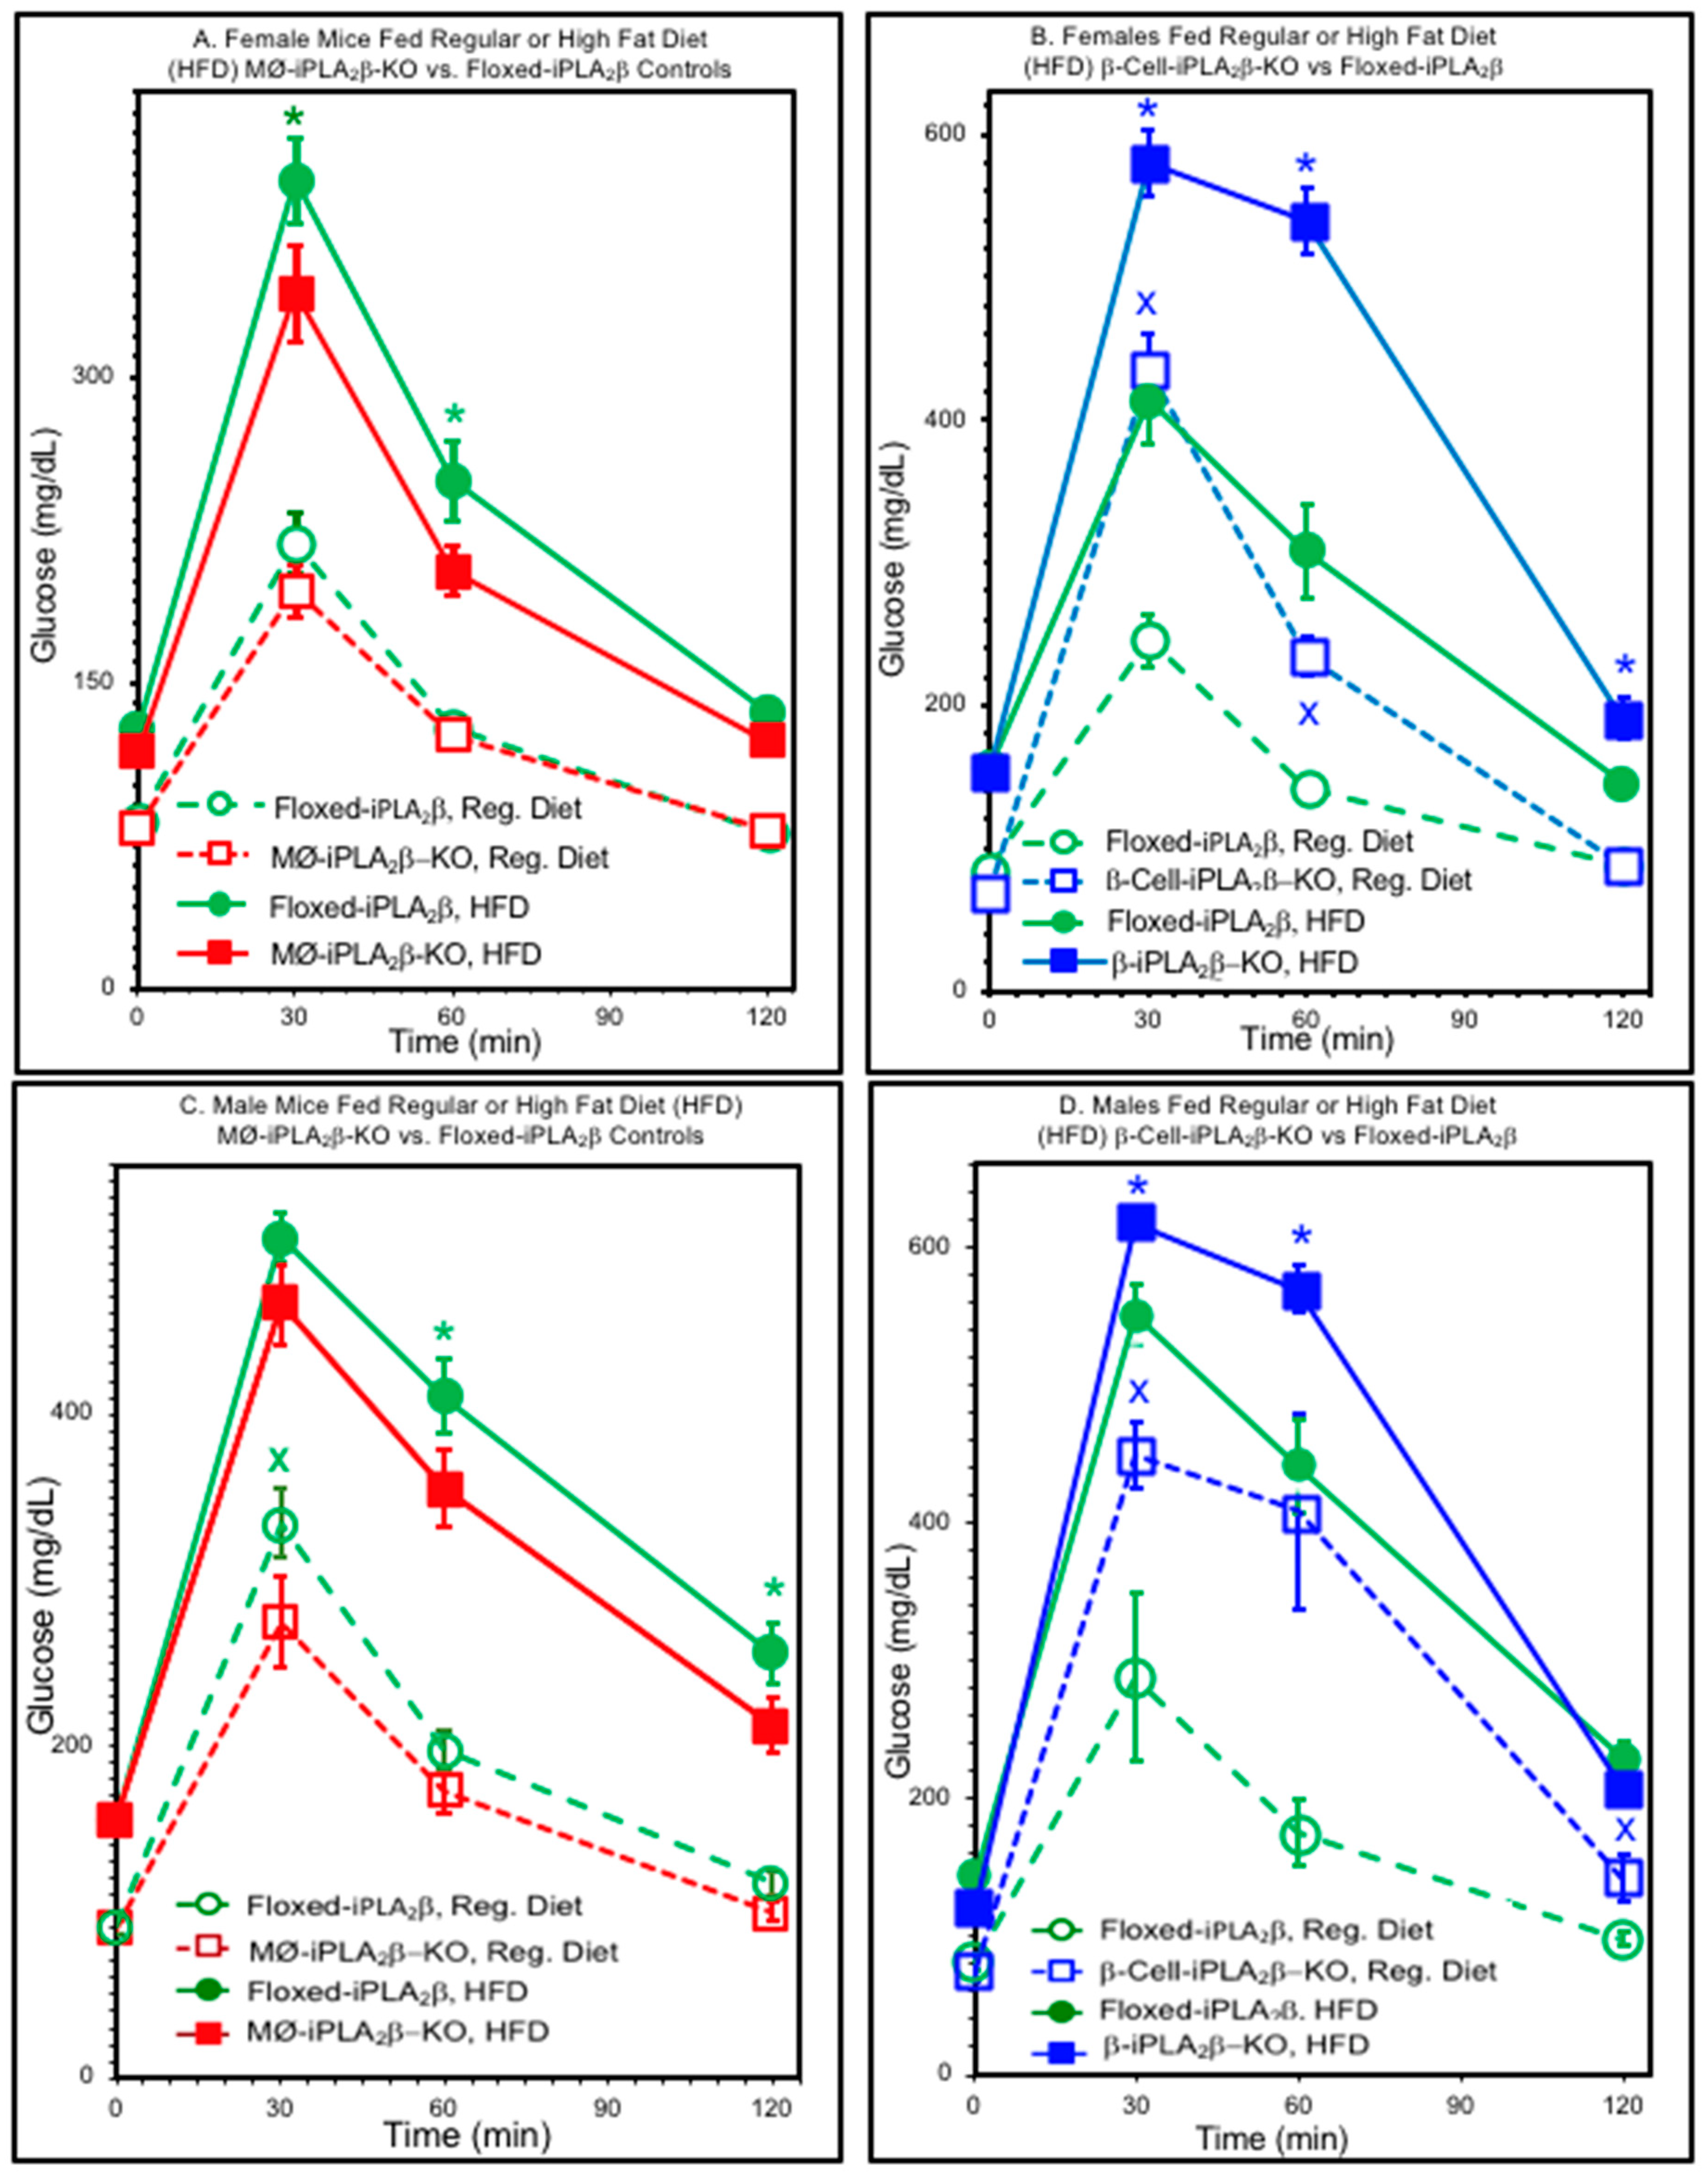
3.2. Glucose Tolerance Tests

Glucose tolerance tests (GTTs) performed with female mice 6 months of age of various genotypes after consuming food from a regular diet (RD) or high-fat diet (HFD) are illustrated in Figure 2, in which the blood glucose concentration is plotted as a function of time after an intraperitoneal administration of glucose.
Figure 2A shows that for floxed-iPLA2β control mice, glucose tolerance deteriorates significantly in HFD-fed mice compared to RD-fed mice. This effect of diet was also observed in MØ-iPLA2β-KO mice, but the peak glucose concentration and the area under the curve (AUC) of the GTTs were both significantly lower for MØ-iPLA2 β-KO mice than for floxed-iPLA2β controls, suggesting that MØ-selective iPLA2β deficiency confers some protection against diet-induced glucose intolerance.
Figure 2B illustrates that GTTs performed with β-cell-iPLA2 β-KO mice compared to floxed-iPLA2β controls. Again, there is HFD-induced deterioration in GTTs compared to RD-fed mice for the floxed-iPLA2β control mice. This dietary effect was also observed in β-cell-iPLA2β-KO mice. In contrast to MØ-iPLA2β-KO mice, the peak glucose concentration and the Area Under the Curve (AUC) of the GTT were both significantly higher in β-cell-iPLA2β-KO mice than in floxed-iPLA2β controls, suggesting that β-cell-selective iPLA2β deficiency exacerbates diet-induced glucose intolerance.
Similar effects of genotype and diet were observed in male mice 6 months of age, as illustrated in Figure 3, in which the AUC of the GTT is plotted for female (F) or male (M) mice fed a regular (R) or high-fat (HF) diet. Figure 3A shows that for a given diet, males exhibit higher GTT AUC values than females and that a HFD causes deterioration in glucose tolerance, as reflected by a higher AUC, compared to RD-fed mice. For both males and females, the diet-induced rise in GTT AUC was significantly lower for MØ-iPLA2β-KO mice than for floxed-iPLA2β controls. In contrast, the diet-induced rise in GTT was significantly higher for β-KO (RIP) mice than for floxed-iPLA2β controls for both males and females.
Together, Figure 2 and Figure 3 demonstrate that glucose tolerance is affected by diet, gender, and genotype, with a higher GTT AUC for males compared to females and for HFD-fed compared to RD-fed mice. Compared to flox mice, MØ-iPLA2β-KO mice exhibit a significantly lower HFD-diet induced deterioration of GTT than floxed-iPLA2β controls. In contrast, β-cell-iPLA2β-KO mice exhibit significantly poorer glucose tolerance, as reflected by a higher GTT AUC than floxed-iPLA2β controls after the introduction of an RD, and HFD-induced deterioration of glucose tolerance is greater for β-cell-iPLA2β-KO mice than for floxed-iPLA2β controls.
Table S1 illustrates an effect of age on glucose tolerance. Metabolic abnormalities that have developed in mice aged 6 months were found to be nascent but attenuated in mice aged 3 months. For a given condition, GTT AUC is lower for mice aged 3 months than for mice aged 6 months. A HFD also induces deterioration in glucose tolerance for both female and male mice at an age of 3 months, although the effect is smaller than with mice aged 6 months. For female mice aged 3 months, the GTT AUC was significantly lower for MØ-iPLA2β-KO mice than for floxed-iPLA2β control mice after RD-consumption, and the GTT AUC was significantly higher for β-cell-iPLA2 β-KO mice than for floxed-iPLA2β mice after RD-consumption. No other comparisons were statistically significant for female or male mice aged 3 months, although there was a strong trend for higher GTT AUC for HFD-fed β-Cell-iPLA2β-KO mice than for floxed-iPLA2β controls and a trend for higher GTT AUC for RD-fed male β-cell-iPLA2β-KO mice than for floxed-iPLA2β controls. Weaker trends were observed for the GTT AUC to be lower in HFD-fed female MØ-iPLA2β-KO mice than for floxed-iPLA2β mice and for the GTT AUC to be higher in HFD-fed male β-cell-iPLA2β-KO mice than for floxed-iPLA2β controls.

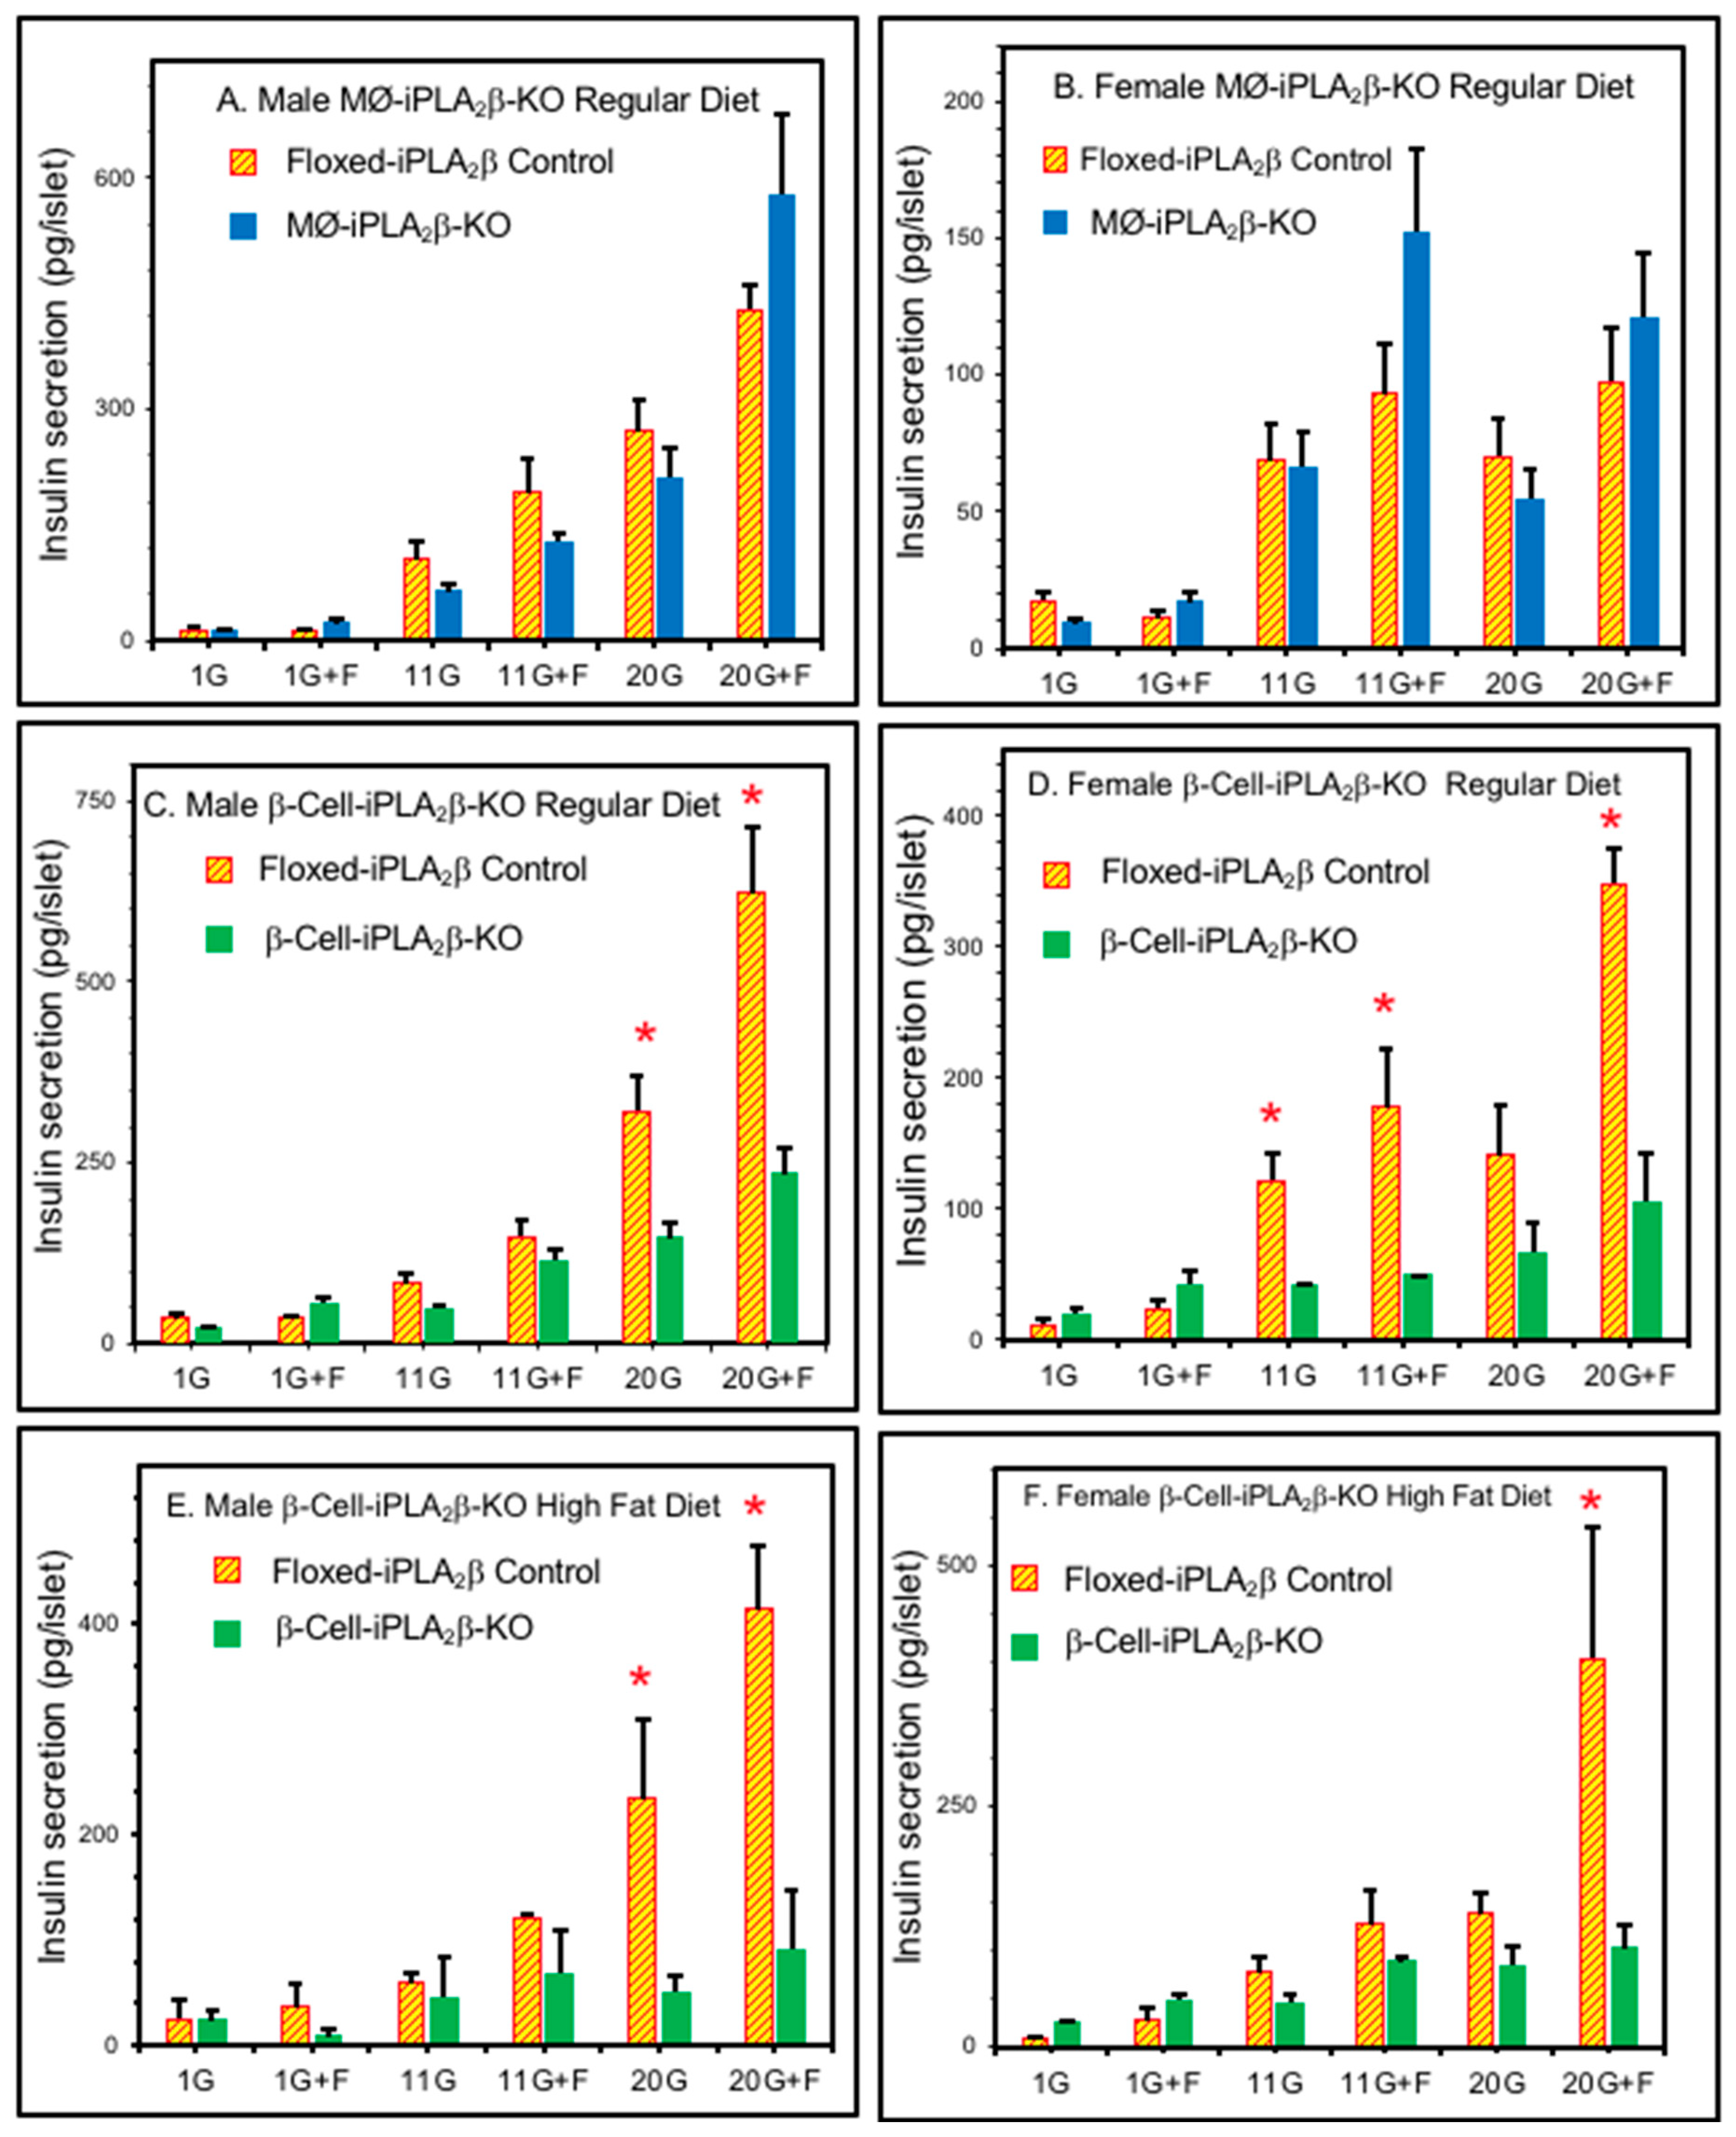
3.3. Ex Vivo Insulin Secretion from Isolated Pancreatic Islets

The magnitude of GSIS from pancreatic islet β-cells has an important influence on glucose tolerance, and the secretory behavior of pancreatic islets isolated from RD-fed or HFD-fed mice of various genotypes was therefore examined ex vivo, as illustrated in Figure 4. Islets isolated from both male and female RD-fed floxed-iPLA2β control mice exhibited insulin secretion that increased with medium glucose concentration over a range from 1 to 20 mM, and this response was amplified in the presence of the adenylyl cyclase activator, forskolin (Figure 4A–D), as observed in previous studies [22,23,24]. Insulin secretory responses from RD-fed MØ-iPLA2β-KO male or female mice were not statistically different from those for floxed-iPLA2β controls (Figure 4A,B). In contrast, insulin secretory responses from RD-fed β-cell-iPLA2β-KO male or female mice were significantly lower from those for floxed-iPLA2β controls (Figure 4C,D), and this was also observed in islets from HFD-fed β-cell-iPLA2β-KO male and female mice (Figure 4D,E), which exhibited even lower insulin secretory responses relative to floxed-iPLA2β controls than did islets from RD-fed mice. These observations indicate that selective iPLA2β deficiency in β-cells results in impaired insulin secretion from pancreatic islets but that selective iPLA2β deficiency in MØ does not. The impaired islet insulin secretion of β-cell-iPLA2β-KO mice in Figure 4C–F is thus likely to contribute to the impaired glucose tolerance in these mice (Figure 2B and Figure 3B).

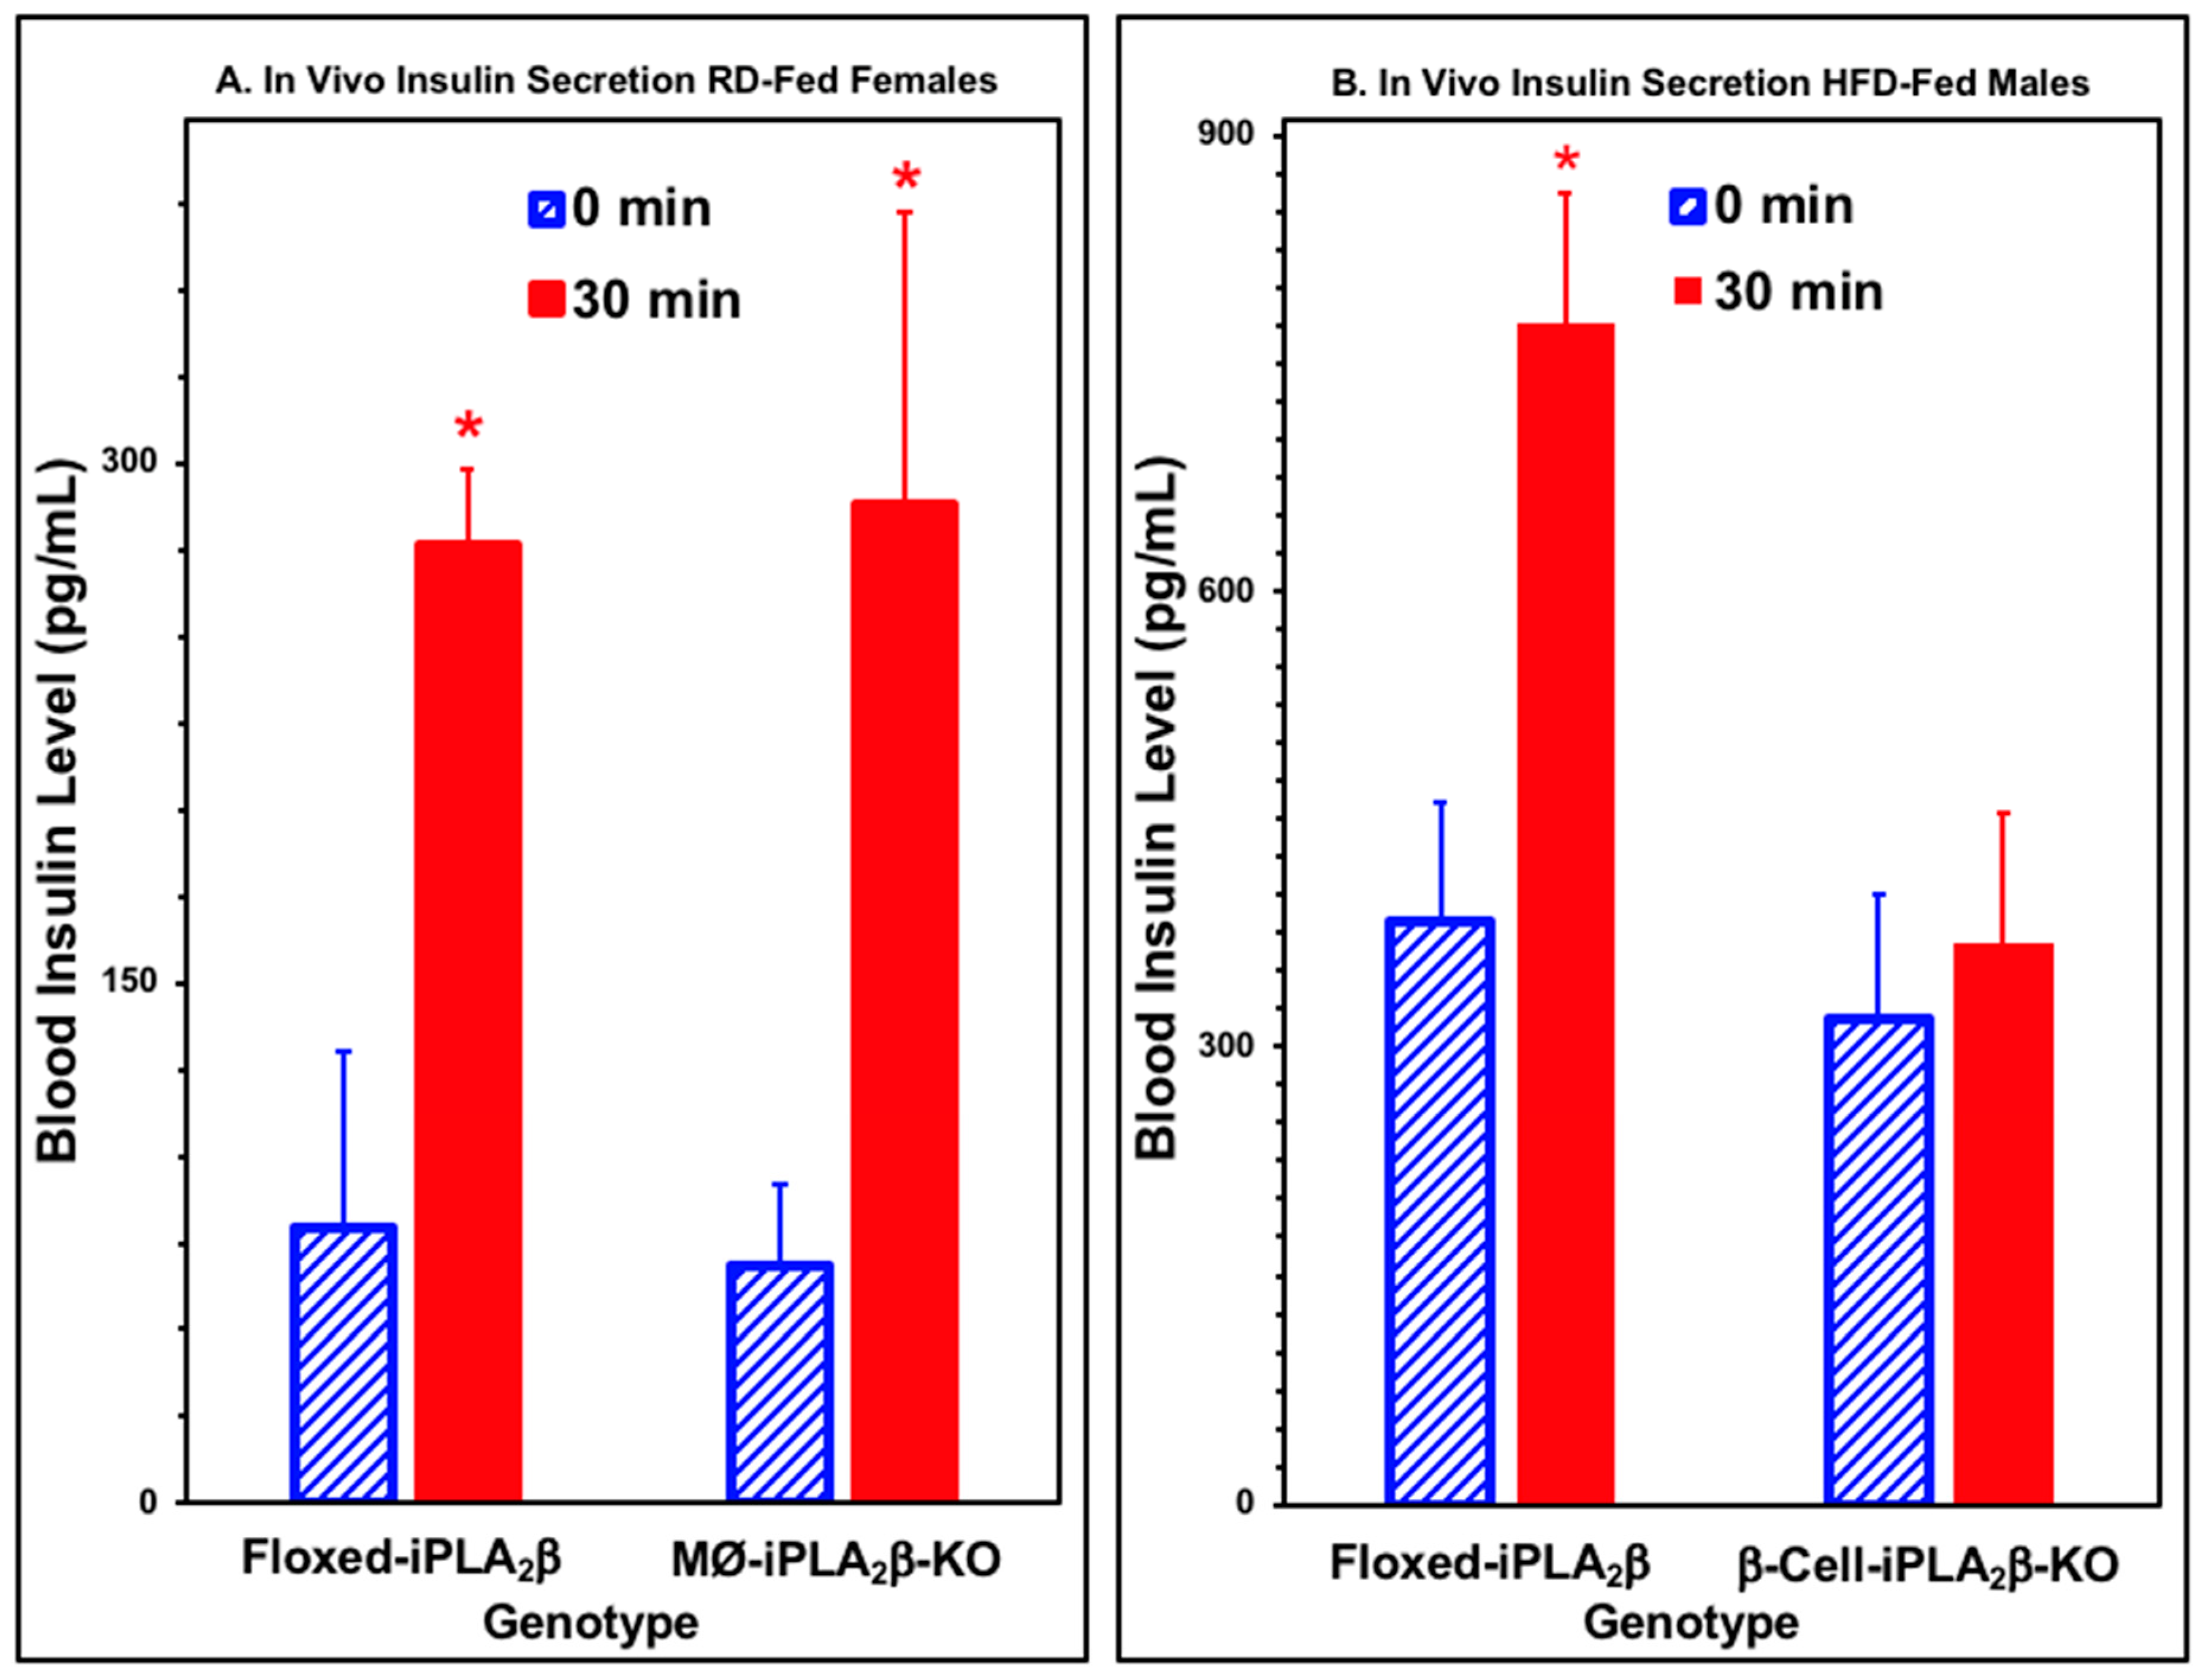
3.4. In Vivo Insulin Secretion in Mice After Intraperitoneal Glucose Administration

To determine whether insulin secretion in vivo would reflect the effects of genotype on insulin secretion ex vivo from isolated pancreatic islets, we determined the increment in blood insulin concentration that occurred 30 min after an intraperitoneal administration of glucose to mice of various genotypes, gender, and dietary history (Figure 5). Both RD-fed male and HFD-fed female floxed-iPLA2β control mice exhibited a significant increment in blood insulin concentrations after an intraperitoneal administration of glucose (Figure 5A,B and Figure S1). This was also true for MØ-iPLA2β-KO mice, and the magnitude of the rise in blood insulin level was similar and not significantly different when comparing MØ-iPLA2β-KO mice to floxed-iPLA2β controls. This is consistent with the observation that insulin secretion from pancreatic islets isolated from MØ-iPLA2β-KO mice is not impaired compared to floxed-iPLA2β controls (Figure 4).
In contrast, neither RD-fed female or HFD-fed male β-cell-iPLA2β-KO mice exhibited a significant increase in blood insulin levels 30 min after intraperitoneal glucose administration (Figure 5A,B and Figure S1). This is consistent with the impairment of ex vivo glucose-dependent insulin secretion that was observed with pancreatic islets isolated from β-cell-iPLA2β-KO mice relative to floxed-iPLA2β controls (Figure 4), suggesting that inadequate insulin secretion contributes to the substantially impaired glucose tolerance observed with β-cell-iPLA2β-KO mice (Figure 2 and Figure 3).

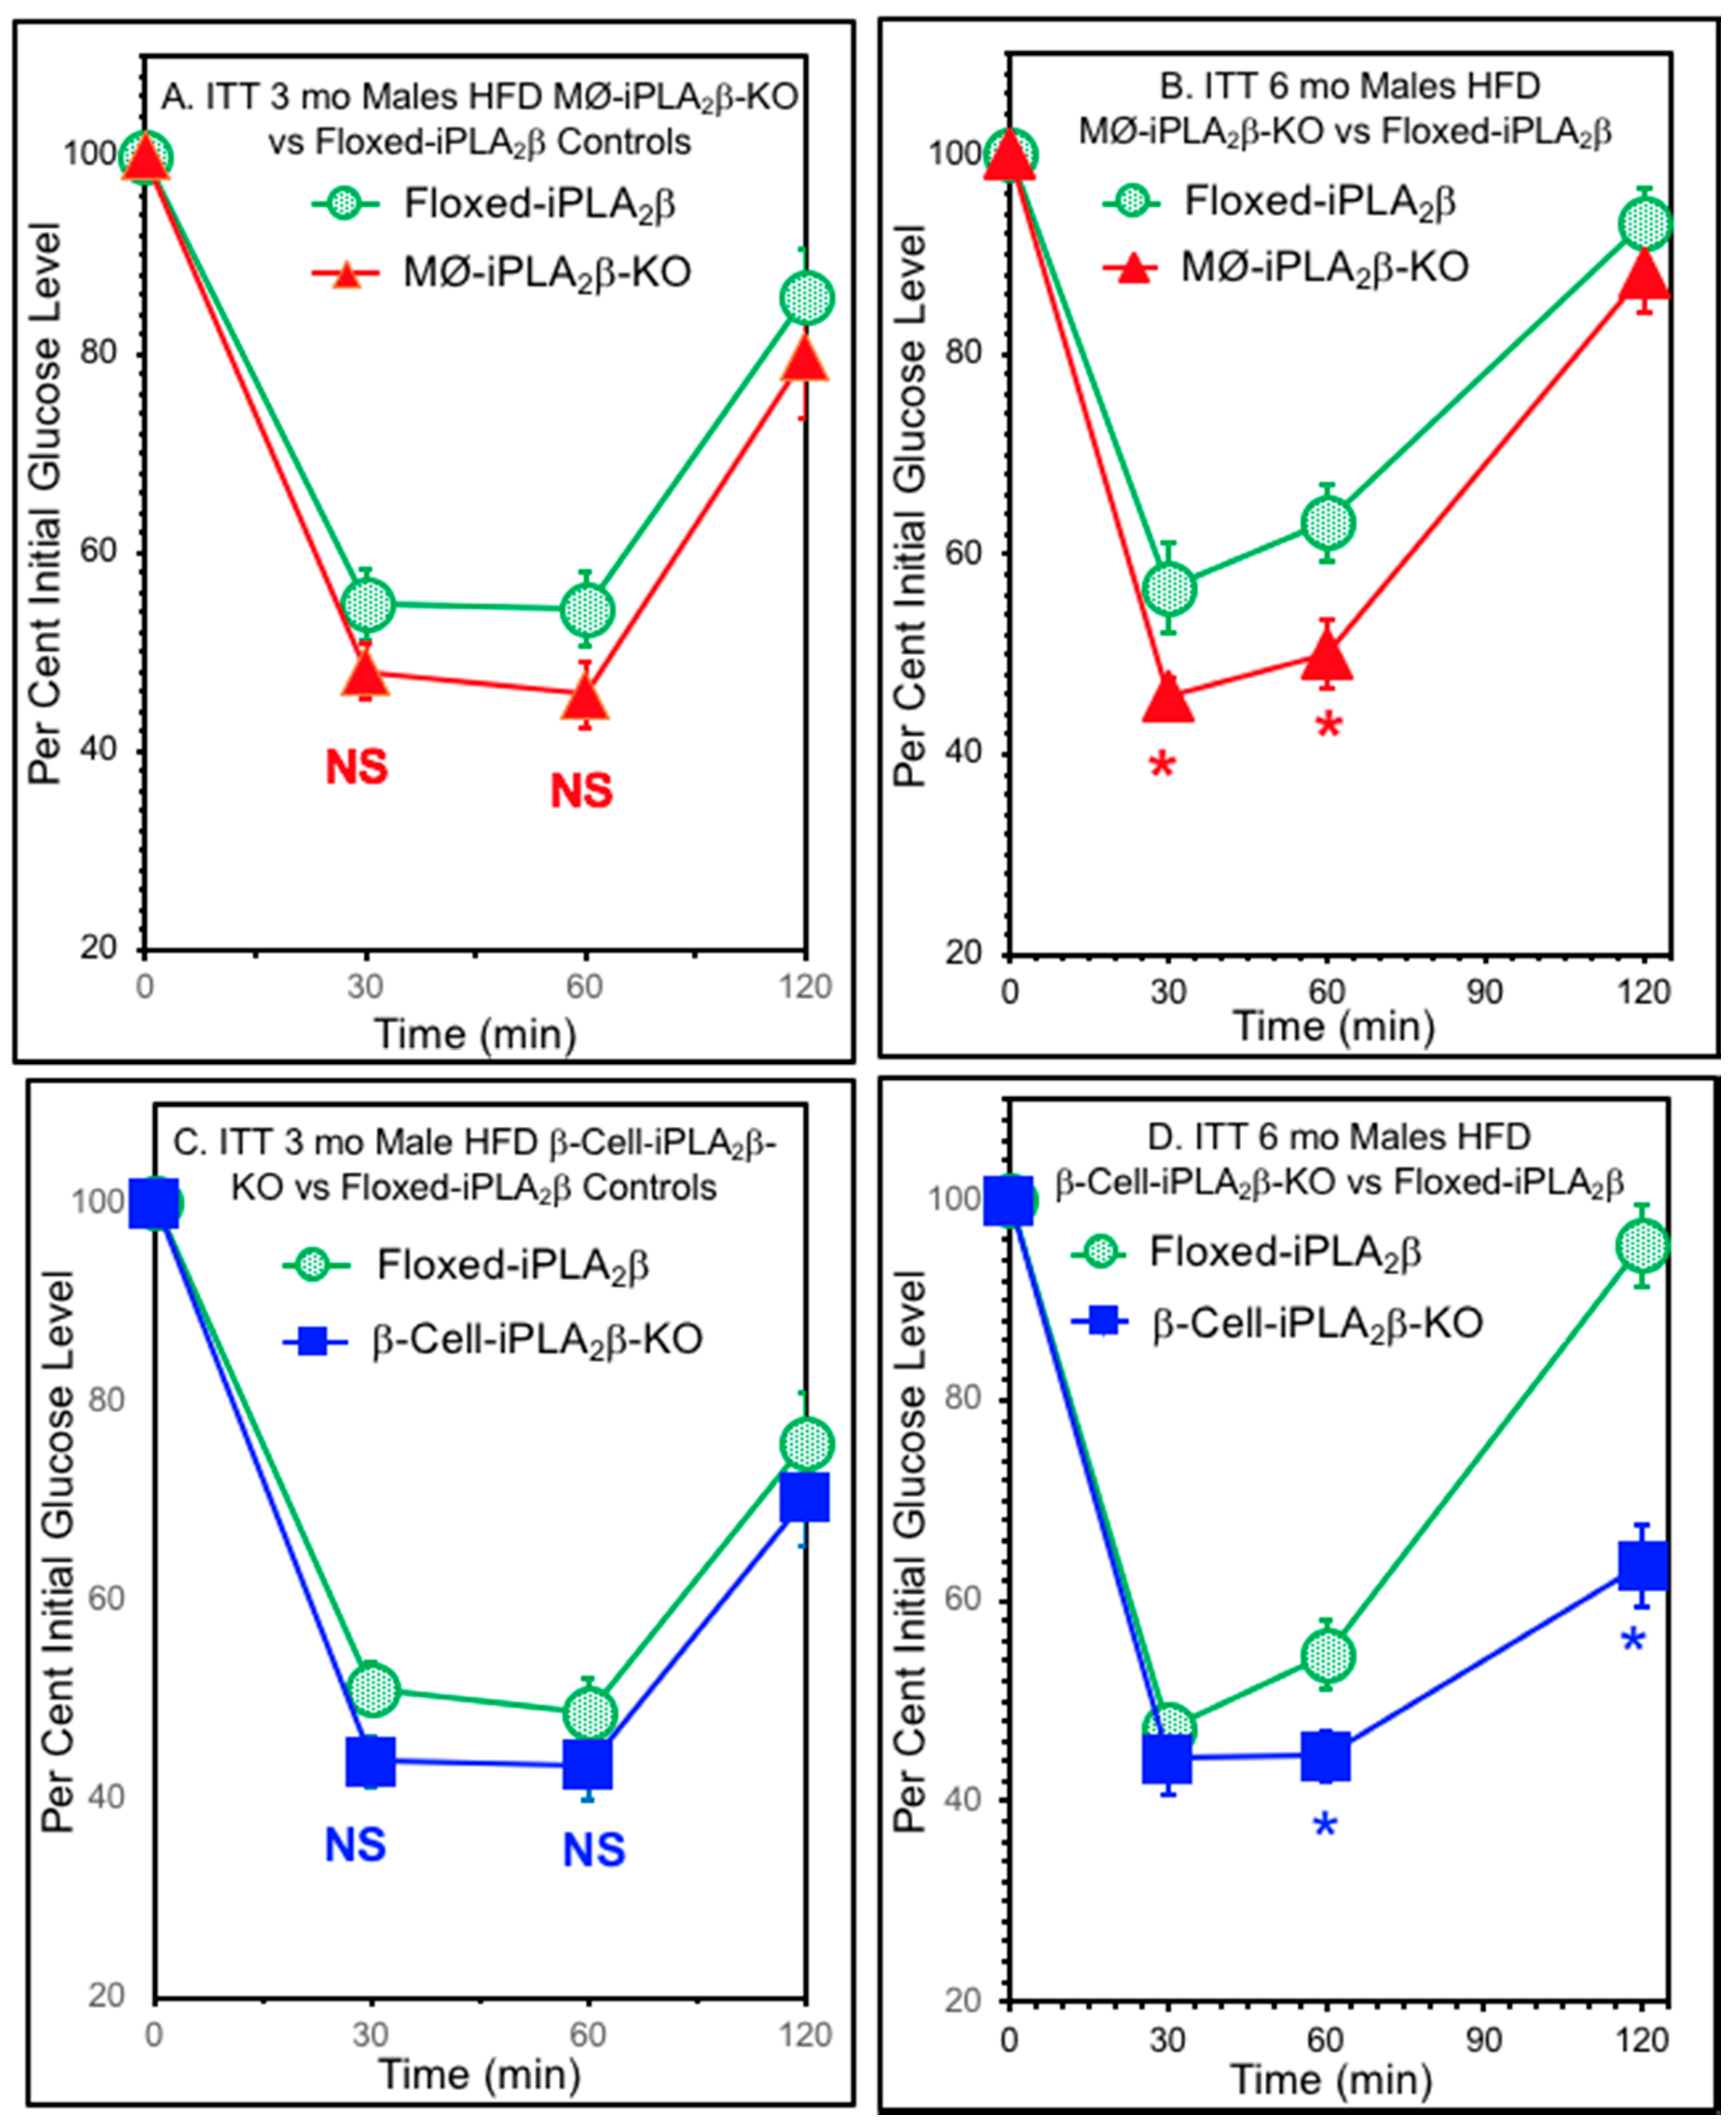
3.5. Insulin Tolerance Tests

In addition to the magnitude of GSIS from pancreatic islets, the responsivity of peripheral tissues, including skeletal muscle, to insulin is an important determinant of glucose tolerance. To evaluate insulin responsivity of mice of various genders, genotypes, and dietary history, insulin tolerance tests (ITTs) were performed by measuring the blood glucose concentrations at various times after an intraperitoneal injection of a fixed dose of insulin, as illustrated in Figure 6.
For female mice aged 3 months either RD- or HFD-fed, the ITT curves for neither MØ-iPLA2β-KO nor β-cell-iPLA2β-KO conditional knockout mice were statistically distinguishable from those for floxed-iPLA2β control mice. This was also true for 3-month-old male MØ-iPLA2β-KO conditional knockout mice and for HFD-fed 3-month-old male β-cell-iPLA2β-KO conditional knockout mice compared to floxed-iPLA2β control mice. For 3-month-old male β-cell-iPLA2β-KO conditional knockout mice fed a RD, the ITT curves showed a slightly but significantly superior insulin sensitivity compared to floxed-iPLA2β control mice (not shown), and this difference was magnified further at age 6 months, as described below.
As illustrated in Figure 6, at 3 months of age the ITTs of male HFD-fed floxed-iPLA2β control mice and MØ-iPLA2β-KO mice (Figure 6A) did not differ significantly, and this was also true for β-cell-iPLA2β-KO mice compared to floxed-iPLA2β control mice aged 3 months (Figure 6C). The deterioration of insulin sensitivity with age occurs, and by 6 months of age, a statistically significant difference between the ITTs for HFD-fed male MØ-KO and floxed-iPLA2β control mice had developed (Figure 6B). The 6-month-old HFD-fed MØ-iPLA2β-KO mice achieved significantly lower blood glucose levels than floxed-iPLA2β control mice at 30 and 60 min after insulin administration (Figure 6B). This is consistent with the hypothesis that motivated the preparation of the MØ-iPLA2β-KO mice—that HFD feeding would induce a lower deterioration in glucose tolerance and insulin sensitivity in MØ-iPLA2β-KO mice compared to floxed-iPLA2β control mice, possibly because of impaired migration of monocytes into peripheral tissues where their differentiation into cytokine-producing macrophages ordinarily contributes to insulin resistance. Similar to the phenomenon described above for 3-month-old male β-cell-iPLA2β-KO conditional knockout RD-fed mice, at 6 months of age HFD-fed β-cell-iPLA2β-KO mice were also significantly more responsive to insulin than floxed-iPLA2β control mice (Figure 6D), raising the unanticipated possibility that β-cell products might also contribute to the development of HFD-induced insulin resistance.
A similar phenomenon was observed in 6-month-old HFD-fed female β-cell-iPLA2β-KO mice, which exhibited superior insulin sensitivity compared to floxed-β-cell-iPLA2β-KO control mice, and this magnified a smaller but similar trend observed with 6-month-old female β-cell-iPLA2β-KO mice fed regular chow (Figure S2A,B). For 6-month-old female MØ-iPLA2β-KO mice, the ITT curves did not differ significantly from those of floxed-iPLA2β control mice fed either a RD or a high-fat diet HFD (Figure S2C,D). Curiously, 6-month-old male MØ-iPLA2β-KO RD-fed mice exhibited lower insulin sensitivity compared to floxed-iPLA2β control mice (Figure S3), and this phenomenon has been observed previously with global iPLA2β-KO mice fed RD compared to controls [23]. In contrast, 6-month-old HFD-fed MØ-iPLA2β-KO male mice exhibited superior insulin sensitivity compared to floxed-iPLA2β control mice (Figure S3), which may reflect less HFD-induced deterioration in insulin sensitivity for 6-month-old HFD-fed MØ-iPLA2β-KO male mice than that which occurred for floxed-iPLA2β control male mice. Discrepant ITT findings between male and female global iPLA2β-KO mice and their responses to dietary stress have also been observed previously [23,24] and are commonplace in animal models of perturbed glucose homeostasis.

4. Discussion

Our previous studies with global iPLA2β-knockout mice indicated that disturbances in glucose homeostasis, which included glucose intolerance and impaired insulin secretion by pancreatic islet β-cells, occurred as a consequence of iPLA2β gene disruption [23,24]. Although iPLA2β and its products might participate in multiple events in GSIS from β-cells, one of them is to amplify depolarization-induced [Ca2+] entry into the β-cell. In addition, iPLA2β appears to confer protection against lipid injury to β-cells that may reflect iPLA2β participation in the repair of oxidative damage to β-cell mitochondrial membranes that occurs in the context of lipid toxicity [24,25]. Loss of these actions of iPLA2β in β-cells provides a plausible explanation for the impaired glucose tolerance in global iPLA2β-null mice, the reduced insulin secretory response to glucose of islets isolated from global iPLA2β-null mice compared to their wild-type littermates, and the exaggerated deterioration in glucose tolerance for global iPLA2β-null mice fed a HFD compared to wild-type controls [23,24].
More puzzling is the superior sensitivity to insulin of global iPLA2β-null mice compared to wild-type controls in insulin tolerance tests [24], implying that iPLA2β gene deletion has opposing effects on insulin secretion from β-cells and the insulin responsiveness of peripheral tissues, including skeletal muscle. One potential explanation for these findings is that iPLA2β deficiency has distinct effects in different cells. A loss of iPLA2β in β-cells would reasonably be expected to impair insulin secretion and to amplify lipid-induced β-cell injury, but a loss of iPLA2β activity is some other cell type might be responsible for the amelioration of lipid-induced deterioration in insulin sensitivity of global iPLA2β-null mice compared to wild-type controls. Candidates include cells of the monocyte/macrophage lineage. It is postulated that in the setting of lipid stress, the migration of blood monocytes into extravascular sites, including adipose tissue, and their differentiation into tissue macrophages results in the elaboration of cytokines, including IL-1β, IL-6 and TNFα, which impair insulin sensitivity. Because iPLA2β-derived 2-lysophosphatidic acid (LPA) appears to be required for monocyte migration in response to the cytokine Monocyte Chemoattractant-1 (MCP-1) [29,37,38,39], we postulated that iPLA2β-deficiency in cells of the monocyte/macrophage lineage might confer protection against the HFD-induced deterioration of insulin sensitivity because of a failure of iPLA2β-null monocytes to migrate into peripheral tissues and differentiate into macrophages.
We therefore prepared mice that are selectively deficient in iPLA2β in β-cells or cells of the monocyte/macrophage lineage. Mice with “floxed” iPLA2β genes were prepared using embryonic stem cells from the EUCOMM consortium. These cells had incorporated a targeting construct by homologous recombination that replaced the wild-type iPLA2β gene. In this construct, LoxP sites recognized by Cre recombinase [41,42] flanked critical iPLA2β gene exons. Mice with the “floxed” iPLA2β genes were then mated with mice that express Cre recombinase under the control of promoters that are expressed in only a restricted set of cells. In cells that express Cre, the action of the recombinase removes the “floxed” segment of the iPLA2β gene-targeting construct, and transcription of this modified gene yields a truncated mRNA that is eliminated by a nonsense mediated decay and cannot lead to production of an active iPLA2β protein. In this way, mice were produced that are selectively iPLA2β-deficient in specifically targeted populations of cells that express Cre recombinase.
To direct Cre expression in β-cells, RIP-Cre mice were used that express Cre under control of the Rat Insulin 2 Promoter, which has been demonstrated to be appropriate for β-cell-specific gene deletion when used in mice on a pure C57BL/6J background [49], as is the case in this study, although anomalies may be encountered on other genetic backgrounds [53]. The use of β-cell-targeting promoters has been reviewed [60], and the use of RIP-Cre remains a popular means of directing β-cell-restricted gene deletion [46,50,61,62,63,64,65,66,67,68,69]. The LysM promoter is expressed in all myeloid cells, and LysM-Cre is widely used to study conditional macrophage-myeloid cell gene deletions [52,70,71,72,73,74,75,76].
Our expectations for the behavior of these conditional iPLA2β-KO mouse lines was that the β-cell-iPLA2β-KO mice would exhibit glucose intolerance, impaired insulin secretion, and increased deterioration in glucose tolerance compared to control mice in response to a HFD, and our observations largely conformed to these expectations. Expectations for the MØ-iPLA2β-KO mice were that insulin secretion and glucose tolerance would be preserved, that deterioration in glucose tolerance induced by a HFD would be blunted compared to floxed-iPLA2β control mice, and that insulin sensitivity as measured in insulin tolerance tests (ITTs) would be impaired less in HFD-fed MØ-iPLA2β-KO compared to floxed-iPLA2β control mice, and our observations also largely conformed to these expectations.
An unexpected finding is that HFD-fed β-cell-iPLA2β-KO mice also had superior insulin sensitivity compared to floxed-iPLA2β control mice as assessed with ITTs. The explanation for this finding has not been established, but of possible relevance is the phenomenon of selective insulin resistance first proposed by McGarry [75] and subsequently discussed by Brown and Goldstein [76] and others [77,78]. McGarry proposed that hyperinsulinemia itself elicits insulin resistance in peripheral tissues [75]. During the evolution of T2D (type 2 diabetes), resistance develops to the effect of insulin to decrease hepatic gluconeogenesis but such resistance does not develop the insulin-stimulated lipogenesis of fatty acids and triacylglycerols (TAGs), which is now known to involve the activation of the transcription factor SREBP-1c [76,77,78]. In fact, hepatic lipogenesis and Very Low Density Lipoprotein (VLDL) secretion are amplified by the hyperinsulinemia that results from the resistance of peripheral tissues to the action of insulin, and fatty acids derived from VLDL TAG exacerbate the insulin-resistant state in muscle and adipose tissue [75,76,77,78,79]. These events result in the classic T2DM triad of hyperglycemia, hyperinsulinemia, and hypertriglyceridemia [75,76]. McGarry suggested that VLDL TAG play a toxic role in the evolution of T2D by their deposition in muscle, where they enhance insulin resistance, and in liver, where they can produce non-alcoholic steatohepatitis (NASH). The term lipotoxicity is used to describe the detrimental effects of accumulation of TAG and other lipids in various tissues [80], and ceramides are thought to be among the lipid mediators that contribute to insulin resistance [79].
If hyperinsulinemia is involved in inducing peripheral tissue insulin resistance, then diabetes in a mouse model caused solely by a β-cell secretory defect might fail to generate sufficiently high levels of hyperinsulinemia to drive development of insulin resistance. Compared to a control population of mice that do develop sufficient hyperinsulinemia, mice with the pure secretory defect might thus exhibit superior insulin sensitivity in insulin tolerance tests. It is of interest in this regard that knockout mice with defective KATP channel activity also have impaired insulin secretion from β-cells but enhanced insulin sensitivity of peripheral tissues in insulin tolerance tests [81], which the authors postulated might be mediated by altered extracellular hormonal or neuronal signals perturbed by disruption of KATP channels [82]. In the context of the discussion in this and the preceding paragraph, one such altered extracellular hormonal signal might be the blood insulin concentration itself.
The possibility that the insulin secretory defect of global iPLA2β-knockout mice and of β-cell-iPLA2β-KO mice prevents the hyperinsulinemia-driven deposition of toxic lipids in tissues that otherwise occurs in mice subjected to a HFD is of interest in the context of observations that hepatic steatosis fails to develop in global iPLA2β-knockout mice subjected to a HFD, although it does occur in control mice [83]. Gene deletion of iPLA2β also greatly attenuates hepatic steatosis that otherwise occurs in the ob/ob mouse genetic model [84]. In addition, ceramides such as those that accumulate in tissues that develop insulin resistance [79,80], also accumulate in β-cells subjected to ER stress in an iPLA2β-dependent process that involves activation of SREBP-1 [85,86,87,88], which is of interest in the context of involvement of SREBP-1 activation in the pathogenesis of hyperinsulinemia-driven amplification of hepatic lipogenesis in the evolution of T2D [76,77,78].
In contrast to the unexpected resistance to HFD-induced deterioration in insulin-responsivity of β-cell-iPLA2β-KO mice discussed above, it was expected that HFD-fed MØ-iPLA2β-KO mice would exhibit superior insulin sensitivity compared to HFD-fed floxed-iPLA2β control mice as assessed with ITTs. This expectation was based on the postulates that HFD-induced deterioration in insulin sensitivity involves migration of blood monocytes into extravascular sites, such as adipose tissue, where they differentiate into macrophages and produce cytokines, including IL-β, IL-6, and TNFα, that impair insulin sensitivity in a process that involves the tissue elaboration of the cytokine Monocyte Chemoattractant-1 (MCP1) and its interaction with the CCR2 receptor on monocytes to induce their migration into tissues [31,32,33,34,35,36]. Genetic and pharmacologic evidence indicates that the monocyte chemotactic response to MCP-1 requires the action of iPLA2β to produce the lipid mediator 2-lysophosphatidic acid (LPA) [37,38,39]. Macrophages [29,30] and other cells [89] from our global iPLA2β knockout mice have been demonstrated to have impaired production of LPA in response to stimuli that induce robust LPA production in wild-type cells.
Moreover, macrophages from our global iPLA2β knockout mice have impaired migratory responses to MCP-1 in a mouse model of diet-induced glucose intolerance and atherogenesis, and these migratory responses are restored by provision of exogenous LPA [29]. The accumulation of macrophages in atherosclerotic lesions in this mouse model of diabetic stress is also associated with increased lesion content of iPLA2β immunoreactive protein and enzymatic activity [29]. Migratory responses of vascular smooth muscle cells (VSMCs) in a model of vascular injury are also greatly reduced in our global iPLA2β-null mice compared to wild-type mice [90]. The activation state of iPLA2β-null macrophages from our global iPLA2β knockout mice is also shifted toward an M2 anti-inflammatory phenotype compared to the inflammatory M1 phenotype exhibited by wild-type macrophages, and this is associated with reduced TNFα production by the iPLA2β-null macrophages [30,91,92,93], which suggests that in addition to participating in monocyte migration into extravascular tissues, iPLA2β may also be involved in their differentiation into pro-inflammatory macrophages that elaborate cytokines that impair insulin sensitivity. The pharmacologic inhibition of iPLA2β also ameliorates leukocyte infiltration into pancreatic islets and the onset of diabetes in NOD (non-obese diabetic) mice [92,93], which suggests that iPLA2β may participate in the evolution of T1D in addition to that of T2DM.
iPLA2β is in fact involved in regulating several fundamental aspects of monocyte/macrophage biology in addition to those discussed above, including the remodeling the fatty acid composition of macrophage phospholipids [94,95], selection of macrophage phospholipid pools from which to mobilize fatty acids upon cellular stimulation [27,96,97], governing the proliferation state of macrophage precursor cells [97], regulating macrophage apoptosis in the context of lipid stress [98], regulating the rate of transcription of the macrophage inducible nitric oxide synthase (iNOS) gene [26], and promoting macrophage adhesion and spreading in response to the engagement of the class A scavenger receptor [99]. Development of the monocyte/macrophage-selective conditional iPLA2β-knockout mice described here may prove to be useful in further characterizing these aspects of monocyte/macrophage biology in models of diabetes, atherosclerosis, and other pathophysiologic states.
In addition, preparation of the mouse line with floxed-iPLA2β genes described here may prove to be useful in the development of conditional knockout mouse lines with selective deletion of iPLA2β in other cell lines that might participate in the development of T2DM, including skeletal muscle cells, adipocytes, and hepatocytes. All of these cell types are involved in glucose homeostasis in T2D, and all express iPLA2β [83,84,100,101], which is involved in regulating fatty acid oxidation in skeletal muscle [100], differentiation of adipoctyes [101], and hepatic lipid synthesis [83,84]. Conditional knockouts in skeletal muscle can be prepared from our iPLA2β-floxed mice with mice that express Cre under the control of the promoter for muscle creatine kinase (MCK) [102], conditional knockouts in adipocytes can be prepared with our floxed mice and mice that express Cre under control of the promoter for adipocyte-specific fatty acid binding protein (aP2) [103]. Conditional knockouts in hepatocytes can be prepared with our floxed mice and mice that express Cre under control of the promoter for rat albumin [54]. Such lines would permit further characterization of the mechanism of resistance of the global iPLA2β knockout to HFD-induced deterioration in insulin sensitivity [24].

5. Conclusions

Cre-lox technology was used to produce mice with selective iPLA2β deficiency in cells of myelomonocytic lineage, including macrophages (MØ-iPLA2β-KO), or in insulin-secreting β-cells (β-Cell-iPLA2β-KO), respectively. MØ-iPLA2β-KO mice exhibited normal glucose tolerance when fed standard chow and better glucose tolerance than floxed-iPLA2β control mice after consuming a high-fat diet (HFD). MØ-iPLA2β-KO mice exhibited normal GSIS in vivo and from isolated islets ex vivo compared to floxed-iPLA2β controls. Male MØ-iPLA2β-KO mice exhibited enhanced insulin responsivity vs. controls after a prolonged HFD. β-Cell-iPLA2β-KO mice exhibited impaired glucose tolerance when fed standard chow, and glucose tolerance deteriorated further after introduced to a HFD. β-Cell-iPLA2β-KO mice exhibited impaired GSIS in vivo and from isolated islets ex vivo vs. controls, and male β-cell-iPLA2β-KO mice also exhibited enhanced insulin responsivity compared to controls after of introduction of the HFD. These findings suggest that MØ iPLA2β participates in HFD-induced deterioration in glucose tolerance, and that this mainly reflects an effect on insulin responsivity rather than on insulin secretion. In contrast, β-cell iPLA2β plays a role in GSIS and also appears to confer some protection against deterioration in β-cell function induced by a HFD.

Supplementary Materials

The following are available online at https://www.mdpi.com/2218-273X/10/10/1455/s1, Figure S1: In Vivo Insulin Secretion For iPLA2β Conditional Knockout and Floxed-iPLA2β Control Mice Fed a Regular or High-Fat Diet, Figure S2: Insulin Tolerance Tests of 6-month-old Female Conditional iPLA2β-Knockout Mice and Floxed-iPLA2β Controls Fed a Regular or High-Fat Diet (HFD), Figure S3: Insulin Tolerance Tests of 6-month-old Male Conditional iPLA2β-Knockout Mice and Floxed-iPLA2β Controls Fed a Regular or High-Fat Diet (HFD). Table S1: Glucose Tolerance Tests for Female and Male Mice Aged 3 or 6 months with Genotypes Floxed-iPLA2β, β-Cell-iPLA2β-KO, or MØ-iPLA2β-KO Fed a Regular or High-Fat Diet.

Author Contributions

Conceptualization, J.T., H.S. and S.R.; methodology, H.S., M.W. and X.L.; software, H.S.; validation, H.S., M.W. and X.L.; formal analysis, J.T., H.S. and S.R.; investigation, H.S. and M.W.; resources, J.T. and S.R.; data curation, M.W., H.S., C.F., and J.T.; writing—original draft preparation, J.T.; writing—review and editing, S.R.; visualization, J.T., C.F., and S.R.; supervision, J.T. and S.R.; project administration, J.T. and S.R.; funding acquisition, J.T. and S.R. All authors have read and agreed to the published version of the manuscript.

Funding

These studies were supported in part by United States Public Health Service Grants R37-DK34388, P60-DK20579, P30 DK020579, P30 DK056341, P41 RR000954, R24GM136766, P41GM103422, DK110292, R21 AI 146743, and a grant from the Dean’s fund from the Washington University School of Medicine.

Acknowledgments

The intellectual input from Zhongmin Ma and Shunzhong Bao in discussions of these data is gratefully acknowledged, as is the technical assistance of Alan Bohrer and Min Tan.

Conflicts of Interest

The authors declare no conflict of interest.

References

  1. Mouchlis, V.D.; Dennis, E.A. Phospholipase A2 catalysis and lipid mediator lipidomics. Biochim. Biophys. Acta Mol. Cell Biol. Lipids 2019, 1864, 766–771. [Google Scholar] [CrossRef] [PubMed]
  2. Turk, J.; White, T.D.; Nelson, A.J.; Lei, X.; Ramanadham, S. iPLA2beta and its role in male fertility, neurological disorders, metabolic disorders, and inflammation. Biochim. Biophys. Acta Mol. Cell Biol. Lipids 2019, 1864, 846–860. [Google Scholar] [CrossRef] [PubMed]
  3. Balboa, M.A.; Balsinde, J.; Jones, S.S.; Dennis, E.A. Identity between the Ca2+-independent phospholipase A2 enzymes from P388D1 macrophages and Chinese hamster ovary cells. J. Biol. Chem. 1997, 272, 8576–8580. [Google Scholar] [CrossRef] [PubMed] [Green Version]
  4. Ma, Z.; Ramanadham, S.; Kempe, K.; Chi, X.S.; Ladenson, J.; Turk, J. Pancreatic islets express a Ca2+-independent phospholipase A2 enzyme that contains a repeated structural motif homologous to the integral membrane protein binding domain of ankyrin. J. Biol. Chem. 1997, 272, 11118–11127. [Google Scholar] [CrossRef] [Green Version]
  5. Tang, J.; Kriz, R.W.; Wolfman, N.; Shaffer, M.; Seehra, J.; Jones, S.S. A novel cytosolic calcium-independent phospholipase A2 contains eight ankyrin motifs. J. Biol. Chem. 1997, 272, 8567–8575. [Google Scholar] [CrossRef] [PubMed] [Green Version]
  6. Jenkins, C.M.; Mancuso, D.J.; Yan, W.; Sims, H.F.; Gibson, B.; Gross, R.W. Identification, cloning, expression, and purification of three novel human calcium-independent phospholipase A2 family members possessing triacylglycerol lipase and acylglycerol transacylase activities. J. Biol. Chem. 2004, 279, 48968–48975. [Google Scholar] [CrossRef] [PubMed] [Green Version]
  7. Mancuso, D.J.; Jenkins, C.M.; Gross, R.W. The genomic organization, complete mRNA sequence, cloning, and expression of a novel human intracellular membrane-associated calcium-independent phospholipase A2. J. Biol. Chem. 2000, 275, 9937–9945. [Google Scholar] [CrossRef] [PubMed] [Green Version]
  8. Rydel, T.J.; Williams, J.M.; Krieger, E.; Moshiri, F.; Stallings, W.C.; Brown, S.M.; Pershing, J.C.; Purcell, J.P.; Alibhai, M.F. The crystal structure, mutagenesis, and activity studies reveal that patatin is a lipid acyl hydrolase with a Ser-Asp catalytic dyad. Biochemistry 2003, 42, 6696–6708. [Google Scholar] [CrossRef]
  9. Wilson, P.A.; Gardner, S.D.; Lambie, N.M.; Commans, S.A.; Crowther, D.J. Characterization of the human patatin-like phospholipase family. J. Lipid Res. 2006, 47, 1940–1949. [Google Scholar] [CrossRef] [Green Version]
  10. Kienesberger, P.C.; Oberer, M.; Lass, A.; Zechner, R. Mammalian patatin domain containing proteins: A family with diverse lipolytic activities involved in multiple biological functions. J. Lipid Res. 2009, 50, S63–68. [Google Scholar] [CrossRef] [Green Version]
  11. Bao, S.; Miller, D.J.; Ma, Z.; Wohltmann, M.; Eng, G.; Ramanadham, S.; Moley, K.; Turk, J. Male mice that do not express group VIA phospholipase A2 produce spermatozoa with impaired motility and have greatly reduced fertility. J. Biol. Chem. 2004, 279, 38194–38200. [Google Scholar] [CrossRef] [Green Version]
  12. Malik, I.; Turk, J.; Mancuso, D.J.; Montier, L.; Wohltmann, M.; Wozniak, D.F.; Schmidt, R.E.; Gross, R.W.; Kotzbauer, P.T. Disrupted membrane homeostasis and accumulation of ubiquitinated proteins in a mouse model of infantile neuroaxonal dystrophy caused by PLA2G6 mutations. Am. J. Pathol. 2008, 172, 406–416. [Google Scholar] [CrossRef] [PubMed] [Green Version]
  13. Khateeb, S.; Flusser, H.; Ofir, R.; Shelef, I.; Narkis, G.; Vardi, G.; Shorer, Z.; Levy, R.; Galil, A.; Elbedour, K.; et al. PLA2G6 mutation underlies infantile neuroaxonal dystrophy. Am. J. Hum. Genet. 2006, 79, 942–948. [Google Scholar] [CrossRef] [Green Version]
  14. Morgan, N.V.; Westaway, S.K.; Morton, J.E.; Gregory, A.; Gissen, P.; Sonek, S.; Cangul, H.; Coryell, J.; Canham, N.; Nardocci, N.; et al. PLA2G6, encoding a phospholipase A2, is mutated in neurodegenerative disorders with high brain iron. Nat. Genet. 2006, 38, 752–754. [Google Scholar] [CrossRef] [PubMed] [Green Version]
  15. Bao, S.; Bohrer, A.; Ramanadham, S.; Jin, W.; Zhang, S.; Turk, J. Effects of stable suppression of Group VIA phospholipase A2 expression on phospholipid content and composition, insulin secretion, and proliferation of INS-1 insulinoma cells. J. Biol. Chem. 2006, 281, 187–198. [Google Scholar] [CrossRef] [Green Version]
  16. Gross, R.W.; Ramanadham, S.; Kruszka, K.K.; Han, X.; Turk, J. Rat and human pancreatic islet cells contain a calcium ion independent phospholipase A2 activity selective for hydrolysis of arachidonate which is stimulated by adenosine triphosphate and is specifically localized to islet beta-cells. Biochemistry 1993, 32, 327–336. [Google Scholar] [CrossRef]
  17. Ma, Z.; Ramanadham, S.; Wohltmann, M.; Bohrer, A.; Hsu, F.F.; Turk, J. Studies of insulin secretory responses and of arachidonic acid incorporation into phospholipids of stably transfected insulinoma cells that overexpress group VIA phospholipase A2 (iPLA2b) indicate a signaling rather than a housekeeping role for iPLA2b. J. Biol. Chem. 2001, 276, 13198–13208. [Google Scholar] [CrossRef] [Green Version]
  18. Ma, Z.; Zhang, S.; Turk, J.; Ramanadham, S. Stimulation of insulin secretion and associated nuclear accumulation of iPLA2beta in INS-1 insulinoma cells. Am. J. Physiol. Endocrinol. Metab. 2002, 282, E820–833. [Google Scholar] [CrossRef] [PubMed] [Green Version]
  19. Ramanadham, S.; Gross, R.W.; Han, X.; Turk, J. Inhibition of arachidonate release by secretagogue-stimulated pancreatic islets suppresses both insulin secretion and the rise in beta-cell cytosolic calcium ion concentration. Biochemistry 1993, 32, 337–346. [Google Scholar] [CrossRef] [PubMed]
  20. Ramanadham, S.; Hsu, F.F.; Bohrer, A.; Ma, Z.; Turk, J. Studies of the role of group VI phospholipase A2 in fatty acid incorporation, phospholipid remodeling, lysophosphatidylcholine generation, and secretagogue-induced arachidonic acid release in pancreatic islets and insulinoma cells. J. Biol. Chem. 1999, 274, 13915–13927. [Google Scholar] [CrossRef] [Green Version]
  21. Ramanadham, S.; Song, H.; Hsu, F.F.; Zhang, S.; Crankshaw, M.; Grant, G.A.; Newgard, C.B.; Bao, S.; Ma, Z.; Turk, J. Pancreatic islets and insulinoma cells express a novel isoform of group VIA phospholipase A2 (iPLA2b) that participates in glucose-stimulated insulin secretion and is not produced by alternate splicing of the iPLA2b transcript. Biochemistry 2003, 42, 13929–13940. [Google Scholar] [CrossRef] [Green Version]
  22. Ramanadham, S.; Wolf, M.J.; Jett, P.A.; Gross, R.W.; Turk, J. Characterization of an ATP-stimulatable Ca2+-independent phospholipase A2 from clonal insulin-secreting HIT cells and rat pancreatic islets: A possible molecular component of the beta-cell fuel sensor. Biochemistry 1994, 33, 7442–7452. [Google Scholar] [CrossRef] [PubMed]
  23. Bao, S.; Jacobson, D.A.; Wohltmann, M.; Bohrer, A.; Jin, W.; Philipson, L.H.; Turk, J. Glucose homeostasis, insulin secretion, and islet phospholipids in mice that overexpress iPLA2b in pancreatic b-cells and in iPLA2b-null mice. Am. J. Physiol. Endocrinol. Metab. 2008, 294, 217–229. [Google Scholar] [CrossRef] [PubMed] [Green Version]
  24. Bao, S.; Song, H.; Wohltmann, M.; Ramanadham, S.; Jin, W.; Bohrer, A.; Turk, J. Insulin secretory responses and phospholipid composition of pancreatic islets from mice that do not express Group VIA phospholipase A2 and effects of metabolic stress on glucose homeostasis. J. Biol. Chem. 2006, 281, 20958–20973. [Google Scholar] [CrossRef] [Green Version]
  25. Song, H.; Wohltmann, M.; Tan, M.; Ladenson, J.H.; Turk, J. Group VIA phospholipase A2 mitigates palmitate-induced beta-cell mitochondrial injury and apoptosis. J. Biol. Chem. 2014, 289, 14194–14210. [Google Scholar] [CrossRef] [Green Version]
  26. Gil-de-Gomez, L.; Astudillo, A.M.; Guijas, C.; Magrioti, V.; Kokotos, G.; Balboa, M.A.; Balsinde, J. Cytosolic group IVA and calcium-independent group VIA phospholipase A2s act on distinct phospholipid pools in zymosan-stimulated mouse peritoneal macrophages. J. Immunol. 2014, 192, 752–762. [Google Scholar] [CrossRef] [Green Version]
  27. Moran, J.M.; Buller, R.M.; McHowat, J.; Turk, J.; Wohltmann, M.; Gross, R.W.; Corbett, J.A. Genetic and pharmacologic evidence that calcium-independent phospholipase A2beta regulates virus-induced inducible nitric-oxide synthase expression by macrophages. J. Biol. Chem. 2005, 280, 28162–28168. [Google Scholar] [CrossRef] [PubMed] [Green Version]
  28. Perez, R.; Balboa, M.A.; Balsinde, J. Involvement of group VIA calcium-independent phospholipase A2 in macrophage engulfment of hydrogen peroxide-treated U937 cells. J. Immunol. 2006, 176, 2555–2561. [Google Scholar] [CrossRef] [PubMed] [Green Version]
  29. Tan, C.; Day, R.; Bao, S.; Turk, J.; Zhao, Q.D. Group VIA phospholipase A2 mediates enhanced macrophage migration in diabetes mellitus by increasing expression of nicotinamide adenine dinucleotide phosphate oxidase 4. Arter. Thromb. Vasc. Biol. 2014, 34, 768–778. [Google Scholar] [CrossRef] [Green Version]
  30. Ashley, J.W.; Hancock, W.D.; Nelson, A.J.; Bone, R.N.; Tse, H.M.; Wohltmann, M.; Turk, J.; Ramanadham, S. Polarization of Macrophages toward M2 Phenotype Is Favored by Reduction in iPLA2b (Group VIA Phospholipase A2). J. Biol. Chem. 2016, 291, 23268–23281. [Google Scholar] [CrossRef] [Green Version]
  31. Kamei, N.; Tobe, K.; Suzuki, R.; Ohsugi, M.; Watanabe, T.; Kubota, N.; Ohtsuka-Kowatari, N.; Kumagai, K.; Sakamoto, K.; Kobayashi, M.; et al. Overexpression of monocyte chemoattractant protein-1 in adipose tissues causes macrophage recruitment and insulin resistance. J. Biol. Chem. 2006, 281, 26602–26614. [Google Scholar] [CrossRef] [Green Version]
  32. Kanda, H.; Tateya, S.; Tamori, Y.; Kotani, K.; Hiasa, K.; Kitazawa, R.; Kitazawa, S.; Miyachi, H.; Maeda, S.; Egashira, K.; et al. MCP-1 contributes to macrophage infiltration into adipose tissue, insulin resistance, and hepatic steatosis in obesity. J. Clin. Investig. 2006, 116, 1494–1505. [Google Scholar] [CrossRef]
  33. Sartipy, P.; Loskutoff, D.J. Monocyte chemoattractant protein 1 in obesity and insulin resistance. Proc. Natl. Acad. Sci. USA 2003, 100, 7265–7270. [Google Scholar] [CrossRef] [PubMed] [Green Version]
  34. Weisberg, S.P.; Hunter, D.; Huber, R.; Lemieux, J.; Slaymaker, S.; Vaddi, K.; Charo, I.; Leibel, R.L.; Ferrante, A.W., Jr. CCR2 modulates inflammatory and metabolic effects of high-fat feeding. J. Clin. Investig. 2006, 116, 115–124. [Google Scholar] [CrossRef] [PubMed] [Green Version]
  35. Weisberg, S.P.; McCann, D.; Desai, M.; Rosenbaum, M.; Leibel, R.L.; Ferrante, A.W., Jr. Obesity is associated with macrophage accumulation in adipose tissue. J. Clin. Investig. 2003, 112, 1796–1808. [Google Scholar] [CrossRef]
  36. Lumeng, C.N.; Bodzin, J.L.; Saltiel, A.R. Obesity induces a phenotypic switch in adipose tissue macrophage polarization. J. Clin. Investig. 2007, 117, 175–184. [Google Scholar] [CrossRef] [Green Version]
  37. Carnevale, K.A.; Cathcart, M.K. Calcium-independent phospholipase A2 is required for human monocyte chemotaxis to monocyte chemoattractant protein 1. J. Immunol. 2001, 167, 3414–3421. [Google Scholar] [CrossRef] [PubMed] [Green Version]
  38. Cathcart, M.K. Signal-activated phospholipase regulation of leukocyte chemotaxis. J. Lipid Res. 2009, 50, 231–236. [Google Scholar] [CrossRef] [Green Version]
  39. Mishra, R.S.; Carnevale, K.A.; Cathcart, M.K. iPLA2b: Front and center in human monocyte chemotaxis to MCP-1. J. Exp. Med. 2008, 205, 347–359. [Google Scholar] [CrossRef] [PubMed] [Green Version]
  40. DeChiara, T.M. Gene targeting in ES cells. Methods Mol. Biol. 2001, 158, 19–45. [Google Scholar] [CrossRef]
  41. Kuhn, R.; Torres, R.M. Cre/loxP recombination system and gene targeting. Methods Mol. Biol. 2002, 180, 175–204. [Google Scholar] [CrossRef] [PubMed]
  42. Nagy, A. Cre recombinase: The universal reagent for genome tailoring. Genesis 2000, 26, 99–109. [Google Scholar] [CrossRef]
  43. Takeuchi, T.; Nomura, T.; Tsujita, M.; Suzuki, M.; Fuse, T.; Mori, H.; Mishina, M. Flp recombinase transgenic mice of C57BL/6 strain for conditional gene targeting. Biochem. Biophys Res. Commun. 2002, 293, 953–957. [Google Scholar] [CrossRef]
  44. Turan, S.; Galla, M.; Ernst, E.; Qiao, J.; Voelkel, C.; Schiedlmeier, B.; Zehe, C.; Bode, J. Recombinase-mediated cassette exchange (RMCE): Traditional concepts and current challenges. J. Mol. Biol. 2011, 407, 193–221. [Google Scholar] [CrossRef] [PubMed]
  45. Friedel, R.H.; Wurst, W.; Wefers, B.; Kuhn, R. Generating conditional knockout mice. Methods Mol. Biol. 2011, 693, 205–231. [Google Scholar] [CrossRef]
  46. Fex, M.; Wierup, N.; Nitert, M.D.; Ristow, M.; Mulder, H. Rat insulin promoter 2-Cre recombinase mice bred onto a pure C57BL/6J background exhibit unaltered glucose tolerance. J. Endocrinol. 2007, 194, 551–555. [Google Scholar] [CrossRef] [Green Version]
  47. Gannon, M.; Shiota, C.; Postic, C.; Wright, C.V.; Magnuson, M. Analysis of the Cre-mediated recombination driven by rat insulin promoter in embryonic and adult mouse pancreas. Genesis 2000, 26, 139–142. [Google Scholar] [CrossRef]
  48. Kalis, M.; Bolmeson, C.; Esguerra, J.L.; Gupta, S.; Edlund, A.; Tormo-Badia, N.; Speidel, D.; Holmberg, D.; Mayans, S.; Khoo, N.K.; et al. Beta-cell specific deletion of Dicer1 leads to defective insulin secretion and diabetes mellitus. PLoS ONE 2011, 6, e29166. [Google Scholar] [CrossRef] [Green Version]
  49. Pappan, K.L.; Pan, Z.; Kwon, G.; Marshall, C.A.; Coleman, T.; Goldberg, I.J.; McDaniel, M.L.; Semenkovich, C.F. Pancreatic beta-cell lipoprotein lipase independently regulates islet glucose metabolism and normal insulin secretion. J. Biol. Chem. 2005, 280, 9023–9029. [Google Scholar] [CrossRef] [Green Version]
  50. Sun, G.; Tarasov, A.I.; McGinty, J.A.; French, P.M.; McDonald, A.; Leclerc, I.; Rutter, G.A. LKB1 deletion with the RIP2.Cre transgene modifies pancreatic beta-cell morphology and enhances insulin secretion in vivo. Am. J. Physiol. Endocrinol. Metab. 2010, 298, 1261–1273. [Google Scholar] [CrossRef] [Green Version]
  51. Clausen, B.E.; Burkhardt, C.; Reith, W.; Renkawitz, R.; Forster, I. Conditional gene targeting in macrophages and granulocytes using LysMcre mice. Transgenic Res. 1999, 8, 265–277. [Google Scholar] [CrossRef] [PubMed]
  52. Schneider, J.G.; Yang, Z.; Chakravarthy, M.V.; Lodhi, I.J.; Wei, X.; Turk, J.; Semenkovich, C.F. Macrophage fatty-acid synthase deficiency decreases diet-induced atherosclerosis. J. Biol. Chem. 2010, 285, 23398–23409. [Google Scholar] [CrossRef] [PubMed] [Green Version]
  53. Lee, J.Y.; Ristow, M.; Lin, X.; White, M.F.; Magnuson, M.A.; Hennighausen, L. RIP-Cre revisited, evidence for impairments of pancreatic beta-cell function. J. Biol. Chem. 2006, 281, 2649–2653. [Google Scholar] [CrossRef] [Green Version]
  54. Chakravarthy, M.V.; Pan, Z.; Zhu, Y.; Tordjman, K.; Schneider, J.G.; Coleman, T.; Turk, J.; Semenkovich, C.F. “New” hepatic fat activates PPARalpha to maintain glucose, lipid, and cholesterol homeostasis. Cell Metab. 2005, 1, 309–322. [Google Scholar] [CrossRef] [PubMed] [Green Version]
  55. Cheverud, J.M.; Ehrich, T.H.; Hrbek, T.; Kenney, J.P.; Pletscher, L.S.; Semenkovich, C.F. Quantitative trait loci for obesity- and diabetes-related traits and their dietary responses to high-fat feeding in LGXSM recombinant inbred mouse strains. Diabetes 2004, 53, 3328–3336. [Google Scholar] [CrossRef] [PubMed] [Green Version]
  56. Bernal-Mizrachi, E.; Fatrai, S.; Johnson, J.D.; Ohsugi, M.; Otani, K.; Han, Z.; Polonsky, K.S.; Permutt, M.A. Defective insulin secretion and increased susceptibility to experimental diabetes are induced by reduced Akt activity in pancreatic islet beta cells. J. Clin. Investig. 2004, 114, 928–936. [Google Scholar] [CrossRef] [PubMed] [Green Version]
  57. Song, H.; Wohltmann, M.; Bao, S.; Ladenson, J.H.; Semenkovich, C.F.; Turk, J. Mice deficient in group VIB phospholipase A2 (iPLA2g) exhibit relative resistance to obesity and metabolic abnormalities induced by a Western diet. Am. J. Physiol. Endocrinol. Metab. 2010, 298, 1097–1114. [Google Scholar] [CrossRef] [Green Version]
  58. Sakaguchi, K.; Takeda, K.; Maeda, M.; Ogawa, W.; Sato, T.; Okada, S.; Ohnishi, Y.; Nakajima, H.; Kashiwagi, A. Glucose area under the curve during oral glucose tolerance test as an index of glucose intolerance. Diabetol. Int. 2016, 7, 53–58. [Google Scholar] [CrossRef] [PubMed]
  59. McDaniel, M.L.; Colca, J.R.; Kotagal, N.; Lacy, P.E. A subcellular fractionation approach for studying insulin release mechanisms and calcium metabolism in islets of Langerhans. Methods Enzymol. 1983, 98, 182–200. [Google Scholar] [CrossRef]
  60. Schwartz, M.W.; Guyenet, S.J.; Cirulli, V. The hypothalamus and ss-cell connection in the gene-targeting era. Diabetes 2010, 59, 2991–2993. [Google Scholar] [CrossRef] [Green Version]
  61. Wu, X.; Zhang, Q.; Wang, X.; Zhu, J.; Xu, K.; Okada, H.; Wang, R.; Woo, M. Survivin is required for beta-cell mass expansion in the pancreatic duct-ligated mouse model. PLoS ONE 2012, 7, e41976. [Google Scholar] [CrossRef] [PubMed]
  62. Quan, W.; Lim, Y.M.; Lee, M.S. Role of autophagy in diabetes and endoplasmic reticulum stress of pancreatic beta-cells. Exp. Mol. Med. 2012, 44, 81–88. [Google Scholar] [CrossRef] [PubMed] [Green Version]
  63. Choi, D.; Cai, E.P.; Schroer, S.A.; Wang, L.; Woo, M. Vhl is required for normal pancreatic beta cell function and the maintenance of beta cell mass with age in mice. Lab. Investig. 2011, 91, 527–538. [Google Scholar] [CrossRef] [Green Version]
  64. Cui, J.; Wang, Z.; Cheng, Q.; Lin, R.; Zhang, X.M.; Leung, P.S.; Copeland, N.G.; Jenkins, N.A.; Yao, K.M.; Huang, J.D. Targeted inactivation of kinesin-1 in pancreatic beta-cells in vivo leads to insulin secretory deficiency. Diabetes 2011, 60, 320–330. [Google Scholar] [CrossRef] [PubMed] [Green Version]
  65. Wang, L.; Liu, Y.; Lu, S.Y.; Nguyen, K.T.; Schroer, S.A.; Suzuki, A.; Mak, T.W.; Gaisano, H.; Woo, M. Deletion of Pten in pancreatic ss-cells protects against deficient ss-cell mass and function in mouse models of type 2 diabetes. Diabetes 2010, 59, 3117–3126. [Google Scholar] [CrossRef] [PubMed] [Green Version]
  66. Srinivasan, M.; Choi, C.S.; Ghoshal, P.; Pliss, L.; Pandya, J.D.; Hill, D.; Cline, G.; Patel, M.S. β-Cell-specific pyruvate dehydrogenase deficiency impairs glucose-stimulated insulin secretion. Am. J. Physiol. Endocrinol. Metab. 2010, 299, 910–917. [Google Scholar] [CrossRef] [PubMed] [Green Version]
  67. Tokumoto, S.; Yabe, D.; Tatsuoka, H.; Usui, R.; Fauzi, M.; Botagarova, A.; Goto, H.; Herrera, P.L.; Ogura, M.; Inagaki, N. Generation and characterization of a novel mouse model that allows spatiotemporal quantification of pancreatic beta-cell proliferation. Diabetes 2020. [Google Scholar] [CrossRef] [PubMed]
  68. Wong, C.; Tang, L.H.; Davidson, C.; Vosburgh, E.; Chen, W.; Foran, D.J.; Notterman, D.A.; Levine, A.J.; Xu, E.Y. Two well-differentiated pancreatic neuroendocrine tumor mouse models. Cell Death Differ. 2020, 27, 269–283. [Google Scholar] [CrossRef] [Green Version]
  69. Tauscher, S.; Nakagawa, H.; Volker, K.; Werner, F.; Krebes, L.; Potapenko, T.; Doose, S.; Birkenfeld, A.L.; Baba, H.A.; Kuhn, M. beta Cell-specific deletion of guanylyl cyclase A, the receptor for atrial natriuretic peptide, accelerates obesity-induced glucose intolerance in mice. Cardiovasc. Diabetol. 2018, 17, 103. [Google Scholar] [CrossRef]
  70. Otten, J.J.; de Jager, S.C.; Kavelaars, A.; Seijkens, T.; Bot, I.; Wijnands, E.; Beckers, L.; Westra, M.M.; Bot, M.; Busch, M.; et al. Hematopoietic G-protein-coupled receptor kinase 2 deficiency decreases atherosclerotic lesion formation in LDL receptor-knockout mice. FASEB J. 2013, 27, 265–276. [Google Scholar] [CrossRef] [Green Version]
  71. Klose, A.; Zigrino, P.; Mauch, C. Monocyte/macrophage MMP-14 modulates cell infiltration and T-cell attraction in contact dermatitis but not in murine wound healing. Am. J. Pathol. 2013, 182, 755–764. [Google Scholar] [CrossRef]
  72. Pello, O.M.; Chevre, R.; Laoui, D.; De Juan, A.; Lolo, F.; Andres-Manzano, M.J.; Serrano, M.; Van Ginderachter, J.A.; Andres, V. In vivo inhibition of c-MYC in myeloid cells impairs tumor-associated macrophage maturation and pro-tumoral activities. PLoS ONE 2012, 7, e45399. [Google Scholar] [CrossRef]
  73. Luiz, J.P.M.; Toller-Kawahisa, J.E.; Viacava, P.R.; Nascimento, D.C.; Pereira, P.T.; Saraiva, A.L.; Prado, D.S.; LeBert, M.; Giurisato, E.; Tournier, C.; et al. MEK5/ERK5 signaling mediates IL-4-induced M2 macrophage differentiation through regulation of c-Myc expression. J. Leukoc. Biol. 2020. [Google Scholar] [CrossRef]
  74. Otto, N.A.; de Vos, A.F.; van Heijst, J.W.J.; Roelofs, J.; van der Poll, T. Myeloid Liver Kinase B1 depletion is associated with a reduction in alveolar macrophage numbers and an impaired host defense during gram-negative pneumonia. J. Infect. Dis. 2020. [Google Scholar] [CrossRef] [PubMed]
  75. McGarry, J.D. What if Minkowski had been ageusic? An alternative angle on diabetes. Science 1992, 258, 766–770. [Google Scholar] [CrossRef]
  76. Brown, M.S.; Goldstein, J.L. Selective versus total insulin resistance: A pathogenic paradox. Cell Metab. 2008, 7, 95–96. [Google Scholar] [CrossRef] [PubMed] [Green Version]
  77. Otero, Y.F.; Stafford, J.M.; McGuinness, O.P. Pathway-selective insulin resistance and metabolic disease: The importance of nutrient flux. J. Biol. Chem. 2014, 289, 20462–20469. [Google Scholar] [CrossRef] [PubMed] [Green Version]
  78. Chavez, J.A.; Summers, S.A. Lipid oversupply, selective insulin resistance, and lipotoxicity: Molecular mechanisms. Biochim. Biophys. Acta 2010, 1801, 252–265. [Google Scholar] [CrossRef] [PubMed] [Green Version]
  79. Chavez, J.A.; Siddique, M.M.; Wang, S.T.; Ching, J.; Shayman, J.A.; Summers, S.A. Ceramides and glucosylceramides are independent antagonists of insulin signaling. J. Biol. Chem. 2014, 289, 723–734. [Google Scholar] [CrossRef] [Green Version]
  80. Unger, R.H. Lipotoxicity in the pathogenesis of obesity-dependent NIDDM. Genetic and clinical implications. Diabetes 1995, 44, 863–870. [Google Scholar] [CrossRef]
  81. Miki, T.; Nagashima, K.; Tashiro, F.; Kotake, K.; Yoshitomi, H.; Tamamoto, A.; Gonoi, T.; Iwanaga, T.; Miyazaki, J.; Seino, S. Defective insulin secretion and enhanced insulin action in KATP channel-deficient mice. Proc. Natl. Acad. Sci. USA 1998, 95, 10402–10406. [Google Scholar] [CrossRef] [PubMed] [Green Version]
  82. Miki, T.; Minami, K.; Zhang, L.; Morita, M.; Gonoi, T.; Shiuchi, T.; Minokoshi, Y.; Renaud, J.M.; Seino, S. ATP-sensitive potassium channels participate in glucose uptake in skeletal muscle and adipose tissue. Am. J. Physiol. Endocrinol. Metab. 2002, 283, 1178–1184. [Google Scholar] [CrossRef] [PubMed] [Green Version]
  83. Deng, X.; Wang, J.; Jiao, L.; Utaipan, T.; Tuma-Kellner, S.; Schmitz, G.; Liebisch, G.; Stremmel, W.; Chamulitrat, W. iPLA2beta deficiency attenuates obesity and hepatic steatosis in ob/ob mice through hepatic fatty-acyl phospholipid remodeling. Biochim. Biophys. Acta 2016, 1861, 449–461. [Google Scholar] [CrossRef]
  84. Otto, A.C.; Gan-Schreier, H.; Zhu, X.; Tuma-Kellner, S.; Staffer, S.; Ganzha, A.; Liebisch, G.; Chamulitrat, W. Group VIA phospholipase A2 deficiency in mice chronically fed with high-fat-diet attenuates hepatic steatosis by correcting a defect of phospholipid remodeling. Biochim. Biophys. Acta Mol. Cell Biol. Lipids 2019, 1864, 662–676. [Google Scholar] [CrossRef] [PubMed]
  85. Lei, X.; Zhang, S.; Bohrer, A.; Bao, S.; Song, H.; Ramanadham, S. The group VIA calcium-independent phospholipase A2 participates in ER stress-induced INS-1 insulinoma cell apoptosis by promoting ceramide generation via hydrolysis of sphingomyelins by neutral sphingomyelinase. Biochemistry 2007, 46, 10170–10185. [Google Scholar] [CrossRef] [Green Version]
  86. Lei, X.; Zhang, S.; Bohrer, A.; Ramanadham, S. Calcium-independent phospholipase A2 (iPLA2b)-mediated ceramide generation plays a key role in the cross-talk between the endoplasmic reticulum (ER) and mitochondria during ER stress-induced insulin-secreting cell apoptosis. J. Biol. Chem. 2008, 283, 34819–34832. [Google Scholar] [CrossRef] [Green Version]
  87. Lei, X.; Zhang, S.; Barbour, S.E.; Bohrer, A.; Ford, E.L.; Koizumi, A.; Papa, F.R.; Ramanadham, S. Spontaneous development of endoplasmic reticulum stress that can lead to diabetes mellitus is associated with higher calcium-independent phospholipase A2 expression: A role for regulation by SREBP-1. J. Biol. Chem. 2010, 285, 6693–6705. [Google Scholar] [CrossRef] [Green Version]
  88. Lei, X.; Zhang, S.; Emani, B.; Barbour, S.E.; Ramanadham, S. A link between endoplasmic reticulum stress-induced beta-cell apoptosis and the group VIA Ca2+-independent phospholipase A2 (iPLA2b). Diabetes Obes. Metab. 2010, 12 (Suppl. 2), 93–98. [Google Scholar] [CrossRef] [Green Version]
  89. Li, H.; Zhao, Z.; Wei, G.; Yan, L.; Wang, D.; Zhang, H.; Sandusky, G.E.; Turk, J.; Xu, Y. Group VIA phospholipase A2 in both host and tumor cells is involved in ovarian cancer development. FASEB J. 2010, 24, 4103–4116. [Google Scholar] [CrossRef] [Green Version]
  90. Moon, S.H.; Jenkins, C.M.; Mancuso, D.J.; Turk, J.; Gross, R.W. Smooth muscle cell arachidonic acid release, migration, and proliferation are markedly attenuated in mice null for calcium-independent phospholipase A2beta. J. Biol. Chem. 2008, 283, 33975–33987. [Google Scholar] [CrossRef] [Green Version]
  91. Nelson, A.J.; Stephenson, D.J.; Cardona, C.L.; Lei, X.; Almutairi, A.; White, T.D.; Tusing, Y.G.; Park, M.A.; Barbour, S.E.; Chalfant, C.E.; et al. Macrophage polarization is linked to Ca2+-independent phospholipase A2beta-derived lipids and cross-cell signaling in mice. J. Lipid Res. 2020, 61, 143–158. [Google Scholar] [CrossRef] [PubMed]
  92. Bone, R.N.; Gai, Y.; Magrioti, V.; Kokotou, M.G.; Ali, T.; Lei, X.; Tse, H.M.; Kokotos, G.; Ramanadham, S. Inhibition of Ca2+-independent phospholipase A2beta (iPLA2b) ameliorates islet infiltration and incidence of diabetes in NOD mice. Diabetes 2015, 64, 541–554. [Google Scholar] [CrossRef] [Green Version]
  93. Nelson, A.J.; Stephenson, D.J.; Bone, R.N.; Cardona, C.L.; Park, M.A.; Tusing, Y.G.; Lei, X.; Kokotos, G.; Graves, C.L.; Mathews, C.E.; et al. Lipid mediators and biomarkers associated with type 1 diabetes development. JCI Insight 2020, 5, 138034. [Google Scholar] [CrossRef]
  94. Balsinde, J.; Balboa, M.A.; Dennis, E.A. Antisense inhibition of group VI Ca2+-independent phospholipase A2 blocks phospholipid fatty acid remodeling in murine P388D1 macrophages. J. Biol. Chem. 1997, 272, 29317–29321. [Google Scholar] [CrossRef] [Green Version]
  95. Balsinde, J.; Bianco, I.D.; Ackermann, E.J.; Conde-Frieboes, K.; Dennis, E.A. Inhibition of calcium-independent phospholipase A2 prevents arachidonic acid incorporation and phospholipid remodeling in P388D1 macrophages. Proc. Natl. Acad. Sci. USA 1995, 92, 8527–8531. [Google Scholar] [CrossRef] [Green Version]
  96. Monge, P.; Garrido, A.; Rubio, J.M.; Magrioti, V.; Kokotos, G.; Balboa, M.A.; Balsinde, J. The Contribution of Cytosolic Group IVA and Calcium-Independent Group VIA Phospholipase A2s to Adrenic Acid Mobilization in Murine Macrophages. Biomolecules 2020, 10, 542. [Google Scholar] [CrossRef] [Green Version]
  97. Balboa, M.A.; Perez, R.; Balsinde, J. Calcium-independent phospholipase A2 mediates proliferation of human promonocytic U937 cells. FEBS J. 2008, 275, 1915–1924. [Google Scholar] [CrossRef] [Green Version]
  98. Bao, S.; Li, Y.; Lei, X.; Wohltmann, M.; Jin, W.; Bohrer, A.; Semenkovich, C.F.; Ramanadham, S.; Tabas, I.; Turk, J. Attenuated free cholesterol loading-induced apoptosis but preserved phospholipid composition of peritoneal macrophages from mice that do not express group VIA phospholipase A2. J. Biol. Chem. 2007, 282, 27100–27114. [Google Scholar] [CrossRef] [PubMed] [Green Version]
  99. Nikolic, D.M.; Gong, M.C.; Turk, J.; Post, S.R. Class A scavenger receptor-mediated macrophage adhesion requires coupling of calcium-independent phospholipase A2 and 12/15-lipoxygenase to Rac and Cdc42 activation. J. Biol. Chem. 2007, 282, 33405–33411. [Google Scholar] [CrossRef] [Green Version]
  100. Carper, M.J.; Zhang, S.; Turk, J.; Ramanadham, S. Skeletal muscle group VIA phospholipase A2 (iPLA2b): Expression and role in fatty acid oxidation. Biochemistry 2008, 47, 12241–12249. [Google Scholar] [CrossRef] [PubMed] [Green Version]
  101. Su, X.; Mancuso, D.J.; Bickel, P.E.; Jenkins, C.M.; Gross, R.W. Small interfering RNA knockdown of calcium-independent phospholipases A2 beta or gamma inhibits the hormone-induced differentiation of 3T3-L1 preadipocytes. J. Biol. Chem. 2004, 279, 21740–21748. [Google Scholar] [CrossRef] [PubMed] [Green Version]
  102. Zisman, A.; Peroni, O.D.; Abel, E.D.; Michael, M.D.; Mauvais-Jarvis, F.; Lowell, B.B.; Wojtaszewski, J.F.; Hirshman, M.F.; Virkamaki, A.; Goodyear, L.J.; et al. Targeted disruption of the glucose transporter 4 selectively in muscle causes insulin resistance and glucose intolerance. Nat. Med. 2000, 6, 924–928. [Google Scholar] [CrossRef] [PubMed]
  103. Bluher, M.; Michael, M.D.; Peroni, O.D.; Ueki, K.; Carter, N.; Kahn, B.B.; Kahn, C.R. Adipose tissue selective insulin receptor knockout protects against obesity and obesity-related glucose intolerance. Dev. Cell 2002, 3, 25–38. [Google Scholar] [CrossRef] [Green Version]
Figure 1. Cre-Lox Preparation of Mutant Mice with Tissue-Restricted Deletion of iPLA2β. (A) is a schematic illustration of the structure of the gene-targeting construct that was incorporated by homologous recombination into mouse embryonic stem (ES) cells from European Conditional Mouse Mutagenesis (EUCOMM). (B) demonstrates correct integration of the 5′ and 3′ arms of the construct in the ES cell lines by long-range PCR using primer sets that recognize sequences external to the construct and within the neo cassette, respectively, to yield a 9.2 kb product. (C) illustrates that injection of the ES cells into blastocysts that were then implanted into pseudo-pregnant female mice resulted in production of chimeric mice with germline transmission of the targeted gene to yield heterozygotes for the wild-type (WT) and EUCOMM iPLA2β alleles. (D) illustrates that mating of these heterozygotes with FLP deleter mice resulted in removal of the region between F1 and F2 sites in the targeting construct that contained the neo cassette to yield an iPLA2β allele that contained Lox2 and Lox3 sites flanking iPLA2β exons 6–8 and that this allele is distinguishable from the WT allele upon PCR analyses. (E) is a Southern blot of gene fragments after Bam H1 endonuclease digestion and illustrates production of fragments characteristic of the WT and conditional alleles that establish the genotype of individual mice. WT and conditional iPLA2β heterozygotes were mated to yield conditional allele homozygotes, heterozygotes, and WT allele homozygotes in a 1:2:1 ratio. Those mice were then mated with mice that express Cre recombinase under control of LysM or RIP2 promoters to drive Cre expression selectively in macrophages or pancreatic islet β-cells, respectively. (F) illustrates that with conditional allele homozygotes these matings result in selective iPLA2β deletion in only the targeted cell line and not in other tissues. (G,H) illustrate that iPLA2β mRNA is not produced in the Cre-expressing cell type in mice that are iPLA2β conditional allele homozygotes but that iPLA2β mRNA is produced by non-targeted tissues.
Biomolecules 10 01455 g001
Figure 2. Glucose tolerance tests for iPLA2β conditional knockout mice and floxed-iPLA2β controls. D-glucose (2 mg/g body weight) was administered by intraperitoneal injection to female (A,B) or male (C,D) floxed-iPLA2β control mice (circles), MØ- iPLA2β-KO mice (A,C, squares), or β-cell-iPLA2β-KO mice (B,D, squares) 6 months of age that had been fed a regular diet (open symbols) or high-fat diet (HFD, closed symbols) after the age of 8 weeks, and blood was collected at baseline and at 30, 60, and 120 min after glucose administration to measure blood glucose concentration. Values are displayed as means ± SEM (n = 6 to 24, as specified by condition in Table S1). An asterisk (*) denotes p < 0.05 for comparisons between genotypes. The symbol x denotes p < 0.05 for the comparison between diets.
Biomolecules 10 01455 g002
Figure 3. Areas under the curve for glucose tolerance tests for iPLA2β conditional knockout mice and floxed-iPLA2β controls. Glucose tolerance tests (GTTs) were performed as in Figure 2 for male (M) or female (F) MØ-iPLA2β-KO mice (A), β-cell-iPLA2β-KO mice (B), or floxed-iPLA2β control mice 6 months of age that had been fed a regular (R) or high-fat (HF) diet, and the Areas Under the Curves (AUCs) were calculated from the measured glucose concentration values by the trapezoidal method of Sakaguchi et al. [58]. Values are displayed as means ± SEM (n = 6 to 24, as specified by condition in Table S1). An asterisk (*) denotes p < 0.05 for comparisons between genotypes.
Biomolecules 10 01455 g003
Figure 4. Insulin secretion by pancreatic islets isolated from iPLA2β conditional knockout mice and floxed-iPLA2β controls. Insulin secretion was stimulated by d-glucose and forskolin from pancreatic islets isolated from male (A,C,E) or female (B,D,F) MØ-iPLA2β-KO mice (A,B, solid bars), β-cell-iPLA2β-KO mice (C–F, solid bars), or floxed-iPLA2β control mice (AF, cross-hatched bars) 6 months of age that had been fed a RD (A–D) or a HFD (E,F). Incubations (30 islets per condition, 30 min, 37 °C) were performed in buffer containing 1, 11, or 20 mM d-glucose without or with 2.5 µM forskolin, and an aliquot of medium was then removed for measurement of insulin. Mean values ± SEM are displayed (n = 4, in triplicate). An asterisk (*) denotes p < 0.05 for the comparison between genotypes.
Biomolecules 10 01455 g004
Figure 5. In vivo insulin secretion for iPLA2β conditional knockout mice and floxed-iPLA2β control mice fed a regular (RD) or high-fat diet (HFD). After an overnight fast, baseline blood samples were obtained from the saphenous vein of male (A) or female (B) MØ-iPLA2β-KO mice, β-cell-iPLA2β-KO mice, or floxed-iPLA2β control mice 6 months of age that had been fed a regular diet (RD, A) or high-fat diet (HFD, B). d-glucose (3 mg/kg body weight) was administered by intraperitoneal injection, and a blood sample was obtained 30 min thereafter. The insulin contents of the baseline and 30 min samples were then measured by enzyme-linked immunosorbent assay, as described [23,24,57]. Displayed values represent mean ± SEM. An asterisk (*) denotes p < 0.05 for the comparison between the time 0 and 30 min values (n = 5 to 28).
Biomolecules 10 01455 g005
Figure 6. Insulin tolerance tests of 3- or 6-month-old male conditional iPLA2β-knockout mice and floxed-iPLA2β controls fed a regular or high-fat diet. Male floxed-iPLA2β control mice (circles), MØ-iPLA2β-KO mice (triangles), or β-cell-iPLA2β-KO mice (squares) mice were fed a regular diet after weaning until they were 6 weeks of age and were then fed a HFD until aged 3 months (A,C) or 6 months (B,D). Insulin tolerance tests were then performed in mice with free access to water and chow until human regular insulin (0.75 U/kg body weight; Lilly, Indianapolis, IN) was administered by intraperitoneal injection. Blood specimens were collected at 0, 30, 60, and 120 min thereafter for glucose concentration measurements, which were expressed as a percentage of the time zero blood glucose concentration, as described in [23,24,57]. Displayed values represent mean ± SEM (n = 13 to 16 (A), n = 15 to 18 (B), n = 22 to 26 (C), and n = 21 to 22 (D). An asterisk (*) denotes p < 0.05 for the comparison between genotypes.
Biomolecules 10 01455 g006
Publisher’s Note: MDPI stays neutral with regard to jurisdictional claims in published maps and institutional affiliations.

