Molecular Action of Hydroxytyrosol in Wound Healing: An In Vitro Evidence-Based Review

 ,
,  ,
, 
Abstract
1. Introduction
1.1. Wound Healing
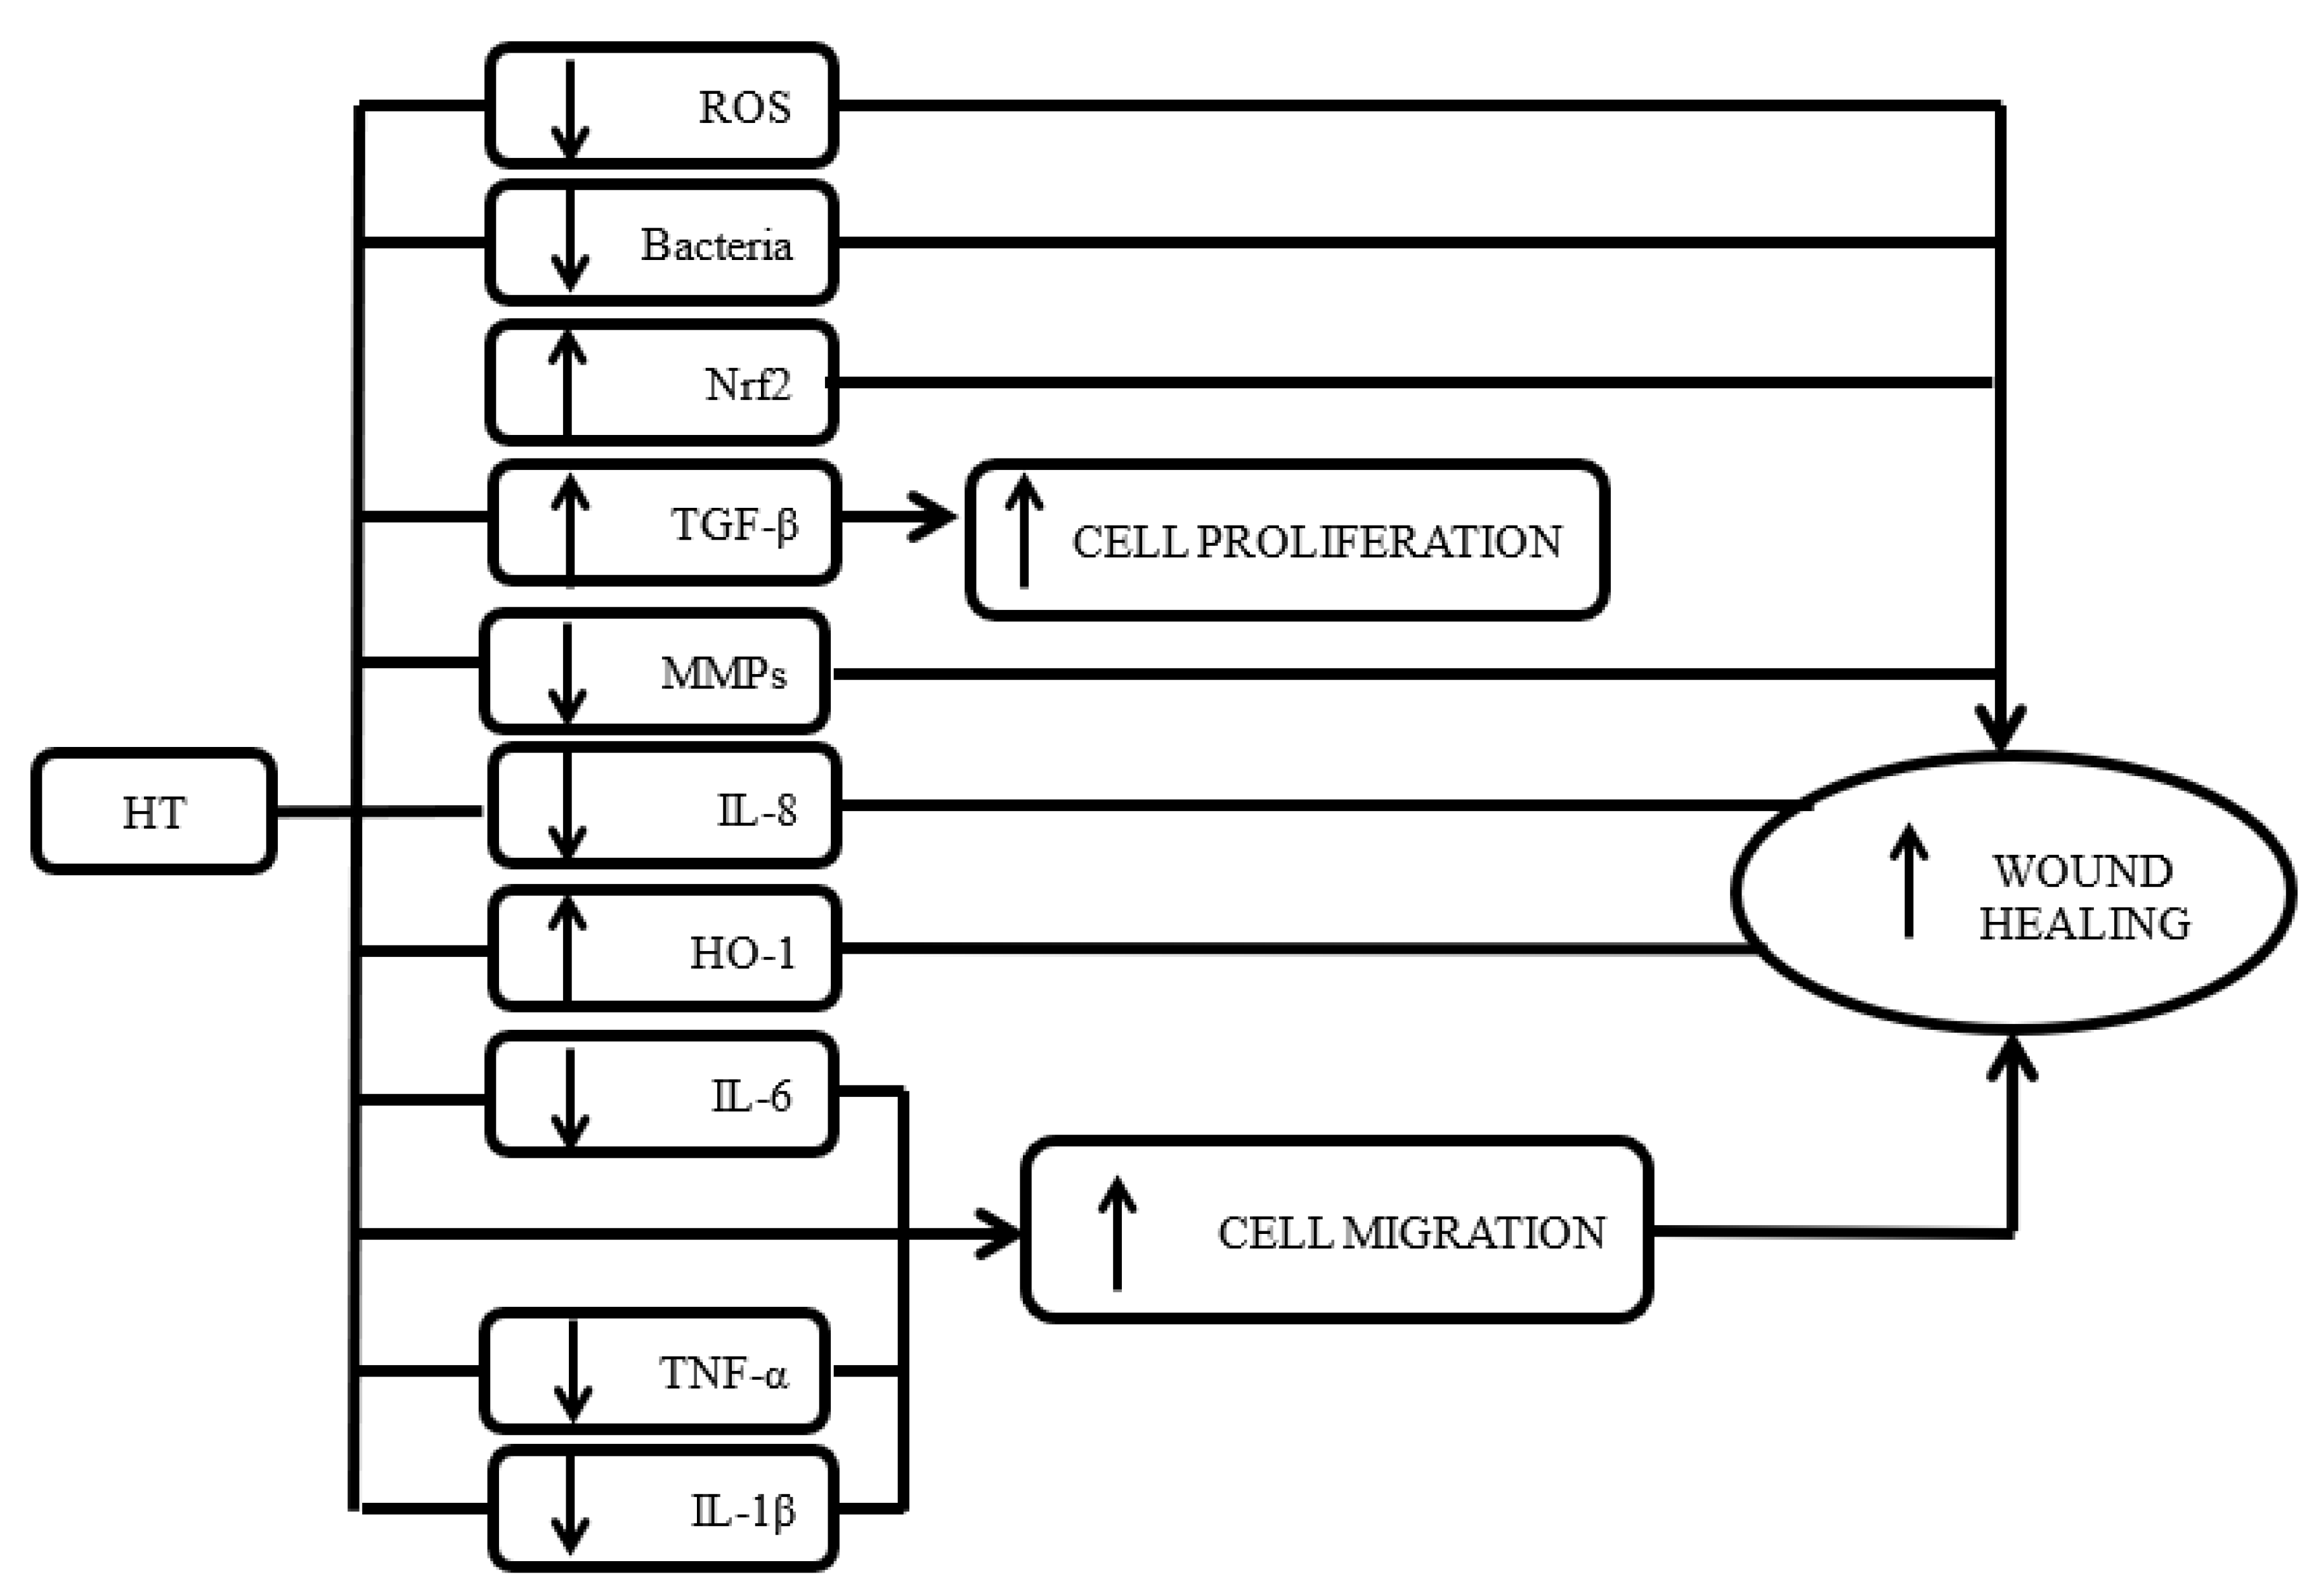
1.2. Molecular Mechanism of Wound Healing
1.2.1. Anti-inflammatory Activity
1.2.2. Antimicrobial Activity
1.2.3. Antioxidant Activity
1.2.4. Cellular Events
1.3. Hydroxytyrosol
2. Materials and Methods
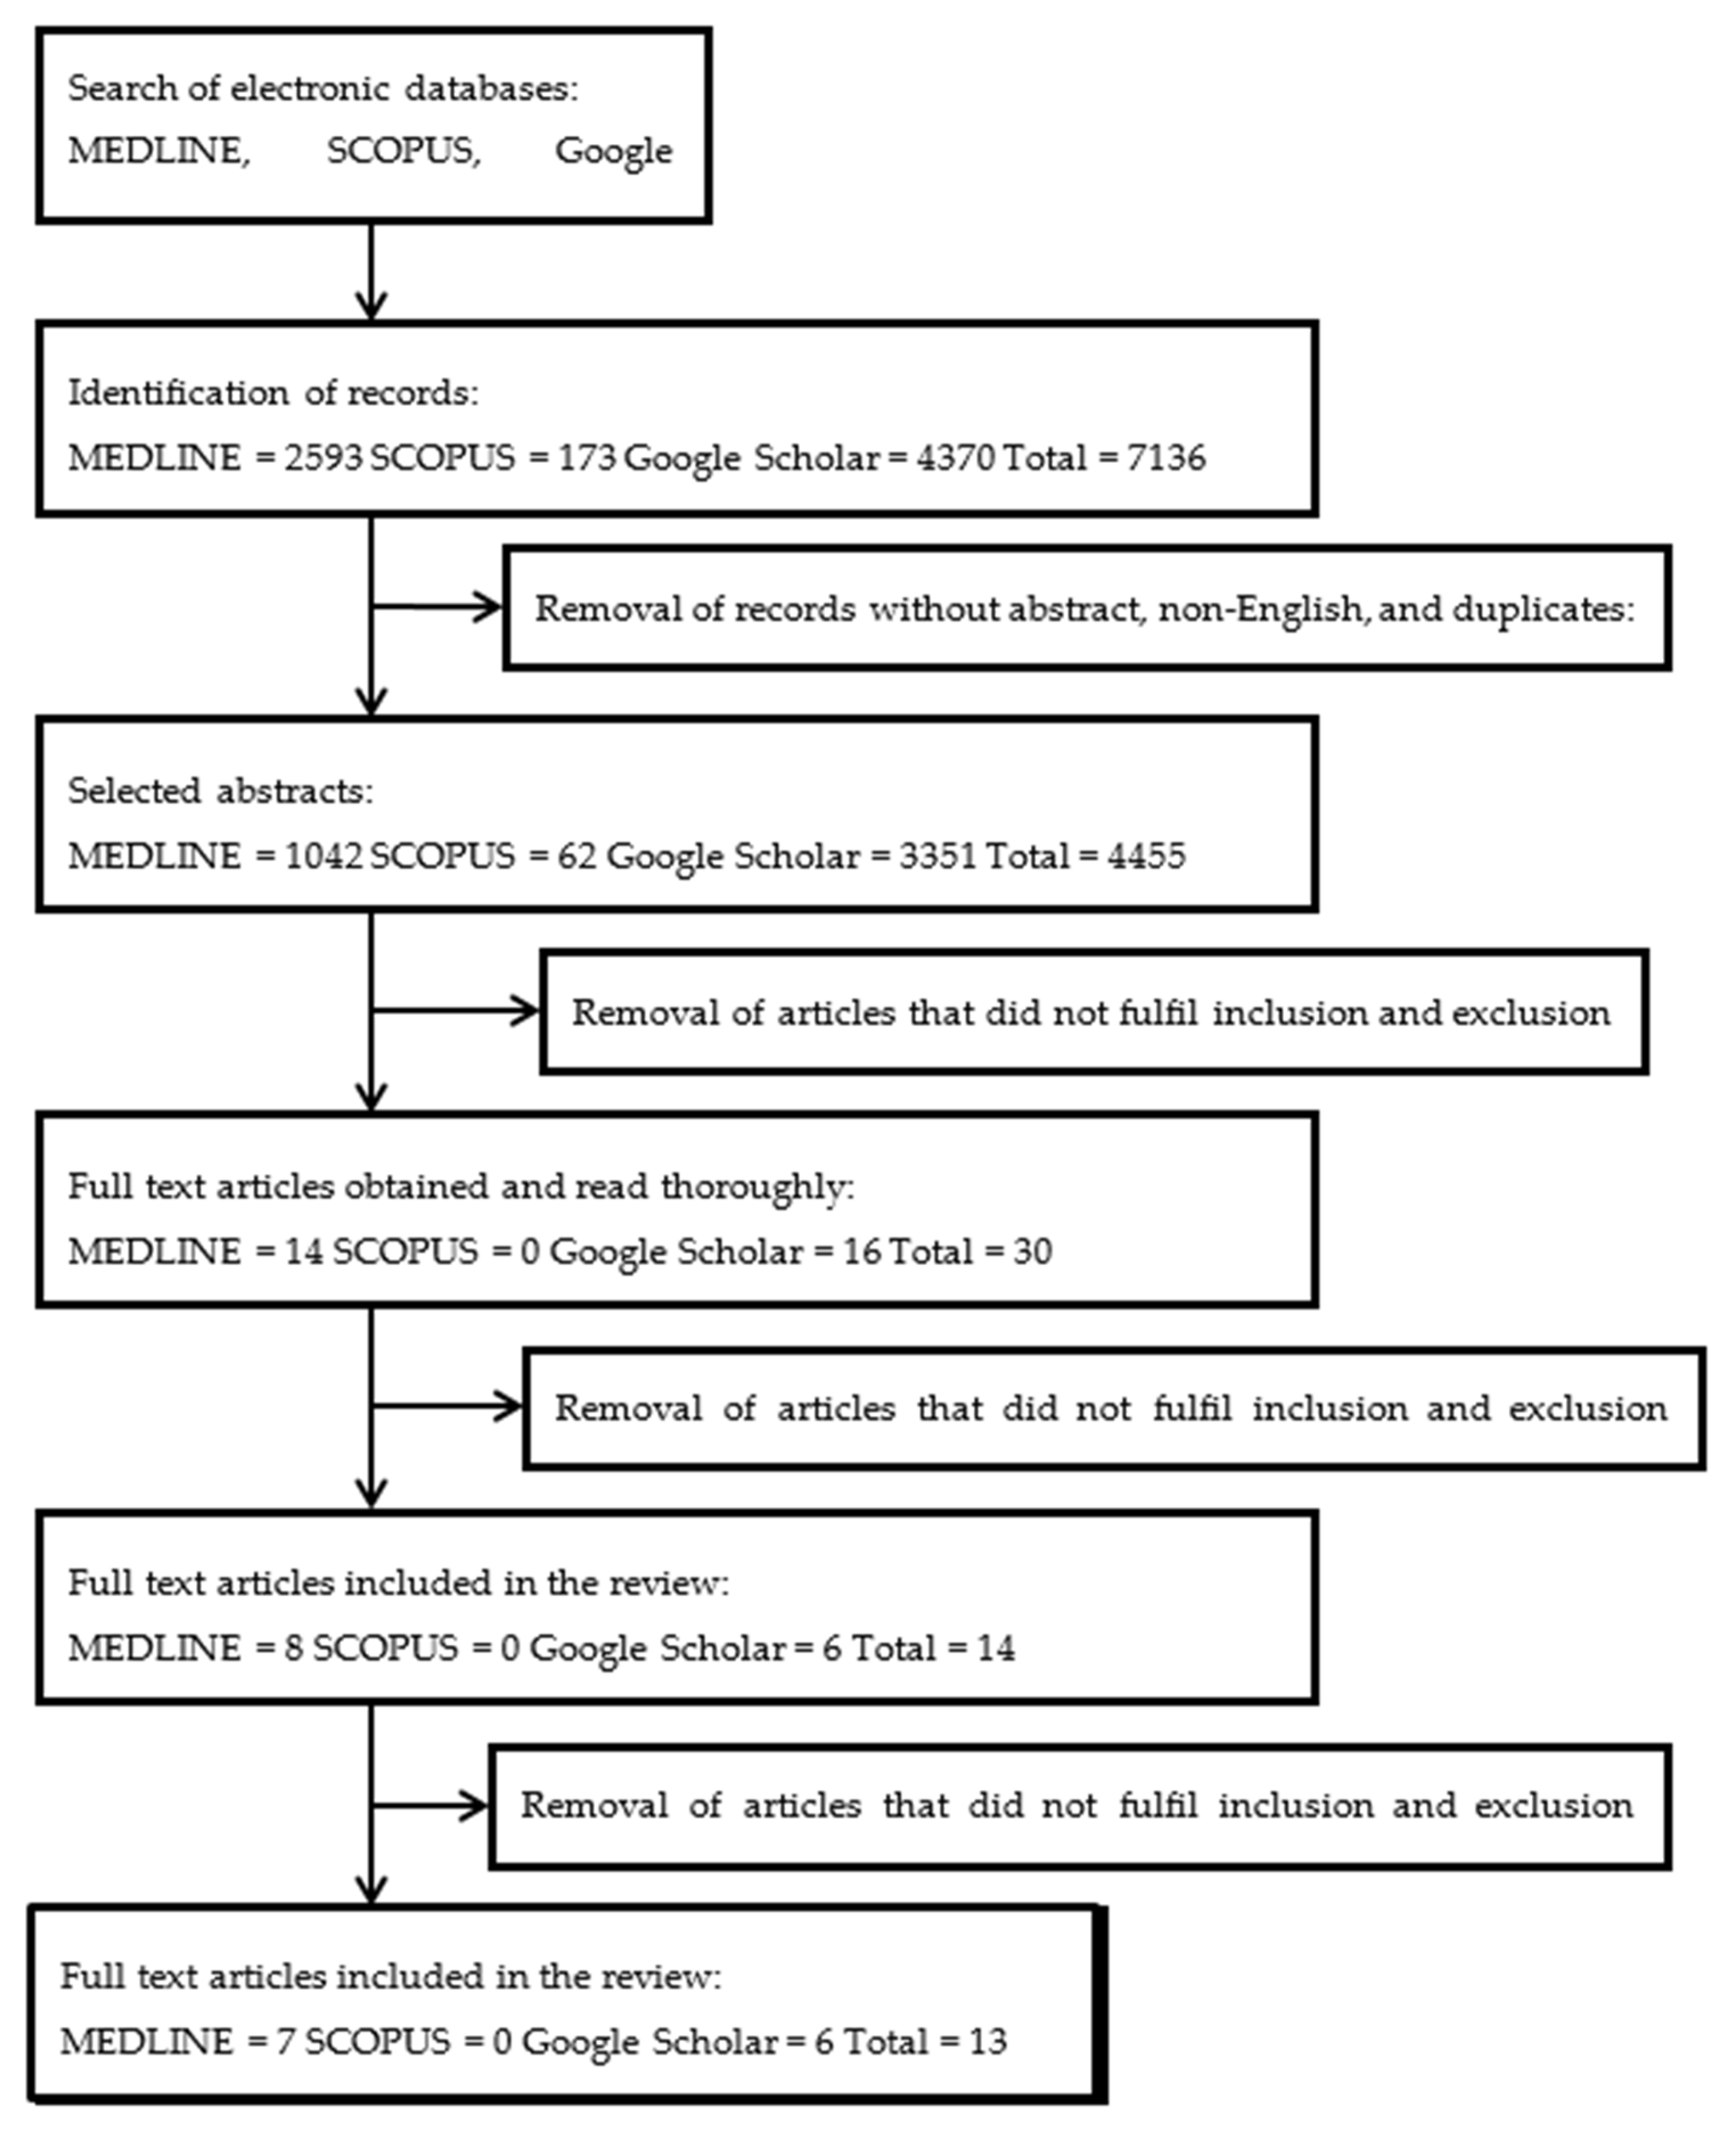
2.1. Research Articles Search Strategy
2.2. Selection of Research Articles
2.3. Inclusion and Exclusion Criteria
2.4. Data Extraction and Management
3. Results
3.1. Literature Search
3.2. Study Characteristics
3.3. Role of HT in Angiogenesis
3.4. Role of HT in Oxidative Stress
3.5. Antiaging Properties of HT
3.6. Antimicrobial Properties of HT
3.7. Role of HT in Inflammation
4. Discussion
5. Conclusions
Author Contributions
Funding
Acknowledgments
Conflicts of Interest
References
- Kumar, S.A.; Vignesh, S.; Yashavarddhan, M.H.; Kumar, S.S. Wound healing: Current understanding and future prospect. Int. J. Drug Discov. 2017, 8, 240–246. [Google Scholar]
- Weledji, E.P. Perspectives on wound healing. Aust. J. Surg. 2017, 4, 1104. [Google Scholar]
- Milne, K.; Penn-Barwell, J. Classification and management of acute wounds and open fractures. Surg. Oxf. 2020, 38, 143–149. [Google Scholar] [CrossRef]
- Dai, C.; Shih, S.; Khachemoune, A. Skin substitutes for acute and chronic wound healing: An updated review. J. Dermatol. Treat. 2020, 1–10. [Google Scholar] [CrossRef]
- Frykberg, R.G.; Banks, J. Challenges in the treatment of chronic wounds. Adv. Wound Care 2015, 4, 560–582. [Google Scholar] [CrossRef]
- Martin, P.; Nunan, R. Cellular and molecular mechanisms of repair in acute and chronic wound healing. Br. J. Dermatol. 2015, 173, 370–378. [Google Scholar] [CrossRef]
- Etulain, J. Platelets in wound healing and regenerative medicine. Platelets 2018, 29, 556–568. [Google Scholar] [CrossRef]
- Larouche, J.; Sheoran, S.; Maruyama, K.; Martino, M.M. Immune regulation of skin wound healing: Mechanisms and novel therapeutic targets. Adv. Wound Care 2018, 7, 209–231. [Google Scholar] [CrossRef]
- Stunova, A.; Vistejnova, L. Dermal fibroblasts—a heterogeneous population with regulatory function in wound healing. Cytokine Growth Factor Rev. 2018, 39, 137–150. [Google Scholar] [CrossRef]
- Sorg, H.; Tilkorn, D.J.; Hager, S.; Hauser, J.; Mirastschijski, U. Skin wound healing: An update on the current knowledge and concepts. Eur. Surg. Res. 2017, 58, 81–94. [Google Scholar] [CrossRef]
- Landen, N.X.; Li, D.; Stahle, M. Transition from inflammation to proliferation: A critical step during wound healing. Cell. Mol. Life Sci. 2016, 73, 3861–3885. [Google Scholar] [CrossRef] [PubMed]
- Caley, M.P.; Martins, V.L.C.; O’Toole, E.A. Metalloproteinases and wound healing. Adv. Wound Care 2015, 4, 225–234. [Google Scholar] [CrossRef]
- Wiegand, C.; Schonfelder, U.; Abel, M.; Ruth, P.; Kaatz, M.; Hipler, U.C. Protease and pro-inflammatory cytokine concentrations are elevated in chronic compared to acute wounds and can be modulated by collagen type I in vitro. Arch. Dermatol. Res. 2010, 302, 419–428. [Google Scholar] [CrossRef]
- Lawrence, T.; Fong, C. The resolution of inflammation: Anti-inflammatory roles for NF-κB. Int. J. Biochem. Cell Biol. 2010, 42, 519–523. [Google Scholar] [CrossRef] [PubMed]
- Fingleton, B. Matrix metalloproteinases as regulators of inflammatory processes. Biochim. Biophys. Acta Mol. Cell Res. 2017, 1864, 2036–2042. [Google Scholar] [CrossRef]
- Krzyszczyk, P.; Schloss, R.; Palmer, A.; Berthiaume, F. The role of macrophages in acute and chronic wound healing and interventions to promote pro-wound healing phenotypes. Front. Physiol. 2018, 9, 419. [Google Scholar] [CrossRef] [PubMed]
- Schreml, S.; Szeimies, R.M.; Prantl, L.; Karrer, S.; Landthaler, M.; Babilas, P. Oxygen in acute and chronic wound healing. Br. J. Dermatol. 2010, 163, 257–268. [Google Scholar] [CrossRef]
- Almeida, G.C.M.; Santos, M.M.D.; Lima, N.G.M.; Cidral, T.A.; Melo, M.C.N.; Lima, K.C. Prevalence and factors associated with wound colonization by staphylococcus spp. and staphylococcus aureus in hospitalized patients in inland northeastern brazil: A cross-sectional study. BMC Infect. Dis. 2014, 14, 328. [Google Scholar] [CrossRef]
- McGovern, N.N.; Cowburn, A.S.; Porter, L.; Walmsley, S.R.; Summers, C.; Thompson, A.A.; Anwar, S.; Willcocks, L.C.; Whyte, M.K.; Condliffe, A.M.; et al. Hypoxia selectively inhibits respiratory burst activity and killing of staphylococcus aureus in human neutrophils. J. Immunol. 2011, 186, 453–463. [Google Scholar] [CrossRef]
- Schaible, B.; McClean, S.; Selfridge, A.; Broquet, A.; Asehnoune, K.; Taylor, C.T.; Schaffer, K. Hypoxia modulates infection of epithelial cells by pseudomonas aeruginosa. PLoS ONE 2013, 8, e56491. [Google Scholar] [CrossRef]
- Grant, S.S.; Hung, D.T. Persistent bacterial infections, antibiotic tolerance, and the oxidative stress response. Virulence 2013, 4, 273–283. [Google Scholar] [CrossRef] [PubMed]
- Omara, S.T. MIC and MBC of honey and gold nanoparticles against methicillin-resistant (MRSA) and vancomycin-resistant (VRSA) coagulase-positive s. aureus isolated from contagious bovine clinical mastitis. J. Genet. Eng. Biotechnol. 2017, 15, 219–230. [Google Scholar] [CrossRef] [PubMed]
- Kurahashi, T.; Fujii, J. Roles of antioxidant enzymes in wound healing. J. Dev. Biol. 2015, 3, 57–70. [Google Scholar] [CrossRef]
- Dunnil, C.; Patton, T.; Brennan, J.; Barrett, J.; Dryden, M.; Cooke, J.; Leaper, D.; Georgopoulos, N.T. Reactive oxygen species (ROS) and wound healing: The functional role of ROS and emerging ROS-modulating technologies for augmentation of the healing process. Int. Wound J. 2015, 14, 89–96. [Google Scholar] [CrossRef] [PubMed]
- Espinosa-Diez, C.; Miguel, V.; Mennerich, D.; Kietzmann, T.; Sanchez-Perez, P.; Cadenas, S.; Lamas, S. Antioxidant responses and cellular adjustments to oxidative stress. Redox Biol. 2015, 6, 183–197. [Google Scholar] [CrossRef] [PubMed]
- Jindam, A.; Yerra, V.G.; Kumar, A. Nrf2: A promising trove for diabetic wound healing. Ann. Transl. Med. 2017, 5. [Google Scholar] [CrossRef]
- Szabo, I.L.; Kenyeres, A.; Szegedi, A.; Szollosi, A.G. Heme oxygenase and the skin in health and disease. Curr. Pharm. Des. 2018, 24, 2303–2310. [Google Scholar] [CrossRef] [PubMed]
- Li, B.; Wang, J.H. Fibroblasts and myofibroblasts in wound healing: Force generation and measurement. J. Tissue Viability 2011, 20, 108–120. [Google Scholar] [CrossRef] [PubMed]
- Pastar, I.; Stojadinovic, O.; Tomic-Canic, M. Role of keratinocytes in healing of chronic wounds. Surg. Technol. Int. 2008, 17, 105–112. [Google Scholar] [PubMed]
- Sorg, H.; Tilkorn, D.J.; Mirastschijski, U.; Hauser, J.; Kraemer, R. Pantha rei: Neovascularization, angiogenesis and nutritive perfusion in wound healing. Eur. Surg. Res. 2018, 59, 232–241. [Google Scholar] [CrossRef]
- Erdogan, I.; Bayraktar, O.; Uslu, M.E.; Tuncel, O. Wound healing effects of various fractions of olive leaf extract (OLE) on mouse fibroblasts. Rom. Biotechnol. Lett. 2017, 23. [Google Scholar] [CrossRef]
- Cerezo, A.B.; Labrador, M.; Gutiérrez, A.; Hornedo-Ortega, R.; Troncoso, A.M.; Garcia-Parrilla, M.C. Anti-VEGF signalling mechanism in HUVECs by melatonin, serotonin, hydroxytyrosol and other bioactive compounds. Nutrients 2019, 11, 2421. [Google Scholar] [CrossRef] [PubMed]
- Calabriso, N.; Gnoni, A.; Stanca, E.; Cavallo, A.; Damiano, F.; Siculella, L.; Carluccio, M.A. Hydroxytyrosol ameliorates endothelial function under inflammatory conditions by preventing mitochondrial dysfunction. Oxid. Med. Cell. Longev. 2018. [Google Scholar] [CrossRef] [PubMed]
- Lopez, S.; Paz, S.M.; Lucas, R.; Bermudez, B.; Abia, R.; Morales, J.C.; Muriana, F.J.G. Effect of metabolites of hydroxytyrosol on protection against oxidative stress and inflammation in human endothelial cells. J. Funct. Foods 2017, 29, 238–247. [Google Scholar] [CrossRef]
- Cheng, Y.; Qu, Z.; Fu, X.; Jiang, Q.; Fei, J. Hydroxytyrosol contributes to cell proliferation and inhibits apoptosis in pulsed electromagnetic fields treated human umbilical vein endothelial cells in vitro. Mol. Med. Rep. 2017, 16, 8826–8832. [Google Scholar] [CrossRef]
- Zrelli, H.; Kusunoki, M.; Miyazaki, H. Role of hydroxytyrosol-dependent regulation of HO-1 expression in promoting wound healing of vascular endothelial cells via Nrf2 de novo synthesis and stabilization. Phytother. Res. 2015, 29, 1011–1018. [Google Scholar] [CrossRef]
- Zrelli, H.; Matsuoka, M.; Kitazaki, S.; Araki, M.; Kusunoki, M.; Zarrouk, M.; Miyazaki, H. Hydroxytyrosol induces proliferation and cytoprotection against oxidative injury in vascular endothelial cells: Role of Nrf2 activation and HO-1 induction. J. Agric. Food Chem. 2011, 59, 4473–4482. [Google Scholar] [CrossRef]
- Avola, R.; Graziano, A.C.E.; Pannuzzo, G.; Bonina, F.; Cardile, V. Hydroxytyrosol from olive fruits prevents blue-light-induced damage in human keratinocytes and fibroblasts. J. Cell. Physiol. 2018, 1–12. [Google Scholar] [CrossRef]
- Meschini, R.; D’Eliseo, D.; Filippi, S.; Bertini, L.; Bizzarri, B.M.; Botta, L.; Saladino, R.; Velotti, F. Tyrosinase-treated hydroxytyrosol-enriched olive vegetation waste with increased antioxidant activity promotes autophagy and inhibits the inflammatory response in human THP-1 monocytes. J. Agric. Food Chem. 2018, 66, 12274–12284. [Google Scholar] [CrossRef]
- Guo, W.; An, Y.; Jiang, L.; Geng, C.; Zhong, L. The protective effects of hydroxytyrosol against UVB-induced DNA damage in HaCaT cells. Phytother. Res. 2010, 24, 352–359. [Google Scholar] [CrossRef]
- Jeon, S.; Choi, M. Anti-inflammatory and anti-aging effects of hydroxytyrosol on human dermal fibroblasts (HDFs). Biomed. Dermatol. 2018, 2. [Google Scholar] [CrossRef]
- Ghalandari, M.; Naghmachi, M.; Oliverio, M.; Nardi, M.; Shirazi, H.R.G.; Eilami, O. Antimicrobial effect of hydroxytyrosol, hydroxytyrosol acetate and hydroxytyrosol oleate on staphylococcus aureus and staphylococcus epidermidis. Electron. J. Gen. Med. 2018, 15. [Google Scholar] [CrossRef]
- Medina-Martinez, M.S.; Truchado, P.; Castro-Ibanez, I.; Allende, A. Antimicrobial activity of hydroxytyrosol: A current controversy. Biosci. Biotechnol. Biochem. 2015, 80, 801–810. [Google Scholar] [CrossRef] [PubMed]
- Crisante, F.; Taresco, V.; Donelli, G.; Vuotto, C.; Martinelli, A.; D’Illario, L.; Pietrelli, L.; Francolini, I.; Piozzi, A. Antioxidant hydroxytyrosol-based polyacrylate with antimicrobial and antiadhesive activity versus staphylococcus epidermidis. Adv. Microbiol. Infect. Dis. Public Health 2015, 901, 25–36. [Google Scholar]
- Athanasiou, A.; Karkambounas, S.; Batistatou, A.; Lykoudis, E.; Katsaraki, A.; Kartsiouni, T.; Papalois, A.; Evangelou, A. The effect of pulsed electromagnetic fields on secondary skin wound healing: An experimental study. Bioelectromagnetics 2007, 28, 362–368. [Google Scholar] [CrossRef] [PubMed]
- Kolluru, G.K.; Bir, S.C.; Kevil, C.G. Endothelial dysfunction and diabetes: Effects on angiogenesis, vascular remodeling, and wound healing. Int. J. Vasc. Med. 2012. [Google Scholar] [CrossRef] [PubMed]
- Cano, S.M.; Lancel, S.; Boulanger, E.; Neviere, R. Targeting oxidative stress and mitochondrial dysfunction in the treatment of impaired wound healing: A systematic review. Antioxidants 2018, 7, 98. [Google Scholar] [CrossRef]
- Sgonc, R.; Gruber, J. Age-related aspects of cutaneous wound healing: A mini-review. Gerontology 2013, 59, 159–164. [Google Scholar] [CrossRef]
- Cole, M.A.; Quan, T.; Voorhees, J.J.; Fisher, G.J. Extracellular matrix regulation of fibroblast function: Redefining our perspective on skin aging. J. Cell Commun. Signal. 2018, 12, 35–43. [Google Scholar] [CrossRef]
- Basso, F.G.; Pansani, T.N.; Turrioni, A.P.S.; Soares, D.G.; Costa, C.A.D.S.; Hebling, J. Tumor necrosis factor-alpha and interleukins IL-1ß, IL-6 and IL-8 impair in vitro migration and induce apoptosis of gingival fibroblasts and epithelial cells, delaying wound healing. J. Periodontol. 2016, 87, 990–996. [Google Scholar] [CrossRef]
- Parameswaran, N.; Patial, S. Tumor necrosis factor-α signaling in macrophages. Crit. Rev. Eukaryot. Gene Expr. 2010, 20, 87–103. [Google Scholar] [CrossRef] [PubMed]
- Schöttker, B.; Brenner, H.; Jansen, E.H.J.M.; Gardiner, J.; Paesey, A.; Kubinova, R.; Pajak, A.; Topor-Madry, R.; Tamosiunas, A.; Saum, K.U.; et al. Evidence for the free radical/oxidative stress theory of ageing from the CHANCES consortium: A meta-analysis of individual participant data. BMC Med. 2015, 13. [Google Scholar] [CrossRef] [PubMed]


| Antiangiogenic Properties of HT | |||||
|---|---|---|---|---|---|
| No. | References | Aim of Study | Subject/Treatment | Parameters | Results |
| 1. | Cerezo et al. 2019 [32] | To investigate the effects of serotonin, melatonin, 3-indoleacetic acid, 5-hydroxytryptophol and hydroxytyrosol (HT) on vascular endothelial growth factor (VEGF) activity. | Subject Human umbilical vein endothelial cells (HUVECs) induced with VEGF (25 ng/mL) for 5, 10 or 60 min. Treatment groups 1 µM of serotonin, melatonin, 3-indoleacetic acid, and 5-hydroxytryptophol each, as well as 50 µM of HT. |
|
|
| 2. | Calabriso et al. 2018 [33] | To investigate the HT effects on endothelial dysfunction under inflammatory conditions. | Subject HUVECs induced with phorbol myristate acetate (PMA; 10 nmol/L). Treatment groups HT at 0, 1, 10, 30 µmol/L concentrations. |
|
|
| 3. | Lopez et al. 2017 [34] | To investigate the effects of chemically synthesised metabolites (sulphate and glucuronate forms) from HT on oxidative stress and inflammation in TNF-α activated HUVECs. | Subject HUVECs induced with TNF-α. Treatment groups HT, HT sulfonate (HT-SUL), HT glucuronate (HT-GLU) at 0-200 µM concentrations. |
|
|
| 4. | Cheng et al. 2017 [35] | To analyse the effects of HT on the proliferation and differentiation of human umbilical vein endothelial cells (HUVECs). | Subject HUVECs exposed to pulsed electromagnetic fields (PEMFs). Treatment groups HT at 0, 10, 30, 50, 100 and 150 μM concentrations. |
|
|
| 5. | Zrelli et al. 2015 [36] | To evaluate the expression of HO-1 and NRF-2 in HT-induced endothelial wound healing. | Subject Porcine vascular endothelial cells (VECs). Treatment groups HT at 10, 30, 50 and 100 μM concentrations. |
|
|
| 6. | Zrelli et al. 2011 [37] | To study the effect of HT on proliferation and protection against oxidative stress-induced damage in VECs. | Subject Porcine VECs. Treatment groups HT at 10, 30, 50 and 100 μM concentrations. |
|
|
| 7. | Avola et al. 2018 [38] | To investigate the effect of hydroxytyrosol on the irradiated light-emitting-diode-generated blue light (LED-BL) of human dermal fibroblasts (HDFs) and human epidermal keratinocytes (HEKs). | Subject HEKs (NCTC 2544) or HDFs irradiated with LED-BL. Treatment groups HT at 10, 25 and 50 µg/mL concentrations. |
|
|
| 8. | Meschini et al. 2018 [39] | To investigate the effects of olive vegetation waste (OVW) on lipopolysaccharide (LPS)-stimulated human THP-1 monocytes. | Subject Human THP-1 monocytes stimulated by LPS. Treatment groups OVW treated with immobilised tyrosinase (OVW-1), OVW treated with native tyrosinase (OVW-2), non-treated OVW (OVW-3). |
|
|
| 9. | Guo et al. 2010 [40] | To investigate the effect of HT towards UVB-induced DNA damage in a human skin keratinocyte cell line, HaCaT | Subject HaCaT induced with UVB. Treatment groups HT: 0, 25, 50 and 100 µM |
|
|
| 10. | Jeon and Choi 2018 [41] | To evaluate the anti-inflammatory and antiaging effects of HT via UVA-induced aging model in HDFs. | Subject HDFs irradiated with UVA. Treatment groups HT: 5, 10, 20, 30 µM |
|
|
| 11. | Ghalandari et al. 2018 [42] | To investigate the antimicrobial effect of HT, HT acetate (HTA) and HT oleate (HTO) on Staphylococcus aureus and Staphylococcus epidermidis. | Subject Staphylococcus aureus or Staphylococcus epidermidis Treatment groups HT, HTA or HTO at 3.125, 6.25, 12.5, 25, 50 and 100 mg/mL each. |
|
|
| 12. | Medina-Martinez et al. 2016 [43] | To determine the antimicrobial activity of HT towards the growth of several bacteria strains | Subject 8 g-negative bacteria, namely, Erwinia carotovora, Klebsiella pneumonia, Pseudomonas aeruginosa, Yersinia enterocolitica, Salmonella thypimurium, Aeromonas hydrophila, Shigella sonnei, Escherichia coli and 4 g-positive bacteria, namely, Pediococcus acidilactici, Kocuria rhizophila, Listeria monocytogenes, and S. aureus. Further experiment with 4 strains of E. coli, namely, CECT 4972, CECT 516, CECT 553 and LFMFP 679. Treatment groups HT: 200, 400 and 1000 μg/mL |
|
|
| 13. | Crisante et al. 2015 [44] | To analyse the antioxidant and antibacterial activity of HT-based polyacrylate (HT-pAc) on S. epidermidis | Subject Staphylococcus epidermidis Treatment groups HT-pAc with concentrations of 1, 5 and 10 mg/mL |
|
|
© 2020 by the authors. Licensee MDPI, Basel, Switzerland. This article is an open access article distributed under the terms and conditions of the Creative Commons Attribution (CC BY) license (http://creativecommons.org/licenses/by/4.0/).
Share and Cite
Utami, N.D.; Nordin, A.; Katas, H.; Bt Hj Idrus, R.; Fauzi, M.B. Molecular Action of Hydroxytyrosol in Wound Healing: An In Vitro Evidence-Based Review. Biomolecules 2020, 10, 1397. https://doi.org/10.3390/biom10101397
Utami ND, Nordin A, Katas H, Bt Hj Idrus R, Fauzi MB. Molecular Action of Hydroxytyrosol in Wound Healing: An In Vitro Evidence-Based Review. Biomolecules. 2020; 10(10):1397. https://doi.org/10.3390/biom10101397
Chicago/Turabian StyleUtami, Nike Dewi, Abid Nordin, Haliza Katas, Ruszymah Bt Hj Idrus, and Mh Busra Fauzi. 2020. "Molecular Action of Hydroxytyrosol in Wound Healing: An In Vitro Evidence-Based Review" Biomolecules 10, no. 10: 1397. https://doi.org/10.3390/biom10101397
APA StyleUtami, N. D., Nordin, A., Katas, H., Bt Hj Idrus, R., & Fauzi, M. B. (2020). Molecular Action of Hydroxytyrosol in Wound Healing: An In Vitro Evidence-Based Review. Biomolecules, 10(10), 1397. https://doi.org/10.3390/biom10101397