Abstract
In this work, a quantitative analysis of Li in natural brines was carried out by laser-induced breakdown spectroscopy (LIBS) assisted by the τ–algorithm for detailed analysis of the experimental line shapes (τLIBS). Brine samples were collected from different salars located in the Puna plateau (Northwest Argentina) and analyzed by LIBS in the form of solid pressed pellets. The emission intensities of Li I, Hα, and Mg I–II lines were measured and spatially integrated along the line of sight with temporal resolution by using a high-spectral-resolution spectrometer equipped with an intensified charge-coupled device (iCCD) detector. The plasma was characterized through the determination of the electron density and the temperature. The τ–algorithm calculated the optical thicknesses of the Li I lines to generate synthetic intensity profiles that were subsequently fitted to the experimental spectra. By applying the developed τLIBS approach, valuable spectroscopic insight was recovered about the physical processes occurring in the plasma, such as self-absorption. The analytical process involved an univariate external calibration process using the resonant Li I line at 6707.7 Å measured from a series of Li standard samples. Self-absorption effects were evaluated and subsequently compensated. The final LIBS results, with an enhanced accuracy of 15%, were validated by crosschecking them against those obtained with the standard AAS method.
1. Introduction
Laser-induced breakdown spectroscopy (LIBS) is a useful atomic emission spectroscopic technique that can supplement conventional methods for the quantitative analysis of lithium (Li) in brines [1]. The LIBS technique is not competitive but complementary to the other existing analytical techniques, such as atomic absorption spectroscopy (AAS) and inductively coupled plasma–atomic emission spectroscopy (ICP–AES). Li is a light element that is often difficult to detect with AAS and ICP–AES methods but can be readily detected with LIBS [2]. Li’s perceived value has risen over the last years, primarily due to both its limited availability and the increasing demand for Li salts in the battery industry for devices like computers and electric vehicles [3]. Approximately 58% of the global Li resources are found in continental brines located in salt flats, known as “salars” [4]. Continental brines are highly saline solutions with a high sodium (Na) content and varying amounts of other elements, including Li, potassium (K), magnesium (Mg), and calcium (Ca). In South America, the “Lithium Triangle”, comprising Argentina, Bolivia, and Chile, is an extensive area rich in Li brine salars [5]. These salars hold together about 80% of the world’s Li resources in brines. Argentina’s primary Li deposits are found in the Puna region, a high-altitude plateau with an average elevation of 3600 m above sea level. This region, located in the provinces of Jujuy, Salta, and Catamarca, makes Argentina the third-largest producer of Li from brines globally [6]. The concentration of Li in salar brines varies (e.g., from 10 to 1000 ppm) due to the unique geological characteristics of each salar [3,5]. However, reliable data on the availability of Li salts in these salars remains limited. Therefore, a better understanding of the Andean salars and their Li resources is essential to ensure effective and sustainable Li recovery [7,8,9,10,11,12].
LIBS works by analyzing the characteristic spectral lines emitted from a plasma created by a laser-ablated material from the sample being interrogated. LIBS methodology is simple, versatile, and allows for rapid, in situ, multi-element measurements with minimal sample preparation [13]. The LIBS technique has been mainly used for geochemical studies to analyze Li in various solid geological materials like rocks and minerals, including muscovite and other Li-bearing minerals [14,15,16]. However, its application for analyzing Li in liquid samples, such as brines, has not been widely explored. This is mainly because LIBS analysis of liquid samples has known drawbacks (i.e., splashing, bubbles, surface ripples, and lower emitted intensity) that diminish its performance compared to the analysis of solid samples [17]. For instance, Erbetta et al. used a handheld LIBS system to analyze natural brines from Chile’s Atacama Desert, which has a Li content of 0.5–1.75% by weight [18]. Additionally, Xing et al. combined LIBS with a Convolutional Neural Network to perform quantitative analysis of natural brines with a Li concentration ranging from 5 to 40 ppm [19]. Understanding the physical processes of the plasma that influence its behavior, such as self-absorption, is crucial for enhancing the accuracy of LIBS analysis. In a recent work of our group, the LIBS technique was successfully assessed for the determination of Li in continental brines using a compact LIBS equipment [20]. Although in this study, the obtained results showed an acceptable average quantification error of 25%, a deeper investigation into these processes is expected to further improve the technique’s accuracy. In a previous work, we evaluated a self-designed algorithm, called the τ–algorithm, for providing spectroscopic information that is particularly effective for studying emission lines, measured with good spectral resolution, from plasmas generated with LIBS [21]. In the present work, we developed a novel approach that is based on the LIBS technique incorporating the τ–algorithm (τLIBS) for the analysis of the measured line shapes. τLIBS is a variant of the traditional LIBS method for the detailed analysis of line shapes. The τLIBS approach was applied to determine the Li elemental content in natural brines. The analytical process involved the spectral analysis of the resonant Li I line at 6707.7 Å and univariate external calibration using a series of Li standard samples. The plasma was characterized through the determination of the electron density and the temperature. To improve the accuracy of the quantitative results, self-absorption effects were evaluated and subsequently compensated. The final LIBS results were validated by cross-checking them against those obtained with the standard AAS method.
2. Theoretical Section
We consider a cylinder-symmetrical homogeneous plasma in local thermodynamic equilibrium (LTE), where the emission and absorption of radiation are described by an emission coefficient ελ (J s−1 m−3 sr−1 Å−1) and an absorption coefficient κ(λ) (m−1). The spectral intensity (J s−1 m−2 sr−1 Å−1) radiated along the line of sight is given by
where C (a.u.) is a factor that unifies units and depends on the instrumental setup, Uλ (T) (W m−2 sr−1 Å−1) is Plank’s distribution for blackbody radiation, T (K) is the plasma temperature, and τλ (dimensionless) is the optical thickness [22]. The optical thickness can be separated into different factors:
where κe (T) (m3) is a coefficient that depends on the temperature and the atomic parameters of the transition, N (m−3) is the density of the emitting element in the plasma, l (m) is the length of the plasma along the line of sight, and P (λ) (m−1) is the normalized line shape, generally given by a Voigt function. The optical thickness (τλ) determines self-absorption of the spectral emission lines within the plasma. If τλ is known, a self-absorption correction factor Rλ (dimensionless) can be obtained,
The correction factor Rλ can be applied to the experimental lines (Iλ) to compensate for self-absorption effects, thus retrieving the optically thin line profiles (Iλthin) for the same number density of emitters [23]. Namely,
For a given emission line, self-absorption can be quantitatively assessed by the line self-absorption coefficient:
where Iexp (a.u.) and Ithin (a.u.) are the wavelength-integrated intensities of the experimental and optically thin lines, respectively. The SAl coefficient is expressed as a percentage, in such a way that SAl = 0% if the line is optically thin, and it increases up to SAl = 100% as the line becomes completely self-absorbed.
3. Materials and Methods
3.1. Brine Samples
In this study, 11 natural brines collected from different salars (designated #1–11), located in the Puna region of Argentina, were analyzed in the laboratory for Li determination. To overcome the drawbacks of LIBS measurement of liquid matrices, the samples were prepared in the form of pellets employing a liquid-to-solid matrix conversion [20,24]. For each brine sample, a volume of 12 mL was mixed with 6 g of pure calcium oxide (CaO, Aldrich Powder 98%). Then, the mixture was stirred under controlled, contamination-free conditions to ensure homogeneity. Subsequently, the mixture was dried in an oven at 70 °C until constant weight was achieved. The resulting solid was ground to a fine powder using an agate mortar and pestle before being pressed at 35 MPa using a stainless steel die. The final pellets measured 3 cm in diameter, 1 cm in thickness, and had a mass of 8 g. For calibration purposes, 8 pellets with known Li concentrations ranging from 0 to 1300 ppm, and including a blank, were also prepared. These Li standards were prepared by diluting a stock lithium carbonate solution (Li2CO3, Agilent) with suitable volumes of doubly distilled water (σ < 5 μS/cm). The accuracy of the quantitative LIBS analysis was assessed by comparing the results obtained for the Li concentrations in the brines with those determined by atomic absorption spectroscopy (AAS) according to standard procedures [25].
3.2. LIBS Setup
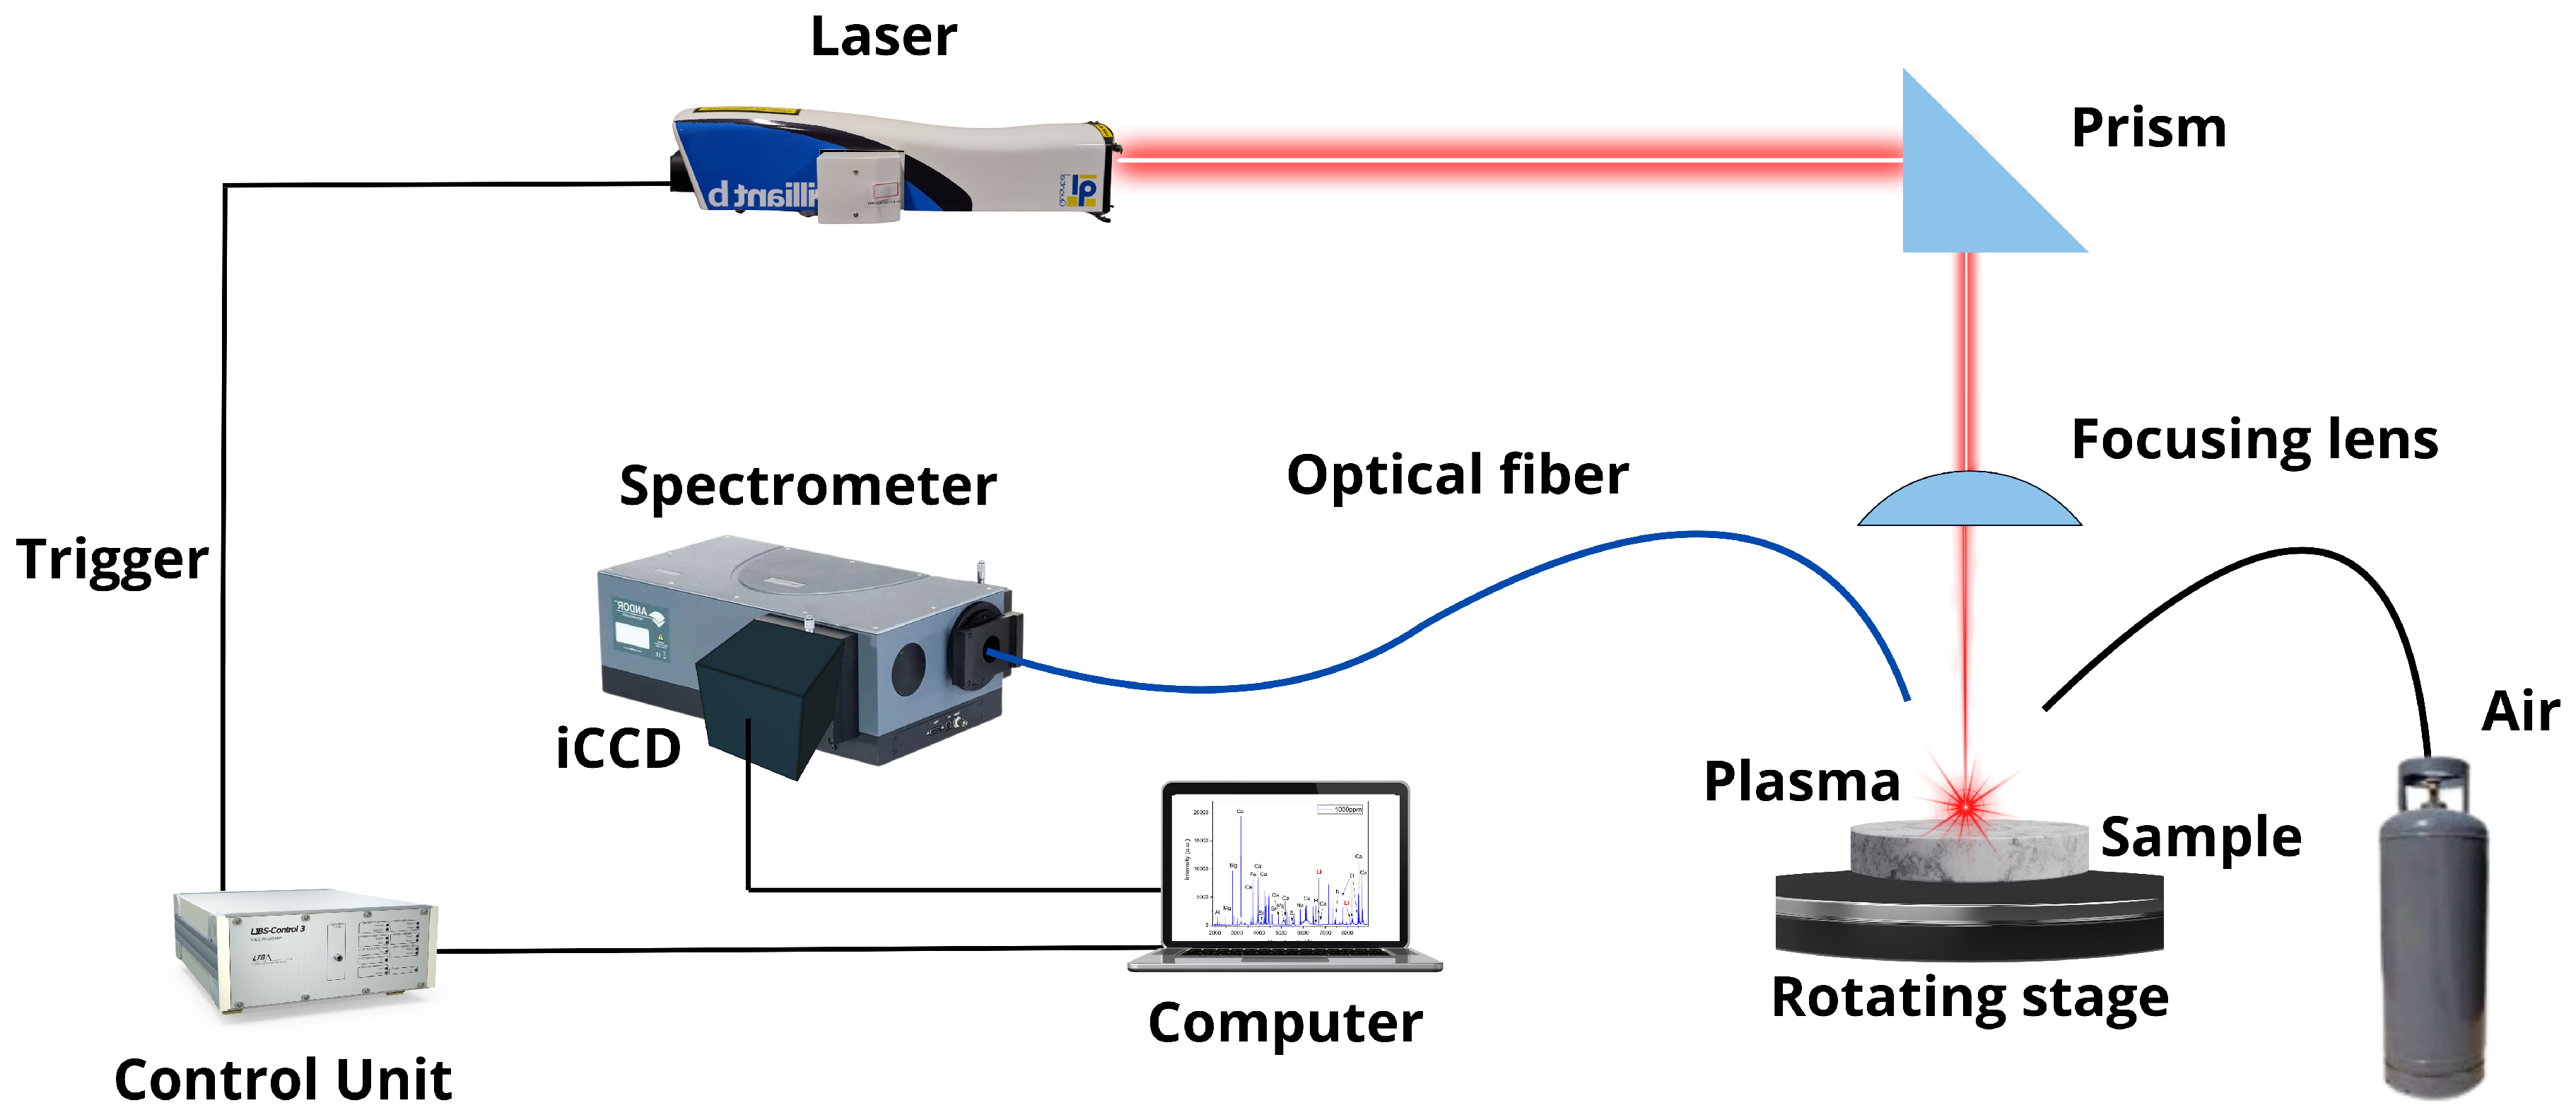
The employed LIBS setup is shown in Figure 1. A Nd: YAG laser (wavelength 1064 nm, pulse width 4.5 ns, pulse energy 30 mJ, repetition rate 20 Hz) was used to generate the plasmas in air at atmospheric pressure. The laser beam was focused at right angles to the sample surface using a plano-convex lens (126 mm focal length) placed at a lens-to-sample distance of 122 mm from the sample surface. The samples rotated at 300 rev min−1 to avoid the formation of a deep crater by the ablation process. A plastic nozzle (4 mm in diameter) was used to blow air (pressure < 7 kPa) over the ablation spot to remove the dust released by laser shots and prevent the spark of the breakdown in the air above the samples’ surface. The whole plasma emission was collected by using a fiber optics (100 μm core diameter), placed at a 1 cm distance from the laser spot on the target at a 45–degree angle, and transmitted to the entrance of a Czerny–Turner spectrometer (focal length 0.5 m, gratings of 2400 and 3600 lines mm−1, slit width 20 μm) equipped with an intensified charge-coupled device (iCCD) detector (1200 × 256 effective pixels). The experimental setup had a high spectral resolution (50 pm at 3000 Å), providing an instrumental broadening comparable to or less than the experimental line widths, which allowed the detailed measurement of the true line profiles.
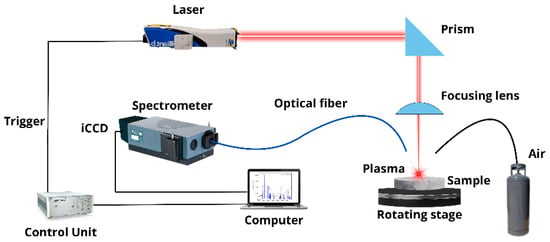
Figure 1.
LIBS experimental setup.
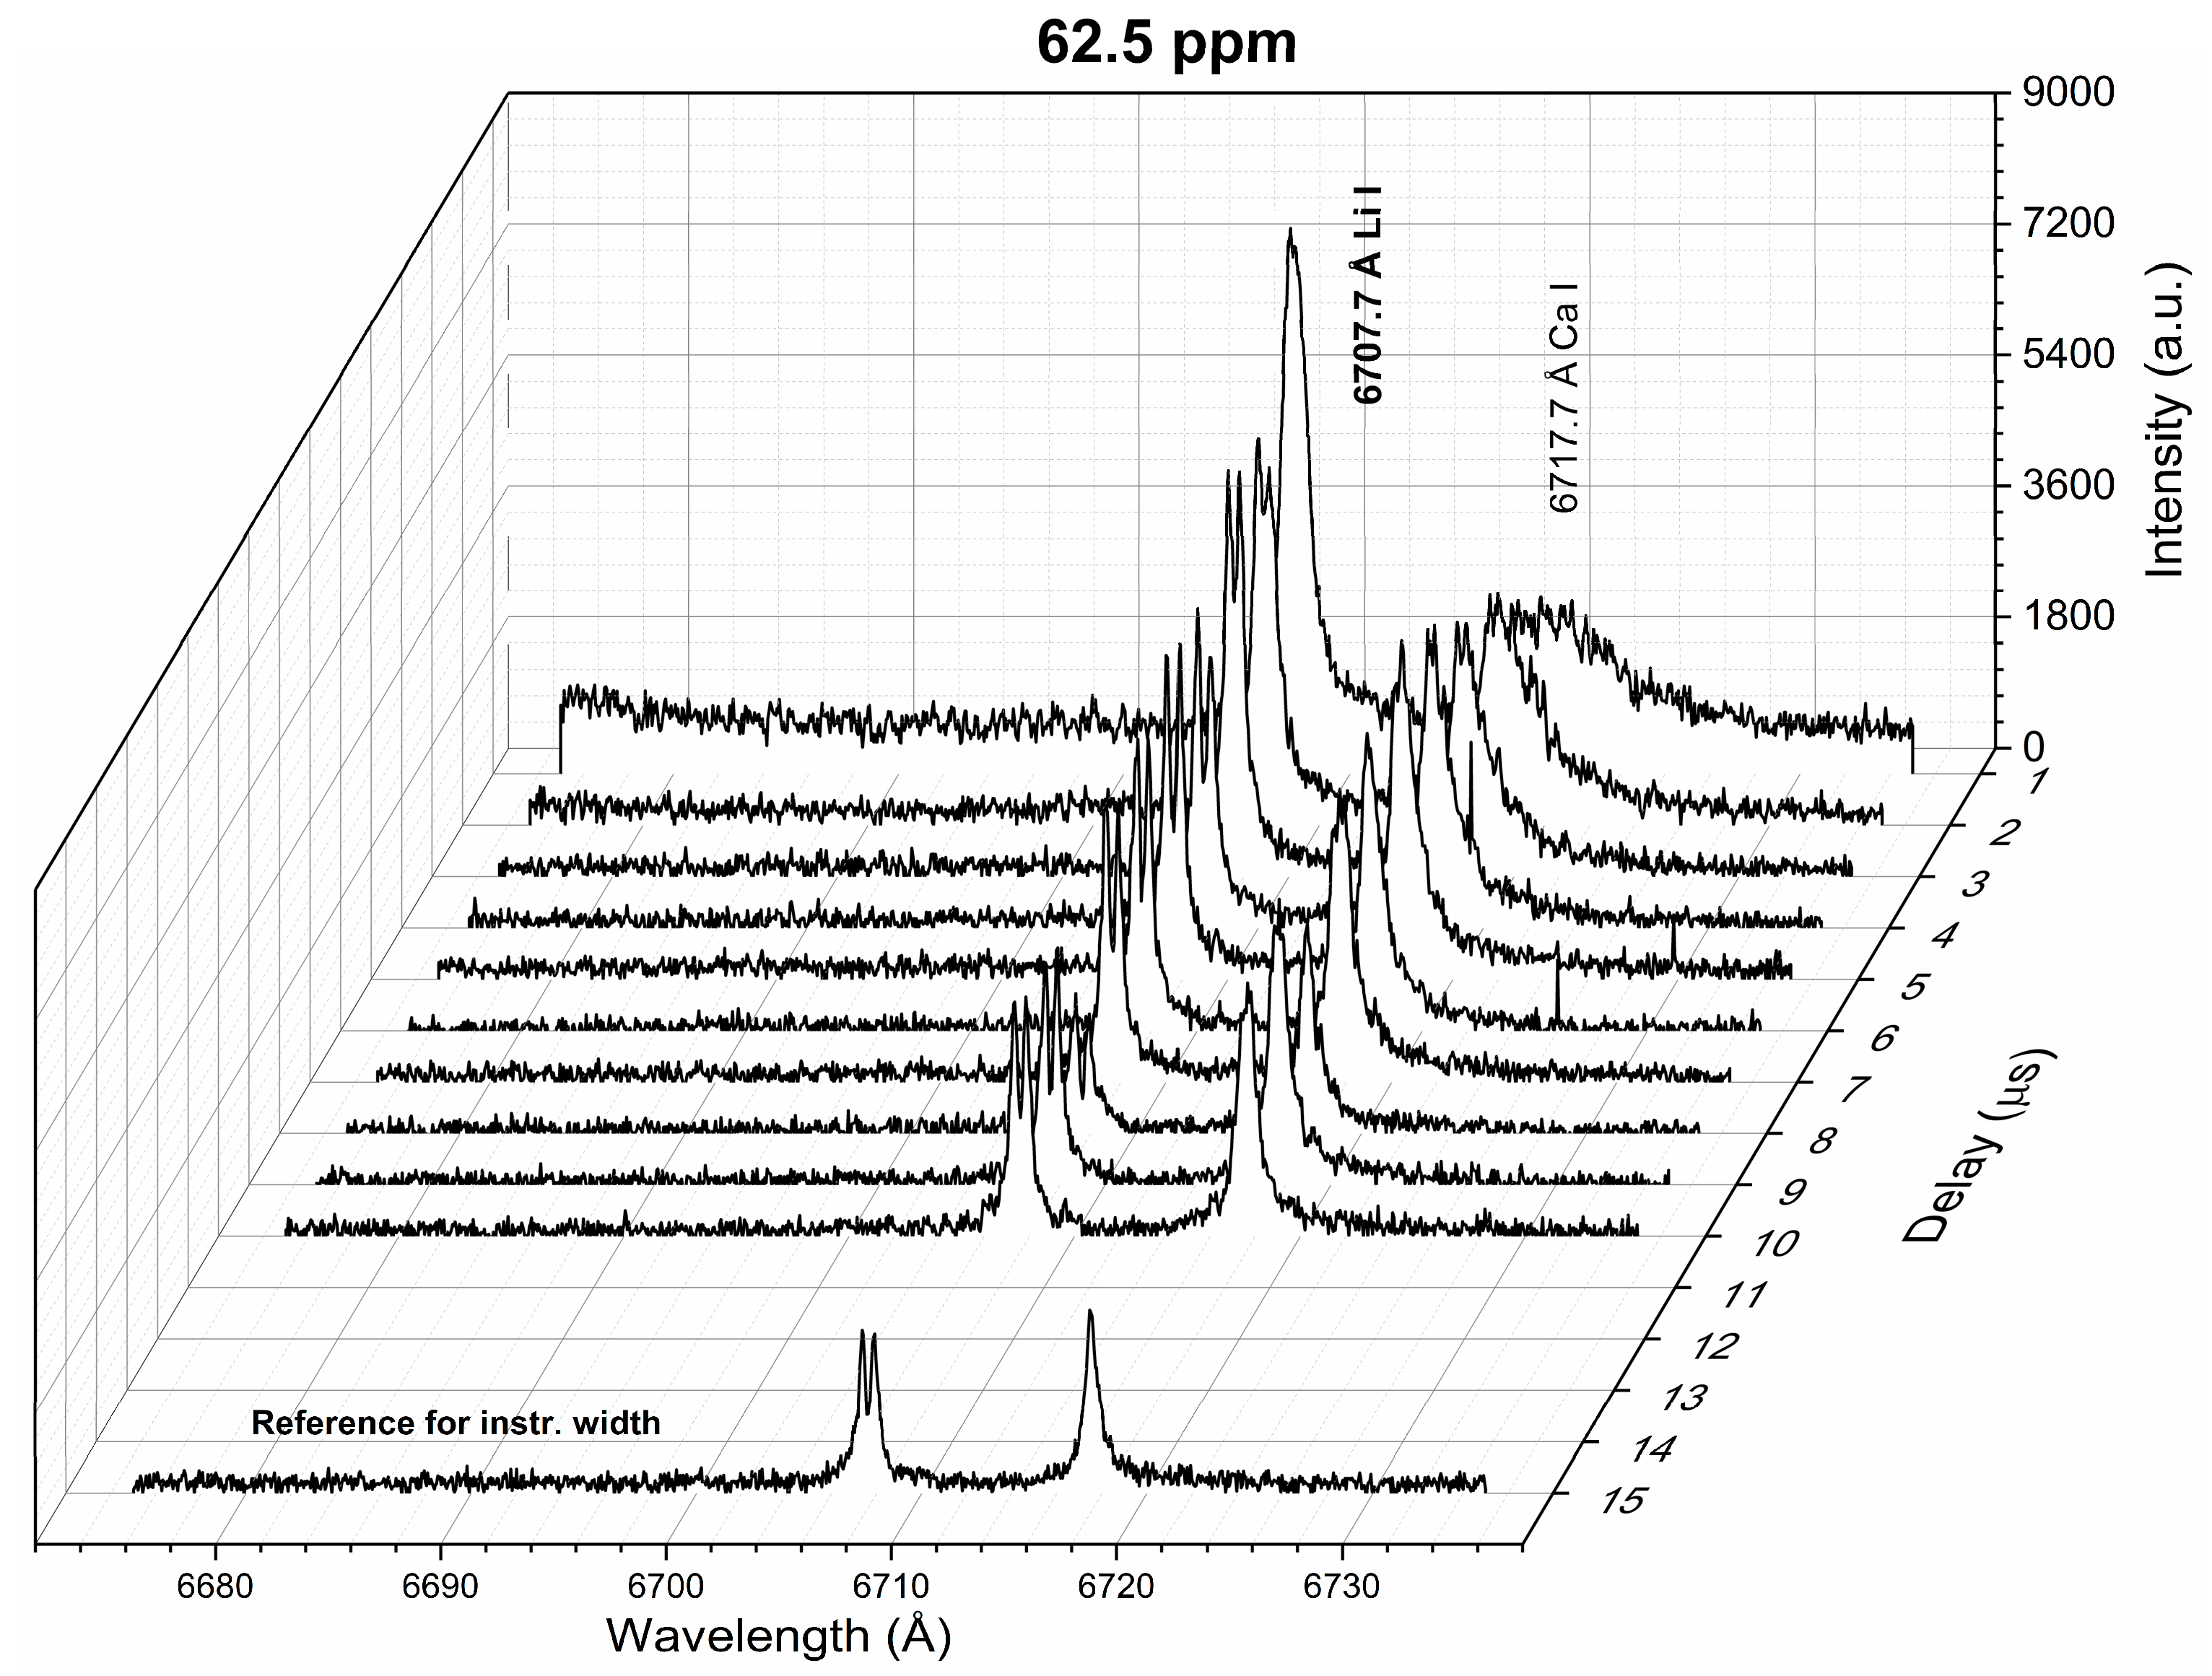
Emission line spectra of Li I, Hα, and Mg I–II (spatially integrated along the line of sight) were recorded using suitable delay times (1–10 μs) with a gate width of 1 μs. An additional spectrum was measured at a late time window (delay 15 μs, width 1 μs) where the electron density had decreased to a negligible value. This latter spectrum was used as a reference for the estimation of the instrumental width. Each recorded spectrum was the result of the in-software accumulation of individual spectra generated from 300 consecutive laser shots to improve the signal-to-noise ratio, after discarding the first 100 cleaning shots delivered to avoid any possible superficial contamination due to handling of the samples. The recorded raw spectral data (i.e., 1024 pixels vs. emission intensity) were pre-processed in software through automated routines that removed the “dark” background (i.e., spectrum without laser firing), and carried out the wavelength calibration (i.e., pixel-to-wavelength relationship).
4. Results and Discussion
Figure 2 shows the temporal behavior of the line profiles of spectral emission intensity for the resonant Li line at 6707.7 Å measured from the reference sample with a Li concentration of 62.5 ppm. It was observed that the emission intensity of the Li I line decreased with time as the plasma cooled down. Moreover, a central dip was present at the Li I line profiles for delay times larger than 2 μs. The presence of such a dip is an unequivocal sign that the Li emission is being self-absorbed in a non-uniform plasma regarding the Li concentration, with a large temperature gradient between the inner and outer parts of the plume [26]. For larger Li concentrations, a similar trend was observed. For a Li concentration of 1346 ppm, the dip was present at an early time of 1 μs. Self-reversal of the resonant Li line measured at atmospheric pressure has already been reported by Tanra et al. [27]. The authors attributed this to the very light mass of Li atoms (mLi = 6.941 g/mol), which are “blown” by the plasma shock wave to the periphery. This can be realized with a simple picture of a plasma composed of two regions: a hot core surrounded by a cold periphery, which are populated mainly by ions (Li II) and neutral atoms (Li I), respectively [28]. Hence, the relatively high density of neutral atoms in the plasma periphery increases the self-absorption of the spectral lines, thus leading to an optically thick inhomogeneous plasma. Following this observation, a delay time of 1–2 μs (i.e., delay time 1 μs, gate width 1 μs) was selected for the LIBS analysis, where suitable conditions of an approximately homogeneous plasma were achieved. In the following, we describe the plasma characterization (Section 4.1), the analysis of the recorded spectral lines (Section 4.2), and the quantitative analysis of Li in the natural brine samples, together with the evaluation of its accuracy (Section 4.3).
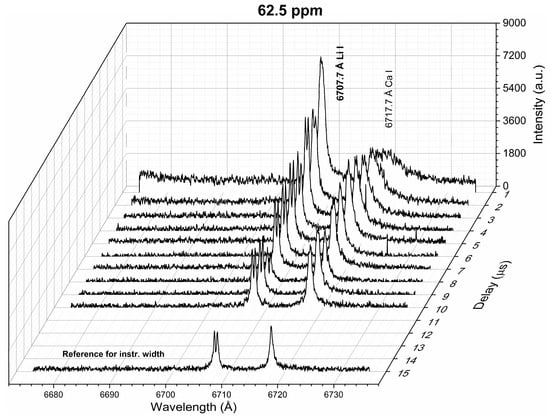
Figure 2.
Li spectra measured for different delay times (sample: Reference Li 62.5 ppm). The spectrum at the late time window measured for the instrumental width estimation is shown.
4.1. Plasma Characterization: Electron Density and Temperature
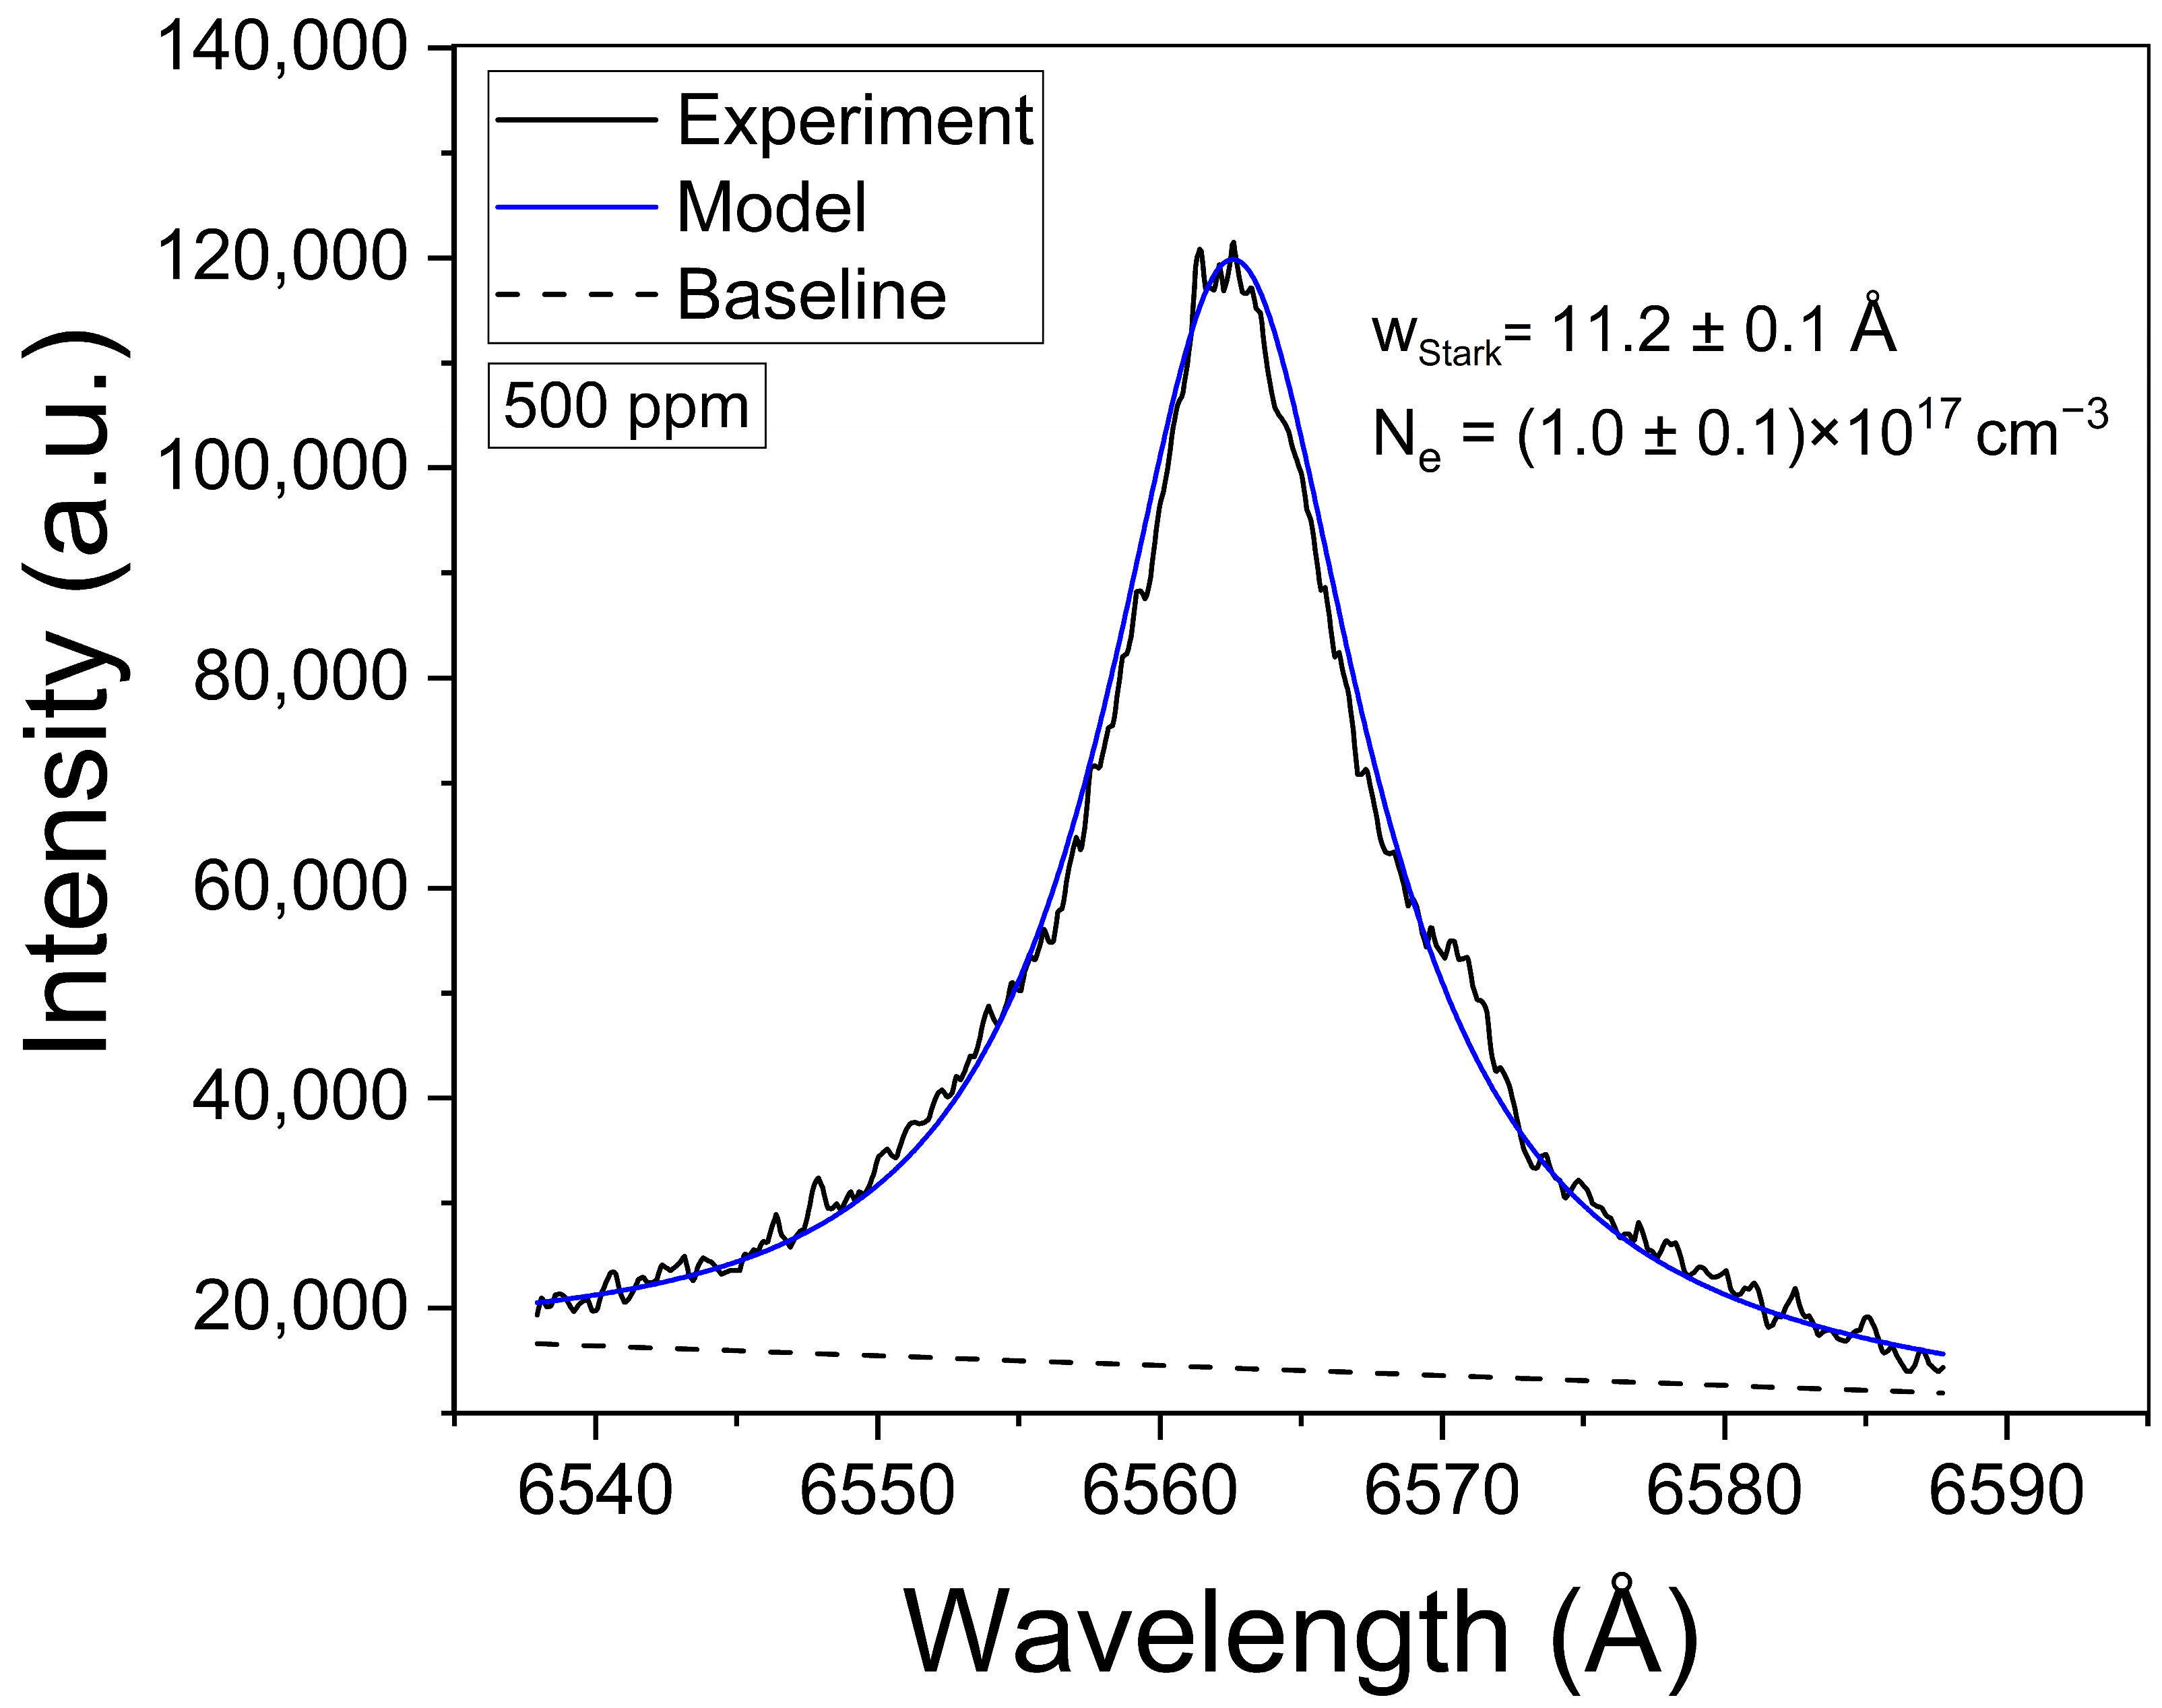
The plasma was characterized by the determination of the electron density and the temperature. The electron density was determined from the Stark broadening of the Hα line at 6563.0 Å. As reported in our previous works [20,21], the Hα line features a very small optical thickness (i.e., the maximum value at the line center being τ0Hα << 1) due to its large Stark broadening. This low τλHα ensures that self-absorption is minimal, accounting for less than 1%, and thus its effects in the line profile are negligible. The measured Hα profiles were fitted with a Lorentzian function, as shown in the example of Figure 3. The obtained Stark widths were in the range wStark = 11–12 Å. The electron density (Ne [m−3]) was then calculated through the empirical expression given by Gigosos and Cardeñoso [29]:
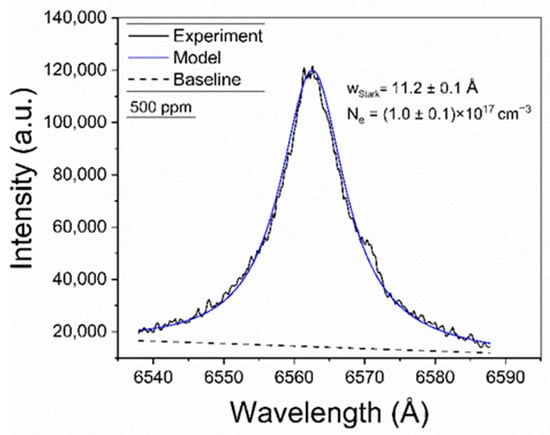
Figure 3.
Example of the Hα spectral line measured from brines. The obtained values for wStark and the calculated electron density (Ne) are shown (sample: Reference Li 500 ppm).
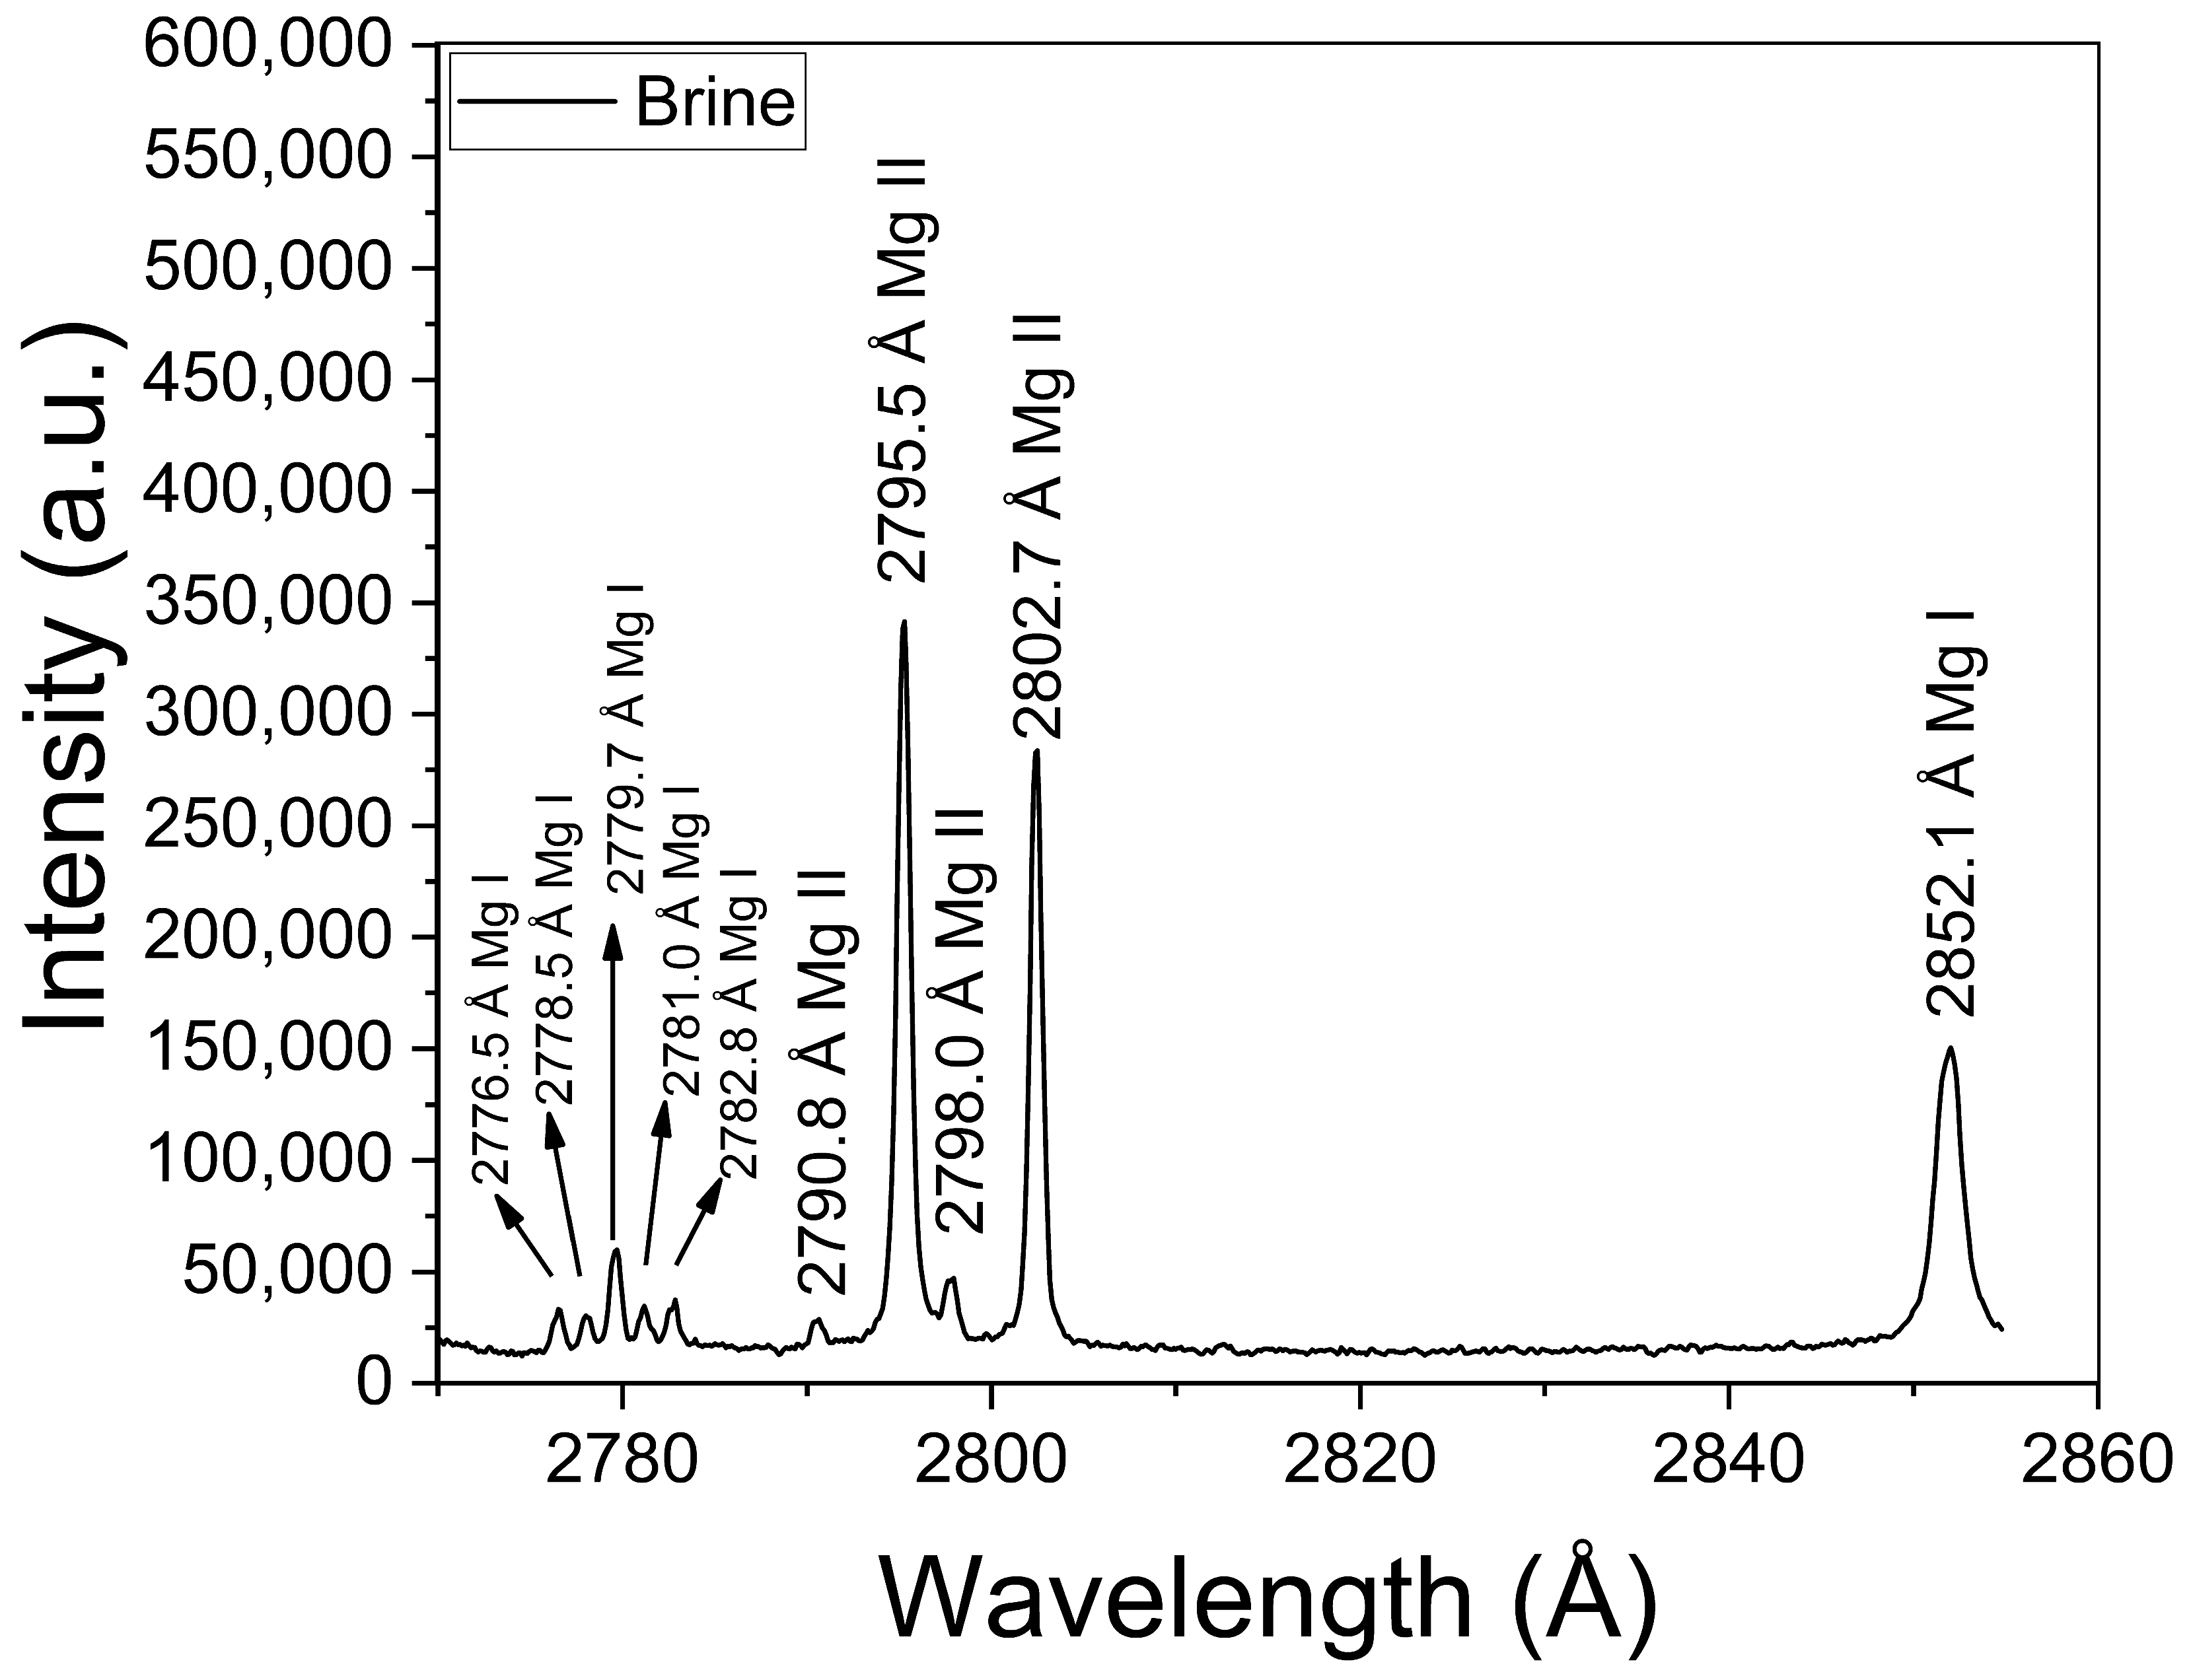
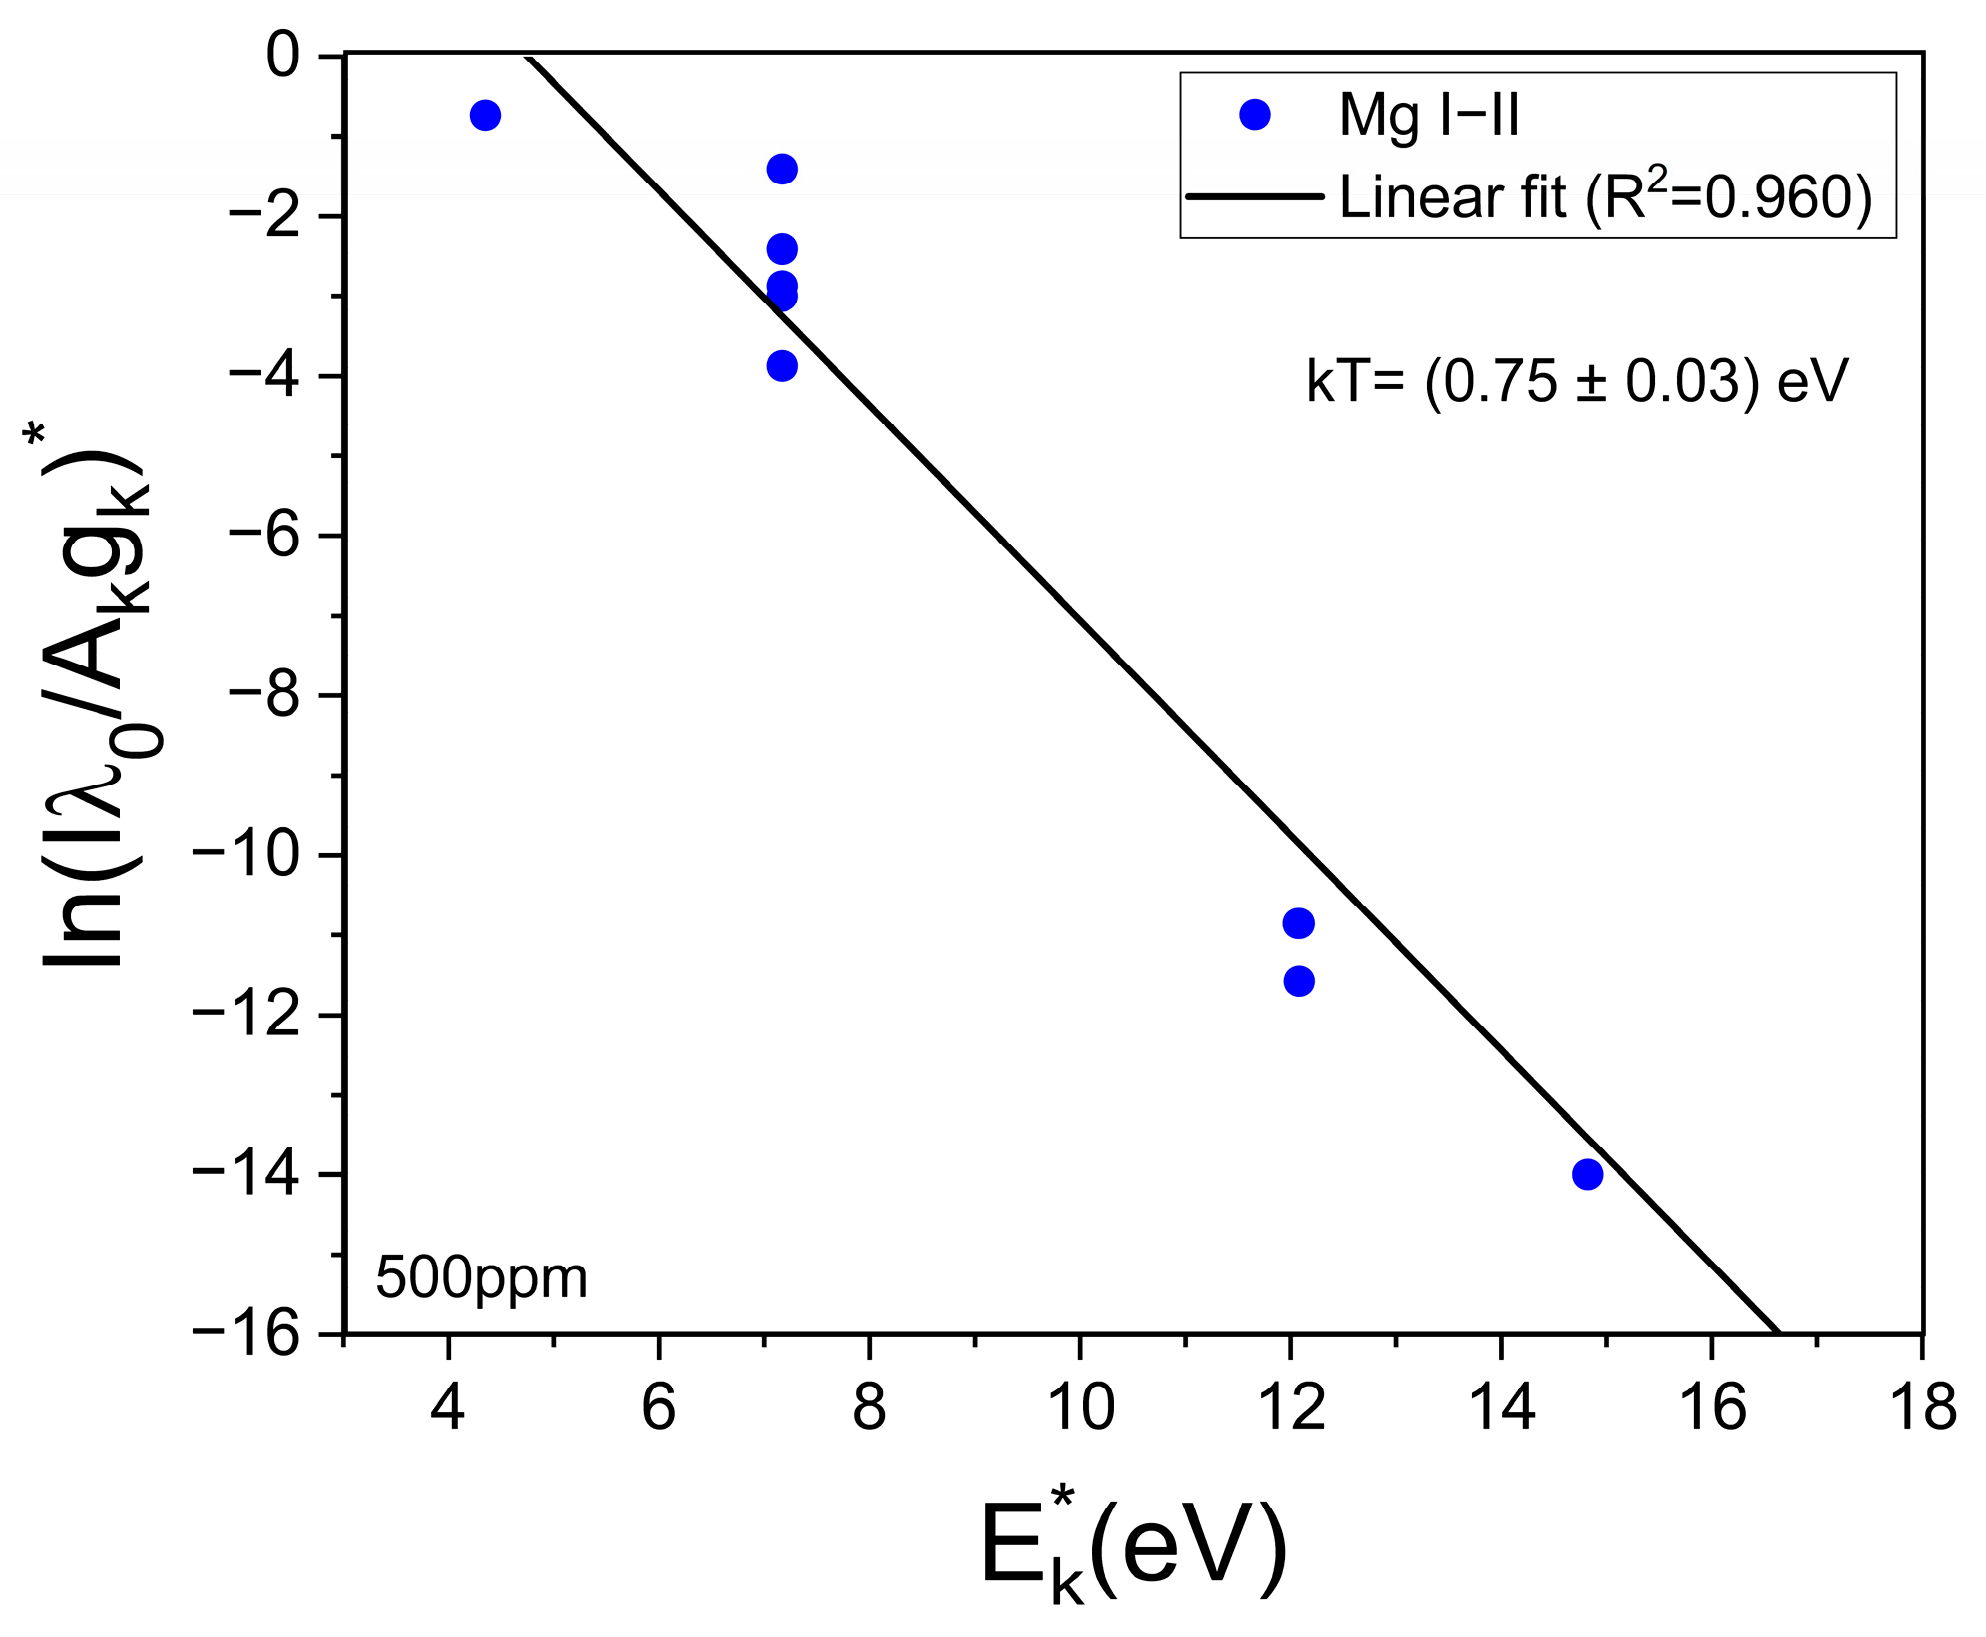
The obtained mean value of electron density was Ne = (1.0 ± 0.1) × 1017 cm−3. This value is well above the minimum density of Ne,0 = (1.4 ± 0.1) × 1016 cm−3 required by McWhirter’s criterion for LTE conditions [30]. It should be mentioned that, despite McWhirter’s criterion being satisfied for all the measured transitions, suggesting that LTE may exist, it is a necessary but not sufficient condition. The plasma temperature (kT [eV]) was obtained through a Saha–Boltzmann plot constructed with a set of selected Mg I–II emission lines having wavelengths in the range 2775–2855 Å (Figure 4) and with available spectroscopic data in the NIST Atomic Spectra Database [31] (Table 1). Self-absorption of these Mg I–II lines is low to moderate, thus they can be used to perform a reliable plasma characterization [20]. An example of a Saha–Boltzmann plot is shown in Figure 5. The obtained mean value for the plasma temperature was kT = (0.75 ± 0.03) eV. The kT and Ne parameters obtained for the different samples were the same within the experimental error; hence, matrix effects were negligible in our experiment. The electron density and temperature values were derived from the measurement of spectral lines integrated along a time interval as well as along the line of sight from a near-homogeneous plasma. Hence, these plasma parameters corresponded to apparent values, as a result of population-averaged values over the real spatial-temporal distribution of the species emissivity [32].
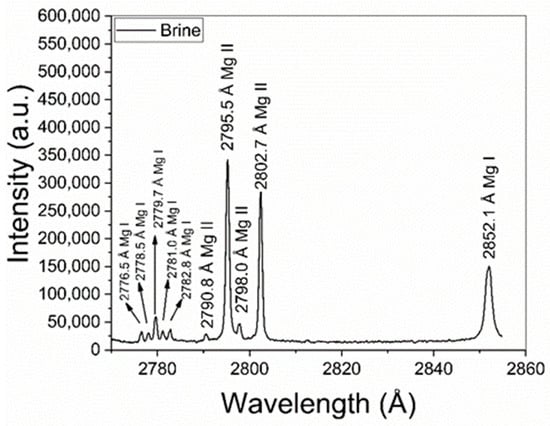
Figure 4.
Mg I–II emission lines used for calculation of the plasma temperature via the Saha–Boltzmann plot (sample: Reference Li 500 ppm).

Table 1.
Spectral lines used for plasma characterization (Mg I–II and H I) and compositional analysis (Li I). Spectroscopic data from NIST Database [31].
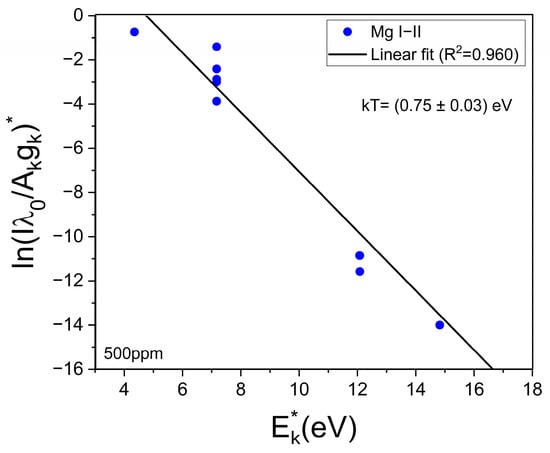
Figure 5.
Example of the Saha–Boltzmann plot constructed with the Mg I–II lines (Table 1). The calculated temperature (kT) is shown (sample: reference Li 500 ppm).
4.2. Plasma Analysis of Li Spectral Emission with τ–Algorithm
The experimental line profiles (pre-processed) were analyzed by the τ–algorithm, a self-designed computational algorithm developed in Python® (Version 3.13.1). In the following, we review briefly the theory supporting the τ–algorithm framework, which has been described in more detail in a previous work [21]. The τ–algorithm is based on the framework of a homogeneous plasma in LTE. It is aimed at extracting the spectroscopic information saved in the optical thickness of the line of interest, such as self-absorption evaluation/compensation. The retrieved information is very useful for plasma characterization and to achieve quantitative results. Basically, it models the emission line shapes and matches them to the experimental lines through an iterative fitting procedure. The fitting routine runs until the deviation of the synthetic from the experimental spectrum is minimized. Hence, a modeled line profile that reproduces the measurements is obtained along with its wavelength-dependent optical thickness τλ (τ0, wV), where τ0 is the maximum and wV is the full width at half maximum (FWHM). The coefficient SAl (Equation (5)) is evaluated, and the experimental profile is subsequently compensated for self-absorption, retrieving the optically thin line profile. The calculation time is less than 10 s for each individual line.
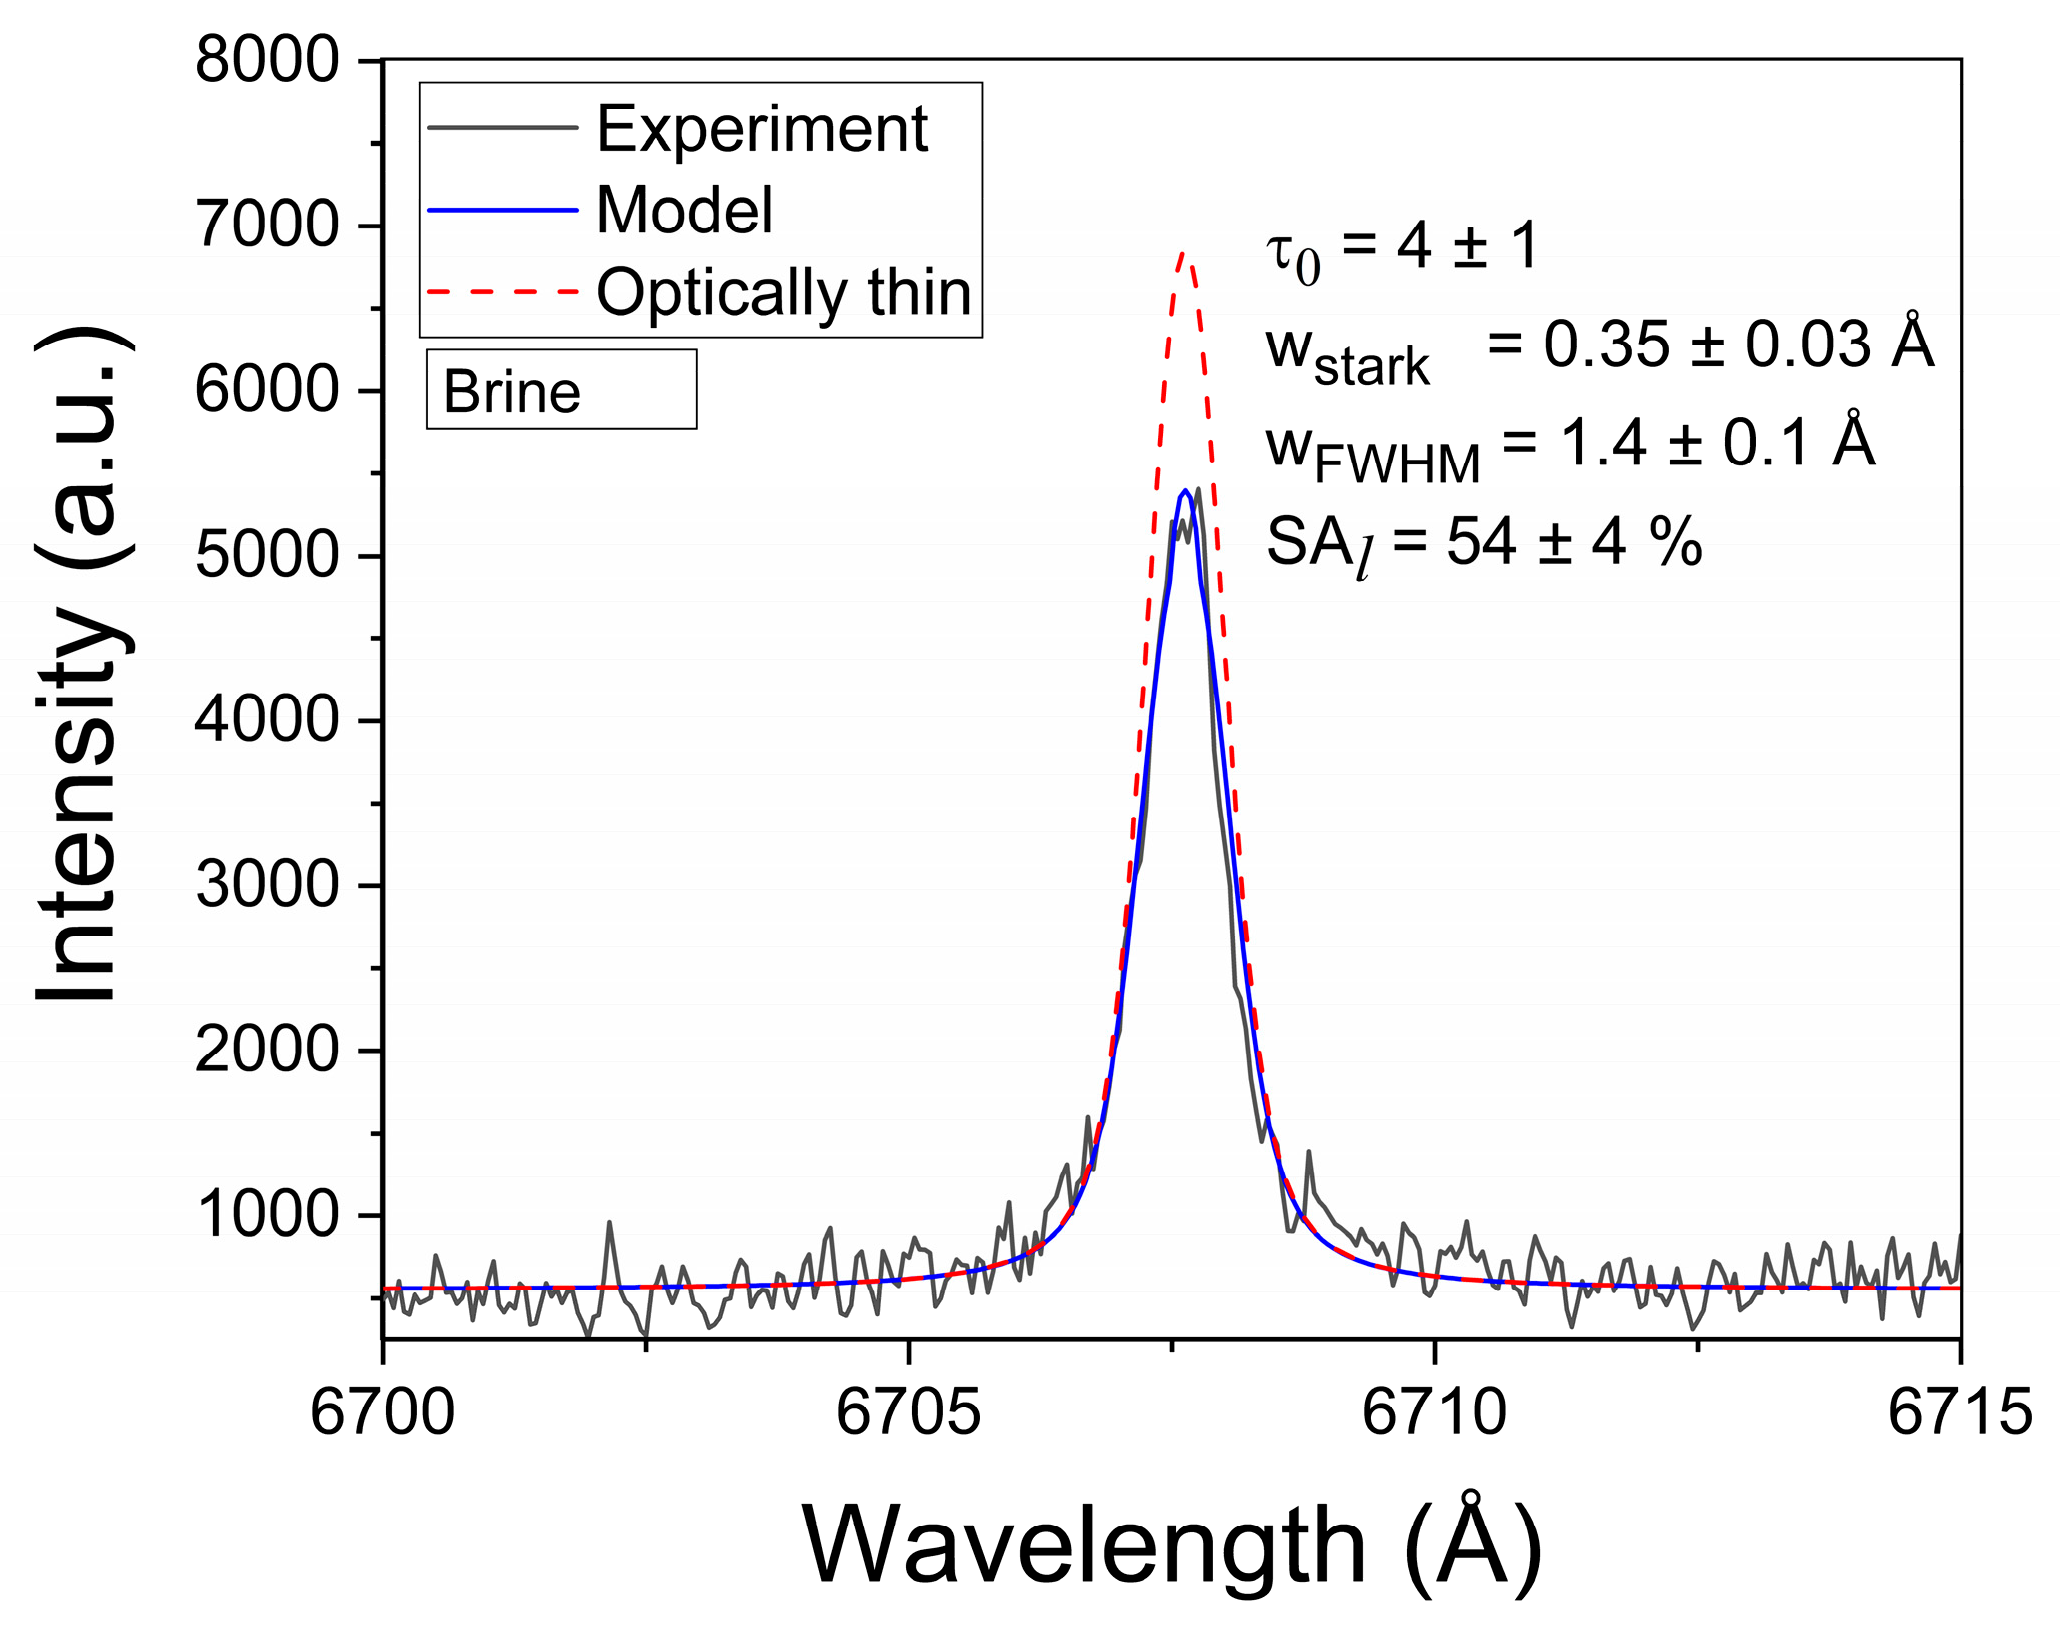
The normalized line profile P(λ) in Equation (2) is represented by a Voigt function with Gaussian and Lorentzian widths corresponding to the Doppler and Stark effects, respectively. The Doppler width, being a fixed parameter, was estimated from the plasma temperature (wDoppler = 0.17 Å). The Stark width (wStark) is a free-fitting parameter. The true line shape Iλ (Equation (1)) is convolved with the instrumental function to compute the experimental line profile. Due to the Li I line being self-reversed at the late time window, the instrumental width (FWHM) was estimated from the adjacent Ca I spectral line at 6717.7 Å (wInstr = 0.66 ± 0.03 Å). In the τLIBS approach, the intensities of all the Li I lines from both the reference and brine samples were computed with the τ–algorithm and matched to their experimental profiles. A representative example of a modeled Li I line is shown in Figure 6. The results obtained from the analysis of the Li I lines are reported in Table A1 (Appendix A).
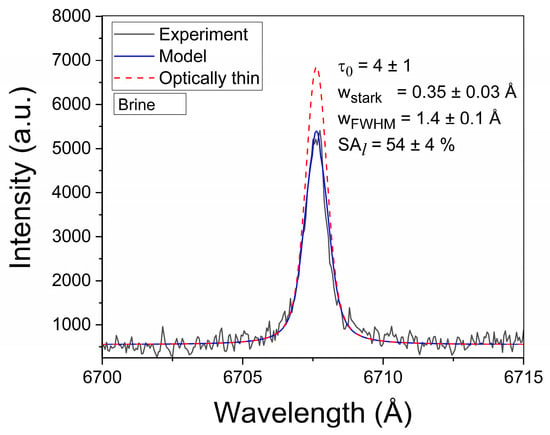
Figure 6.
Example of the experimental Li I 6707.7 Å spectral line. The model and optically thin profiles are shown. The obtained line parameters are also included (sample: Brine #3).
4.3. Quantitative Li Analysis
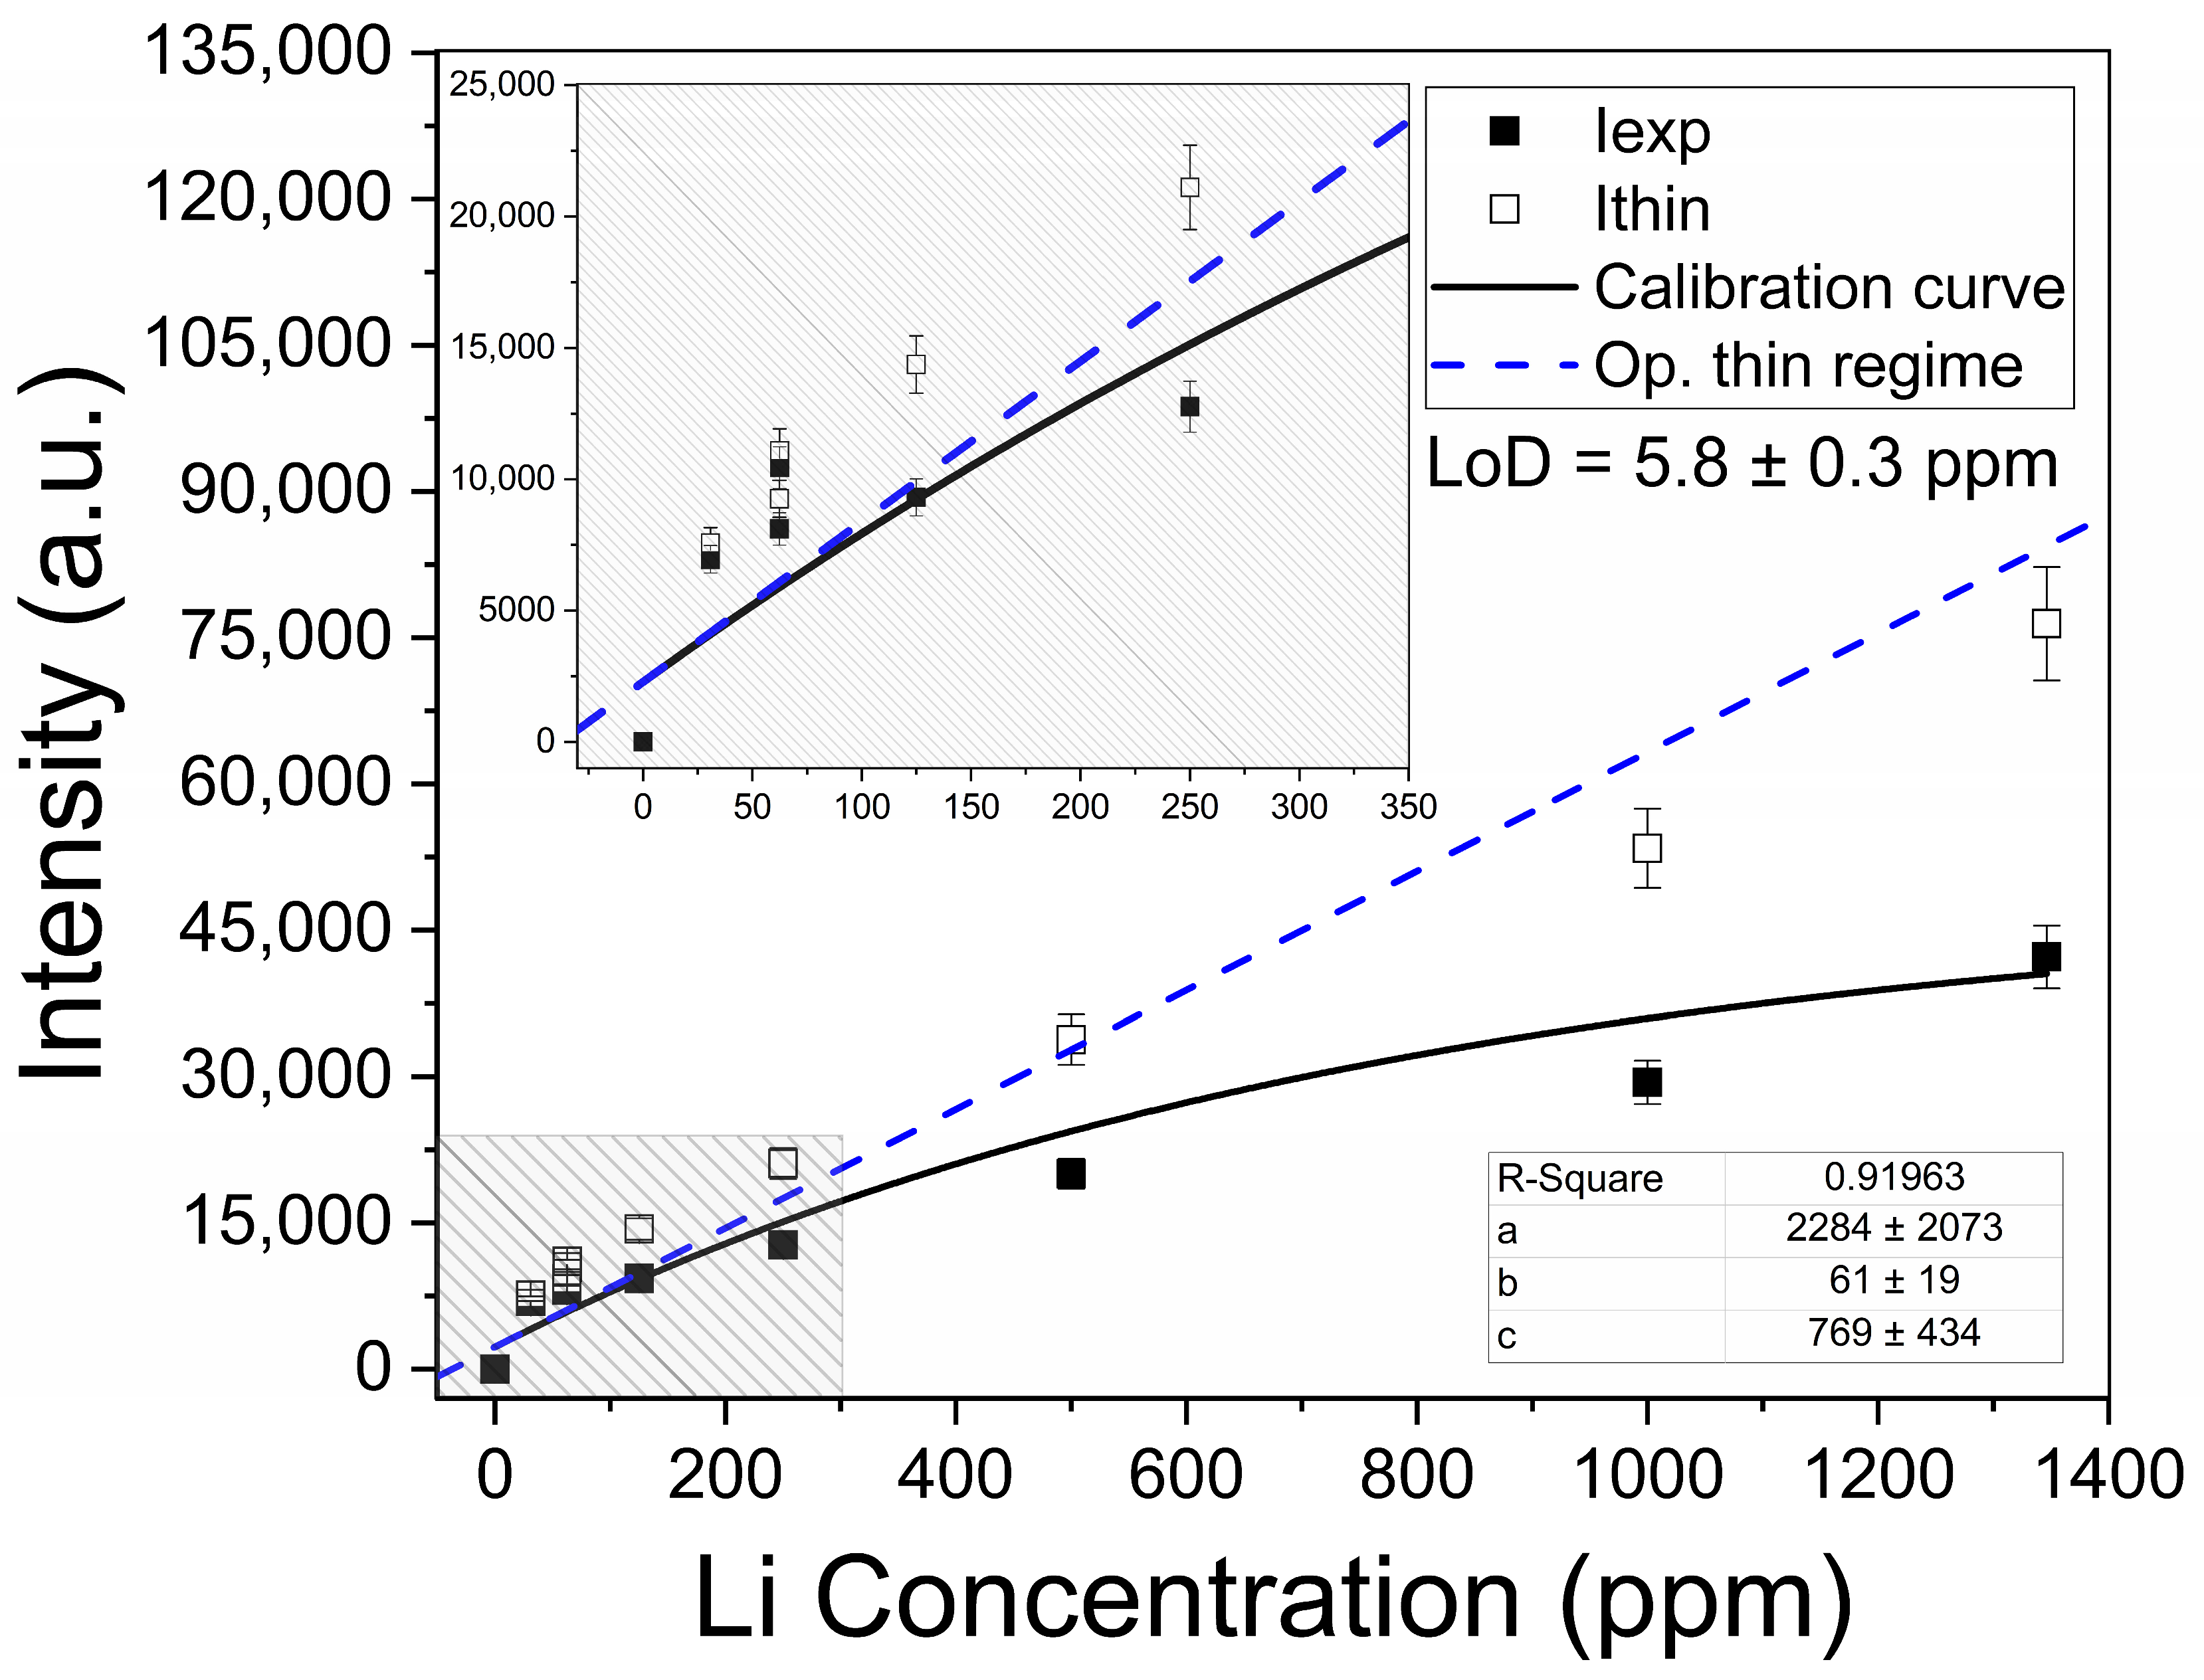
The determination of the Li elemental content in the brines was carried out by the univariate calibration method with the Li I line at Li I 6707.7 Å. In Figure 7, the Li I net intensities (wavelength-integrated) measured from the calibration samples are plotted against the corresponding Li concentrations. A linear growth of the emitted intensity is observed at low concentrations, while saturation is observed at higher concentrations, suggesting that self-absorption effects become more important. The experimental data were fitted with the non-linear function:
where x is the Li concentration; y is the line net intensity; and a, b, and c are the constant fitting parameters [33]. For low concentrations (x ≪ c), Equation (7) is reduced to the linear form:
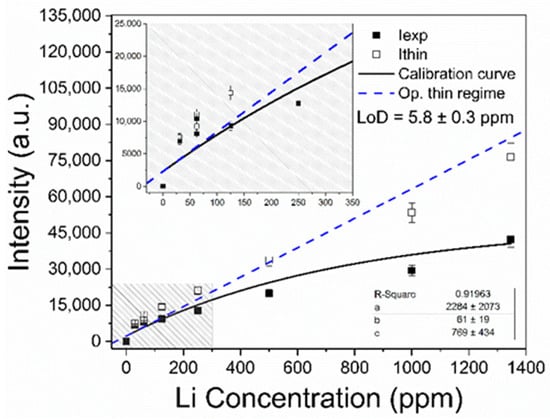
Figure 7.
Calibration curve for Li content constructed with the Li I 6707.7 Å line. The obtained values for the fitting parameters (a, b, and c, Equation (7)), and the calculated limit of detection (LoD, Equation (9)) for Li in brines are shown. Inset: Linear trend for low Li concentrations.
Physically, a is the line intensity related to zero concentration of the analyte (i.e., a ≈ 0); b is the sensitivity, given by the slope of Equation (7) in the low concentration region; and c refers to the concentration at which self-absorption of the line becomes noticeable. In our experiment, a linear growth is observed for low Li concentrations (x ≤ 700 ppm), where the plasma is optically thin. After that, self-absorption starts to increase at Li concentrations close to xc = 770 ppm. Then, self-absorption is clearly evident for higher Li concentrations (x ≥ 800 ppm) as the plasma becomes optically thick. The negative value obtained at the x-axis (i.e., y = 0 and x0 = − a/b) indicated that an initial concentration of Li (x0Li = 16.4 ± 0.2 ppm) was measured in the sample matrix as an impurity and taken into account in the calibration samples.
The limit of Li detection (LoD), defined as the concentration that results in a net line intensity equivalent to three times the standard deviation of the background, was calculated with the following expression:
with being the standard deviation of the background signal measured close to the line for low concentrations, and b being the slope of the linear fit [34]. In our experimental conditions, the limit of detection determined for Li was LoD = 5.8 ± 0.3 ppm. The Li emission intensities were compensated for self-absorption through Equation (4) to obtain the intensities emitted in optically thin plasma conditions (Ithin), as shown in Figure 7. It is observed that the compensated intensities fit well with the predictions of Equation (8), within the experimental error. Nevertheless, for Li concentrations higher than about ≥1000 ppm, the optically thin intensities are lower than the values predicted by the model. As already described in our previous work [21] and also by Aragón and Aguilera [35], this establishes a limit of validity for the model of a homogeneous plasma. In fact, the model is not able to account satisfactorily for the high concentration region of calibration curves where the plasma cannot be considered as homogeneous.
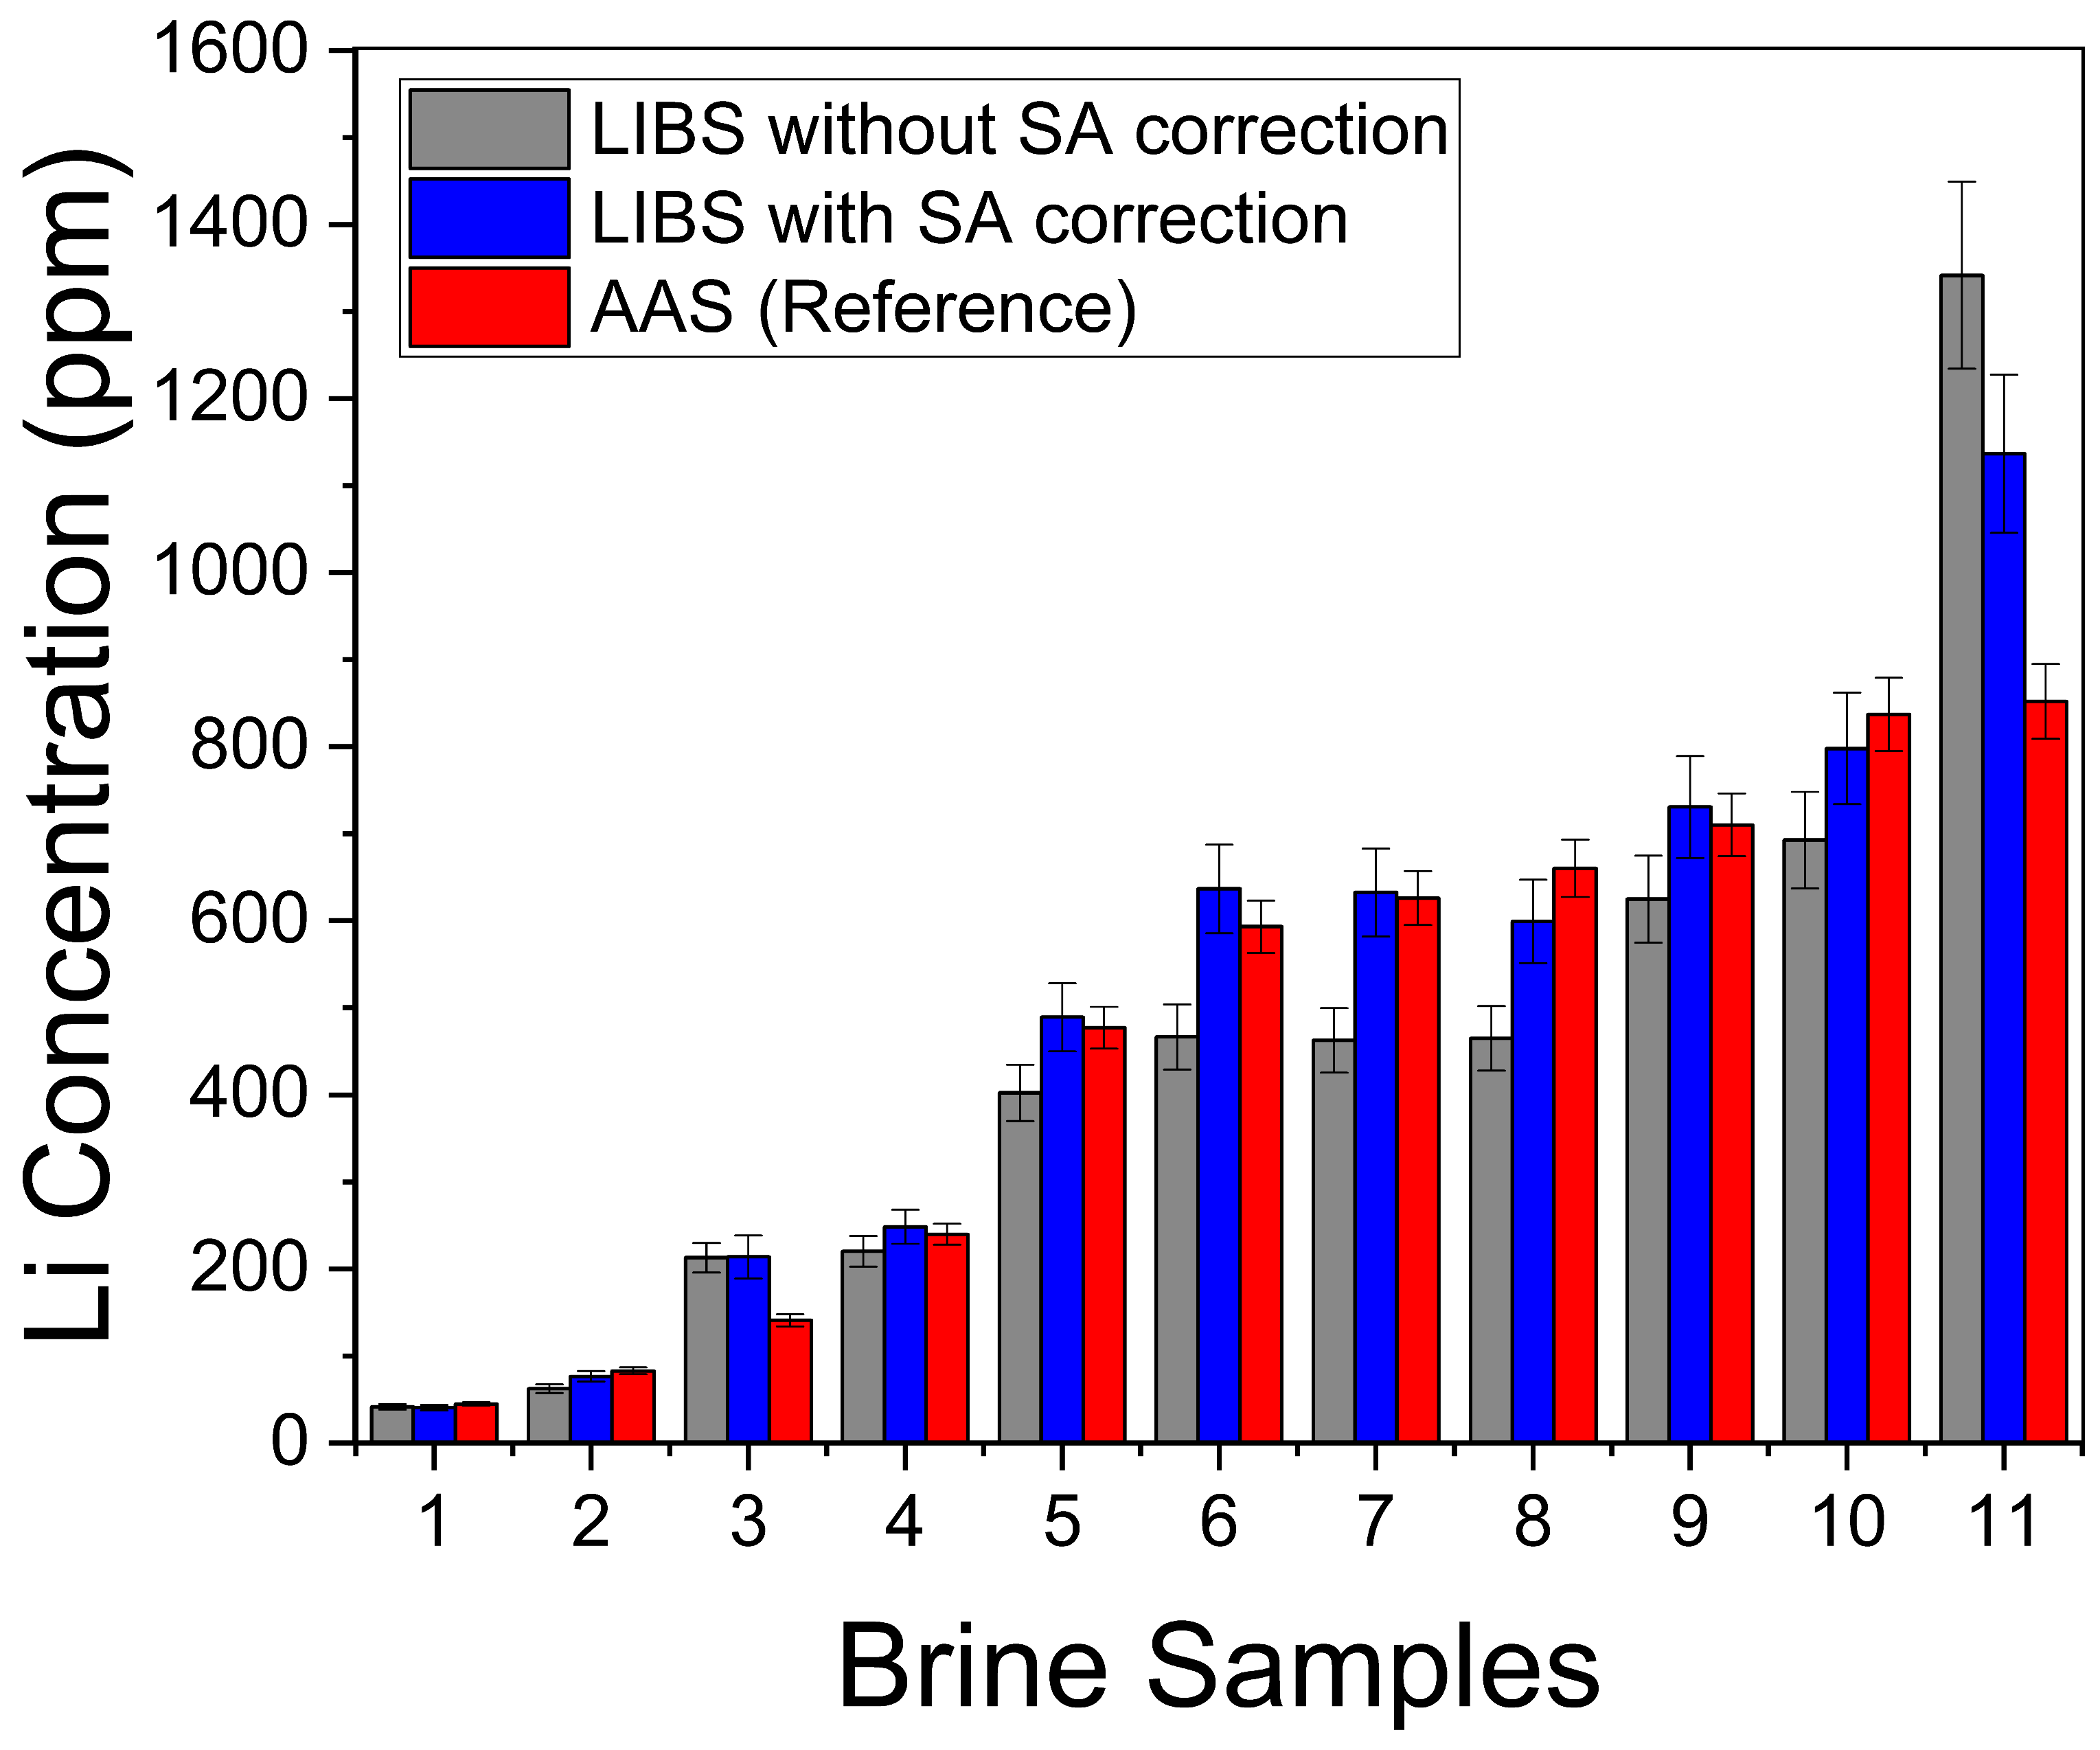
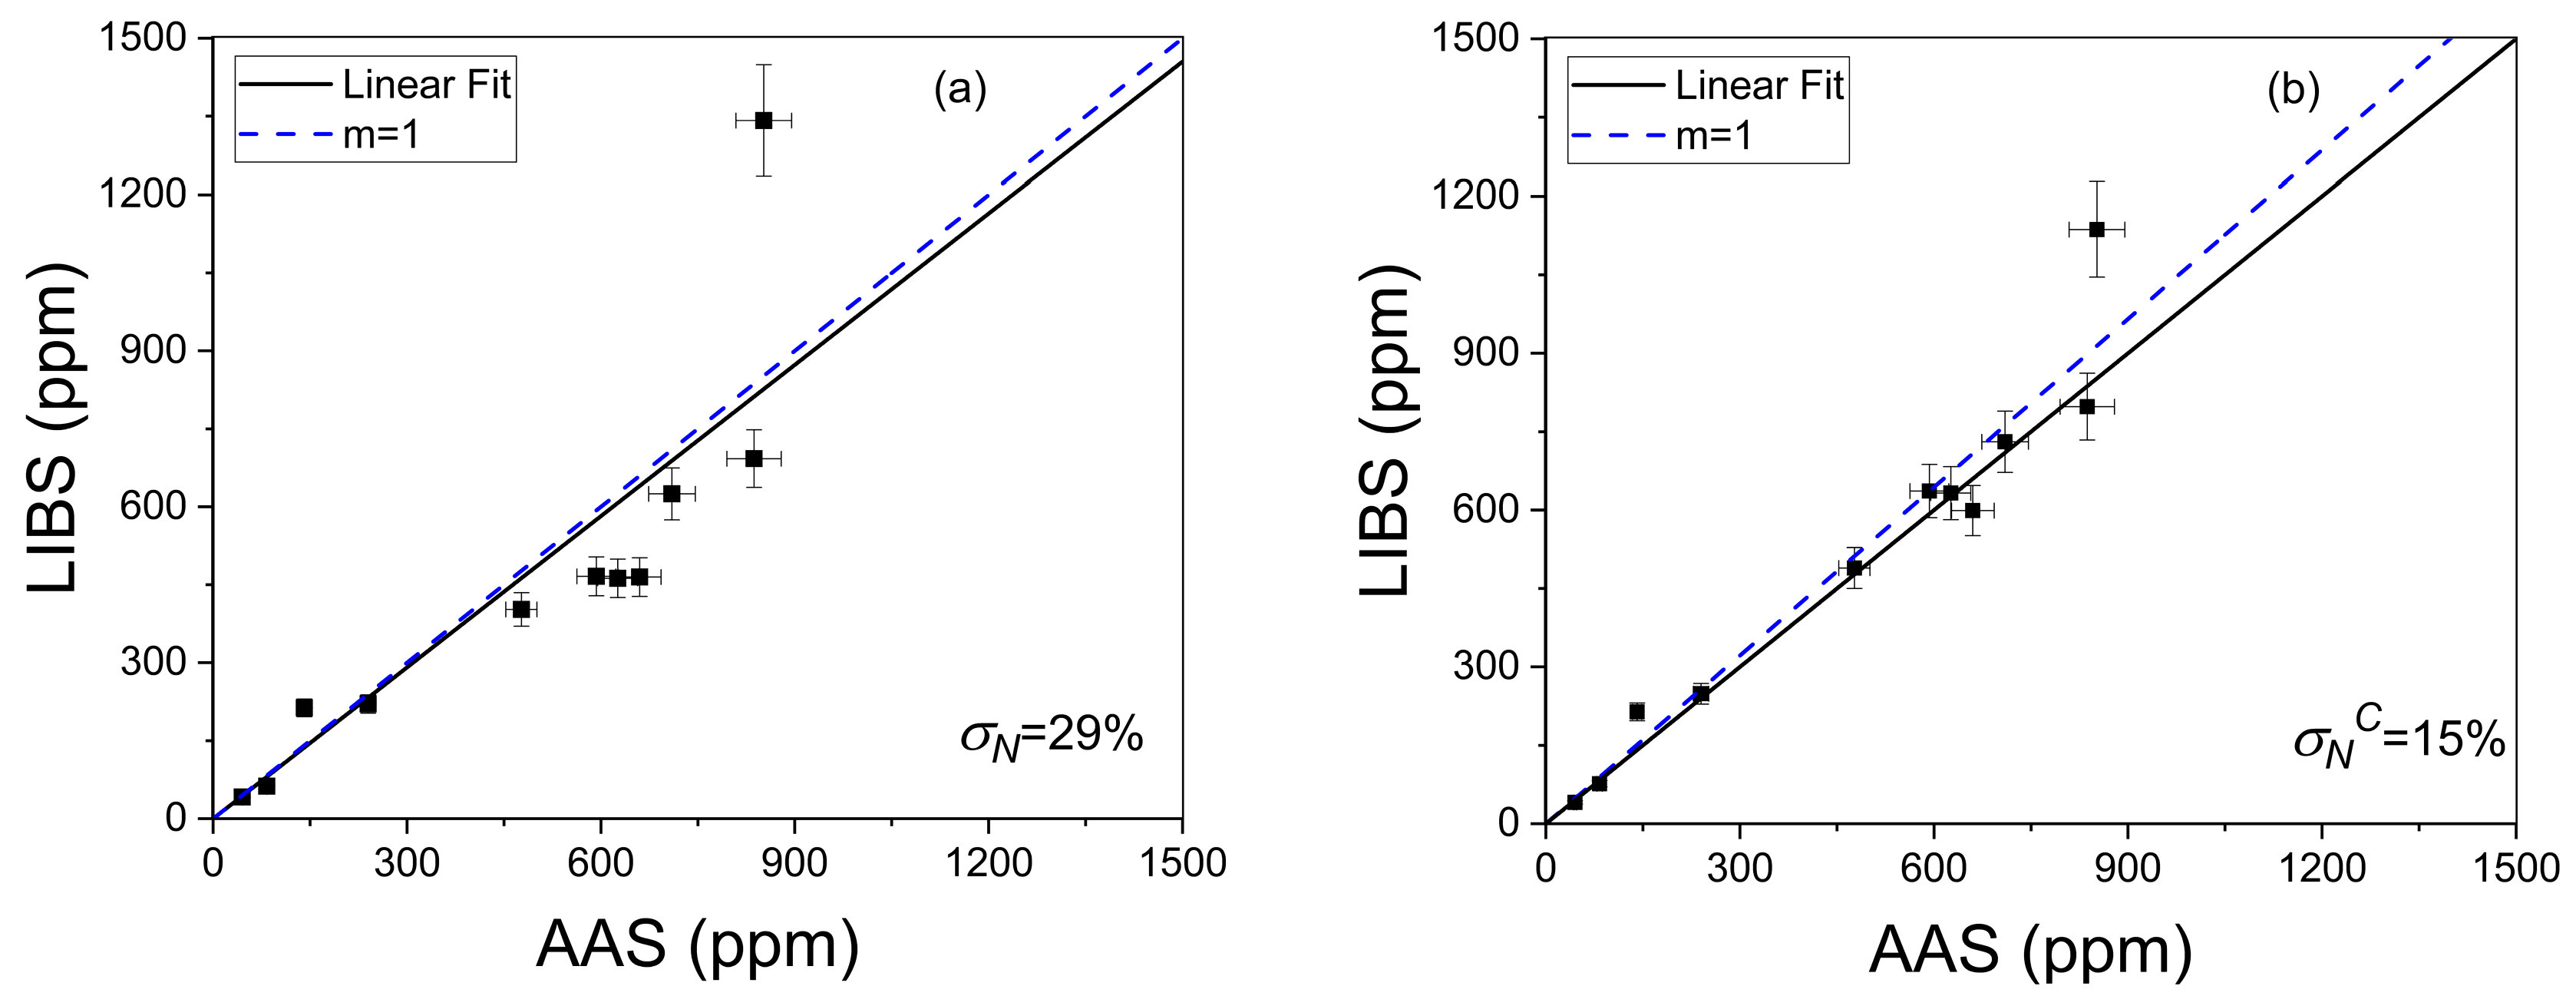
The Li concentrations (ppm) determined with LIBS in the natural brines with and without self-absorption (SA) compensation of the intensity data, together with the reference AAS values, are presented in Table 2 and compared in Figure 8. It can be seen that all the results are qualitatively similar for the different brine samples, evidencing a consistency between the different approaches.

Table 2.
Li concentrations determined in brines by LIBS (without/with self-absorption (SA) compensation) and AAS techniques.
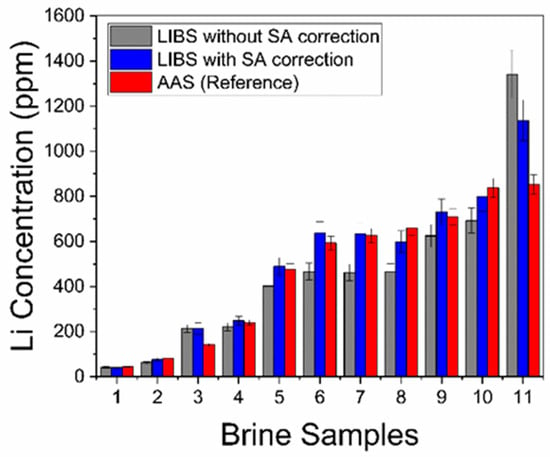
Figure 8.
Comparison of Li concentrations in Table 2.
The overall accuracy of the LIBS methodology both with and without self-absorption compensation was evaluated by the averaged quantification error calculated as the normalized standard deviation σN (%),
where qLIBS and qAAS are the Li concentration values calculated with LIBS and AAS techniques, respectively, and n is the number of samples (i.e., n = 11) [36]. The accuracy of σN = 29% (Figure 9a) obtained for the LIBS data without compensation was enhanced to σNc = 15% (Figure 9b) after applying the self-absorption compensation, thus improving the quantitative results.
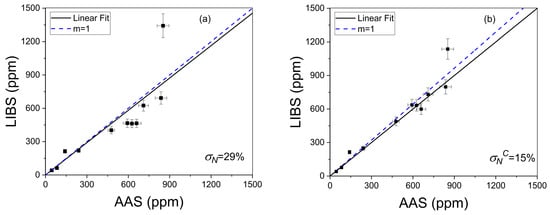
Figure 9.
Crosscheck of LIBS without (a) and with (b) self-absorption compensation. The calculated averaged quantification errors (σN%, σNC%) are shown. The dotted line corresponds to the ideal situation (m = 1).
5. Conclusions
The synergy between LIBS and the τ–algorithm (τLIBS) enabled the successful application of this spectroscopic technique for the quantitative elemental analysis of Li in natural brines collected from the Lithium Triangle. The samples were prepared as solid pellets to overcome the inherent challenges associated with liquid samples in LIBS. An optimal time of measurement was selected, ensuring that self-reversal was not observed in the experimental line shapes, i.e., a dip in the line center, and thus a near-homogeneous plasma was achieved. In these conditions, the influence of spatial gradients in temperature and species densities on the line profiles was minimized. The laser-induced plasma was characterized by calculating its temperature and electron density. High-spectral-resolution measurements were performed on the emission intensity profiles of the Li I line at 6707.7 Å for both calibration and analytical brines. Individual analysis of the Li line shapes allowed the evaluation and subsequent compensation of self-absorption. A univariate calibration procedure was applied to the experimental data. The resulting calibration curve exhibited a linear behavior at low Li concentrations, where the plasma was optically thin with a minimal self-absorption of 26%. As Li concentrations increased, the curve reached saturation due to the plasma becoming optically thick, with strong self-absorption reaching 84%. The initial quantitative results, without self-absorption compensation, demonstrated a general accuracy of 29% when compared to the conventional AAS technique. For the highest Li concentrations, the homogeneous plasma model proved inadequate for accurately describing the self-absorption-compensated data. However, incorporating self-absorption compensation provided by the τ–algorithm significantly improved the analytical accuracy of the LIBS results to 15%. This demonstrated the critical importance of self-absorption compensation for achieving precise and accurate quantitative analysis in LIBS, particularly at high analyte concentrations. In future work, additional analytical evaluations with a larger number of samples should compare external calibration with standard addition and matrix-matched synthetic brines, perform more relevant statistical tests, and apply machine learning methods.
Author Contributions
Conceptualization, J.M.M., D.M.D.P., C.C.-V., C.A. and J.A.A.; methodology, J.M.M., D.M.D.P. and C.C.-V.; software, J.M.M. and D.M.D.P.; validation, J.M.M., D.M.D.P. and C.C.-V.; formal analysis, J.M.M., D.M.D.P., C.C.-V., C.A. and J.A.A.; investigation, J.M.M., D.M.D.P., C.C.-V., C.A. and J.A.A.; resources, J.M.M., D.M.D.P., C.C.-V., C.A. and J.A.A.; data curation, J.M.M. and D.M.D.P.; writing—original draft preparation, J.M.M. and D.M.D.P.; writing—review and editing, J.M.M., D.M.D.P., C.C.-V., C.A. and J.A.A.; visualization, J.M.M., D.M.D.P., C.C.-V., C.A. and J.A.A.; supervision, D.M.D.P. and C.C.-V. All authors have read and agreed to the published version of the manuscript.
Funding
This work was funded by an External Postdoctoral grant from CONICET (DDP) and a grant from the Asociación Universitaria Iberoamericana de Postgrado, AUIP (JMM).
Institutional Review Board Statement
Not applicable.
Informed Consent Statement
Not applicable.
Data Availability Statement
The data analyzed in this manuscript may be shared upon reasonable request.
Acknowledgments
This work was supported by the Consejo Nacional de Investigaciones Científicas y Técnicas (CONICET) of Argentina and also funded through an External Postdoctoral grant from CONICET (DDP) and a grant from the Asociación Universitaria Iberoamericana de Postgrado, AUIP (JMM).
Conflicts of Interest
The authors declare no conflicts of interest.
Appendix A

Table A1.
Calculated spectroscopic parameters for 6707.7 Å Li I line with τ–algorithm: Experimental intensity (Itot), optically thin intensity (Ithin), maximum optical thickness (τ0), line self-absorption coefficient expressed as a percentage (SAl), and Stark width (wStark).
Table A1.
Calculated spectroscopic parameters for 6707.7 Å Li I line with τ–algorithm: Experimental intensity (Itot), optically thin intensity (Ithin), maximum optical thickness (τ0), line self-absorption coefficient expressed as a percentage (SAl), and Stark width (wStark).
| Li | Sample | Itot (a.u.) | Ithin (a.u.) | τ0 (adim.) | SAl (%) | wStark (Å) |
|---|---|---|---|---|---|---|
| Calibration | 30.83 ppm | 6950 ± 530 | 7575 ± 580 | 1 ± 1 | 26 ± 2 | 0.39 ± 0.05 |
| 62.4 ppm | 8110 ± 620 | 9253 ± 700 | 2 ± 1 | 39 ± 3 | 0.35 ± 0.03 | |
| 62.5 ppm | 10,440 ± 790 | 11,073 ± 840 | 2 ± 1 | 44 ± 4 | 0.35 ± 0.03 | |
| 125 ppm | 9311 ± 700 | 14,365 ± 1000 | 4 ± 1 | 54 ± 4 | 0.35 ± 0.03 | |
| 250 ppm | 12,760 ± 970 | 21,110 ± 1600 | 7 ± 2 | 65 ± 5 | 0.35 ± 0.03 | |
| 500 ppm | 20,030 ± 1500 | 33,788 ± 2500 | 8 ± 2 | 69 ± 6 | 0.33 ± 0.03 | |
| 1000 ppm | 29,420 ± 2200 | 53,409 ± 4000 | 27 ± 5 | 84 ± 7 | 0.35 ± 0.03 | |
| 1346 ppm | 42,260 ± 3200 | 76,444 ± 5800 | 21 ± 4 | 82 ± 7 | 0.33 ± 0.03 | |
| Brines | # 1 | 4756 ± 360 | 4768 ± 370 | 1 ± 1 | 1 ± 1 | 0.35 ± 0.03 |
| # 2 | 5942 ± 450 | 6952 ± 530 | 1 ± 1 | 18 ± 1 | 0.40 ± 0.05 | |
| # 3 | 13,640 ± 1000 | 15,005 ± 1100 | 4 ± 1 | 54 ± 4 | 0.35 ± 0.03 | |
| # 4 | 13,990 ± 1000 | 17,451 ± 1300 | 3 ± 1 | 24 ± 2 | 0.39 ± 0.05 | |
| # 5 | 21,410 ± 1600 | 32,115 ± 2440 | 3 ± 1 | 50 ± 4 | 0.39 ± 0.05 | |
| # 6 | 23,630 ± 1800 | 41,109 ± 3100 | 11 ± 3 | 74 ± 6 | 0.35 ± 0.03 | |
| # 7 | 23,500 ± 1800 | 40,861 ± 3100 | 11 ± 3 | 74 ± 6 | 0.35 ± 0.03 | |
| # 8 | 23,580 ± 1800 | 38,824 ± 2900 | 7 ± 2 | 65 ± 5 | 0.39 ± 0.05 | |
| # 9 | 28,400 ± 2200 | 46,851 ± 3600 | 7 ± 2 | 65 ± 5 | 0.39 ± 0.05 | |
| # 10 | 30,160 ± 2300 | 50,958 ± 3900 | 9 ± 3 | 69 ± 5 | 0.39 ± 0.05 | |
| # 11 | 41,040 ± 3100 | 71,610 ± 5400 | 13 ± 3 | 74 ± 6 | 0.39 ± 0.05 |
References
- Miziolek, W.; Palleschi, V.; Schechter, I. Laser–Induced Breakdown Spectroscopy (LIBS) Fundamentals and Applications; Cambridge University Press: New York, NY, USA, 2006. [Google Scholar]
- Winefordner, J.D.; Gornushkin, I.B.; Correll, T.; Gibb, E.; Smith, B.W.; Omenetto, N. Comparing several atomic spectrometric methods to the super stars: Special emphasis on laser-induced breakdown spectrometry, LIBS, a future super star. J. Anal. At. Spectrom. 2004, 19, 1061–1083. [Google Scholar] [CrossRef]
- Flexer, V.; Baspineiro, C.F.; Galli, C.I. Lithium recovery from brines: A vital raw material for green energies with a potential environmental impact in its mining and processing. Sci. Total Environ. 2018, 639, 1188–1204. [Google Scholar] [CrossRef]
- Kesler, S.E.; Gruber, P.W.; Medina, P.A.; Keoleian, G.A.; Everson, M.P.; Wallington, T.J. Global lithium resources: Relative importance of pegmatites, brine and other deposits. Ore Geol. Rev. 2012, 48, 55–69. [Google Scholar] [CrossRef]
- Steinmetz, R.L.L.; Salvi, S. Brine grades in Andean salars: When basin size matters—A review of the Lithium Triangle. Earth Sci. Rev. 2021, 217, 103615. [Google Scholar] [CrossRef]
- BP. Statistical Review of World Energy, 71st ed. 2022. Available online: https://www.bp.com/statisticalreview (accessed on 3 September 2024).
- Steinmetz, R.L.; Salvi, S.; García, M.G.; Arnold, Y.J.P.; Béziat, D.; Franco, G.; Constantini, O.; Córdoba, F.E.; Caffe, P.J. Northern Puna Plateau-scale survey of Li brine-type deposits in the Andes of NW Argentina. J. Geochem. Explor. 2018, 190, 26–38. [Google Scholar] [CrossRef]
- Alessia, A.; Alessandro, B.; Maria, V.G.; Carlos, V.A.; Francesca, B. Challenges for sustainable lithium supply: A critical review. J. Clean. Prod. 2021, 300, 126954. [Google Scholar] [CrossRef]
- Balaram, V.; Santosh, M.; Satyanarayanan, M.; Srinivas, N.; Gupta, H. Lithium: A review of applications, occurrence, exploration, extraction, recycling, analysis, and environmental impact. Geosci. Front. 2024, 15, 101868. [Google Scholar] [CrossRef]
- Tabelin, C.; Dallas, J.; Casanova, S.; Pelech, T.; Bournival, G.; Saydam, S.; Canbulat, I. Towards a low-carbon society: A review of lithium resource availability, challenges and innovations in mining, extraction and recycling, and future perspectives. Miner. Eng. 2021, 163, 106743. [Google Scholar] [CrossRef]
- Swain, B. Recovery and recycling of lithium: A review. Sep. Purif. Technol. 2017, 172, 388–403. [Google Scholar] [CrossRef]
- García, L.V.; Ho, Y.C.; Myo Thant, M.M.; Han, D.S.; Lim, J.W. Lithium in a Sustainable Circular Economy: A Comprehensive Review. Processes 2023, 11, 418. [Google Scholar] [CrossRef]
- Hahn, D.W.; Omenetto, N. Laser–induced breakdown spectroscopy (LIBS), part I: Review of basic diagnostics and plasma-particle interactions: Still-Challenging Issues within the Analytical Plasma Community. Appl. Spectrosc. 2010, 64, 335A–366A. [Google Scholar] [CrossRef]
- Ytsma, C.R.; Dyar, M.D. Accuracies of lithium, boron, carbon, and sulfur quantification in geological samples with laser-induced breakdown spectroscopy in Mars, Earth, and vacuum conditions. Spectrochim. Acta Part B 2019, 162, 105715. [Google Scholar] [CrossRef]
- Ferreira, M.F.S.; Capela, D.; Silva, N.A.; Gonçalves, F.; Lima, A.; Guimaraes, D.; Jorge, P.A.S. Comprehensive comparison of linear and non-linear methodologies for lithium quantification in geological samples using LIBS. Spectrochim. Acta Part B 2022, 195, 106504. [Google Scholar] [CrossRef]
- Galli, E.; Massa, M.; Zanoletti, A.; De Iuliis, S.; Bontempi, E.; Depero, L.E.; Palleschi, V.; Borgese, L. Determination of lithium concentration in black mass using laser-induced breakdown spectroscopy hand–held instrumentation. Sci. Rep. 2025, 15, 17483. [Google Scholar] [CrossRef] [PubMed]
- St-Onge, L.; Kwong, E.; Sabsabi, M.; Vadas, E.B. Rapid analysis of liquid formulations containing sodium chloride using laser-induced breakdown spectroscopy. J. Pharm. Biomed. Anal. 2004, 36, 277–284. [Google Scholar] [CrossRef] [PubMed]
- Erbetta, N.; Puebla, G.; Day, D.; Jennings, M.; Loureiro, A.; Green, C.; Gallardo, L.; Quiroz, W. Direct determination of lithium in brine samples using handheld LIBS without sample treatment: Sample introduction by venturi system. Anal. Methods 2024, 16, 7311–7318. [Google Scholar] [CrossRef]
- Xing, P.; Dong, J.; Yu, P.; Zheng, H.; Liu, X.; Hu, S.; Zhu, Z. Quantitative analysis of lithium in brine by LIBS based on convolutional neural network. Anal. Chim. Acta. 2021, 1178, 338799. [Google Scholar] [CrossRef]
- Molina, J.M.; Sarchi, C.; Tesio, A.Y.; Costa-Vera, C.; Díaz Pace, D.M. Quantitative Analysis of Lithium in Natural Brines from the Lithium Triangle by Laser-Induced Breakdown Spectroscopy. Atoms 2025, 13, 56. [Google Scholar] [CrossRef]
- Pace, D.M.D.; Molina, J.M. τ-algorithm for gathering spectroscopic information by modeling emission line shapes: Application to laser–induced plasmas. J. Opt. Soc. Am. B 2023, 40, C1–C7. [Google Scholar] [CrossRef]
- Zwicker, H. Evaluation of Plasma Parameters in Optically Thick Plasmas. In Plasma Diagnostics; Lochte–Holtgreven, W., Ed.; North-Holland Publishing: Amsterdam, The Netherlands, 1968; pp. 214–248. [Google Scholar]
- Moon, H.Y.; Herrera, K.K.; Omenetto, N.; Smith, B.W.; Winefordner, J.D. On the usefulness of a duplicating mirror to evaluate self-absorption effects in laser induced breakdown spectroscopy. Spectrochim. Acta Part B 2009, 64, 702–713. [Google Scholar] [CrossRef]
- Pace, D.M.D.; D’Angelo, C.A.; Bertuccelli, D.; Bertuccelli, G. Analysis of heavy metals in liquids using LIBS by liquid-to-solid matrix conversion. Spectrochim. Acta Part B 2006, 61, 929–933. [Google Scholar] [CrossRef]
- American Public Health Association. Standard Methods for the Examination of Water and Wastewater; American Public Health Association: Washington, DC, USA, 2023; pp. 16–17. [Google Scholar]
- Cowan, R.D.; Dieke, G.H. Self-absorption of Spectrum lines. Rev. Mod. Phys. 1948, 20, 418–455. [Google Scholar] [CrossRef]
- Tanra, I.; Pardede, M.; Karnadi, I.; Hedwig, R.; Suliyanti, M.M.; Lie, Z.S.; Ramli, M.; Abdulmadjid, S.N.; Khumaeni, A.; Kurniawan, D.P.; et al. In–Situ Lithium Analysis in MgLi Alloys Using Laser–Induced Breakdown Spectroscopy with a Compact Chamber. ChemPhysChem 2024, 25, e202300843. [Google Scholar] [CrossRef]
- Radziemski, L.J.; Loree, T.R.; Cremers, D.A.; Hoffman, N.M. Time resolved laser-induced breakdown spectrometry of aerosols. Anal. Chem. 1983, 55, 1246–1252. [Google Scholar] [CrossRef]
- Gigosos, M.A.; Cardenoso, V. New plasma diagnosis tables of hydrogen Stark broadening including ion dynamics. J. Phys. B At. Mol. Opt. Phys. 1996, 29, 4795–4838. [Google Scholar] [CrossRef]
- McWhirter, R.W.P.; Huddlestone, R.H.; Leonard, S.L. (Eds.) Plasma Diagnostic Techniques; Academic Press: New York, NY, USA, 1965; Chapter 5; pp. 201–264. [Google Scholar]
- NIST Physical Measurement Laboratory. Atomic Spectra Database, version 5.10; NIST: Gaithersburg, MD, USA, 2022. Available online: https://www.nist.gov/pml/atomic-spectra-database (accessed on 7 July 2025).
- Aguilera, J.A.; Aragón, C. Characterization of a laser-induced plasma by spatially resolved spectroscopy of neutral atom and ion emissions. Spectrochim. Acta Part B 2004, 59, 1861–1876. [Google Scholar] [CrossRef]
- Díaz Pace, D.M.; D’Angelo, C.A.; Bertuccelli, G. Calculation of Optical Thicknesses of Magnesium Emission Spectral Lines for Diagnostics of Laser-Induced Plasmas. Appl. Spectrosc. 2011, 65, 1202–1212. [Google Scholar] [CrossRef]
- Sabsabi, M.; Cielo, P. Quantitative analysis of aluminum alloys by laser induced breakdown spectroscopy and plasma characterization. Appl. Spectrosc. 1995, 49, 499–507. [Google Scholar] [CrossRef]
- Aguilera, J.A.; Aragón, C. CSigma graphs: A new approach for plasma characterization in laser–induced breakdown spectroscopy. J. Quant. Spectrosc. Radiat. Transf. 2014, 149, 90–102. [Google Scholar] [CrossRef]
- Urruchua, F.C.; Fernández, M.A.; Jaworski, M.; Mendoza Zelis, P.; Olivelli, M.S.; Montes, M.L. Yerba mate waste: Transformation to magnetic composites for the adsorption of chemically diverse pollutants. J. Environ. Chem. Eng. 2023, 11, 110824. [Google Scholar] [CrossRef]
Disclaimer/Publisher’s Note: The statements, opinions and data contained in all publications are solely those of the individual author(s) and contributor(s) and not of MDPI and/or the editor(s). MDPI and/or the editor(s) disclaim responsibility for any injury to people or property resulting from any ideas, methods, instructions or products referred to in the content. |
© 2025 by the authors. Licensee MDPI, Basel, Switzerland. This article is an open access article distributed under the terms and conditions of the Creative Commons Attribution (CC BY) license (https://creativecommons.org/licenses/by/4.0/).

