
Effects of a Late Gravitational Transition on Gravitational Waves and Anticipated Constraints


Abstract
1. Introduction
- Early time models [12,13,14,15,16] (see also [17] for a review) that implement new degrees of freedom (e.g., Early Dark energy [12,13,14,18], New Early Dark Energy [15,16], etc.) to decrease the scale of the sound horizon at recombination. This scale can be used as a standard ruler to measure the Hubble parameter [19,20] after calibration from the CMB angular power spectrum peak locations [1]. These models, however, have two problems: 1. They require significant fine tuning in order to avoid conflict with cosmological observations after the time of recombination [21,22]. 2. They should also decrease the horizon scale at the time of equal time matter and radiation density, which can also be calibrated using the matter power spectrum [23,24].
- Late time models [25,26,27,28,29,30,31,32,33] that attempt to deform the Planck 18 best-fit CDM form of the Hubble free expansion rate between the time of recombination and the present time so that the present-time value becomes consistent with the SH0ES best-fit value [10]. The problem of this class of models is that the significant level of deformation needed is not consistent with a wide range of other observations constraining the form of like BAO and SnIa data [34,35,36,37].
- Ultra-late time models [36,38,39,40,41,42] that investigate the possible presence of either an unaccounted-for systematic effect and/or a change in the fundamental physics taking place during the last (redshift ) when the calibration of standard candles like SnIa is performed [11]. The problems of this class of models includes fine tuning since the change in physical laws should not only occur at very late times but also should be consistent with other local observations [43].
2. Evolving Gravitational Constant and Gravitational Waves in a Cosmological Background
2.1. Effective Gravitational Strength in Scalar–Tensor Theories with a Gravitational Transition
2.2. Luminosity Distance from Gravitational Waves in Modified Gravity
- Modifications to the cosmological expansion history: Some modified gravity theories predict a different cosmic expansion history compared to general relativity, which can lead to changes in the luminosity distance–redshift relationship. As a result, the measured luminosity distance using gravitational waves may differ in these theories [95].
- Additional gravitational-wave polarization modes: In some modified gravity theories, gravitational waves can have additional polarization modes [96], such as scalar or vector modes, in addition to the standard tensor modes found in general relativity. The presence of these additional modes can affect the amplitude and phase evolution of the gravitational-wave signal, leading to a different measured luminosity distance.
- Propagation effects: The propagation of gravitational waves in modified gravity theories can be affected by changes in the effective gravitational constant or the presence of additional fields. These effects can alter the gravitational-wave amplitude and, consequently, the inferred luminosity distance [93,97].
- The energy carried by gravitational waves is proportional to the square of the amplitude of the wave, which, in turn, is proportional to the time-varying effective gravitational constant .
- The energy carried by electromagnetic waves is not affected by the time-varying effective gravitational constant, as it is primarily determined by the electromagnetic interaction.
2.3. Gravitational Waves in an Expanding Universe
- : Dust
- : Radiation
- : Curvature or cosmic strings
- : Domain walls
- : Vacuum energy
2.4. The Imprints of a Sudden Cosmological Singularity
2.5. Effects of a Gravitational Transition: A -Function Impulse
2.6. Numerical Solutions
3. Observational Constraints on the Transition Amplitude from Gravitational Waves and Other Cosmological Data
3.1. Monte Carlo Data: Cosmological Parameters from the Einstein Telescope
3.2. Real Data: BAO+CMB
3.2.1. CMB Measurements
3.2.2. BAO Measurements
3.3. Real Data: Pantheon+
3.4. Combined Data
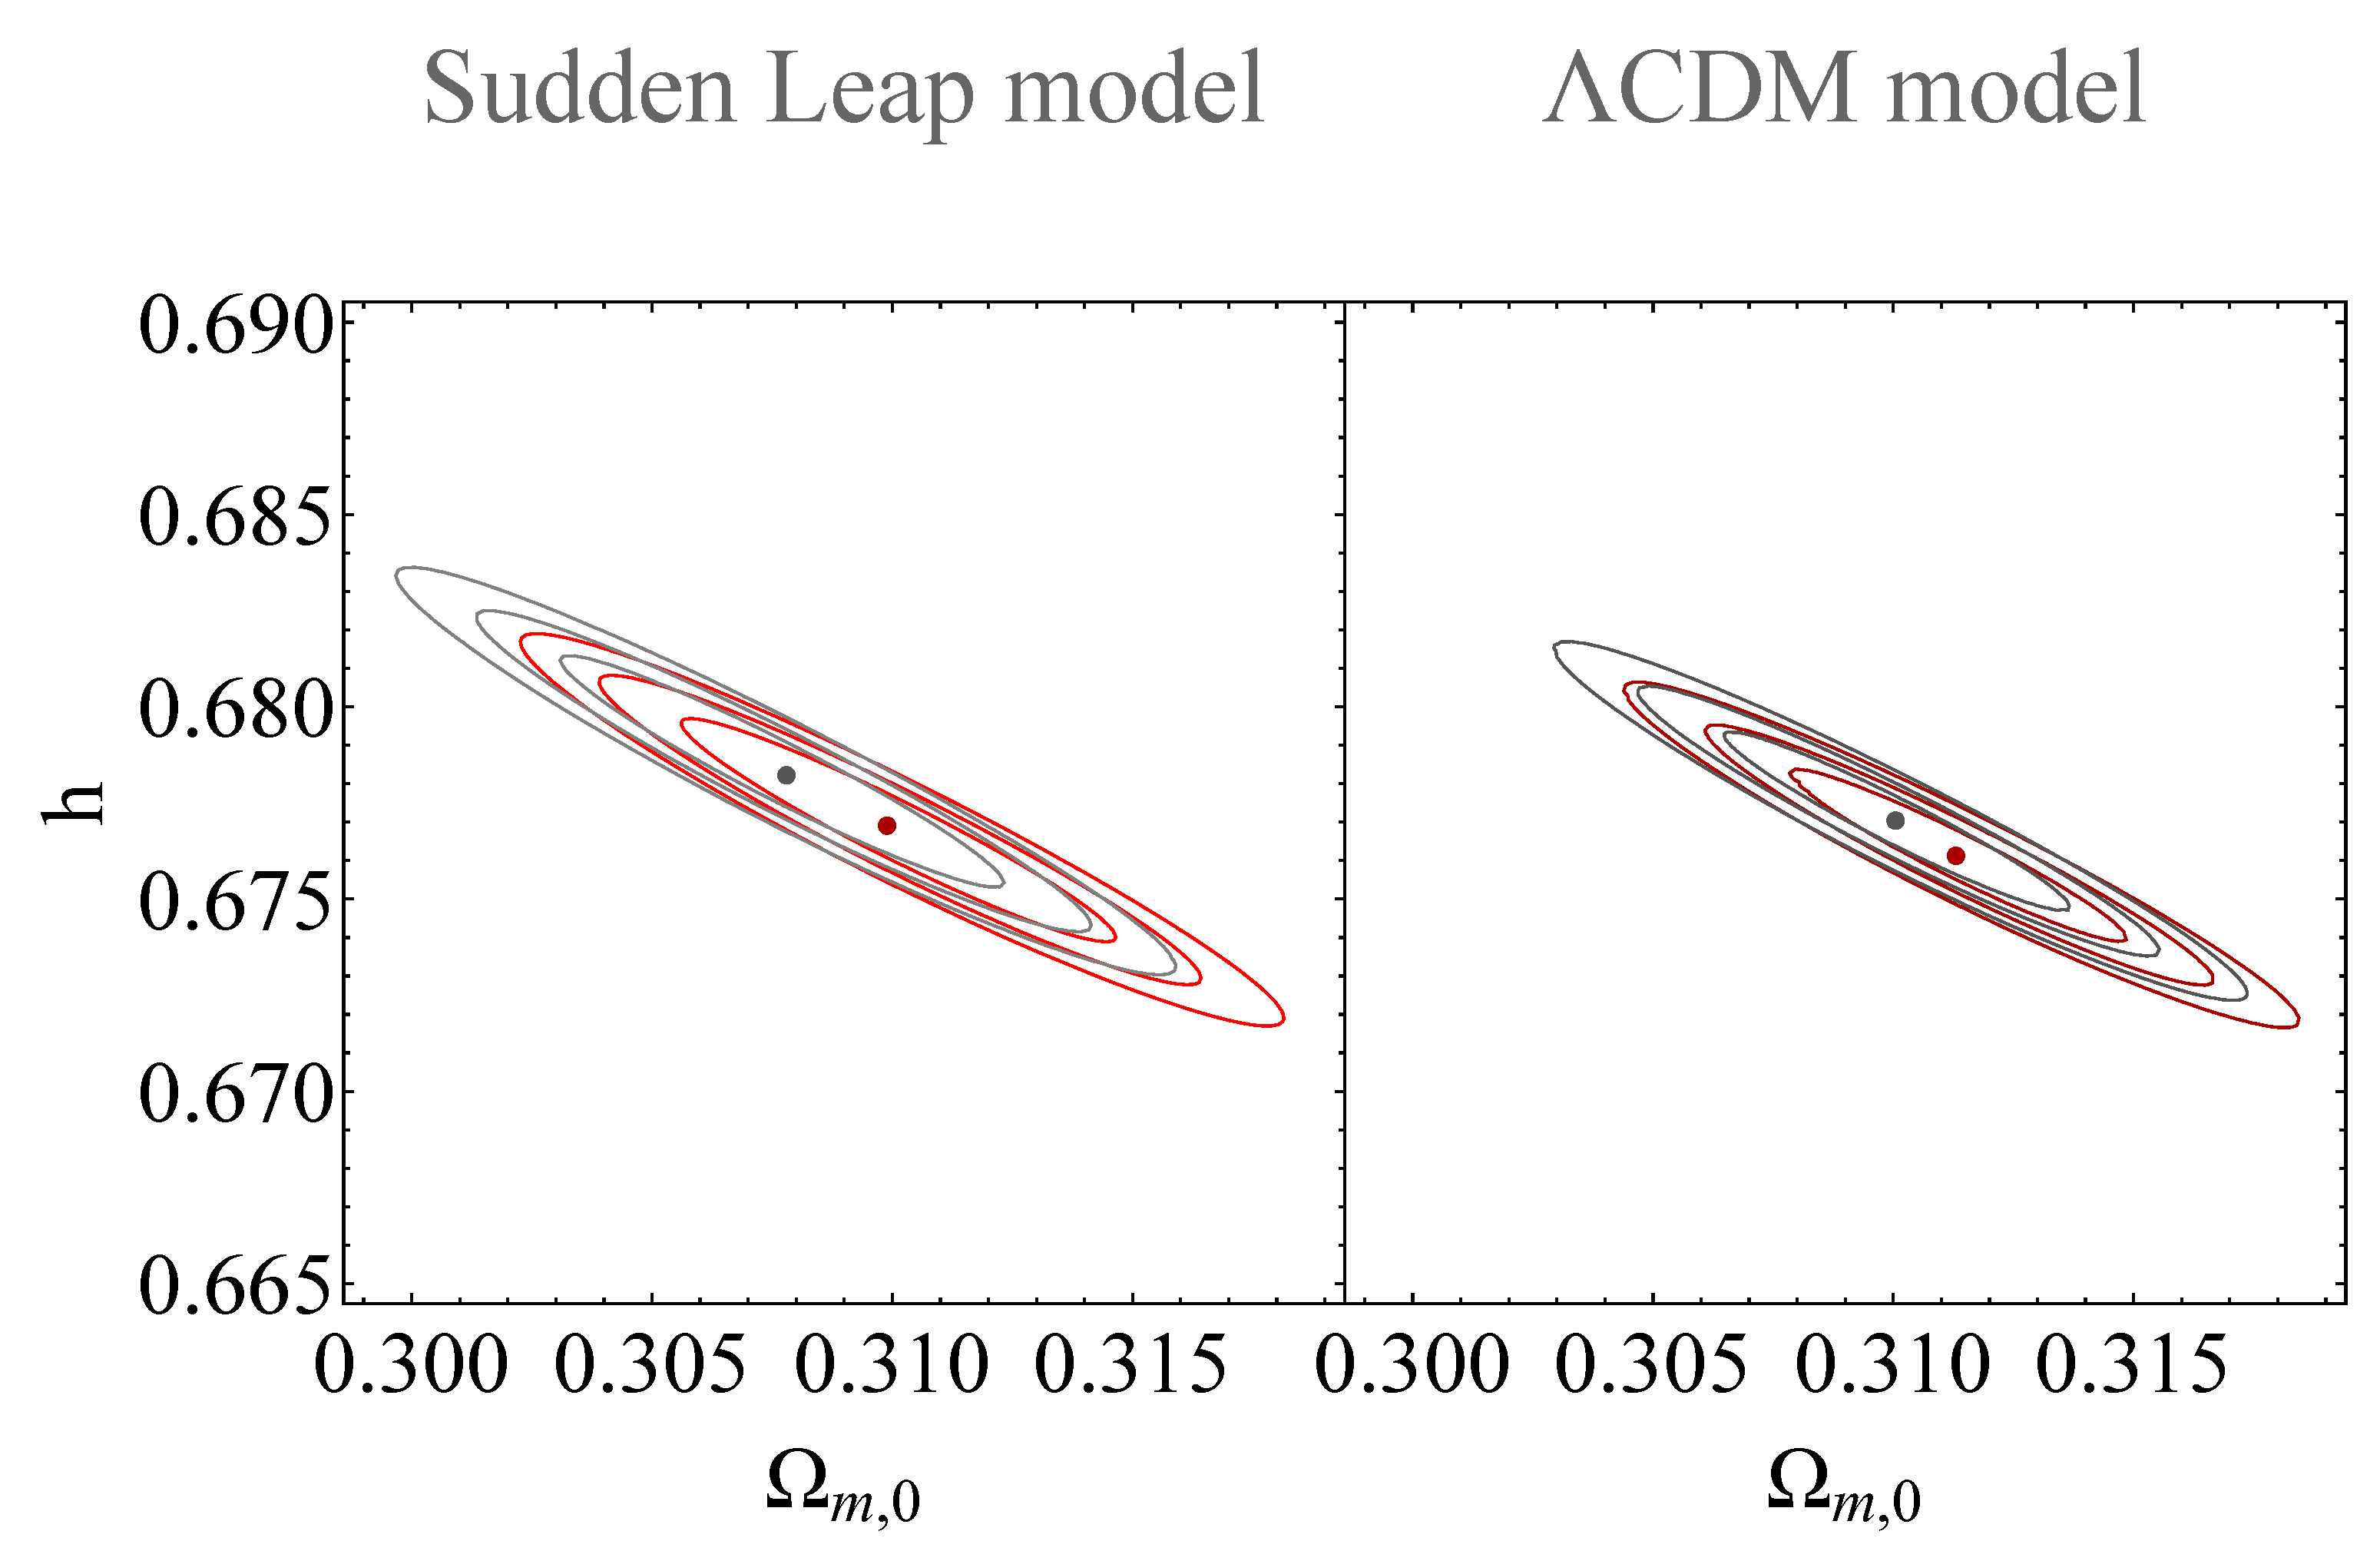
3.5. Results
4. Conclusions and Discussion
- Construction of a more detailed theoretical model that can induce the gravitational transition discussed in the present analysis. Such a model could be based on a scalar–tensor theory involving a false vacuum decay transition or a transition in time due to features of the potential determination of the dynamics of the scalar field.
- Consideration of additional astrophysical and/or cosmological data at redshifts (distances less than ) to impose constraints on such a gravitational transition or identify hints for its existence (see, e.g., [41]).
- The investigation of the effects of other types of singularities on the propagation of gravitational waves and on the luminosity distance as measured by either electromagnetic or gravitational waves. For instance, in the context of a generalized sudden cosmological singularity the derivative of the scale factor diverges. In this case, we have ∼, while the scale factor a and its derivative are continuous. Alternatively, a type III singularity can be constructed by admitting that ∼, or even a w-singularity by allowing that .
- The consideration of alternative gravitational-wave mock data corresponding to other future gravitational-wave observatories including LISA [147,148] and the comparison of the constraints that can be imposed on the parameters of the sudden-leap transition model with those of the ET considered in the present analysis. LISA is projected to detect frequencies spanning from to , a markedly distinct frequency range from that of the ET. Within this spectrum of frequencies, the anticipation is to detect a myriad of GW sources [149], including Galactic binaries [150,151,152,153], binary systems hosting stellar-origin black holes [154], extreme-mass-ratio inspirals (EMRIs) [155], mergers of massive black hole binaries (MBHBs) even at high redshifts (up to z∼10) [145] and possibly stochastic GW backgrounds [156].
Author Contributions
Funding
Conflicts of Interest
Appendix A. Sudden-Leap Model (sLCDM)


Appendix B. Maximum Likelihood Method
| 68.27% | 95.45% | 99.73% | |
| 3 | 3.52674 | 8.02488 | 14.1564 |
| 4 | 4.71947 | 9.71563 | 16.2513 |
| 5 | 5.8876 | 11.3139 | 18.2053 |
Appendix C. ΛCDM Model

| Sirens | CMB+BAO | Pantheon+ | Standrad Sirens+Pantheon+ | CMB+BAO+Pantheon+ | Sirens+CMB+BAO+Pantheon+ |
|---|---|---|---|---|---|
| 1015.07 | 6.39 | 1522.98 | 2575.73 | 1570.97 | 2586.54 |
| Data | |||||
| Standard Sirens | — | 0.305 ±0.019 | 0.676 ± 0.006 | ||
| CMB+BAO | — | 0.318 ± 0.006 | 0.672 ± 0.004 | ||
| Pantheon+ | −19.25 ± 0.03 | 0.333 ± 0.018 | 0.734 ± 0.01 | ||
| Standard Sirens+Pantheon+ | −19.41 ± 0.01 | 0.298 ± 0.012 | 0.683 ± 0.004 | ||
| CMB+BAO+Pantheon+ | −19.43 ± 0.01 | 0.31 ± 0.005 | 0.677 ± 0.004 | ||
| CMB+BAO+Pantheon++Standard Sirens | −19.43 ± 0.01 | 0.311 ± 0.004 | 0.676 ± 0.003 | ||
| Data | |||
|---|---|---|---|
| Standard Sirens | — | 6.2% | 0.9% |
| CMB+BAO | — | 1.9% | 0.6% |
| Pantheon+ | 0.2% | 5.4% | 1.4% |
| Standard Sirens+Pantheon+ | 0.1% | 4.0% | 0.6% |
| CMB+BAO+Pantheon+ | 0.1% | 1.6% | 0.6% |
| Standard Sirens+CMB+BAO+Pantheon+ | 0.1% | 1.6% | 0.4% |
| 1 | There is also a completely analogous characterization with the corresponding Tipler integral [67]. |
| 2 | Some additional contour plots are presented in Appendix A (Figure A1). |
| 3 | Some additional contour plots are presented in Appendix A (Figure A2). |
| 4 | Some additional contour plots are presented in Appendix A (Figure A3). |
| 5 | Some additional contour plots are presented in Appendix A (Figure A4). |
References
- Aghanim, N.; Akrami, Y.; Ashdown, M.; Aumont, J.; Baccigalupi, C.; Ballardini, M.; Banday, A.J.; Barreiro, R.B.; Bartolo, N.; Basak, S.; et al. Planck 2018 results. VI. Cosmological parameters. Astron. Astrophys. 2020, 641, A6, Erratum in Astron. Astrophys. 2021, 652, C4. [Google Scholar] [CrossRef]
- Aghanim, N.; Akrami, Y.; Ashdown, M.; Aumont, J.; Baccigalupi, C.; Ballardini, M.; Banday, A.J.; Barreiro, R.B.; Bartolo, N.; Basak, S.; et al. Planck 2018 results. III. High Frequency Instrument data processing and frequency maps. Astron. Astrophys. 2020, 641, A3. [Google Scholar]
- Aghanim, N.; Akrami, Y.; Arroja, F.; Ashdown, M.; Aumont, J.; Baccigalupi, C.; Ballardini, M.; Banday, A.J.; Barreiro, R.B.; Bartolo, N.; et al. Planck 2018 results. I. Overview and the cosmological legacy of Planck. Astron. Astrophys. 2020, 641, A1. [Google Scholar] [CrossRef]
- Akrami, Y.; Ashdown, M.; Aumont, J.; Baccigalupi, C.; Ballardini, M.; Banday, A.J.; Barreiro, R.B.; Bartolo, N.; Basak, S.; Benabed, K.; et al. Planck 2018 results. VII. Isotropy and Statistics of the CMB. Astron. Astrophys. 2020, 641, A7. [Google Scholar] [CrossRef]
- Akrami, Y.; Arroja, F.; Ashdown, M.; Aumont, J.; Baccigalupi, C.; Ballardini, M.; Banday, A.J.; Barreiro, R.B.; Bartolo, N.; Basak, S.; et al. Planck 2018 results. IX. Constraints on primordial non-Gaussianity. Astron. Astrophys. 2020, 641, A9. [Google Scholar] [CrossRef]
- Aghanim, N.; Akrami, Y.; Ashdown, M.; Aumont, J.; Baccigalupi, C.; Ballardini, M.; Banday, A.J.; Barreiro, R.B.; Bartolo, N.; Basak, S.; et al. Planck 2018 results. V. CMB power spectra and likelihoods. Astron. Astrophys. 2020, 641, A5. [Google Scholar] [CrossRef]
- Akrami, Y.; Ashdown, M.; Aumont, J.; Baccigalupi, C.; Ballardini, M.; Banday, A.J.; Barreiro, R.B.; Bartolo, N.; Basak, S.; Benabed, K.; et al. Planck intermediate results. LVI. Detection of the CMB dipole through modulation of the thermal Sunyaev-Zeldovich effect: Eppur si muove II. Astron. Astrophys. 2020, 644, A100. [Google Scholar] [CrossRef]
- Perivolaropoulos, L.; Skara, F. Challenges for ΛCDM: An update. New Astron. Rev. 2022, 95, 101659. [Google Scholar] [CrossRef]
- Di Valentino, E. A combined analysis of the H0 late time direct measurements and the impact on the Dark Energy sector. Mon. Not. R. Astron. Soc. 2021, 502, 2065–2073. [Google Scholar] [CrossRef]
- Riess, A.G.; Yuan, W.; Macri, L.M.; Scolnic, D.; Brout, D.; Casertano, S.; Jones, D.O.; Murakami, Y.; Breuval, L.; Brink, T.G.; et al. A Comprehensive Measurement of the Local Value of the Hubble Constant with 1 km s−1 Mpc−1 Uncertainty from the Hubble Space Telescope and the SH0ES Team. Astrophys. J. Lett. 2022, 934, L7. [Google Scholar] [CrossRef]
- Perivolaropoulos, L.; Skara, F. A Reanalysis of the Latest SH0ES Data for H0: Effects of New Degrees of Freedom on the Hubble Tension. Universe 2022, 8, 502. [Google Scholar] [CrossRef]
- Karwal, T.; Kamionkowski, M. Dark energy at early times, the Hubble parameter, and the string axiverse. Phys. Rev. D 2016, 94, 103523. [Google Scholar] [CrossRef]
- Poulin, V.; Smith, T.L.; Karwal, T.; Kamionkowski, M. Early Dark Energy Can Resolve The Hubble Tension. Phys. Rev. Lett. 2019, 122, 221301. [Google Scholar] [CrossRef] [PubMed]
- Smith, T.L.; Poulin, V.; Amin, M.A. Oscillating scalar fields and the Hubble tension: A resolution with novel signatures. Phys. Rev. D 2020, 101, 063523. [Google Scholar] [CrossRef]
- Niedermann, F.; Sloth, M.S. New early dark energy. Phys. Rev. D 2021, 103, L041303. [Google Scholar] [CrossRef]
- Herold, L.; Ferreira, E.G.M. Resolving the Hubble tension with Early Dark Energy. arXiv 2022, arXiv:2210.16296. [Google Scholar]
- Abdalla, E.; Abellán, G.F.; Aboubrahim, A.; Agnello, A.; Akarsu, Ö.; Akrami, Y.; Alestas, G.; Aloni, D.; Amendola, L.; Anchordoqui, L.A.; et al. Cosmology intertwined: A review of the particle physics, astrophysics, and cosmology associated with the cosmological tensions and anomalies. J. High Energy Astrophys. 2022, 34, 49–211. [Google Scholar] [CrossRef]
- Poulin, V.; Smith, T.L.; Karwal, T. The Ups and Downs of Early Dark Energy solutions to the Hubble tension: A review of models, hints and constraints circa 2023. arXiv 2023, arXiv:2302.09032. [Google Scholar]
- Bernal, J.L.; Verde, L.; Riess, A.G. The trouble with H0. J. Cosmol. Astropart. Phys. 2016, 10, 019. [Google Scholar] [CrossRef]
- Aylor, K.; Joy, M.; Knox, L.; Millea, M.; Raghunathan, S.; Wu, W.L.K. Sounds Discordant: Classical Distance Ladder & ΛCDM -based Determinations of the Cosmological Sound Horizon. Astrophys. J. 2019, 874, 4. [Google Scholar] [CrossRef]
- Vagnozzi, S. Consistency tests of ΛCDM from the early integrated Sachs-Wolfe effect: Implications for early-time new physics and the Hubble tension. Phys. Rev. D 2021, 104, 063524. [Google Scholar] [CrossRef]
- Hill, J.C.; Calabrese, E.; Aiola, S.; Battaglia, N.; Bolliet, B.; Choi, S.K.; Devlin, M.J.; Duivenvoorden, A.J.; Dunkley, J.; Ferraro, S.; et al. Atacama Cosmology Telescope: Constraints on prerecombination early dark energy. Phys. Rev. D 2022, 105, 123536. [Google Scholar] [CrossRef]
- Brieden, S.; Gil-Marín, H.; Verde, L. A tale of two (or more) h’s. arXiv 2022, arXiv:2212.04522. [Google Scholar] [CrossRef]
- Bernal, J.L.; Verde, L.; Jimenez, R.; Kamionkowski, M.; Valcin, D.; Wandelt, B.D. The trouble beyond H0 and the new cosmic triangles. Phys. Rev. D 2021, 103, 103533. [Google Scholar] [CrossRef]
- Wang, D.; Yan, Y.J.; Meng, X.H. A new pressure-parametrization unified dark fluid model. Eur. Phys. J. C 2017, 77, 263. [Google Scholar] [CrossRef]
- Yang, W.; Pan, S.; Di Valentino, E.; Paliathanasis, A.; Lu, J. Challenging bulk viscous unified scenarios with cosmological observations. Phys. Rev. D 2019, 100, 103518. [Google Scholar] [CrossRef]
- Cai, R.G.; Guo, Z.K.; Li, L.; Wang, S.J.; Yu, W.W. Chameleon dark energy can resolve the Hubble tension. Phys. Rev. D 2021, 103, 121302. [Google Scholar] [CrossRef]
- Li, X.; Shafieloo, A. A Simple Phenomenological Emergent Dark Energy Model can Resolve the Hubble Tension. Astrophys. J. Lett. 2019, 883, L3. [Google Scholar] [CrossRef]
- Di Valentino, E.; Mukherjee, A.; Sen, A.A. Dark Energy with Phantom Crossing and the H0 Tension. Entropy 2021, 23, 404. [Google Scholar] [CrossRef]
- Di Valentino, E.; Linder, E.V.; Melchiorri, A. H0 ex machina: Vacuum metamorphosis and beyond H0. Phys. Dark Univ. 2020, 30, 100733. [Google Scholar] [CrossRef]
- Benevento, G.; Kable, J.A.; Addison, G.E.; Bennett, C.L. An Exploration of an Early Gravity Transition in Light of Cosmological Tensions. Astrophys. J. 2022, 935, 156. [Google Scholar] [CrossRef]
- Heisenberg, L.; Villarrubia-Rojo, H.; Zosso, J. Simultaneously solving the H0 and σ8 tensions with late dark energy. Phys. Dark Univ. 2023, 39, 101163. [Google Scholar] [CrossRef]
- Hernández-Almada, A.; Leon, G.; Magaña, J.; García-Aspeitia, M.A.; Motta, V.; Saridakis, E.N.; Yesmakhanova, K. Kaniadakis-holographic dark energy: Observational constraints and global dynamics. Mon. Not. R. Astron. Soc. 2022, 511, 4147–4158. [Google Scholar] [CrossRef]
- Alestas, G.; Perivolaropoulos, L. Late-time approaches to the Hubble tension deforming H(z), worsen the growth tension. Mon. Not. R. Astron. Soc. 2021, 504, 3956–3962. [Google Scholar] [CrossRef]
- Benevento, G.; Hu, W.; Raveri, M. Can Late Dark Energy Transitions Raise the Hubble constant? Phys. Rev. D 2020, 101, 103517. [Google Scholar] [CrossRef]
- Alestas, G.; Camarena, D.; Di Valentino, E.; Kazantzidis, L.; Marra, V.; Nesseris, S.; Perivolaropoulos, L. Late-transition versus smooth H(z)-deformation models for the resolution of the Hubble crisis. Phys. Rev. D 2022, 105, 063538. [Google Scholar] [CrossRef]
- Yang, W.; Di Valentino, E.; Pan, S.; Wu, Y.; Lu, J. Dynamical dark energy after Planck CMB final release and H 0 tension. Mon. Not. R. Astron. Soc. 2020, 501, 5845–5858. [Google Scholar] [CrossRef]
- Marra, V.; Perivolaropoulos, L. Rapid transition of Geff at zt ≃ 0.01 as a possible solution of the Hubble and growth tensions. Phys. Rev. D 2021, 104, L021303. [Google Scholar] [CrossRef]
- Alestas, G.; Kazantzidis, L.; Perivolaropoulos, L. w − M phantom transition at zt < 0.1 as a resolution of the Hubble tension. Phys. Rev. D 2021, 103, 083517. [Google Scholar] [CrossRef]
- Perivolaropoulos, L.; Skara, F. On the homogeneity of SnIa absolute magnitude in the Pantheon+ sample. arXiv 2023, arXiv:2301.01024. [Google Scholar] [CrossRef]
- Alestas, G.; Antoniou, I.; Perivolaropoulos, L. Hints for a Gravitational Transition in Tully–Fisher Data. Universe 2021, 7, 366. [Google Scholar] [CrossRef]
- Perivolaropoulos, L. Is the Hubble Crisis Connected with the Extinction of Dinosaurs? Universe 2022, 8, 263. [Google Scholar] [CrossRef]
- Alestas, G.; Perivolaropoulos, L.; Tanidis, K. Constraining a late time transition of Geff using low-z galaxy survey data. Phys. Rev. D 2022, 106, 023526. [Google Scholar] [CrossRef]
- Perivolaropoulos, L.; Skara, F. Hubble tension or a transition of the Cepheid SnIa calibrator parameters? Phys. Rev. D 2021, 104, 123511. [Google Scholar] [CrossRef]
- Perivolaropoulos, L.; Skara, F. Gravitational transitions via the explicitly broken symmetron screening mechanism. Phys. Rev. D 2022, 106, 043528. [Google Scholar] [CrossRef]
- Lee, W.; Lee, B.H.; Lee, C.H.; Park, C. The False vacuum bubble nucleation due to a nonminimally coupled scalar field. Phys. Rev. D 2006, 74, 123520. [Google Scholar] [CrossRef]
- Barrow, J.D. Sudden future singularities. Class. Quantum Gravity 2004, 21, L79–L82. [Google Scholar] [CrossRef]
- Barrow, J.D.; Tsagas, C.G. New isotropic and anisotropic sudden singularities. Class. Quantum Gravity 2005, 22, 1563–1571. [Google Scholar] [CrossRef]
- Fernandez-Jambrina, L.; Lazkoz, R. Geodesic Completeness around Sudden Singularities. AIP Conf. Proc. 2006, 841, 420. [Google Scholar] [CrossRef]
- Fernandez-Jambrina, L.; Lazkoz, R. Singular fate of the universe in modified theories of gravity. Phys. Lett. B 2009, 670, 254–258. [Google Scholar] [CrossRef]
- Fernandez-Jambrina, L.; Lazkoz, R. Classification of cosmological milestones. Phys. Rev. D 2006, 74, 064030. [Google Scholar] [CrossRef]
- Perivolaropoulos, L. Fate of bound systems through sudden future singularities. Phys. Rev. D 2016, 94, 124018. [Google Scholar] [CrossRef]
- Amendola, L.; Tsujikawa, S. Dark Energy: Theory and Observations; Cambridge University Press: Cambridge, UK, 2010. [Google Scholar] [CrossRef]
- Cattoën, C.; Visser, M. Necessary and sufficient conditions for big bangs, bounces, crunches, rips, sudden singularities and extremality events. Class. Quantum Gravity 2005, 22, 4913–4930. [Google Scholar] [CrossRef]
- Barrow, J.D. More general sudden singularities. Class. Quant. Grav. 2004, 21, 5619–5622. [Google Scholar] [CrossRef]
- Denkiewicz, T.; Dą browski, M.P.; Ghodsi, H.; Hendry, M.A. Cosmological tests of sudden future singularities. Phys. Rev. D 2012, 85, 083527. [Google Scholar] [CrossRef]
- Bamba, K.; Nojiri, S.; Odintsov, S.D. The Universe future in modified gravity theories: Approaching the finite-time future singularity. J. Cosmol. Astropart. Phys. 2008, 2008, 045. [Google Scholar] [CrossRef]
- Bamba, K.; Capozziello, S.; Nojiri, S.; Odintsov, S.D. Dark energy cosmology: The equivalent description via different theoretical models and cosmography tests. Astrophys. Space Sci. 2012, 342, 155–228. [Google Scholar] [CrossRef]
- Caldwell, R.R.; Kamionkowski, M.; Weinberg, N.N. Phantom energy and cosmic doomsday. Phys. Rev. Lett. 2003, 91, 071301. [Google Scholar] [CrossRef]
- Nojiri, S.; Odintsov, S.D.; Tsujikawa, S. Properties of singularities in the (phantom) dark energy universe. Phys. Rev. D 2005, 71, 063004. [Google Scholar] [CrossRef]
- Stefancic, H. Expansion around the vacuum equation of state - Sudden future singularities and asymptotic behavior. Phys. Rev. D 2005, 71, 084024. [Google Scholar] [CrossRef]
- Nojiri, S.; Odintsov, S.D. The Final state and thermodynamics of dark energy universe. Phys. Rev. D 2004, 70, 103522. [Google Scholar] [CrossRef]
- Dąbrowski, M.P.; Denkiewicz, T. Barotropic index w-singularities in cosmology. Phys. Rev. D 2009, 79, 063521. [Google Scholar] [CrossRef]
- Frampton, P.H.; Ludwick, K.J.; Scherrer, R.J. The little rip. Phys. Rev. D 2011, 84, 063003. [Google Scholar] [CrossRef]
- Frampton, P.H.; Ludwick, K.J.; Scherrer, R.J. Pseudo-rip: Cosmological models intermediate between the cosmological constant and the little rip. Phys. Rev. D 2012, 85, 083001. [Google Scholar] [CrossRef]
- Clarke, C.; Królak, A. Conditions for the occurence of strong curvature singularities. J. Geom. Phys. 1985, 2, 127–143. [Google Scholar] [CrossRef]
- Tipler, F.J. Singularities in conformally flat spacetimes. Phys. Lett. A 1977, 64, 8–10. [Google Scholar] [CrossRef]
- Fernandez-Jambrina, L.; Lazkoz, R. Geodesic Behaviour around Cosmological Milestones. J. Phys. Conf. Ser. 2007, 66, 012015. [Google Scholar] [CrossRef]
- Gaztanaga, E.; Garcia-Berro, E.; Isern, J.; Bravo, E.; Dominguez, I. Bounds on the possible evolution of the gravitational constant from cosmological type Ia supernovae. Phys. Rev. D 2002, 65, 023506. [Google Scholar] [CrossRef]
- Vijaykumar, A.; Kapadia, S.J.; Ajith, P. Constraints on the Time Variation of the Gravitational Constant Using Gravitational Wave Observations of Binary Neutron Stars. Phys. Rev. Lett. 2021, 126, 141104. [Google Scholar] [CrossRef]
- Uzan, J.P. The fundamental constants and their variation: Observational and theoretical status. Rev. Mod. Phys. 2003, 75, 403–455. [Google Scholar] [CrossRef]
- Conselice, C.; Bundy, K.; Ellis, R.; Brichmann, J.; Vogt, N.; Phillips, A. Evolution of the Near-Infrared Tully-Fisher Relation: Constraints on the Relationship Between the Stellar and Total Masses of Disk Galaxies since z ∼ 1. Astrophys. J. 2005, 628, 160. [Google Scholar] [CrossRef]
- Alvey, J.; Sabti, N.; Escudero, M.; Fairbairn, M. Improved BBN Constraints on the Variation of the Gravitational Constant. Eur. Phys. J. C 2020, 80, 148. [Google Scholar] [CrossRef]
- Wu, F.; Chen, X. Cosmic microwave background with Brans-Dicke gravity II: Constraints with the WMAP and SDSS data. Phys. Rev. D 2010, 82, 083003. [Google Scholar] [CrossRef]
- Punturo, M.; Abernathy, M.; Acernese, F.; Allen, B.; Andersson, N.; Arun, K.; Barone, F.; Barr, B.; Barsuglia, M.; Beker, M.; et al. The Einstein Telescope: A third-generation gravitational wave observatory. Class. Quant. Grav. 2010, 27, 194002. [Google Scholar] [CrossRef]
- Sathyaprakash, B.; Abernathy, M.; Acernese, F.; Ajith, P.; Allen, B.; Amaro-Seoane, P.; Andersson, N.; Aoudia, S.; Arun, K.; Astone, P.; et al. Scientific Objectives of Einstein Telescope. Class. Quant. Grav. 2012, 29, 124013. [Google Scholar] [CrossRef]
- Zhao, W.; Broeck, C.V.D.; Baskaran, D.; Li, T.G.F. Determination of dark energy by the Einstein Telescope: Comparing with CMB, BAO, and SNIa observations. Phys. Rev. D 2011, 83, 023005. [Google Scholar] [CrossRef]
- Taylor, S.R.; Gair, J.R. Cosmology with the lights off: Standard sirens in the Einstein Telescope era. Phys. Rev. D 2012, 86, 023502. [Google Scholar] [CrossRef]
- D’Agostino, R.; Nunes, R.C. Probing observational bounds on scalar-tensor theories from standard sirens. Phys. Rev. D 2019, 100, 044041. [Google Scholar] [CrossRef]
- Belgacem, E.; Dirian, Y.; Foffa, S.; Maggiore, M. Modified gravitational-wave propagation and standard sirens. Phys. Rev. D 2018, 98, 023510. [Google Scholar] [CrossRef]
- Maggiore, M.; Van Den Broeck, C.; Bartolo, N.; Belgacem, E.; Bertacca, D.; Bizouard, M.A.; Branchesi, M.; Clesse, S.; Foffa, S.; García-Bellido, J.; et al. Science Case for the Einstein Telescope. J. Cosmol. Astropart. Phys. 2020, 03, 050. [Google Scholar] [CrossRef]
- Branchesi, M.; Maggiore, M.; Alonso, D.; Badger, C.; Banerjee, B.; Beirnaert, F.; Bhagwat, S.; Boileau, G.; Borhanian, S.; Brown, D.D.; et al. Science with the Einstein Telescope: A comparison of different designs. arXiv 2023, arXiv:2303.15923. [Google Scholar]
- Matos, I.S.; Bellini, E.; Calvão, M.O.; Kunz, M. Testing gravity with gravitational wave friction and gravitational slip. J. Cosmol. Astropart. Phys. 2023, 05, 030. [Google Scholar] [CrossRef]
- Mureika, J.R.; Stojkovic, D. Detecting Vanishing Dimensions Via Primordial Gravitational Wave Astronomy. Phys. Rev. Lett. 2011, 106, 101101. [Google Scholar] [CrossRef]
- Abbott, B.P.; Abbott, R.; Abbott, T.D.; Abraham, S.; Acernese, F.; Ackley, K.; Adams, C.; Adya, V.B.; Affeldt, C.; Agathos, M.; et al. Prospects for observing and localizing gravitational-wave transients with Advanced LIGO, Advanced Virgo and KAGRA. Living Rev. Rel. 2018, 21, 3. [Google Scholar] [CrossRef] [PubMed]
- Aasi, J.; Abbott, B.P.; Abbott, R.; Abbott, T.; Abernathy, M.R.; Ackley, K.; Adams, C.; Adams, T.; Addesso, P.; Adhikari, R.X.; et al. Advanced LIGO. Class. Quant. Grav. 2015, 32, 074001. [Google Scholar] [CrossRef]
- Acernese, F.A.; Agathos, M.; Agatsuma, K.; Aisa, D.; Allemandou, N.; Allocca, A.; Amarni, J.; Astone, P.; Balestri, G.; Ballardin, G.; et al. Advanced Virgo: A second-generation interferometric gravitational wave detector. Class. Quant. Grav. 2015, 32, 024001. [Google Scholar] [CrossRef]
- Aso, Y.; Michimura, Y.; Somiya, K.; Ando, M.; Miyakawa, O.; Sekiguchi, T.; Tatsumi, D.; Yamamoto, H. Interferometer design of the KAGRA gravitational wave detector. Phys. Rev. D 2013, 88, 043007. [Google Scholar] [CrossRef]
- Will, C.M. The Confrontation Between General Relativity And Experiment: An Update. Phys. Rept. 1984, 113, 345–422. [Google Scholar] [CrossRef]
- Boisseau, B.; Esposito-Farese, G.; Polarski, D.; Starobinsky, A.A. Reconstruction of a scalar tensor theory of gravity in an accelerating universe. Phys. Rev. Lett. 2000, 85, 2236. [Google Scholar] [CrossRef]
- Esposito-Farese, G.; Polarski, D. Scalar tensor gravity in an accelerating universe. Phys. Rev. D 2001, 63, 063504. [Google Scholar] [CrossRef]
- Perivolaropoulos, L. Crossing the phantom divide barrier with scalar tensor theories. J. Cosmol. Astropart. Phys. 2005, 10, 001. [Google Scholar] [CrossRef]
- Nishizawa, A. Generalized framework for testing gravity with gravitational-wave propagation. I. Formulation. Phys. Rev. D 2018, 97, 104037. [Google Scholar] [CrossRef]
- Arai, S.; Nishizawa, A. Generalized framework for testing gravity with gravitational-wave propagation. II. Constraints on Horndeski theory. Phys. Rev. D 2018, 97, 104038. [Google Scholar] [CrossRef]
- Linder, E.V. No slip gravity. J. Cosmol. Astropart. Phys. 2018, 2018, 005. [Google Scholar] [CrossRef]
- Eardley, D.M.; Lee, D.L.; Lightman, A.P. Gravitational-wave observations as a tool for testing relativistic gravity. Phys. Rev. D 1973, 8, 3308–3321. [Google Scholar] [CrossRef]
- Belgacem, E.; Dirian, Y.; Foffa, S.; Maggiore, M. Gravitational-wave luminosity distance in modified gravity theories. Phys. Rev. D 2018, 97, 104066. [Google Scholar] [CrossRef]
- Maggiore, M. Gravitational Waves: Volume 1: Theory and Experiments; Oxford University Press: Oxford, UK, 2007. [Google Scholar] [CrossRef]
- Maggiore, M. Gravitational Waves: Volume 2: Astrophysics and Cosmology; Oxford University Press: Oxford, UK, 2018. [Google Scholar] [CrossRef]
- Odintsov, S.D.; Oikonomou, V.K.; Myrzakulov, R. Spectrum of Primordial Gravitational Waves in Modified Gravities: A Short Overview. Symmetry 2022, 14, 729. [Google Scholar] [CrossRef]
- de Matos, I.; Calvão, M.; Waga, I. Gravitational wave propagation in f ( R ) models: New parametrizations and observational constraints. Phys. Rev. D 2021, 103, 104059. [Google Scholar] [CrossRef]
- Tasinato, G.; Garoffolo, A.; Bertacca, D.; Matarrese, S. Gravitational-wave cosmological distances in scalar-tensor theories of gravity. J. Cosmol. Astropart. Phys. 2021, 06, 050. [Google Scholar] [CrossRef]
- Dodelson, S.; Schmidt, F. Modern Cosmology; Elsevier Science: Amsterdam, The Netherlands, 2020. [Google Scholar]
- Arfken, G.; Weber, H.; Harris, F. Mathematical Methods for Physicists: A Comprehensive Guide; Elsevier Science: Amsterdam, The Netherlands, 2012. [Google Scholar]
- Saltas, I.D.; Sawicki, I.; Amendola, L.; Kunz, M. Anisotropic Stress as a Signature of Nonstandard Propagation of Gravitational Waves. Phys. Rev. Lett. 2014, 113, 191101. [Google Scholar] [CrossRef] [PubMed]
- Pettorino, V.; Amendola, L. Friction in Gravitational Waves: A test for early-time modified gravity. Phys. Lett. B 2015, 742, 353–357. [Google Scholar] [CrossRef]
- Gleyzes, J.; Langlois, D.; Vernizzi, F. A unifying description of dark energy. Int. J. Mod. Phys. D 2015, 23, 1443010. [Google Scholar] [CrossRef]
- Belgacem, E.; Calcagni, G.; Crisostomi, M.; Dalang, C.; Dirian, Y.; Ezquiaga, J.M.; Fasiello, M.; Foffa, S.; Ganz, A.; García-Bellido, J.; et al. Testing modified gravity at cosmological distances with LISA standard sirens. J. Cosmol. Astropart. Phys. 2019, 2019, 024. [Google Scholar] [CrossRef]
- Cai, R.G.; Liu, T.B.; Liu, X.W.; Wang, S.J.; Yang, T. Probing cosmic anisotropy with gravitational waves as standard sirens. Phys. Rev. D 2018, 97, 103005. [Google Scholar] [CrossRef]
- Yang, W.; Pan, S.; Di Valentino, E.; Escamilla-Rivera, C.; Paliathanasis, A. Exploring bulk viscous unified scenarios with Gravitational Waves Standard Sirens. arXiv 2023, arXiv:2301.03969. [Google Scholar] [CrossRef]
- Fu, X.; Zhou, L.; Chen, J. Testing the cosmic distance-duality relation from future gravitational wave standard sirens. Phys. Rev. D 2019, 99, 083523. [Google Scholar] [CrossRef]
- Cai, R.G.; Yang, T. Space-borne atom interferometric gravitational wave detections. Part I. The forecast of bright sirens on cosmology. J. Cosmol. Astropart. Phys. 2021, 12, 017. [Google Scholar] [CrossRef]
- Mukherjee, S.; Wandelt, B.D.; Silk, J. Testing the general theory of relativity using gravitational wave propagation from dark standard sirens. Mon. Not. R. Astron. Soc. 2021, 502, 1136–1144. [Google Scholar] [CrossRef]
- Auclair, P.; Bacon, D.; Baker, T.; Barreiro, T.; Bartolo, N.; Belgacem, E.; Bellomo, N.; Ben-Dayan, I.; Bertacca, D.; Besancon, M.; et al. Cosmology with the Laser Interferometer Space Antenna. arXiv 2022, arXiv:2204.05434. [Google Scholar]
- Abbott, B.P.; Abbott, R.; Abbott, T.D.; Abernathy, M.R.; Ackley, K.; Adams, C.; Addesso, P.; Adhikari, R.X.; Adya, V.B.; Affeldt, C.; et al. Exploring the Sensitivity of Next Generation Gravitational Wave Detectors. Class. Quant. Grav. 2017, 34, 044001. [Google Scholar] [CrossRef]
- Zhang, X. Gravitational wave standard sirens and cosmological parameter measurement. Sci. China Phys. Mech. Astron. 2019, 62, 110431. [Google Scholar] [CrossRef]
- Califano, M.; de Martino, I.; Vernieri, D.; Capozziello, S. Exploiting the Einstein Telescope to solve the Hubble tension. arXiv 2022, arXiv:2208.13999. [Google Scholar] [CrossRef]
- Schutz, B.F. Determining the Hubble constant from gravitational wave observations. Nature 1986, 323, 310–311. [Google Scholar] [CrossRef]
- Abbott, B.P.; Abbott, R.; Abbott, T.D.; Acernese, F.; Ackley, K.; Adams, C.; Adams, T.; Addesso, P.; Adhikari, R.X.; Adya, V.B.; et al. A gravitational-wave standard siren measurement of the Hubble constant. Nature 2017, 551, 85–88. [Google Scholar]
- Chen, H.Y.; Fishbach, M.; Holz, D.E. A two per cent Hubble constant measurement from standard sirens within five years. Nature 2021, 592, 71–76. [Google Scholar] [CrossRef] [PubMed]
- Khan, S.; Husa, S.; Hannam, M.; Ohme, F.; Pürrer, M.; Jiménez Forteza, X.; Bohé, A. Frequency-domain gravitational waves from nonprecessing black-hole binaries. II. A phenomenological model for the advanced detector era. Phys. Rev. D 2016, 93, 044007. [Google Scholar] [CrossRef]
- Breschi, M.; Bernuzzi, S.; Chakravarti, K.; Camilletti, A.; Prakash, A.; Perego, A. Kilohertz Gravitational Waves From Binary Neutron Star Mergers: Numerical-relativity Informed Postmerger Model. arXiv 2022, arXiv:2205.09112. [Google Scholar]
- Breschi, M.; Gamba, R.; Borhanian, S.; Carullo, G.; Bernuzzi, S. Kilohertz Gravitational Waves from Binary Neutron Star Mergers: Inference of Postmerger Signals with the Einstein Telescope. arXiv 2022, arXiv:2205.09979. [Google Scholar]
- Nagar, A.; Bernuzzi, S.; Pozzo, W.; Riemenschneider, G.; Akcay, S.; Carullo, G.; Fleig, P.; Babak, S.; Tsang, K.; Colleoni, M.; et al. Time-domain effective-one-body gravitational waveforms for coalescing compact binaries with nonprecessing spins, tides, and self-spin effects. Phys. Rev. D 2018, 98, 104052. [Google Scholar] [CrossRef]
- Estellés, H.; Colleoni, M.; García-Quirós, C.; Husa, S.; Keitel, D.; Mateu-Lucena, M.; Planas, M.d.L.; Ramos-Buades, A. New twists in compact binary waveform modeling: A fast time-domain model for precession. Phys. Rev. D 2022, 105, 084040. [Google Scholar] [CrossRef]
- Sathyaprakash, B.S.; Schutz, B.F.; Van Den Broeck, C. Cosmography with the Einstein Telescope. Class. Quant. Grav. 2010, 27, 215006. [Google Scholar] [CrossRef]
- Eisenstein, D.J.; Hu, W. Baryonic features in the matter transfer function. Astrophys. J. 1998, 496, 605. [Google Scholar] [CrossRef]
- Kazantzidis, L.; Perivolaropoulos, L.; Skara, F. Constraining power of cosmological observables: Blind redshift spots and optimal ranges. Phys. Rev. D 2019, 99, 063537. [Google Scholar] [CrossRef]
- Eisenstein, D.J.; Zehavi, I.; Hogg, D.W.; Scoccimarro, R.; Blanton, M.R.; Nichol, R.C.; Scranton, R.; Seo, H.J.; Tegmark, M.; Zheng, Z.; et al. Detection of the Baryon Acoustic Peak in the Large-Scale Correlation Function of SDSS Luminous Red Galaxies. Astrophys. J. 2005, 633, 560–574. [Google Scholar] [CrossRef]
- Hu, W.; Sugiyama, N. Small scale cosmological perturbations: An Analytic approach. Astrophys. J. 1996, 471, 542–570. [Google Scholar] [CrossRef]
- Theodoropoulos, A.; Perivolaropoulos, L. The Hubble Tension, the M Crisis of Late Time H(z) Deformation Models and the Reconstruction of Quintessence Lagrangians. Universe 2021, 7, 300. [Google Scholar] [CrossRef]
- Zhai, Z.; Wang, Y. Robust and model-independent cosmological constraints from distance measurements. J. Cosmol. Astropart. Phys. 2019, 07, 005. [Google Scholar] [CrossRef]
- Escamilla-Rivera, C. Status on Bidimensional Dark Energy Parameterizations Using SNe Ia JLA and BAO Datasets. Galaxies 2016, 4, 8. [Google Scholar] [CrossRef]
- Jones, D.; Saunders, W.; Colless, M.; Read, M.; Parker, Q.; Watson, F.; Campbell, L.; Burkey, D.; Mauch, T.; Moore, L.; et al. The 6dF Galaxy Survey: Samples, Observational Techniques and the First Data Release. Mon. Not. R. Astron. Soc. 2004, 355, 747–763. [Google Scholar] [CrossRef]
- Drinkwater, M.J.; Jurek, R.J.; Blake, C.; Woods, D.; Pimbblet, K.A.; Glazebrook, K.; Sharp, R.; Pracy, M.B.; Brough, S.; Colless, M.; et al. The WiggleZ Dark Energy Survey: Survey Design and First Data Release. Mon. Not. R. Astron. Soc. 2010, 401, 1429–1452. [Google Scholar] [CrossRef]
- Brout, D.; Scolnic, D.; Popovic, B.; Riess, A.G.; Carr, A.; Zuntz, J.; Kessler, R.; Davis, T.M.; Hinton, S.; Jones, D.; et al. The Pantheon+ Analysis: Cosmological Constraints. Astrophys. J. 2022, 938, 110. [Google Scholar] [CrossRef]
- Scolnic, D.M.; Jones, D.O.; Rest, A.; Pan, Y.C.; Chornock, R.; Foley, R.J.; Huber, M.E.; Kessler, R.; Narayan, G.; Riess, A.G.; et al. The Complete Light-curve Sample of Spectroscopically Confirmed SNe Ia from Pan-STARRS1 and Cosmological Constraints from the Combined Pantheon Sample. Astrophys. J. 2018, 859, 101. [Google Scholar] [CrossRef]
- Perivolaropoulos, L. On the isotropy of SnIa absolute magnitudes in the Pantheon+ and SH0ES samples. arXiv 2023, arXiv:2305.12819. [Google Scholar]
- Burnham, K.; Anderson, D. Model Selection and Multimodel Inference: A Practical Information-Theoretic Approach; Springer: New York, NY, USA, 2003. [Google Scholar]
- Shi, K.; Huang, Y.; Lu, T. A comprehensive comparison of cosmological models from latest observational data. Mon. Not. R. Astron. Soc. 2012, 426, 2452–2462. [Google Scholar] [CrossRef]
- Kazantzidis, L.; Perivolaropoulos, L. Hints of a Local Matter Underdensity or Modified Gravity in the Low z Pantheon data. Phys. Rev. D 2020, 102, 023520. [Google Scholar] [CrossRef]
- Fernández-Jambrina, L. Singularities in Inflationary Cosmological Models. Universe 2021, 7, 491. [Google Scholar] [CrossRef]
- Klein, A.; Barausse, E.; Sesana, A.; Petiteau, A.; Berti, E.; Babak, S.; Gair, J.; Aoudia, S.; Hinder, I.; Ohme, F.; et al. Science with the space-based interferometer eLISA: Supermassive black hole binaries. Phys. Rev. D 2016, 93, 024003. [Google Scholar] [CrossRef]
- Tamanini, N.; Caprini, C.; Barausse, E.; Sesana, A.; Klein, A.; Petiteau, A. Science with the space-based interferometer eLISA. III: Probing the expansion of the Universe using gravitational wave standard sirens. J. Cosmol. Astropart. Phys. 2016, 2016, 002. [Google Scholar] [CrossRef]
- Mangiagli, A.; Caprini, C.; Volonteri, M.; Marsat, S.; Vergani, S.; Tamanini, N.; Inchauspé, H. Massive black hole binaries in LISA: Multimessenger prospects and electromagnetic counterparts. Phys. Rev. D 2022, 106, 103017. [Google Scholar] [CrossRef]
- Mangiagli, A.; Caprini, C.; Volonteri, M.; Marsat, S.; Vergani, S.; Tamanini, N.; Speri, L. Cosmology with massive black hole binary mergers in the LISA era. In Proceedings of the 41st International Conference on High Energy physics (ICHEP2022)—Astroparticle Physics and Cosmology 2022, Bologna, Italy, 6–13 July 2022. [Google Scholar] [CrossRef]
- Amaro-Seoane, P.; Audley, H.; Babak, S.; Baker, J.; Barausse, E.; Bender, P.; Berti, E.; Binetruy, P.; Born, M.; Bortoluzzi, D.; et al. Laser Interferometer Space Antenna. arXiv 2017, arXiv:1702.00786. [Google Scholar]
- Caprini, C.; Hindmarsh, M.; Huber, S.; Konstandin, T.; Kozaczuk, J.; Nardini, G.; No, J.M.; Petiteau, A.; Schwaller, P.; Servant, G.; et al. Science with the space-based interferometer eLISA. II: Gravitational waves from cosmological phase transitions. J. Cosmol. Astropart. Phys. 2016, 04, 001. [Google Scholar] [CrossRef]
- Speri, L.; Tamanini, N.; Caldwell, R.; Gair, J.; Wang, B. Testing the quasar Hubble diagram with LISA standard sirens. Phys. Rev. D 2021, 103, 083526. [Google Scholar] [CrossRef]
- Breivik, K.; Kremer, K.; Bueno, M.; Larson, S.L.; Coughlin, S.; Kalogera, V. Characterizing Accreting Double White Dwarf Binaries with the Laser Interferometer Space Antenna and Gaia. Astrophys. J. Lett. 2018, 854, L1. [Google Scholar] [CrossRef]
- Korol, V.; Rossi, E.; Groot, P.; Nelemans, G.; Toonen, S.; Brown, A. Prospects for detection of detached double white dwarf binaries with Gaia, LSST and LISA. Mon. Not. R. Astron. Soc. 2017, 470, 1894–1910. [Google Scholar] [CrossRef]
- Korol, V.; Koop, O.; Rossi, E. Detectability of Double White Dwarfs in the Local Group with LISA. Astrophys. J. Lett. 2018, 866, L20. [Google Scholar] [CrossRef]
- Lau, M.Y.M.; Mandel, I.; Vigna-Gómez, A.; Neijssel, C.J.; Stevenson, S.; Sesana, A. Detecting Double Neutron Stars with LISA. Mon. Not. R. Astron. Soc. 2020, 492, 3061–3072. [Google Scholar] [CrossRef]
- Sesana, A. Prospects for Multiband Gravitational-Wave Astronomy after GW150914. Phys. Rev. Lett. 2016, 116, 231102. [Google Scholar] [CrossRef]
- Babak, S.; Gair, J.; Sesana, A.; Barausse, E.; Sopuerta, C.F.; Berry, C.P.L.; Berti, E.; Amaro-Seoane, P.; Petiteau, A.; Klein, A. Science with the space-based interferometer LISA. V: Extreme mass-ratio inspirals. Phys. Rev. D 2017, 95, 103012. [Google Scholar] [CrossRef]
- Caprini, C.; Figueroa, D.G. Cosmological Backgrounds of Gravitational Waves. Class. Quant. Grav. 2018, 35, 163001. [Google Scholar] [CrossRef]
- Press, W.H.; Teukolsky, S.A.; Vetterling, W.T.; Flannery, B.P. Numerical Recipes; Cambridge University Press: Cambridge, UK, 1992. [Google Scholar]
- Verde, L. Statistical Methods in Cosmology. In Lectures on Cosmology; Springer: Berlin/Heidelberg, Germany, 2010; pp. 147–177. [Google Scholar] [CrossRef]


| Method | Time Scale (Yr) | References | |
|---|---|---|---|
| Hubble diagram SnIa— confidence level | 0.1 | ∼ | [69] |
| Gravitational waves | 8 | [70] | |
| Paleontology | [71] | ||
| Big Bang Nucleosynthesis— confidence level * | [72,73] | ||
| Anisotropies in CMB— confidence level * | [74] |
| Standard Sirens | CMB+BAO | Pantheon+ | Standard Sirens+Pantheon+ | CMB+BAO+Pantheon+ | Standard Sirens+CMB+BAO+Pantheon+ |
|---|---|---|---|---|---|
| 1013.01 | 5.58 | 1521.64 | 2575.55 | 1570.69 | 2586.44 |
| Data | |||||
| Standard Sirens | — | 0.323 ± 0.024 | 0.673 ± 0.008 | 0.052 ± 0.123 | 0.401 ± 0.397 |
| CMB+BAO | — | 0.323 ± 0.009 | 0.671 ± 0.004 | 0.008 ± 0.01 | 0.299 ± 0.048 |
| Pantheon+ | −19.24 ± 0.03 | 0.325 ± 0.02 | 0.718 ± 0.023 | 0.057 ± 0.068 | 0.995 ± 0.004 |
| Standard Sirens+Pantheon+ | −19.42 ± 0.01 | 0.321 ± 0.015 | 0.678 ± 0.004 | 0.039 ± 0.025 | 0.498 ± 0.015 |
| CMB+BAO+Pantheon+ | −19.43 ± 0.01 | 0.308 ± 0.009 | 0.678 ± 0.006 | −0.004 ± 0.007 | 0.789 ± 0.2 |
| Standard Sirens+CMB+BAO+Pantheon+ | −19.43± 0.01 | 0.31 ± 0.005 | 0.677 ± 0.003 | −0.001 ± 0.005 | 0.812 ± 0.2 |
| Data | |||
|---|---|---|---|
| Standard Sirens | — | 7.4% | 1.2% |
| CMB+BAO | — | 2.8% | 0.6% |
| Pantheon+ | 0.2% | 6.2% | 3.2% |
| Standard Sirens+Pantheon+ | 0.1% | 4.6% | 0.6% |
| CMB+BAO+Pantheon+ | 0.1% | 2.9% | 0.9% |
| Standard Sirens+CMB+BAO+Pantheon+ | 0.1% | 1.6% | 0.4% |
| Data | |
|---|---|
| Standard Sirens | 1.94 |
| CMB+BAO | 3.19 |
| Pantheon+ | 2.66 |
| Standard Sirens+Pantheon+ | 3.82 |
| CMB+BAO+Pantheon+ | 3.72 |
| Standard Sirens+CMB+BAO+Pantheon+ | 3.9 |
Disclaimer/Publisher’s Note: The statements, opinions and data contained in all publications are solely those of the individual author(s) and contributor(s) and not of MDPI and/or the editor(s). MDPI and/or the editor(s) disclaim responsibility for any injury to people or property resulting from any ideas, methods, instructions or products referred to in the content. |
© 2023 by the authors. Licensee MDPI, Basel, Switzerland. This article is an open access article distributed under the terms and conditions of the Creative Commons Attribution (CC BY) license (https://creativecommons.org/licenses/by/4.0/).
Share and Cite
Paraskevas, E.A.; Perivolaropoulos, L. Effects of a Late Gravitational Transition on Gravitational Waves and Anticipated Constraints. Universe 2023, 9, 317. https://doi.org/10.3390/universe9070317
Paraskevas EA, Perivolaropoulos L. Effects of a Late Gravitational Transition on Gravitational Waves and Anticipated Constraints. Universe. 2023; 9(7):317. https://doi.org/10.3390/universe9070317
Chicago/Turabian StyleParaskevas, Evangelos Achilleas, and Leandros Perivolaropoulos. 2023. "Effects of a Late Gravitational Transition on Gravitational Waves and Anticipated Constraints" Universe 9, no. 7: 317. https://doi.org/10.3390/universe9070317
APA StyleParaskevas, E. A., & Perivolaropoulos, L. (2023). Effects of a Late Gravitational Transition on Gravitational Waves and Anticipated Constraints. Universe, 9(7), 317. https://doi.org/10.3390/universe9070317