Article

Quasi-Periodic Pulsations in an M-Class Solar Flare

1
Key Laboratory of Dark Matter and Space Science, Purple Mountain Observatory, Chinese Academy of Sciences, Nanjing 210033, China
2
School of Astronomy and Space Science, University of Science and Technology of China, Hefei 230026, China
*
Author to whom correspondence should be addressed.
Universe 2023, 9(5), 215; https://doi.org/10.3390/universe9050215
Submission received: 6 April 2023 / Revised: 28 April 2023 / Accepted: 28 April 2023 / Published: 30 April 2023
(This article belongs to the Special Issue Solar Radio Emissions)

Abstract

:
We have studied the quasi-periodic pulsations (QPPs) of the M2.3 flare that occurred in the active region NOAA 12172 on 23 September 2014. Through the fast Fourier transform (FFT) method, we decompose the flare light curves into fast- and slowly-varying components, and the cut-off threshold is 100 s. We find that the QPPs have a period of 40 s at soft X-ray (SXR), hard X-ray (HXR), radio and ultraviolet (UV). Based on the Atmospheric Imaging Assembly (AIA) on the Solar Dynamics Observatory (SDO), we find that the QPPs take place at the same time interval as the flare ribbon separation, and that the QPPs seem to originate from the flare ribbons. Our observations tend to support the mechanism of the periodic nonthermal electron injection during the flare eruption.

1. Introduction

In the process of solar flare explosion, a large number of electrons are accelerated to a non-thermal state in a short time. These non-thermal electrons have undergone dynamic processes such as injection, deposition, capture and energy dissipation in the solar atmosphere, and have produced a series of explosion phenomena. Quasi-periodic pulsations (QPPs) are a common phenomenon in the process of solar flares. In recent years, studies have found evidence of QPPs across a wide range of wavelengths from radio [1,2], soft X-ray and EUV [3,4], Ly α  [5,6], and even γ -rays [7,8]. In addition, flare QPPs have also been detected in spectroscopic observations, such as Doppler-shift oscillations [9,10,11,12], or Solar Ultraviolet Measurement of Emitted Radiation (SUMER) oscillations [13,14]. According to a large number of observation results, the period of QPPs can generally be divided into sub-second, second and minute bands [15]. Generally, sub-second QPPs are often detected in the radio and HXR bands [16,17,18,19,20]. These QPPs may be related to the dynamic interaction process of high-energy electrons in the flare loops, and these charged particles generate HXR and microwave radiation through bremsstrahlung and cyclotron synchrotron mechanisms, respectively [16,21,22,23]. QPPs with a period of several seconds to several minutes can be detected in a wide wavelength range, and they may be related to magnetohydrodynamics (MHD) processes [24,25]. Long-period QPPs with a period of several minutes to tens of minutes have also been detected in the broad emission band of solar flares, which may be caused by violent flare eruptions in the solar active region [26].
QPPs are not only observed in large flares, but also recognized in smaller flares [27] and even microflares [28]. So far, the most powerful solar flare detected with QPPs is the X14.4 flare [29]. The period of QPPs ranges from 1 to 5 min and is detected in radio and hard X-ray (HXR) emissions. The second most powerful solar flare with detected QPPs is a X9.3 flare, which is the most powerful flare of solar cycle 24 [30]. The energy of these powerful flares are in the realm of typically observed stellar flare energies, and solar flares such as these are useful for bridging the energy gap between solar and stellar flares [31]. Events like these are really helpful for us to study QPPs in solar and stellar flares. Detailed research on individual flare events can help us better understand the properties and physical processes of QPPs, while statistical research on large-scale events can help us understand the general properties of QPPs [4,32,33,34], such as prevalence and characteristic timescales. In addition, utilizing statistical research of QPPs and the properties of flare region is beneficial for determining the scaling laws of QPPs [35] in solar flares, which can help confirm or exclude some mechanisms.
As one of the important phenomena in solar flares, the physical mechanism behind QPPs is still unclear. There are a number of explanations about QPPs. QPPs may be related to the periodic burst mechanism of magnetic reconnection, such as the tearing of current sheet related to multiple plasmoids [36]. Kumar & Cho [37] observed several multiple plasmoids and DPSs for about one minute, and the results showed that in radio and HXR, the tearing of current sheet and the formation of multiple plasmoids can produce QPPs with a period of several seconds to several minutes. In the model proposed by Takasao et al. [38], the formation and structural evolution of the shock wave in the back ring of the flare were numerically simulated. It was found that the intensity of the end shock wave showed quasi-periodic pulsations. The combination of current-carrying coronal loops can lead to periodic changes in the width of the current sheet and produce non-thermal electrons, thus generating QPPs in the HXR and radio wavelengths [39,40]. The interaction of MHD waves can also induce the generation of QPPs. Ning et al. [41] studied the periodic explosive event with a period of 3–5 min produced by the periodic magnetic reconnection modulated by MHD waves. So far, observations have not been able to distinguish between these mechanisms, and flare models have not been able to accurately reproduce the evolution of QPPs. Once the mechanism is determined, QPP is expected to provide a unique diagnostic tool for the physical process of flare energy release.
In this paper, the data used are from the Geostationary Operational Environmental Satellites (GOES), the Reuven Ramaty High Energy Solar Spectroscopic Imager (RHESSI) [42], the Nobeyama Radio Polarimeters (NoRP), and the Atmospheric Imaging Assembly (AIA) [43] onboard the Solar Dynamics Observatory (SDO) [44]. We investigate the QPPs in soft X-ray (SXR), hard X-ray (HXR) and radio bands during an M-class solar flare on 23 September 2014. Interestingly, both the global integral and the local integral of the flare area show the QPPs with a period of 40 s.

2. Observation and Measurement

According to the observation of GOES, this flare began at 23:03 UT, peaked at 23:16 UT and ended at 23:28 UT. It occurred in the Active Region of NOAA 12172, with the coordinates of S14E32. In addition, this event was accompanied by a coronal mass ejection (CME) observed by SOHO/LASCO 1, with a width of 134 degrees and a speed of 331 km/s.
Figure 1a shows the GOES SXR light curve of this event. Similar to typical flare events, it shows an impulsive phase and a long decay phase. Due to the small amplitude of QPPs, it is difficult to see its behaviour on the original light curves of 1–8 Å and 0.5–4 Å. For this reason, we use Fourier Transform (FFT) method [45] to decompose the original light curve into slowly-varying components (black curve in Figure 1a, multiplied by 0.7 to prevent overlapping with the original curve) and fast-varying components (Figure 1b). In this process, we use 100 s (0.01 Hz) as the threshold value to divide the power spectrum of the light curve into low and high frequency domain, and then apply the inverse fast Fourier transform of the two parts of the power spectrum to obtain the slowly-varying (background) and rapidly varying (quasi-periodic peak) components [45]. Figure 1b showed the fast-varying components from 23:02:58 UT to 23:16 UT, we can see oscillation behavior of QPPs, which are almost oscillating in the same phase between 1–8 Å and 0.5–4 Å, and their correlation coefficient is 0.75. Compared with Fourier transform, wavelet transform is a localized analysis of time (space) and frequency. It gradually refines the signal (function) at multiple scales through dilation and translation operations, ultimately achieving time subdivision at high frequencies and frequency subdivision at low frequencies. It can automatically adapt to the requirements of time-frequency signal analysis, thus focusing on any detail of the signal and solving the difficult problem of Fourier transform. There are three functions including ‘Morlet’, ‘Paul’ and ‘DOG’ used by wavelet transform. Here, we use ‘Morlet’ as the default function and the wave number is six by default. From the wavelet spectrum and global wavelet spectrum of the fast varying components in the 1–8 Å band in Figure 1c, the period is about 40 s, and the significance level is more than 95%. The maximum amplitude of QPPs appears at about 23:09 UT, which corresponds to the impulsive phase of the flare.
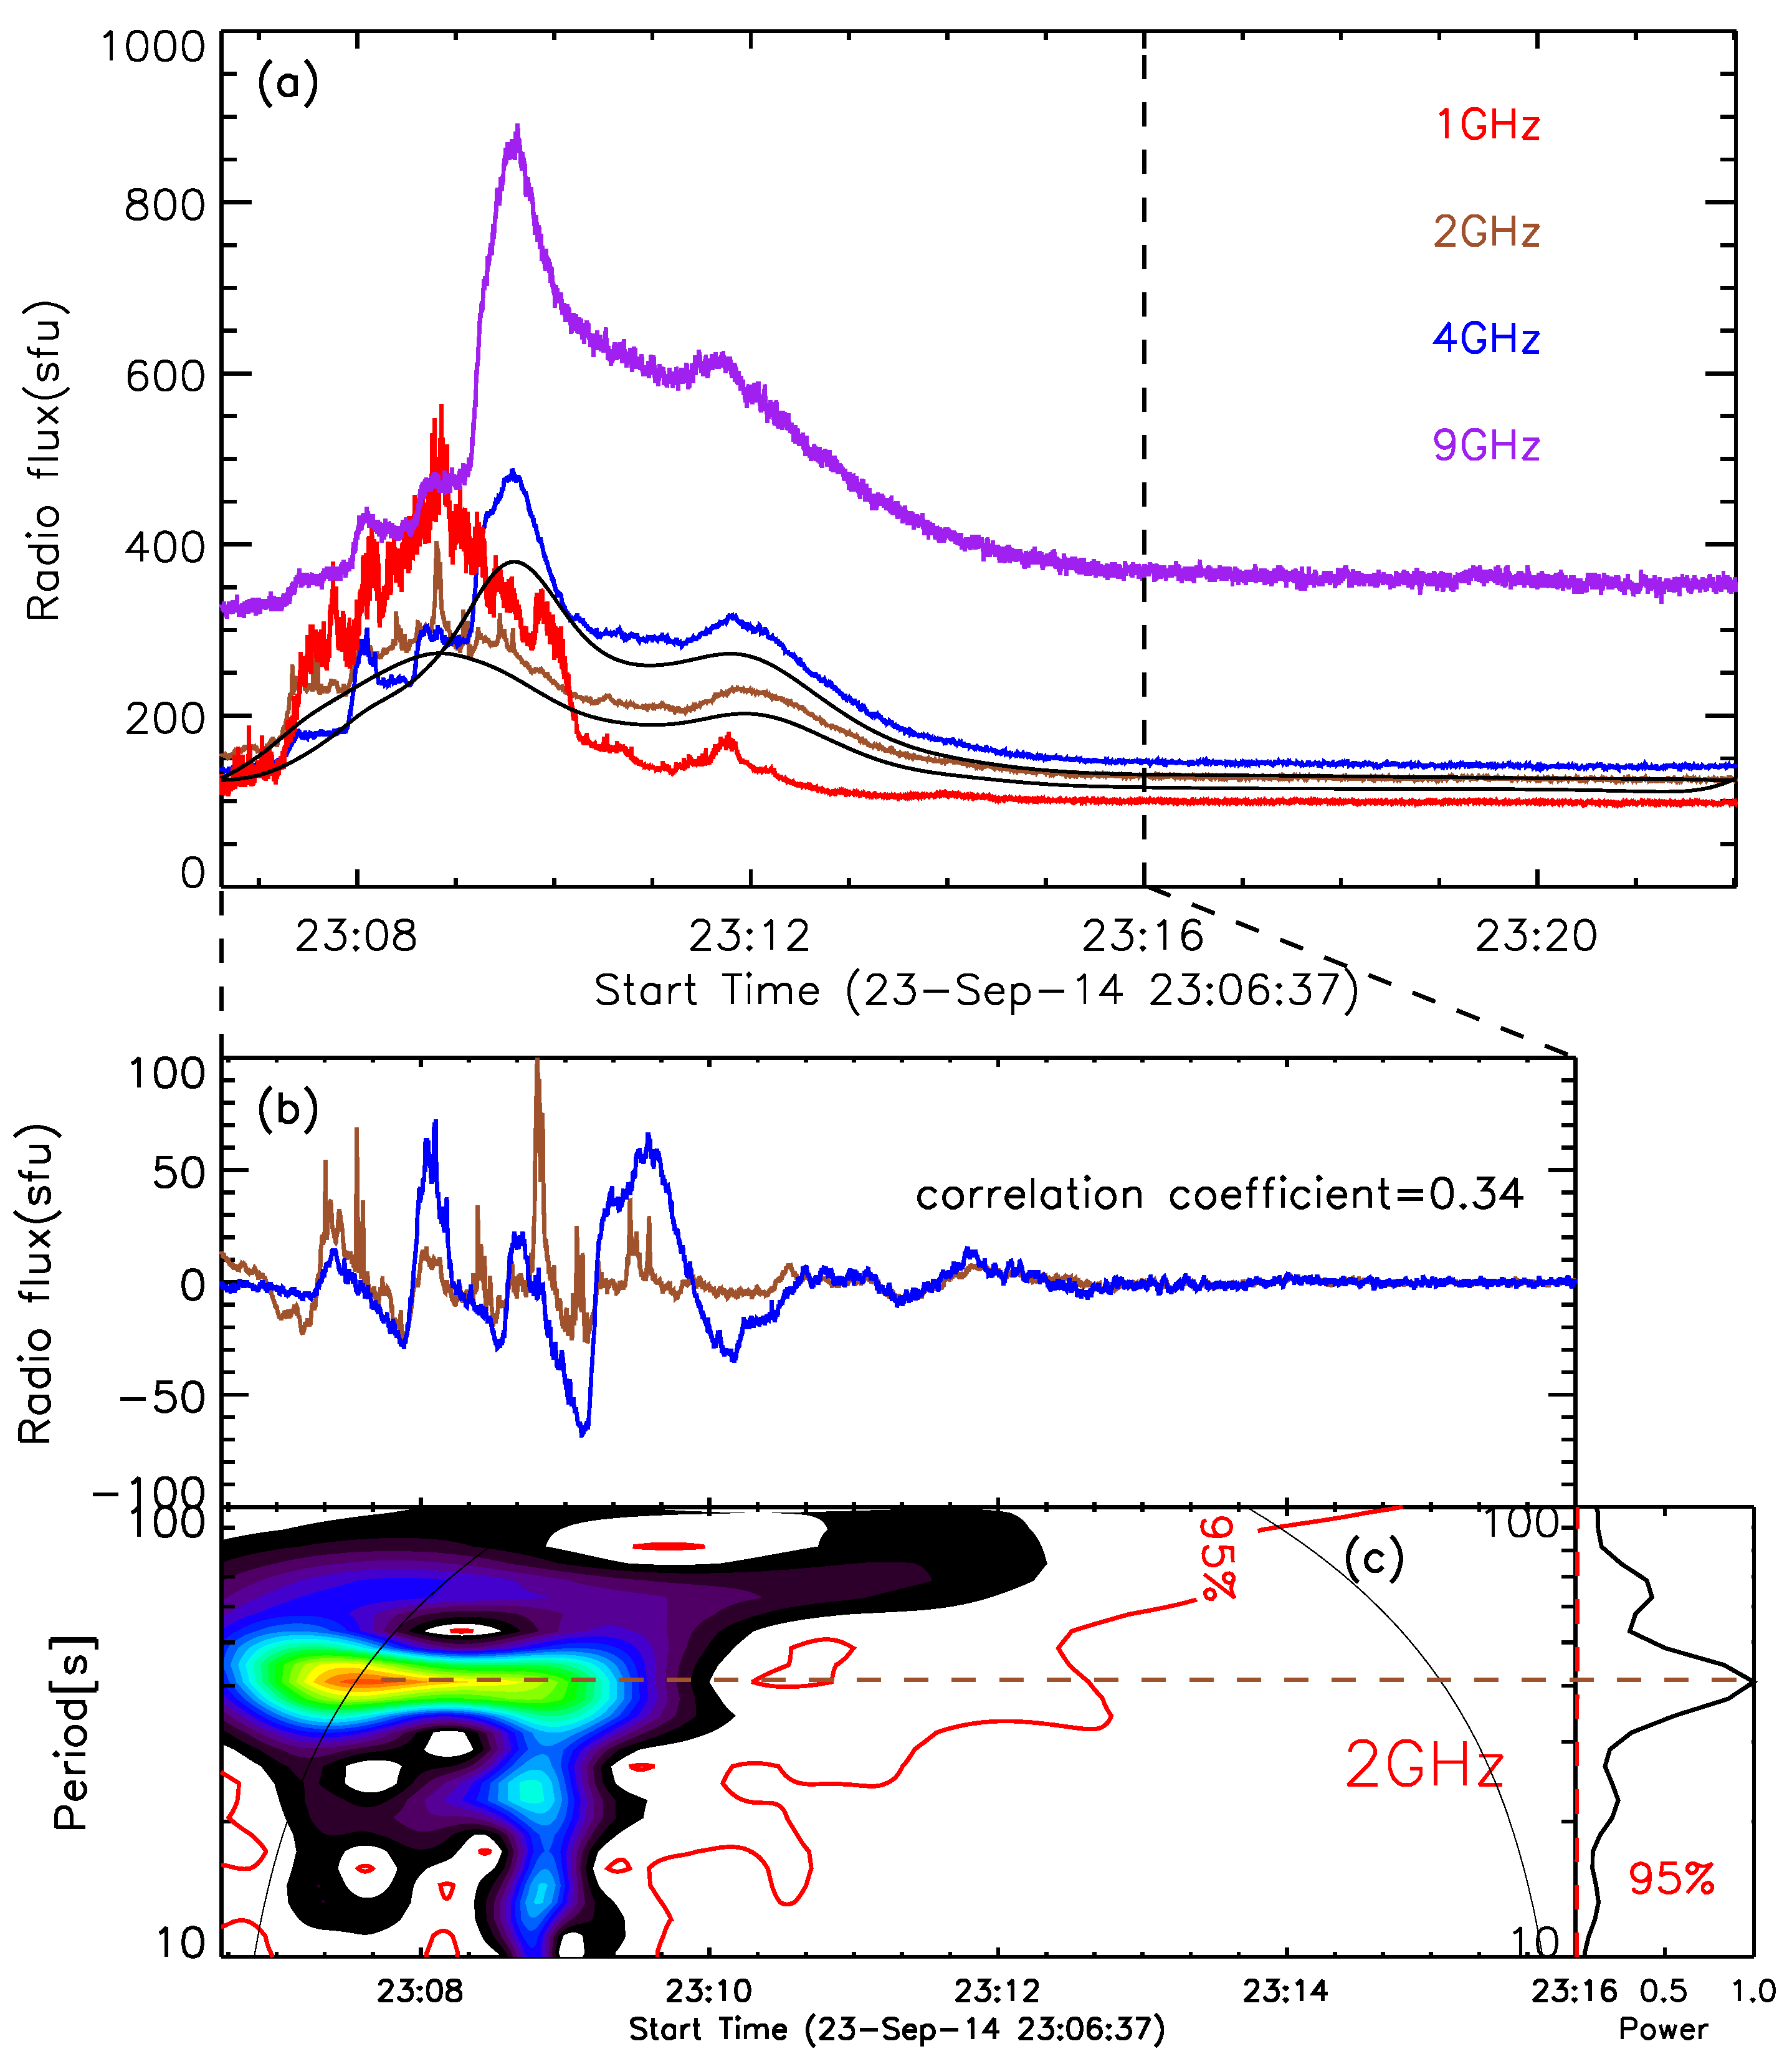
Similarly, QPPs are also detected in the radio and HXR. Figure 2a shows the radio light curves from Nobeyama Radio Polarimeters (NoRP) at 1, 2, 4, 9 GHz. It started at 23:06:37 UT, peaked at 23:11:45 UT and ended at 23:22:01 UT. There are QPPs overlying on the radio background. Using the same method as before, the original light curves of 2 GHz and 4 GHz are decomposed into slowly-varying components (black curves in Figure 2a, multiplied by 0.9) and fast-varying components, which are shown in Figure 2b from 23:06:37 UT to 23:16 UT. The QPPs have a similar phase but a weak correlation of 0.34. Figure 2c shows the wavelet spectrum as well as its global wavelet spectrum of 2 GHz. Obviously the QPPs have a period about 40 s, and the significance level is above 95%.
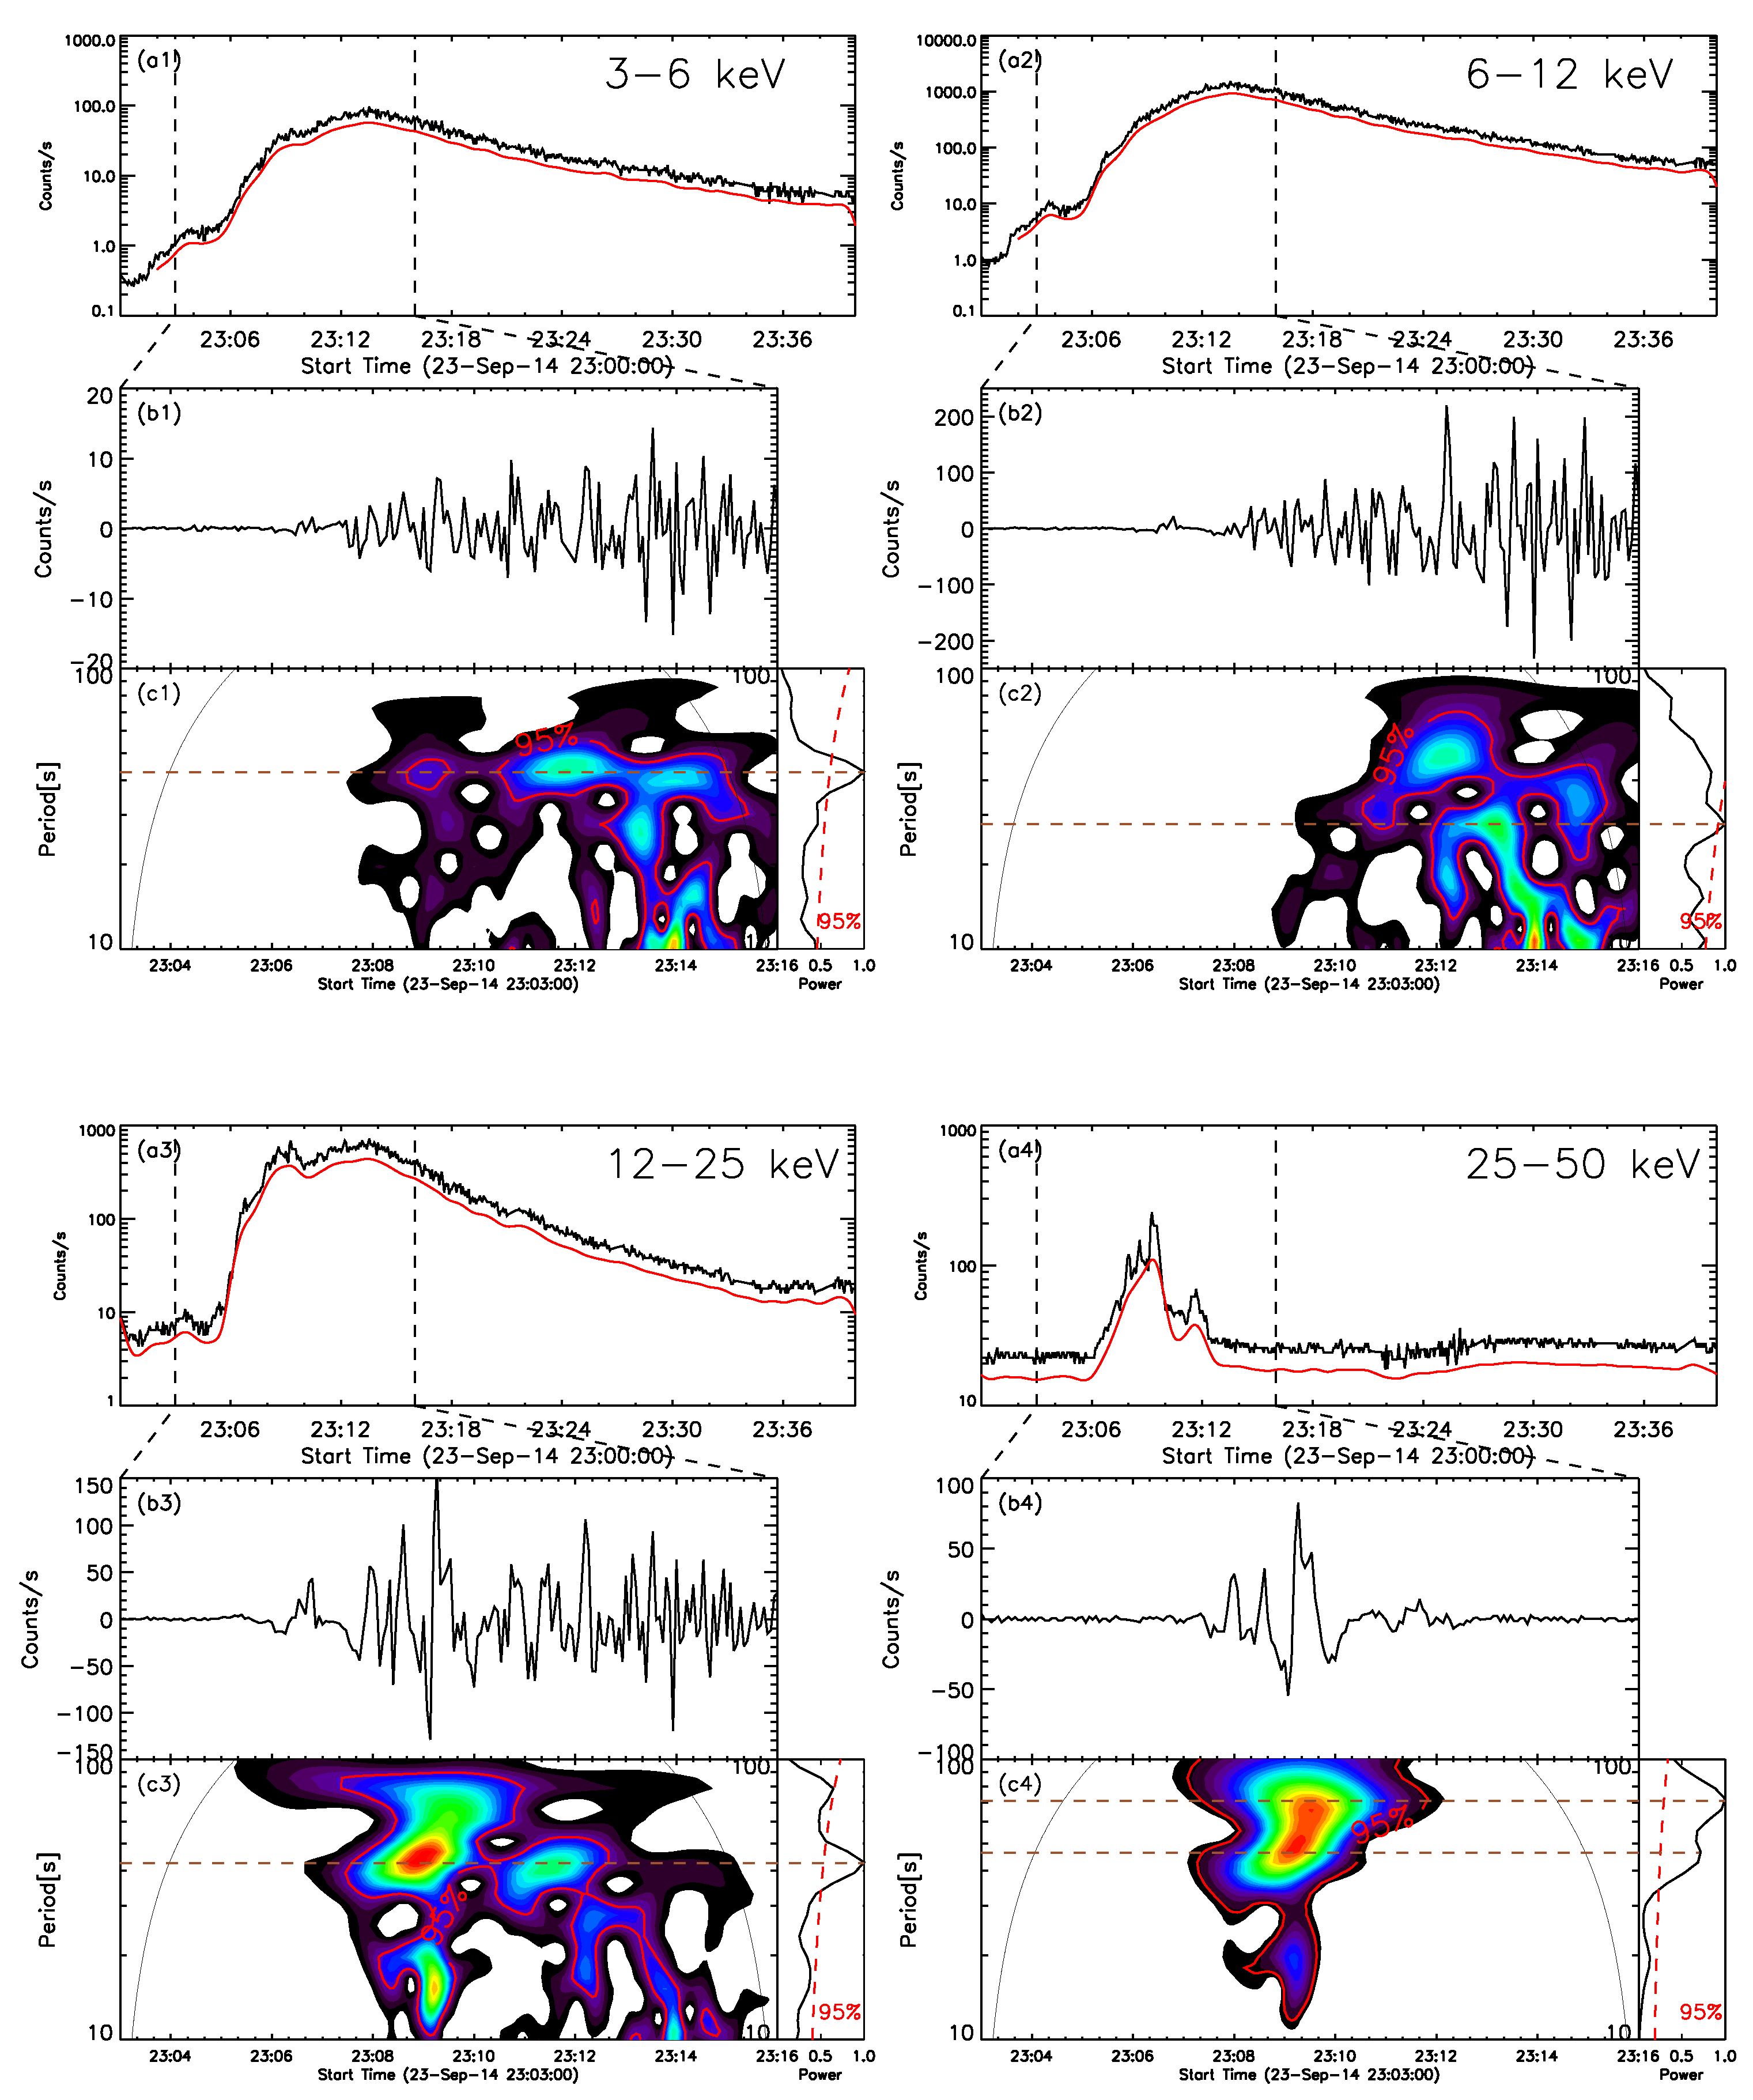
Figure 3a1–a4 shows the RHESSI light curves at 3–6 keV, 6–12 keV, 12–25 keV and 25–50 keV. Using the same method as before, their original light curves are decomposed into slowly-varying components (red curves in Figure 3a1–a4, multiplied by 0.7) and fast-varying components (Figure 3b1–b4) between 23:03 UT to 23:16 UT. And the correlation coefficient of the fast-varying components of 3–6 and 6–12 keV is 0.84, while it is 0.63 between 12–25 keV and 25–50 keV. This fact indicates that the oscillation behavior of QPPs is similar under different bands of HXR. Figure 3c1–c4 give the wavelet spectra as well as the global wavelet spectrum of 3–6 keV (thermal radiation), 6–12 keV, 12–25 keV and 25–50 keV (nonthermal radiation). And from the wavelet spectrum we can clearly see the QPPs period of about 40 s. This indicates that the QPPs have a period of about 40 s same as that in the NoRP and GOES observations. The significance level is above 95%.
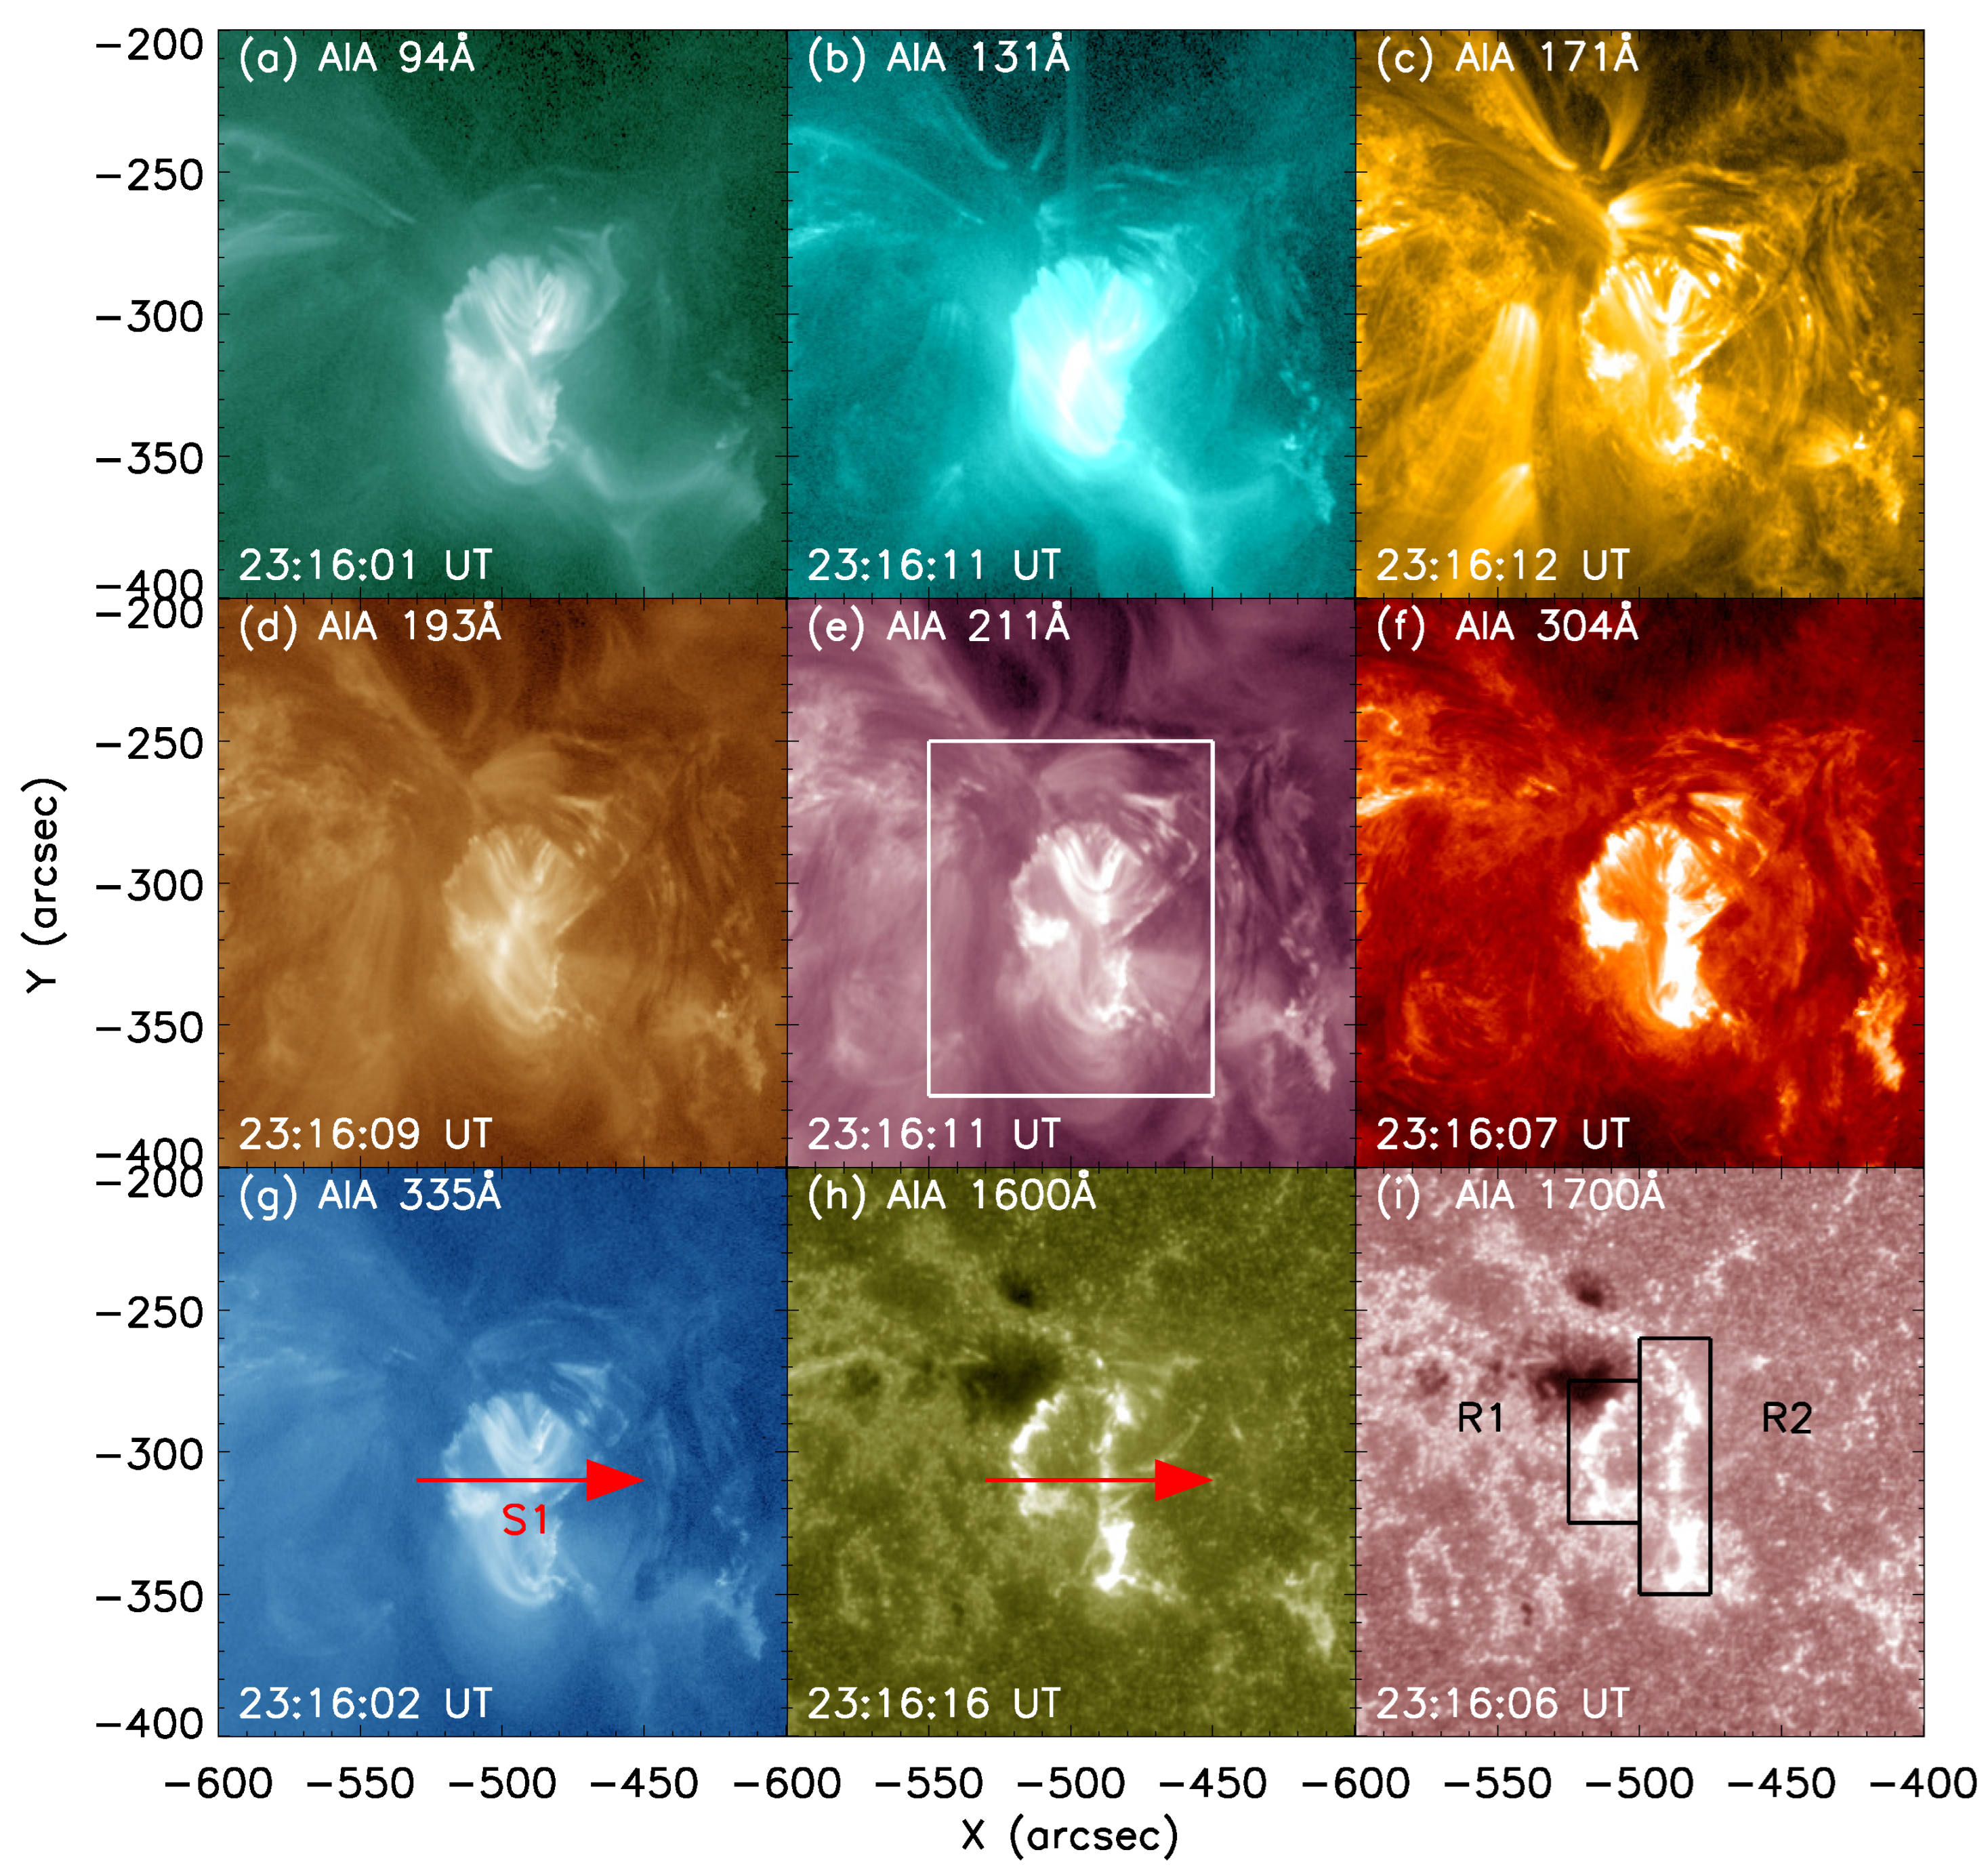
This event was also well recorded by SDO/AIA. The pixel size of AIA is 0.6 , and the time resolution is 12 s at the seven wavelengths of 94 Å, 131 Å, 171 Å, 193 Å, 211 Å, 304 Å and 335 Å, while it is 24 s at the 1600 Å and 1700 Å wavelengths. Figure 4 shows the AIA images of nine wavelengths at flare maximum of 23:16 UT. It can be seen that there are two bright ribbons (R1 and R2) at 1600 Å and 1700 Å and R1 is near by a big sunspot. Also the two ribbons can be well seen at 171 Å and 304 Å. From the AIA movie 2, the jets are detected during the flare eruption. At the beginning of the flare, the two ribbons are close, then separate rapidly with the rising of the emission at SXR, HXR and radio. The white box on AIA 211 Å image represents the area where the flare is integrated as a whole light curve at AIA 9 wavelengths, and the black boxes on AIA 1700 Å image represents the area where the flare ribbon light curves are integrated.
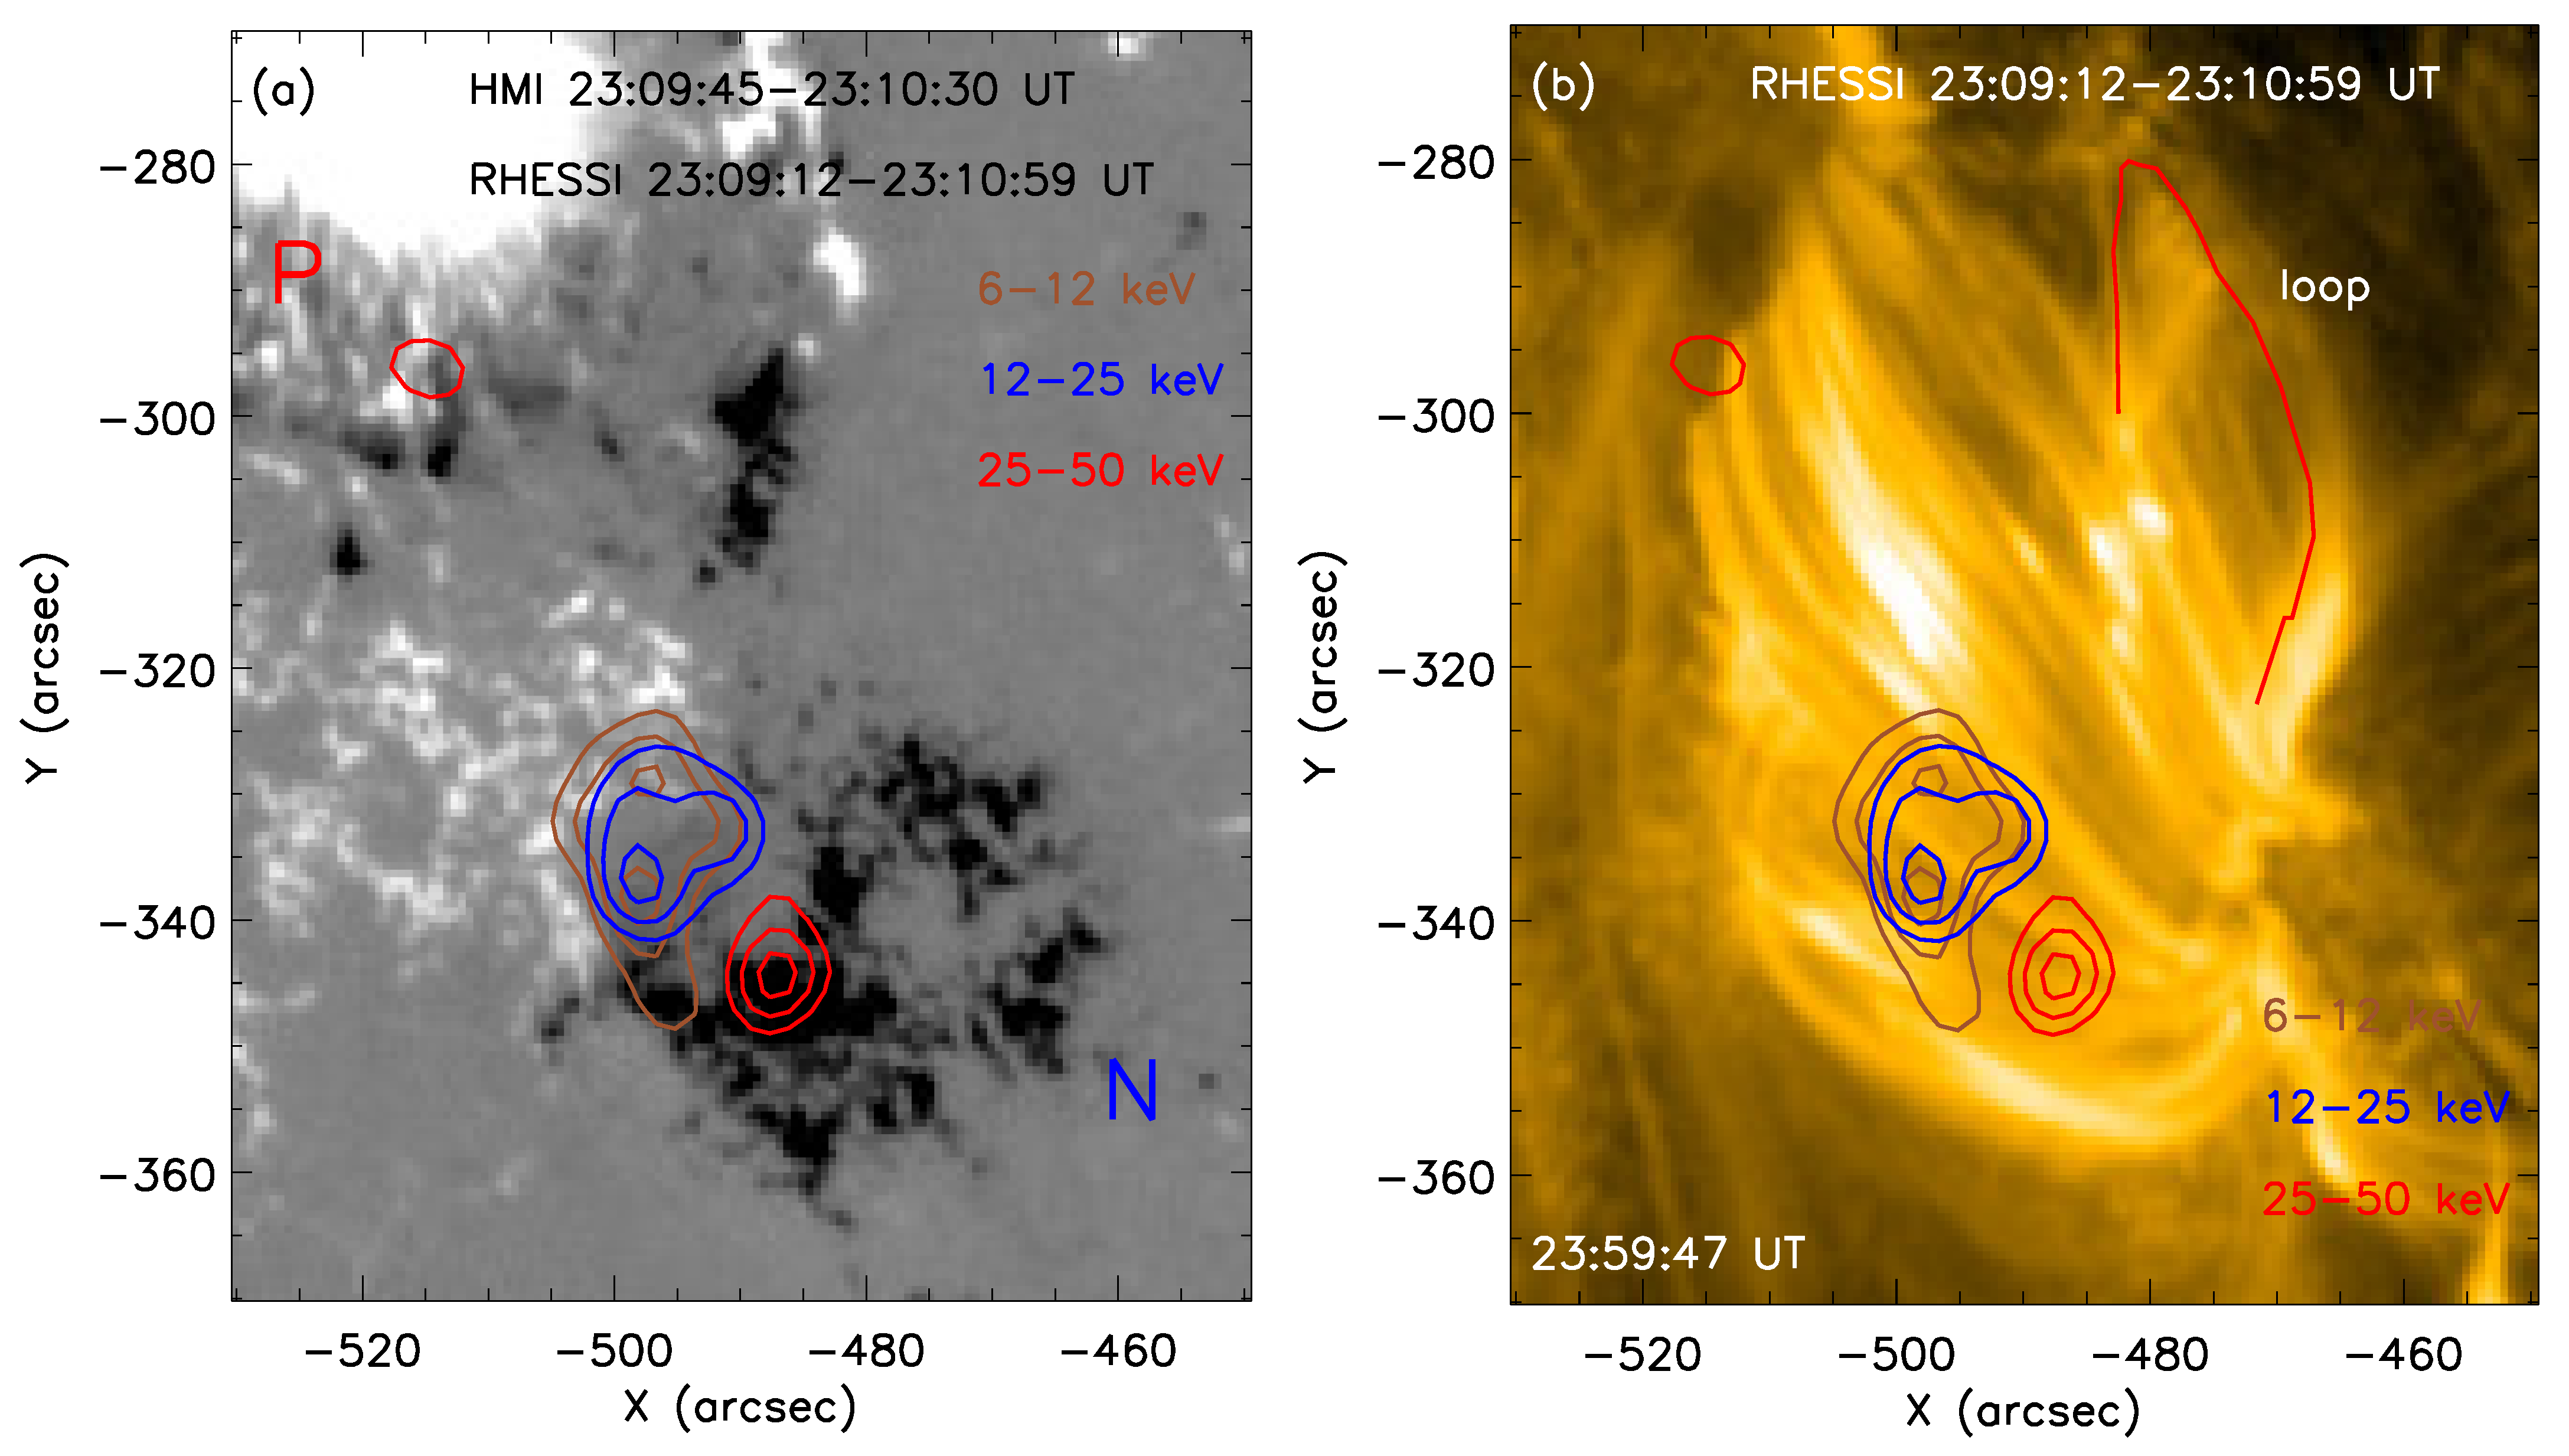
Figure 5a shows the magnetic images with RHESSI sources at 6–12 keV, 12–25 keV and 25–50 keV, and the intergration time is from 23:09:12 UT to 23:10:59 UT. There are two footpoint sources at 25–50 keV nearby the double ribbons and the sources at 6–12 keV and 12–25 keV are located at the flare loops, although they are nearby the R2. Here RHESSI X-ray sources are imaged by the CLEAN Image Reconstruction Algorithm. Figure 5b shows the RHESSI sources overlapping with the AIA 171 image at 23:59:47 UT, and in this image, we can more clearly see the relationship between the footpoints and the flare loops. And based on the distance D 55.3 arcsec between two footpoints, we assume that the flare loop is approximately semicircular, and then the length of the loop can be calculated as L = π D / 2 6.3 × 10 4 km.
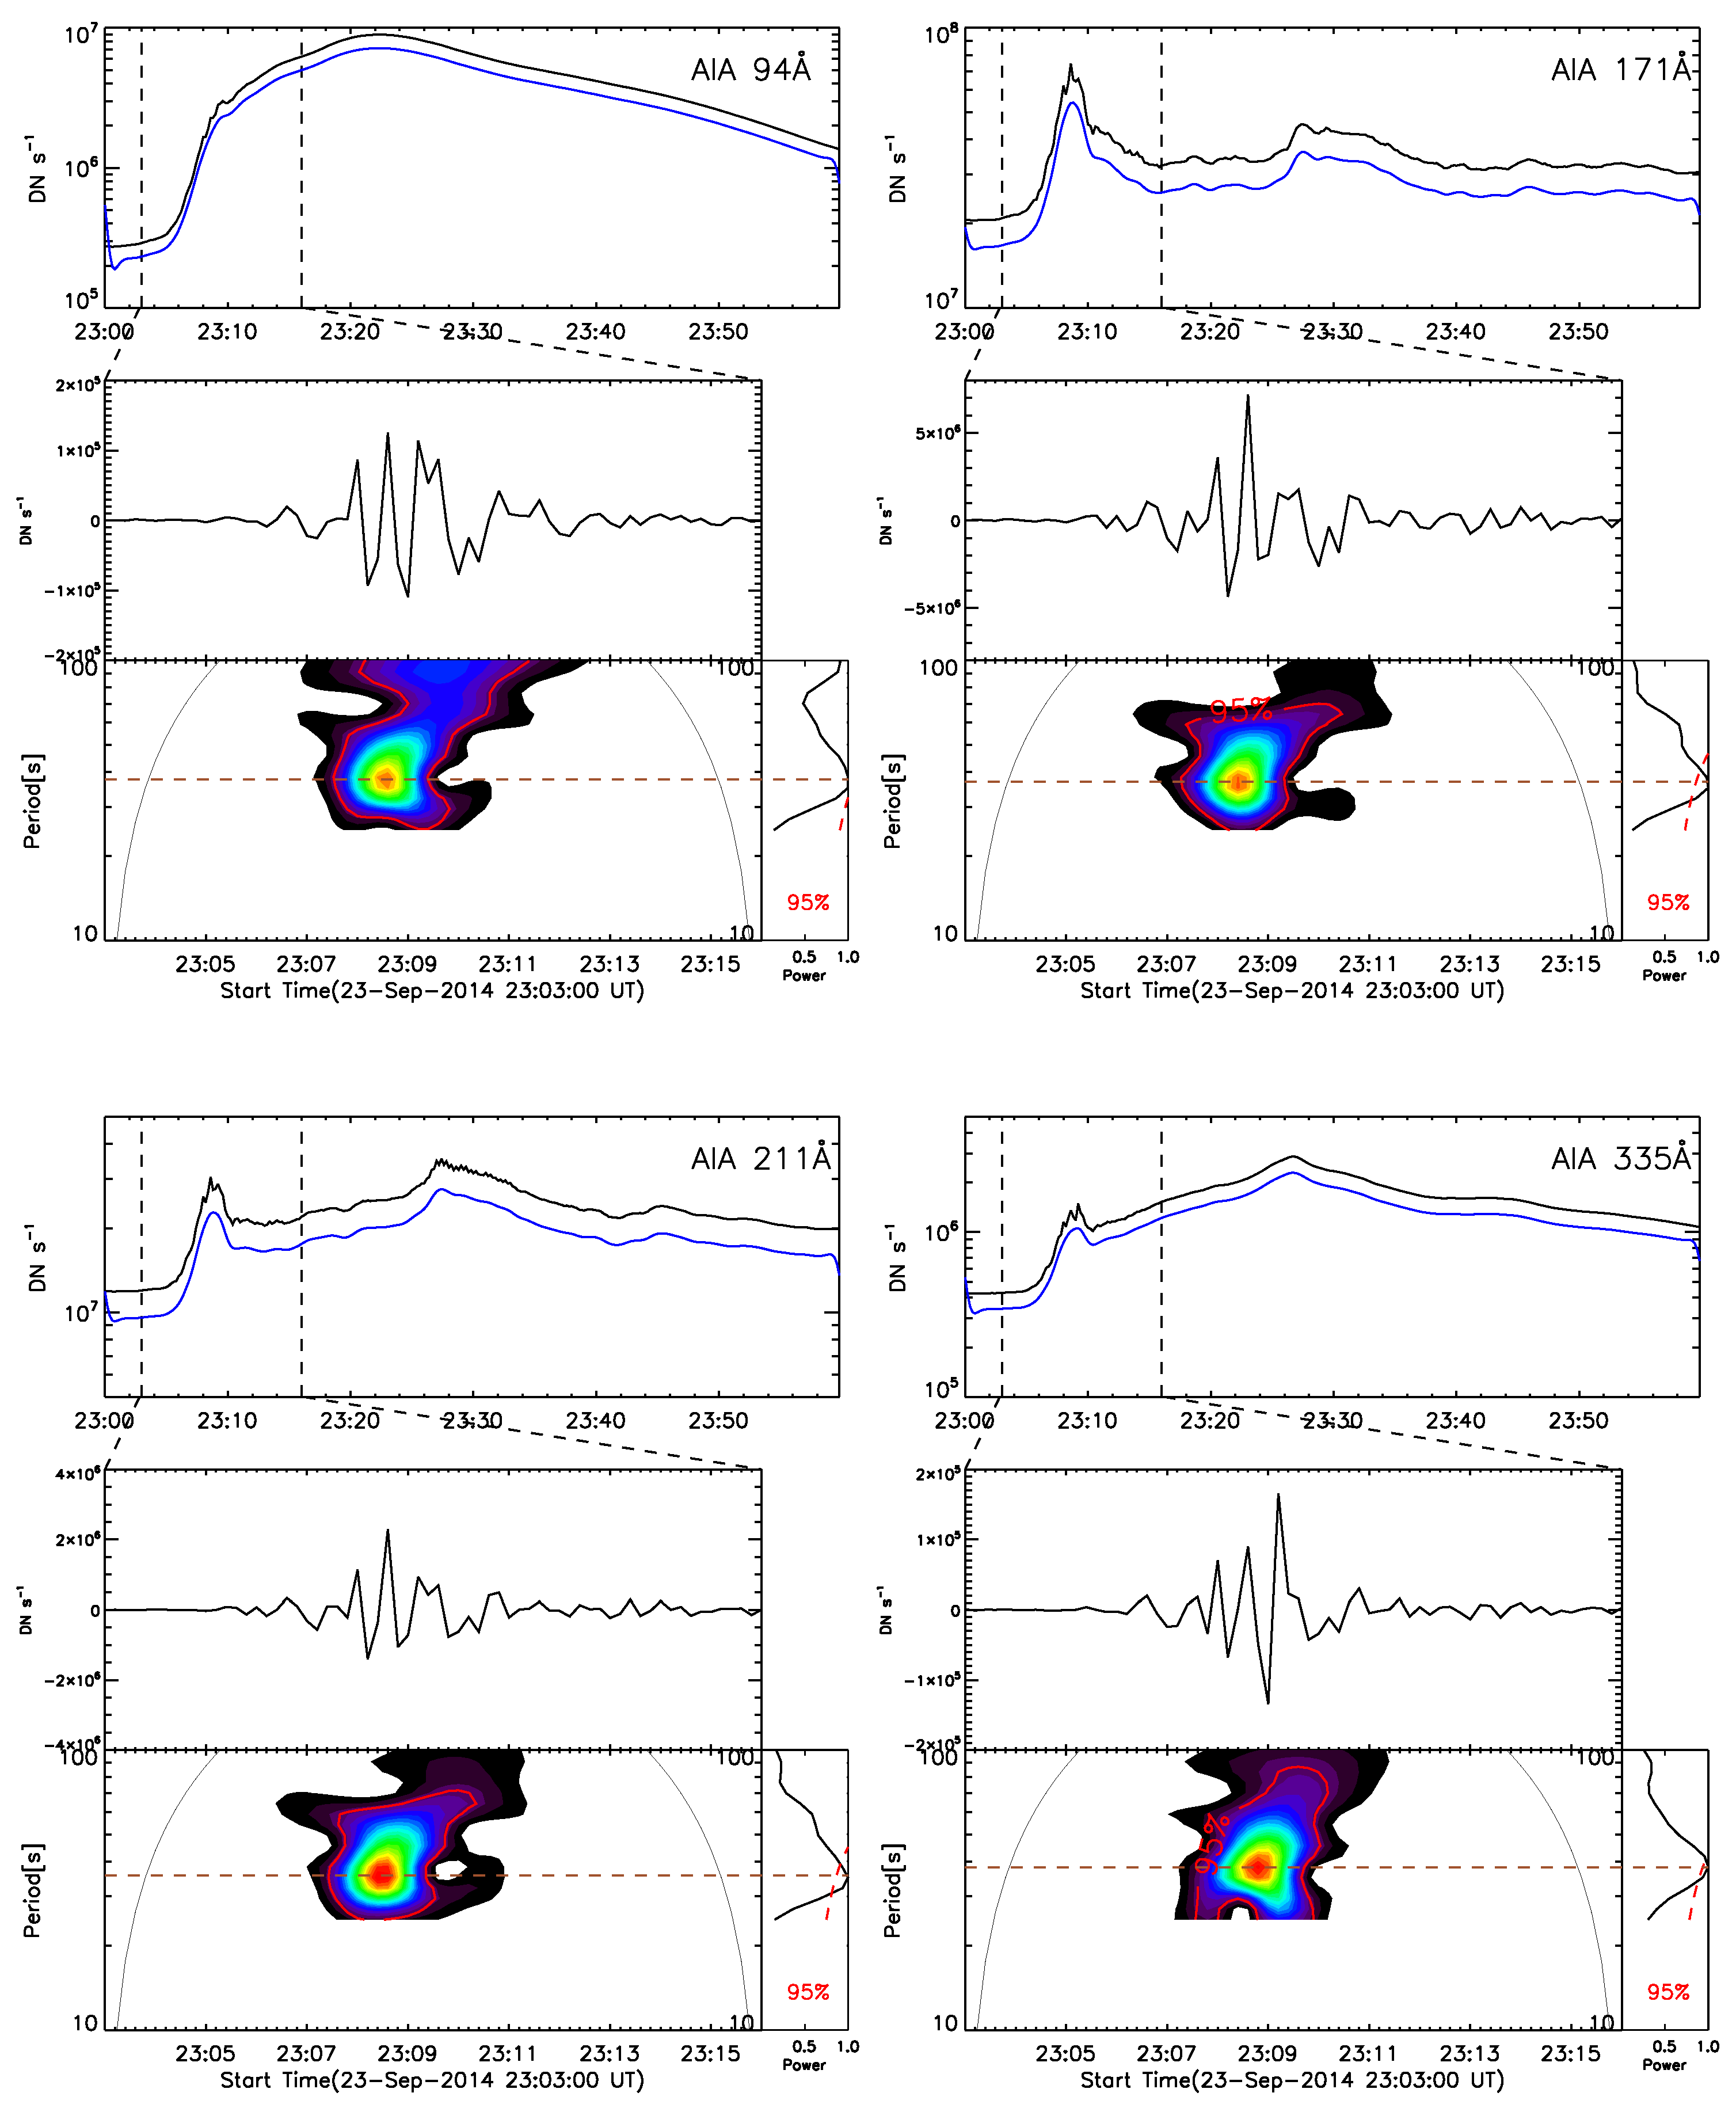
As mentioned before, this event is strong and saturates at the AIA images. Excluding the saturated images, we have performed a global integration of flare regions (the white box in Figure 4e) from the unsaturated images. Figure 6 shows the light curves at 94 Å, 171 Å, 211 Å and 335 Å. Using the same method, the light curves are decomposed into fast-varying components and slowly-varying components (blue curves, multiplied by 0.8). The threshold period used here is still 100 s. The QPPs are founded on the fast-varying components between 23:03 UT and 23:16 UT, corresponding to the impulsive phase of the flare. The wavelet spectra confirm that the oscillation period is about 40 s.

3. Results

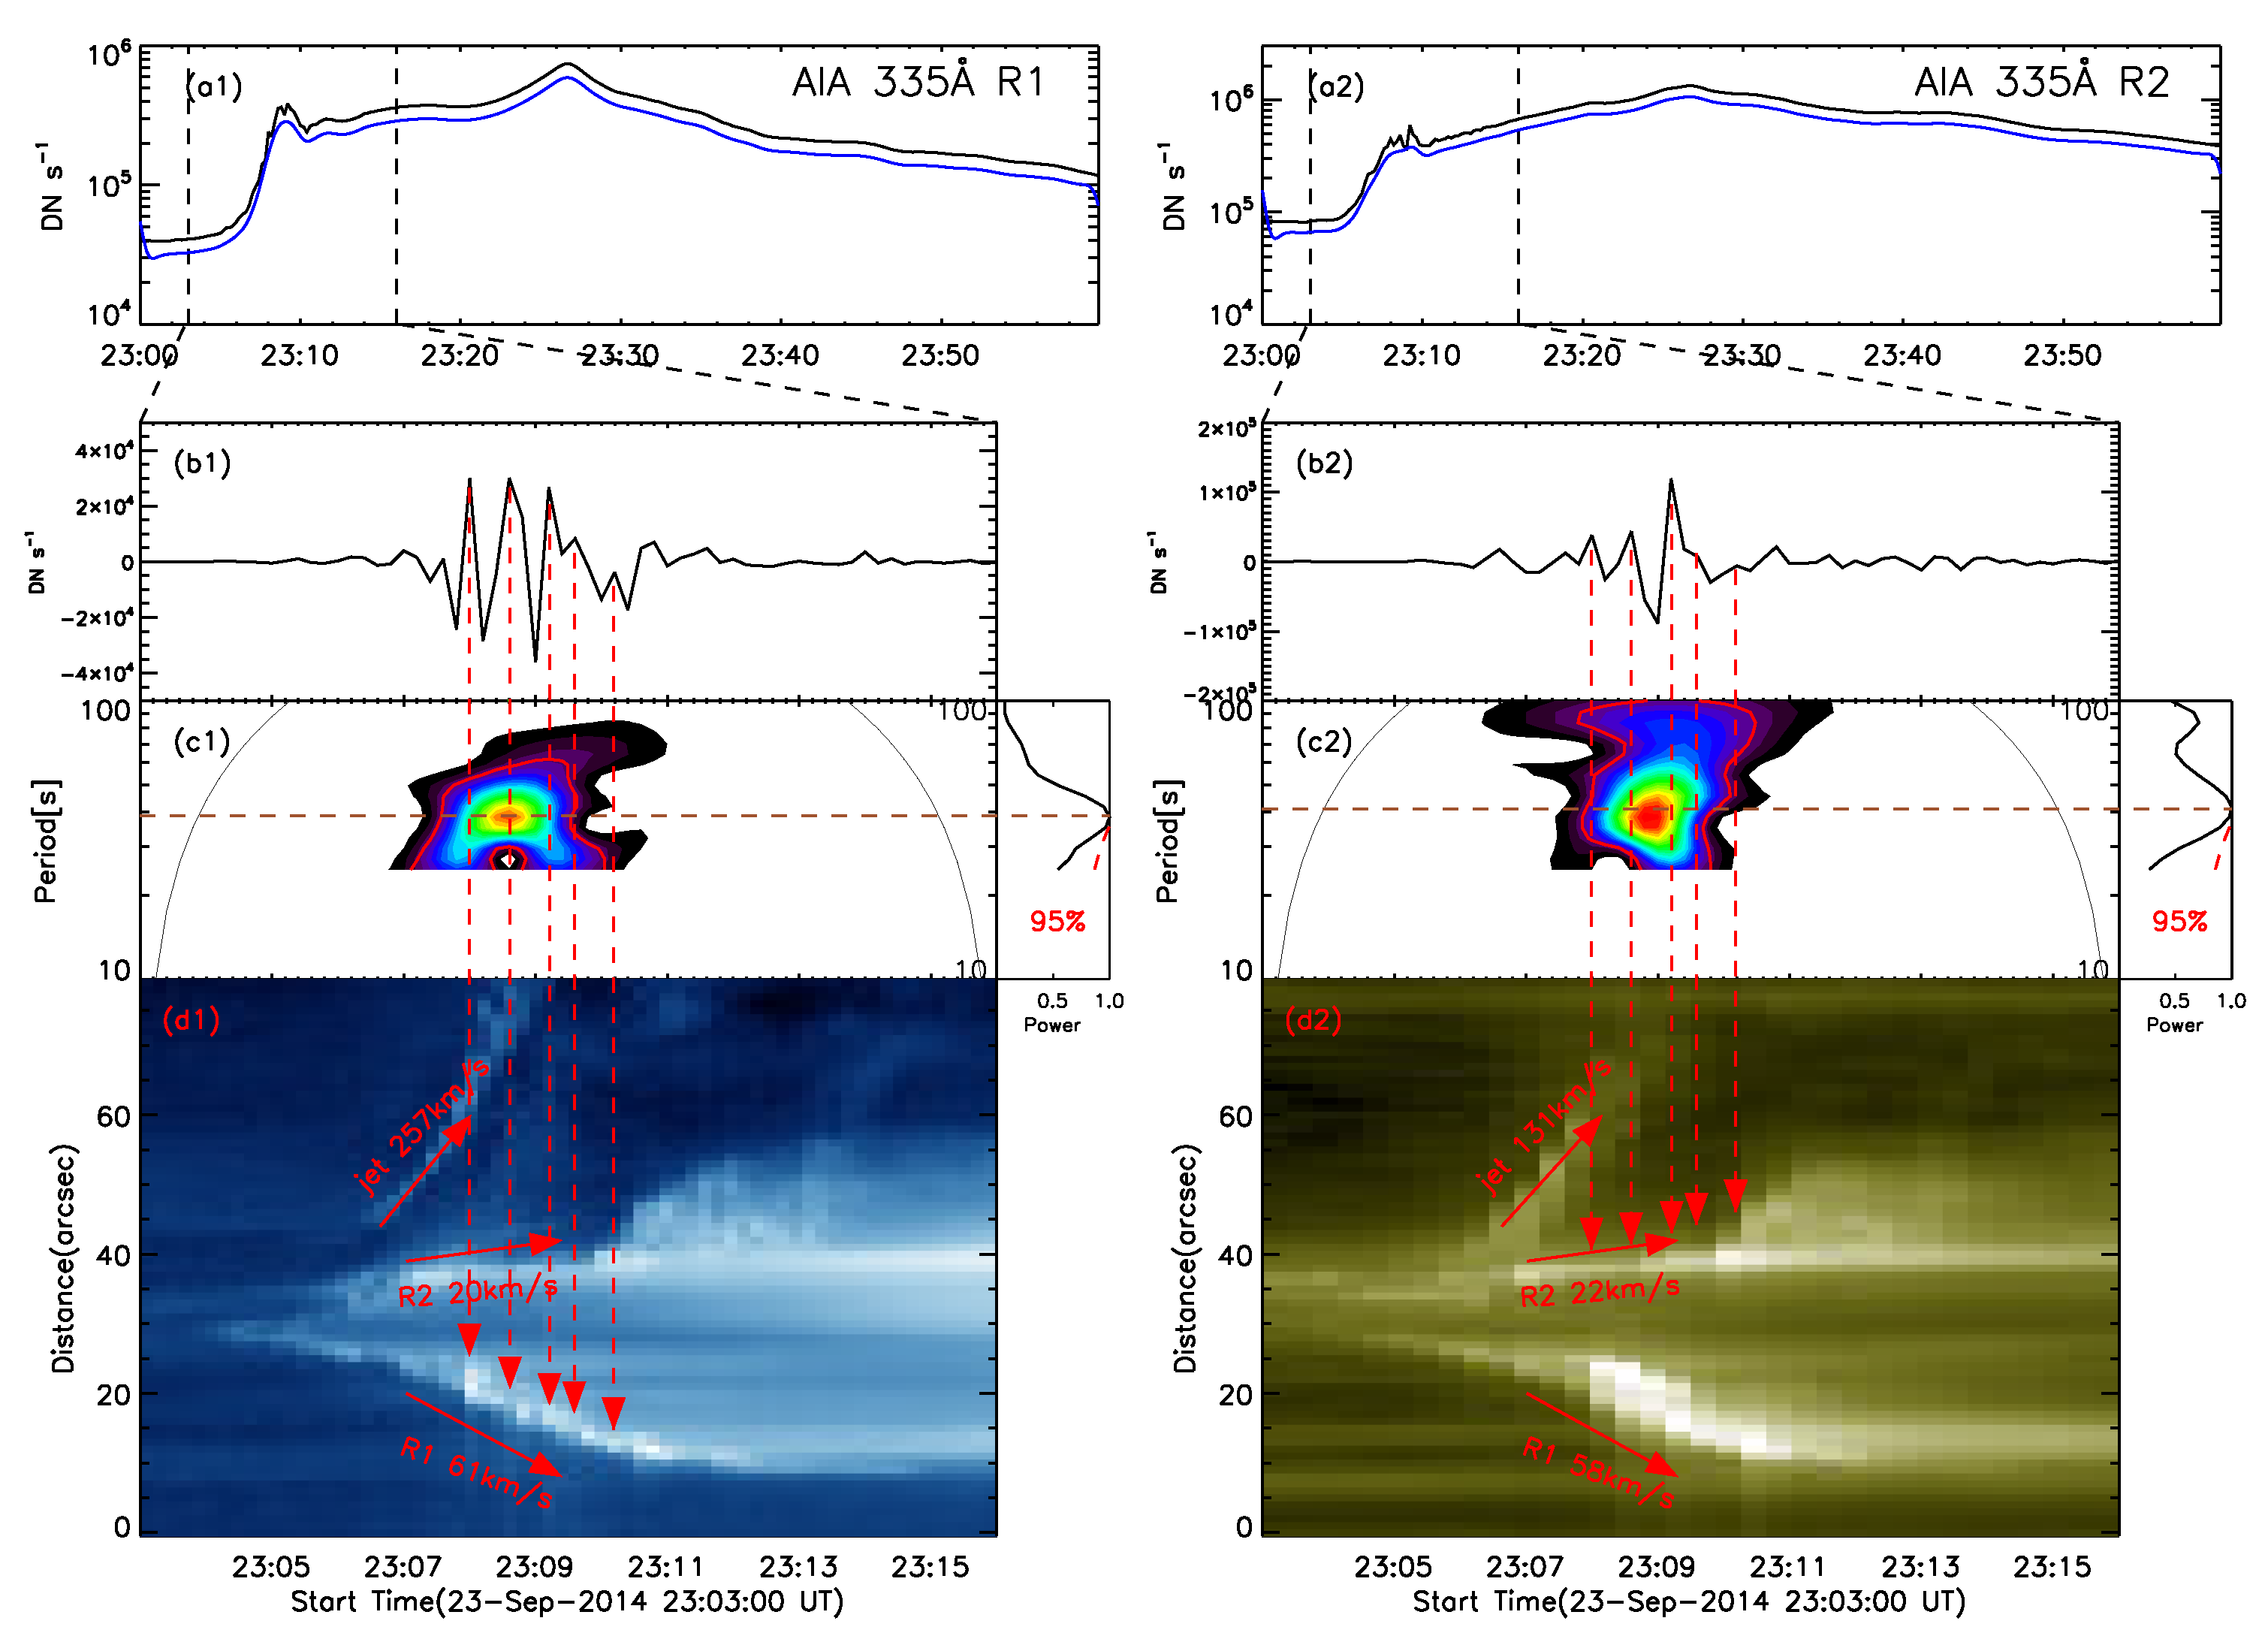
There are currently many theories and models for the origin and mechanism of QPPs. In this article, we try to clarify where and when it happened. Interestingly, we find that the QPPs take place during the separation of flare ribbons. Figure 7 presents the light curves of two flare ribbons in 335 Å as well as their fast-varying components, wavelet spectra and time-distance diagrams. The oscillation process is very short and ends before the formation of the flare loop. Figure 7a1,a2 presents the 335 Å light curves from the flare ribbons at R1 and R2 (the black boxes in Figure 4i). Using the same method, they are decomposed into slowly-varying components (blue lines, multiplied by 0.8) and fast-varying components. Figure 7b1,b2,c1,c2 gives the fast-varying components and wavelet spectra between 23:03 UT and 23:16 UT. Similar to the light curves from whole flare region in Figure 6, QPPs are detected on the ribbons. The wavelet spectra at Figure 7c1,c2 show that QPPs have a period of about 40 s. Figure 7d1,d2 gives the time-distance images along the slice S1, which is marked by red arrows in Figure 4 on 335 Å and 1600 Å images. The arrow direction presents the y-axis from 0 to 80 arcsecs in Figure 7d1,d2. In order to detect the ribbon separation speed, S1 is outlined perpendicularly to the ribbons. In the time-distance diagram at 335 Å, the velocities of R1, R2 and jet are 61, 20 and 257 km/s, respectively, while they are 58, 22 and 131 km/s at 1600 Å. Obviously, the R1 has a faster separation speed than R2. It is possible that R2 is located at the strong magnetic field region. In addition, the jet is also detected at 335 Å and 1600 Å. We map the five peaks of the fast-varying components to the positions of R1 and R2 in the time-distance diagrams, respectively. In the 335 Å time-distance diagram, the oscillating peaks correspond to the bright spots on the ribbons as marked by black boxes. Due to the relatively small distance and speed of R2 during the separation, it is not easy to see the small amplitude of QPPs in the time-distance diagram. Figure 7 shows that the oscillations of R1 and R2 occur almost simultaneously, and the oscillations occur during the separation of the flare ribbons.
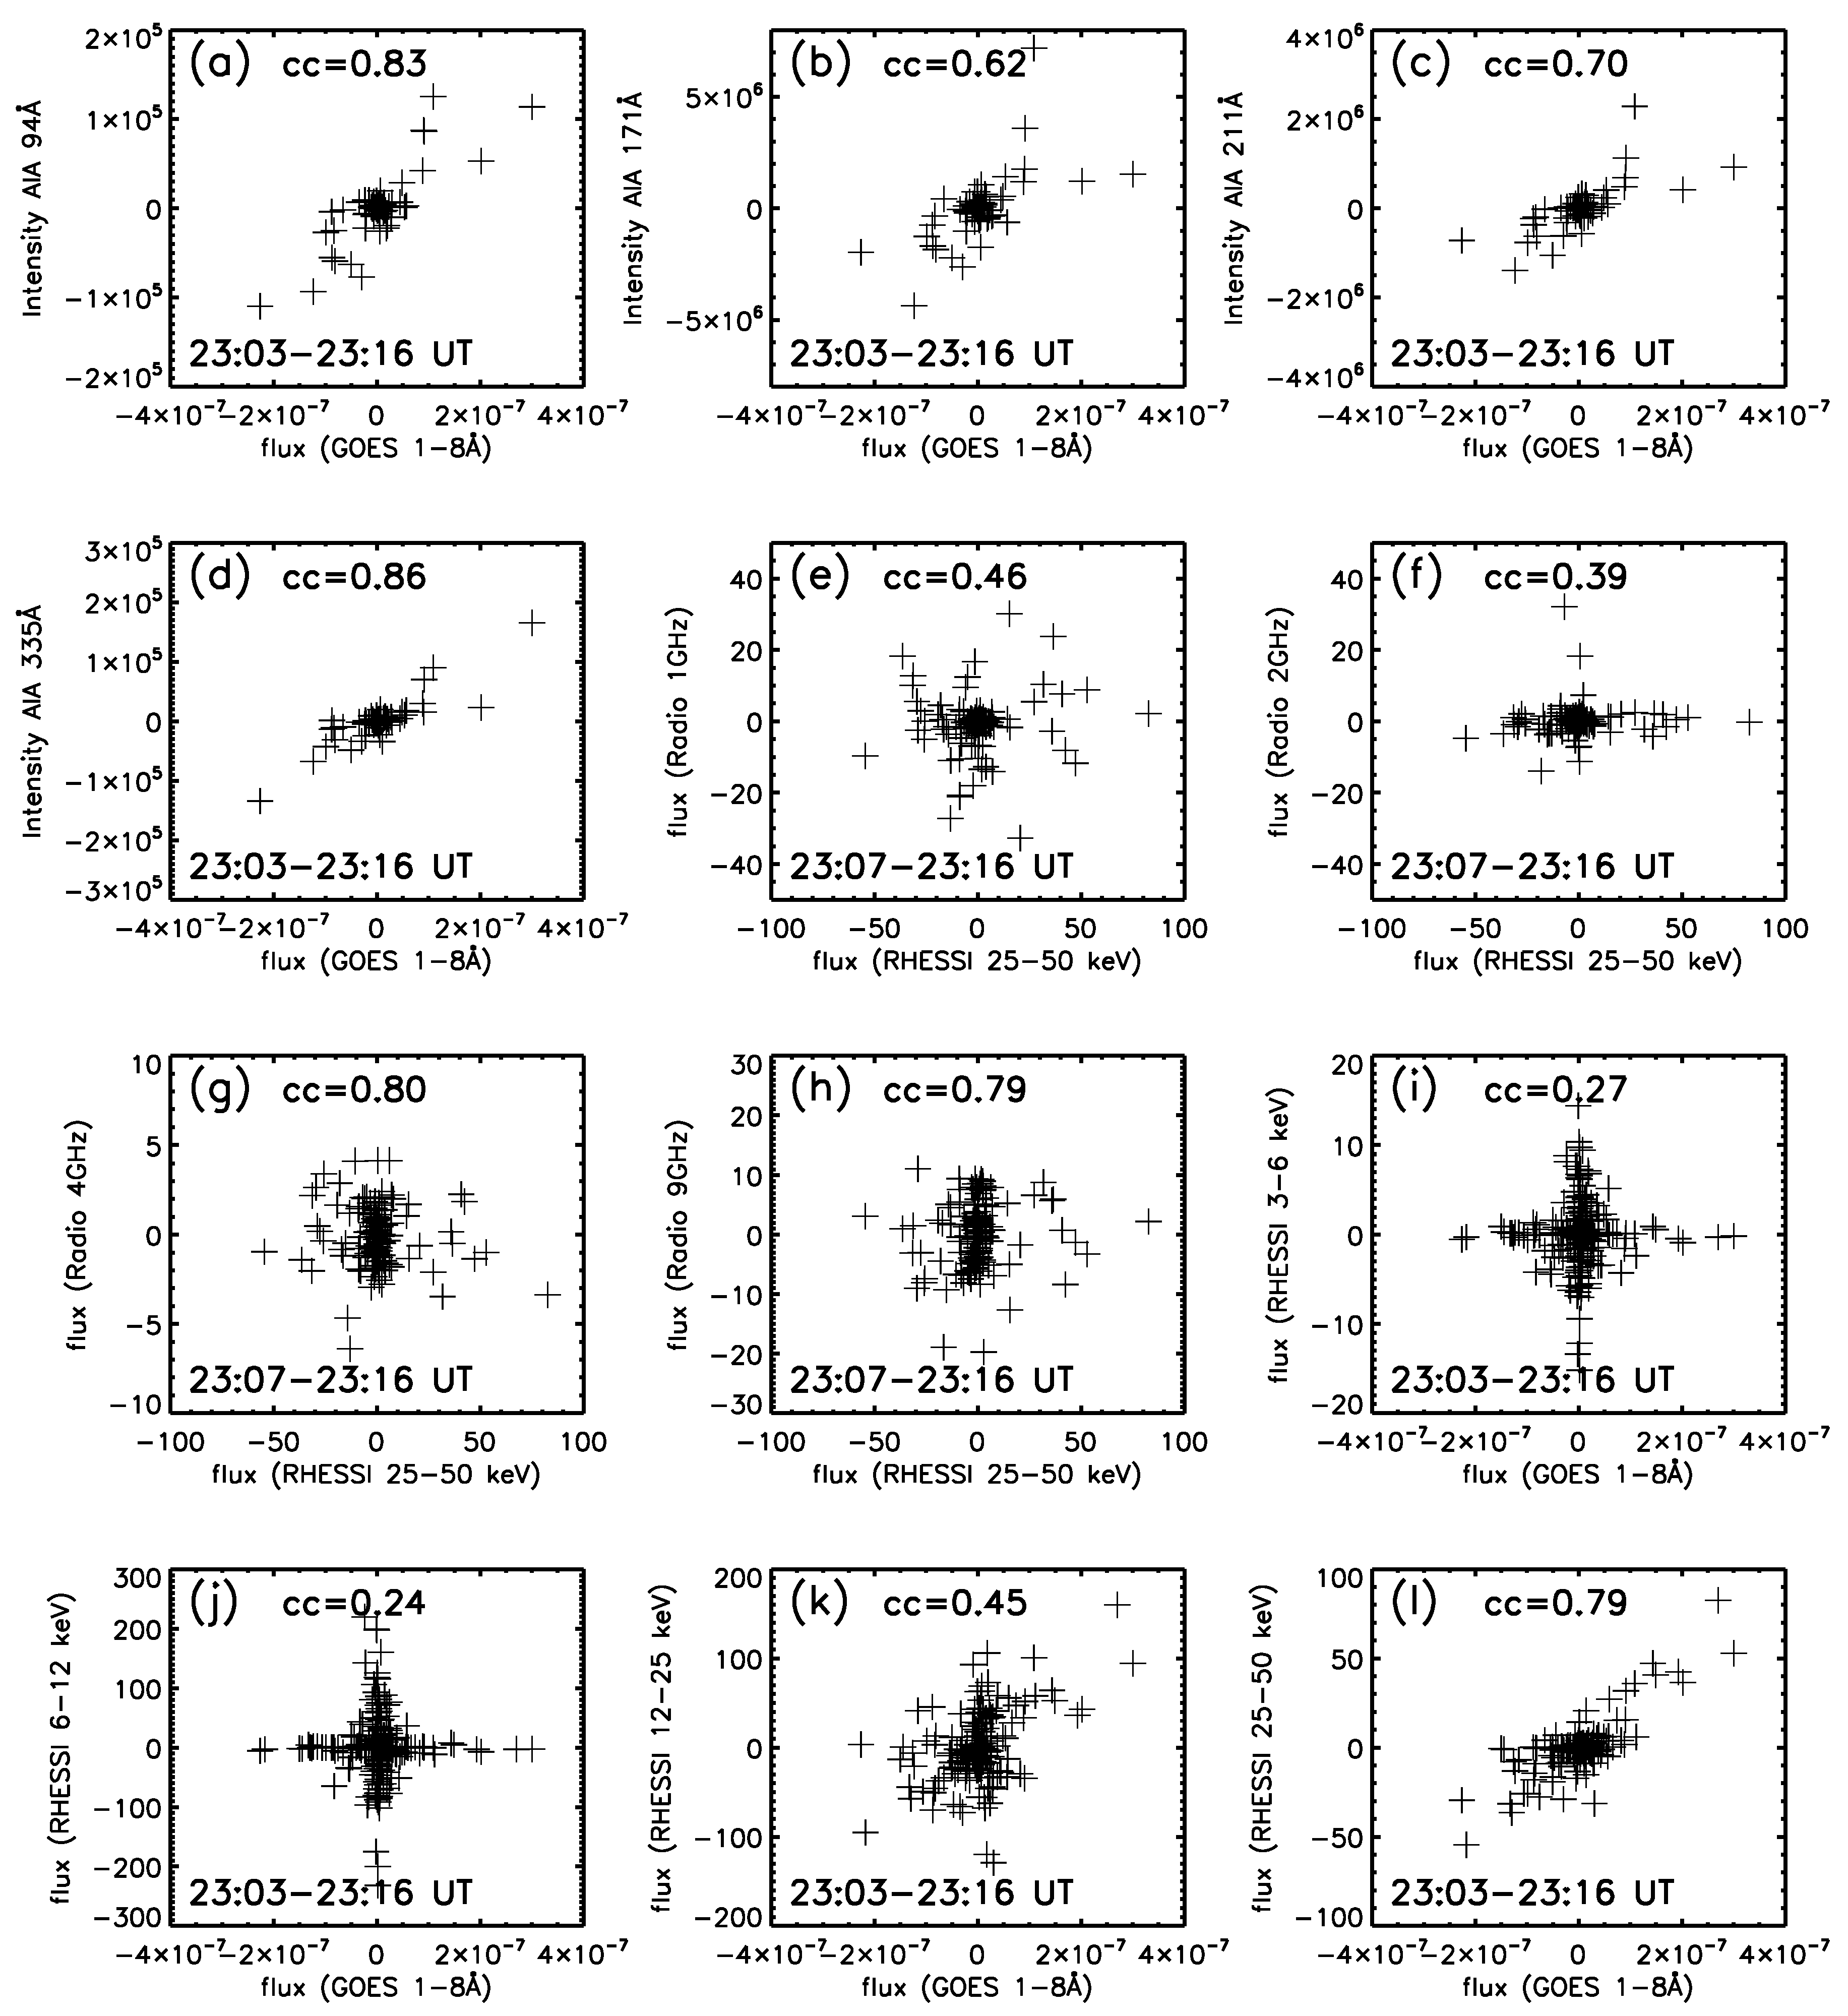
Based on the analysis of data, we find QPPs with a period of 40 s at SXR, HXR, Radio, and SDO/AIA at the same interval in this event. Figure 8 plots the correlation of QPPs between different wavelengths, i.e., GOES 1–8 Å versus AIA four wavelengths (94 Å, 171 Å, 211 Å and 335 Å), RHESSI 25–50 keV versus radio four frequencies (1 GHz, 2 GHz, 4 GHz, 9 GHz), and their correlation coefficients are calculated after shifting the data by about 28 s, 28 s, 4 s, 8 s, respectively, and GOES 1–8 Å versus RHESSI four wavelengths (3–6 keV (shifting by about 176 s), 6–12 keV (shifting by about 176 s), 12–25 keV, 25–50 keV). We found that most of the correlation coefficients between them are relatively higher than 0.5, which confirm that QPPs at a broad wavelength range could have originated from the same process in this event.

4. Discussions and Conclusions

In this paper, we studied the QPPs in an M2.3 class flare on 23 September 2014. Using the data from GOES, NoRP, RHESSI, and SDO/AIA, we found QPPs with a period of 40 s by using FFT and wavelet transform for their light curves. Meanwhile, we found that the QPPs take place at the same interval during the flare ribbon separation. Based on the SDO/AIA observation, QPPs seem to originate from the flare ribbons, the peaks of fast-varying components correspond to the bright spots on two ribbons, and the period of QPPs is closely related to the separation of flare ribbons. Pugh et al. [35] study the ribbon properties including ribbon separation distance, area, total unsigned magnetic flux and average magnetic field strength. It shows there is evidence of relationships between the period of the QPPs and flare ribbon properties. Also, it shows that the period of the QPPs has strong correlations with separation distance. During the separation of flare ribbons, as reconnection occurs, new and longer loops are formed, which may be related to the period of the QPPs. The ribbon properties also correlate with the flare duration, and there is a positive correlation found between the period of the QPPs and flare duration by the statistical study [34]. The periods follow a log-normal distribution that peaks at 20s. At the same time, in this event, violent jet bursts were also observed, but we did not find significant periodic oscillations in the jet. However, many studies on jets have found that they have periodicity. Mishra et al. [46] found a period of about 3 min in a blowout jet mainly composed of cool material and the research strongly supports the fact that multiple magnetic reconnection triggers QPPs in the blowout jet. Li et al. [47] suggest that the flare QPPs could be excited by recurrent jets, and they should be associated with non-thermal electrons that are periodically accelerated by a repeated energy release process, such as repetitive magnetic reconnection.
It is interesting that QPPs exist in both thermal (SXR) and nonthermal (radio and HXR) radiation in this paper. It seems that QPPs periods are independent of the frequency of observations. The correlations of QPPs between different wavelengths indicated that the QPPs are originated from the same process in this event. However, QPPs have different periods in different events and, similar to the QPPs with 40 s period in this article, Yang and Xiang [48] found two groups of oscillations of newly formed loops through magnetic reconnection for the first time in the solar chromosphere, with observed periods of about 45 s and 25 s, respectively. Hong et al. [49] found the QPPs of 90–110 s in a C6.7 flare on 9 May 2019. Srivastava et al. [50] found the violent oscillations with double periods of about 587 and 349 s in the chromosphere, and interpreted them as the fundamental- and harmonic-mode of fast-sausage waves in the cool post-flare loop. And Li et al. [51] even observed very long-periodic pulsations with a period of ≈9.3 minutes before the onset of a circular-ribbon flare, which were attributed to be LRC-circuit oscillations. Thus, we can see different periods may correspond to different generation mechanisms, which require more observation and theoretical research.
According to the mechanisms of the QPPs, there are two possibilities of theoretical explanations for the QPPs here, i.e., the periodic non-thermal electrons generated by magnetic reconnections or the electron beams and the emitting plasma modulated by MHD waves [3,7,12,52,53,54,55]. Our observations tend to support the first possibility. The evidence includes the QPPs being seen at radio and HXR origination from the flare ribbons. We did not find any evidence of MHD waves from our observations. It is obvious that one model can well explain some types of flare QPPs, but fails to explain all of the observed QPP features. However, it is still an open question that the QPPs display a period of 40 s. More observations are needed to explore the QPPs in various events.

Author Contributions

Software, J.X., D.L. and F.S.; writing—original draft preparation, J.X.; writing—review and editing, J.X. and Z.N. All authors have read and agreed to the published version of the manuscript.

Funding

This research was funded by NSFC under grants 12073081, 11973092, as well as CAS Strategic Pioneer Program on Space Science, grant Nos. XDA15052200 and XDA15320301. D.L. is supported by Surface Project of Jiangsu No. BK20211402. The Laboratory No. is 2010DP173032.

Data Availability Statement

The data presented in this study are openly available in the homepage of SDO, GOES, NoRP and RHESSI.

Acknowledgments

Data were made available courtesy of GOES, NoRP, RHESSI, SDO/AIA and SDO/HMI science teams. We are very grateful for their sharing of data. We thank the anonymous referees for helpful comments on the manuscript.

Conflicts of Interest

The authors declare no conflict of interest.

Notes

1
2

References

  1. Kupriyanova, E.; Kashapova, L.; Reid, H.; Myagkova, I. Relationship of type III radio bursts with quasi-periodic pulsations in a solar flare. Sol. Phys. 2016, 291, 3427–3438. [Google Scholar] [CrossRef] [Green Version]
  2. Carley, E.P.; Hayes, L.A.; Murray, S.A.; Morosan, D.E.; Shelley, W.; Vilmer, N.; Gallagher, P.T. Loss-cone instability modulation due to a magnetohydrodynamic sausage mode oscillation in the solar corona. Nat. Commun. 2019, 10, 2276. [Google Scholar] [CrossRef] [Green Version]
  3. Dolla, L.; Marqué, C.; Seaton, D.; Van Doorsselaere, T.; Dominique, M.; Berghmans, D.; Cabanas, C.; De Groof, A.; Schmutz, W.; Verdini, A.; et al. Time delays in quasi-periodic pulsations observed during the X2. 2 solar flare on 2011 February 15. Astrophys. J. Lett. 2012, 749, L16. [Google Scholar] [CrossRef] [Green Version]
  4. Dominique, M.; Zhukov, A.; Dolla, L.; Inglis, A.; Lapenta, G. Detection of quasi-periodic pulsations in solar EUV time series. Sol. Phys. 2018, 293, 61. [Google Scholar] [CrossRef]
  5. Milligan, R.O.; Fleck, B.; Ireland, J.; Fletcher, L.; Dennis, B.R. Detection of three-minute oscillations in full-disk Lyα emission during a solar flare. Astrophys. J. Lett. 2017, 848, L8. [Google Scholar] [CrossRef]
  6. Lu, L.; Li, D.; Ning, Z.; Feng, L.; Gan, W. Quasi-periodic pulsations detected in Ly α and nonthermal emissions during solar flares. Sol. Phys. 2021, 296, 130. [Google Scholar] [CrossRef]
  7. Nakariakov, V.; Foullon, C.; Myagkova, I.; Inglis, A. Quasi-periodic pulsations in the gamma-ray emission of a solar flare. Astrophys. J. Lett. 2009, 708, L47. [Google Scholar] [CrossRef] [Green Version]
  8. Li, D.; Kolotkov, D.; Nakariakov, V.; Lu, L.; Ning, Z. Quasi-periodic pulsations of gamma-ray emissions from a solar flare on 2017 September 6. Astrophys. J. 2020, 888, 53. [Google Scholar] [CrossRef]
  9. Li, T.; Zhang, J. Quasi-periodic slipping magnetic reconnection during an X-class solar flare observed by the solar dynamics observatory and interface region imaging spectrograph. Astrophys. J. Lett. 2015, 804, L8. [Google Scholar] [CrossRef] [Green Version]
  10. Tian, H.; Young, P.R.; Reeves, K.K.; Wang, T.; Antolin, P.; Chen, B.; He, J. Global sausage oscillation of solar flare loops detected by the interface region imaging spectrograph. Astrophys. J. Lett. 2016, 823, L16. [Google Scholar] [CrossRef]
  11. Li, D.; Ning, Z.; Huang, Y.; Chen, N.H.; Zhang, Q.; Su, Y.; Su, W. Doppler shift oscillations from a hot line observed by IRIS. Astrophys. J. 2017, 849, 113. [Google Scholar] [CrossRef] [Green Version]
  12. Brosius, J.W.; Daw, A.N. Quasi-periodic fluctuations and chromospheric evaporation in a solar flare ribbon observed by IRIS. Astrophys. J. 2015, 810, 45. [Google Scholar] [CrossRef]
  13. Ofman, L.; Wang, T. Hot coronal loop oscillations observed by SUMER: Slow magnetosonic wave damping by thermal conduction. Astrophys. J. 2002, 580, L85. [Google Scholar] [CrossRef]
  14. Wang, T. Standing slow-mode waves in hot coronal loops: Observations, modeling, and coronal seismology. Space Sci. Rev. 2011, 158, 397–419. [Google Scholar] [CrossRef] [Green Version]
  15. Tan, B.; Zhang, Y.; Tan, C.; Liu, Y. Microwave quasi-periodic pulsations in multi-timescales associated with a solar flare/CME event. Astrophys. J. 2010, 723, 25. [Google Scholar] [CrossRef] [Green Version]
  16. Aschwanden, M. Theory of radio pulsations in coronal loops. Sol. Phys. 1987, 111, 113–136. [Google Scholar] [CrossRef]
  17. Aschwanden, M.J.; Benz, A.O.; Dennis, B.R.; Kundu, M.R. Pulsed acceleration in solar flares. In International Astronomical Union Colloquium; Cambridge University Press: Cambridge, UK, 1994; Volume 142, pp. 631–638. [Google Scholar]
  18. Fleishman, G.; Fu, Q.; Huang, G.L.; Melnikov, V.; Wang, M. Discovery of unusual large group delay in microwave millisecond oscillating events. Astron. Astrophys. 2002, 385, 671–685. [Google Scholar] [CrossRef]
  19. Ning, Z.; Ding, M.; Wu, H.; Xu, F.; Meng, X. Microwave type III bursts and pulsation groups. Astron. Astrophys. 2005, 437, 691–697. [Google Scholar] [CrossRef]
  20. Ning, Z.; Wu, H.; Xu, F.; Meng, X. Frequency distributions of microwave pulses for the 18 march 2003 solar flare. Sol. Phys. 2007, 242, 101–109. [Google Scholar] [CrossRef]
  21. Dulk, G.A. Radio emission from the sun and stars. Annu. Rev. Astron. Astrophys. 1985, 23, 169–224. [Google Scholar] [CrossRef]
  22. Masuda, S.; Kosugi, T.; Hara, H.; Tsuneta, S.; Ogawara, Y. A loop-top hard X-ray source in a compact solar flare as evidence for magnetic reconnection. Nature 1994, 371, 495–497. [Google Scholar] [CrossRef]
  23. Druett, M.K.; Zharkova, V. Non-thermal hydrogen Lyman line and continuum emission in solar flares generated by electron beams. Astron. Astrophys. 2019, 623, A20. [Google Scholar] [CrossRef] [Green Version]
  24. Chowdhury, P.; Srivastava, A.; Dwivedi, B.; Sych, R.; Moon, Y.J. Study of multi-periodic coronal pulsations during an X-class solar flare. Adv. Space Res. 2015, 56, 2769–2778. [Google Scholar] [CrossRef] [Green Version]
  25. Kupriyanova, E.G.; Kashapova, L.K.; Van Doorsselaere, T.; Chowdhury, P.; Srivastava, A.K.; Moon, Y.J. Quasi-periodic pulsations in a solar flare with an unusual phase shift. Mon. Not. R. Astron. Soc. 2019, 483, 5499–5507. [Google Scholar] [CrossRef]
  26. Tian, H.; Young, P.R.; Reeves, K.K.; Chen, B.; Liu, W.; McKillop, S. Temporal evolution of chromospheric evaporation: Case studies of the M1. 1 flare on 2014 September 6 and X1. 6 flare on 2014 September 10. Astrophys. J. 2015, 811, 139. [Google Scholar] [CrossRef] [Green Version]
  27. Kumar, P.; Nakariakov, V.M.; Cho, K.S. Observation of a short period quasi-periodic pulsation in solar X-ray, microwave, and EUV emissions. Astrophys. J. 2017, 836, 121. [Google Scholar] [CrossRef] [Green Version]
  28. Nakariakov, V.; Anfinogentov, S.; Storozhenko, A.; Kurochkin, E.; Bogod, V.; Sharykin, I.; Kaltman, T. Quasi-periodic pulsations in a solar microflare. Astrophys. J. 2018, 859, 154. [Google Scholar] [CrossRef]
  29. Mészárosová, H.; Karlickỳ, M.; Rybák, J.; Fárník, F.; Jiřička, K. Long period variations of dm-radio and X-ray fluxes in three X-class flares. Astron. Astrophys. 2006, 460, 865–874. [Google Scholar] [CrossRef]
  30. Kolotkov, D.Y.; Pugh, C.E.; Broomhall, A.M.; Nakariakov, V.M. Quasi-periodic pulsations in the most powerful solar flare of cycle 24. Astrophys. J. Lett. 2018, 858, L3. [Google Scholar] [CrossRef] [Green Version]
  31. Maehara, H.; Shibayama, T.; Notsu, Y.; Notsu, S.; Honda, S.; Nogami, D.; Shibata, K. Statistical properties of superflares on solar-type stars based on 1-min cadence data. Earth Planets Space 2015, 67, 59. [Google Scholar] [CrossRef] [Green Version]
  32. Simões, P.J.; Hudson, H.S.; Fletcher, L. Soft X-ray pulsations in solar flares. Sol. Phys. 2015, 290, 3625–3639. [Google Scholar] [CrossRef] [Green Version]
  33. Inglis, A.; Ireland, J.; Dennis, B.; Hayes, L.; Gallagher, P. A large-scale search for evidence of quasi-periodic pulsations in solar flares. Astrophys. J. 2016, 833, 284. [Google Scholar] [CrossRef] [Green Version]
  34. Hayes, L.A.; Inglis, A.R.; Christe, S.; Dennis, B.; Gallagher, P.T. Statistical study of GOES X-ray quasi-periodic pulsations in solar flares. Astrophys. J. 2020, 895, 50. [Google Scholar] [CrossRef]
  35. Pugh, C.; Broomhall, A.M.; Nakariakov, V. Scaling laws of quasi-periodic pulsations in solar flares. Astron. Astrophys. 2019, 624, A65. [Google Scholar] [CrossRef] [Green Version]
  36. Kliem, B.; Karlicky, M.; Benz, A.O. Solar flare radio pulsations as a signature of dynamic magnetic reconnection. arXiv 2000, arXiv:astro-ph/0006324v1. [Google Scholar]
  37. Kumar, P.; Cho, K.S. Simultaneous EUV and radio observations of bidirectional plasmoids ejection during magnetic reconnection. Astron. Astrophys. 2013, 557, A115. [Google Scholar] [CrossRef] [Green Version]
  38. Takasao, S.; Matsumoto, T.; Nakamura, N.; Shibata, K. Magnetohydrodynamic shocks in and above post-flare loops: Two-dimensional simulation and a simplified model. Astrophys. J. 2015, 805, 135. [Google Scholar] [CrossRef] [Green Version]
  39. Tajima, T.; Sakai, J.; Nakajima, H.; Kosugi, T.; Brunel, F.; Kundu, M. Current loop coalescence model of solar flares. Astrophys. J. 1987, 321, 1031–1048. [Google Scholar] [CrossRef]
  40. Kumar, P.; Srivastava, A.; Somov, B.; Manoharan, P.; Erdélyi, R.; Uddin, W. Evidence of solar flare triggering due to Loop–Loop interaction caused by footpoint shear motion. Astrophys. J. 2010, 723, 1651. [Google Scholar] [CrossRef]
  41. Ning, Z.; Innes, D.; Solanki, S. Line profile characteristics of solar explosive event bursts. Astron. Astrophys. 2004, 419, 1141–1148. [Google Scholar] [CrossRef]
  42. Lin, R.P.; Dennis, B.R.; Hurford, G.J.; Smith, D.M.; Zehnder, A.; Harvey, P.R.; Curtis, D.W.; Pankow, D.; Turin, P.; Bester, M.; et al. The Reuven Ramaty high-energy solar spectroscopic imager (RHESSI). In The Reuven Ramaty High-Energy Solar Spectroscopic Imager (RHESSI) Mission Description and Early Results; Springer: Dordrecht, The Netherlands, 2003; pp. 3–32. [Google Scholar]
  43. Lemen, J.R.; Title, A.M.; Akin, D.J.; Boerner, P.F.; Chou, C.; Drake, J.F.; Duncan, D.W.; Edwards, C.G.; Friedlaender, F.M.; Heyman, G.F.; et al. The atmospheric imaging assembly (AIA) on the solar dynamics observatory (SDO). Sol. Phys. 2012, 275, 17–40. [Google Scholar] [CrossRef] [Green Version]
  44. Pesnell, W.D.; Thompson, B.J.; Chamberlin, P. The Solar Dynamics Observatory (SDO); Springer: Berlin/Heidelberg, Germany, 2012. [Google Scholar]
  45. Ning, Z. Imaging observations of X-ray quasi-periodic oscillations at 3–6 keV in the 26 December 2002 solar flare. Sol. Phys. 2014, 289, 1239–1256. [Google Scholar] [CrossRef]
  46. Mishra, S.K.; Sangal, K.; Kayshap, P.; Jelinek, P.; Srivastava, A.; Rajaguru, S. Origin of Quasi-Periodic Pulsation at the Base of Kink Unstable Jet. arXiv 2023, arXiv:2301.01534. [Google Scholar] [CrossRef]
  47. Li, D.; Shi, F.; Zhao, H.; Xiong, S.; Song, L.; Peng, W.; Li, X.; Chen, W.; Ning, Z. Flare quasi-periodic pulsation associated with recurrent jets. arXiv 2022, arXiv:2209.10952. [Google Scholar] [CrossRef]
  48. Yang, S.; Xiang, Y. Oscillation of newly formed loops after magnetic reconnection in the solar chromosphere. Astrophys. J. Lett. 2016, 819, L24. [Google Scholar] [CrossRef] [Green Version]
  49. Hong, Z.; Li, D.; Zhang, M.; Tan, C.; Ma, S.; Ji, H. Multi-Wavelength Observations of Quasi-Periodic Pulsations in a Solar Flare. Sol. Phys. 2021, 296, 171. [Google Scholar] [CrossRef]
  50. Srivastava, A.; Zaqarashvili, T.; Uddin, W.; Dwivedi, B.; Kumar, P. Observation of multiple sausage oscillations in cool post-flare loop. Mon. Not. R. Astron. Soc. 2008, 388, 1899–1903. [Google Scholar] [CrossRef] [Green Version]
  51. Li, D.; Feng, S.; Su, W.; Huang, Y. Preflare very long-periodic pulsations observed in Hα emission before the onset of a solar flare. Astron. Astrophys. 2020, 639, L5. [Google Scholar] [CrossRef]
  52. Nakariakov, V.; Pilipenko, V.; Heilig, B.; Jelínek, P.; Karlickỳ, M.; Klimushkin, D.; Kolotkov, D.; Lee, D.H.; Nisticò, G.; Van Doorsselaere, T.; et al. Magnetohydrodynamic oscillations in the solar corona and Earth’s magnetosphere: Towards consolidated understanding. Space Sci. Rev. 2016, 200, 75–203. [Google Scholar] [CrossRef] [Green Version]
  53. Fleishman, G.D.; Bastian, T.; Gary, D.E. Broadband quasi-periodic radio and X-ray pulsations in a solar flare. Astrophys. J. 2008, 684, 1433. [Google Scholar] [CrossRef] [Green Version]
  54. Inglis, A.; Nakariakov, V.; Melnikov, V. Multi-wavelength spatially resolved analysis of quasi-periodic pulsations in a solar flare. Astron. Astrophys. 2008, 487, 1147–1153. [Google Scholar] [CrossRef]
  55. Asai, A.; Shimojo, M.; Isobe, H.; Morimoto, T.; Yokoyama, T.; Shibasaki, K.; Nakajima, H. Periodic acceleration of electrons in the 1998 November 10 solar flare. Astrophys. J. 2001, 562, L103. [Google Scholar] [CrossRef] [Green Version]
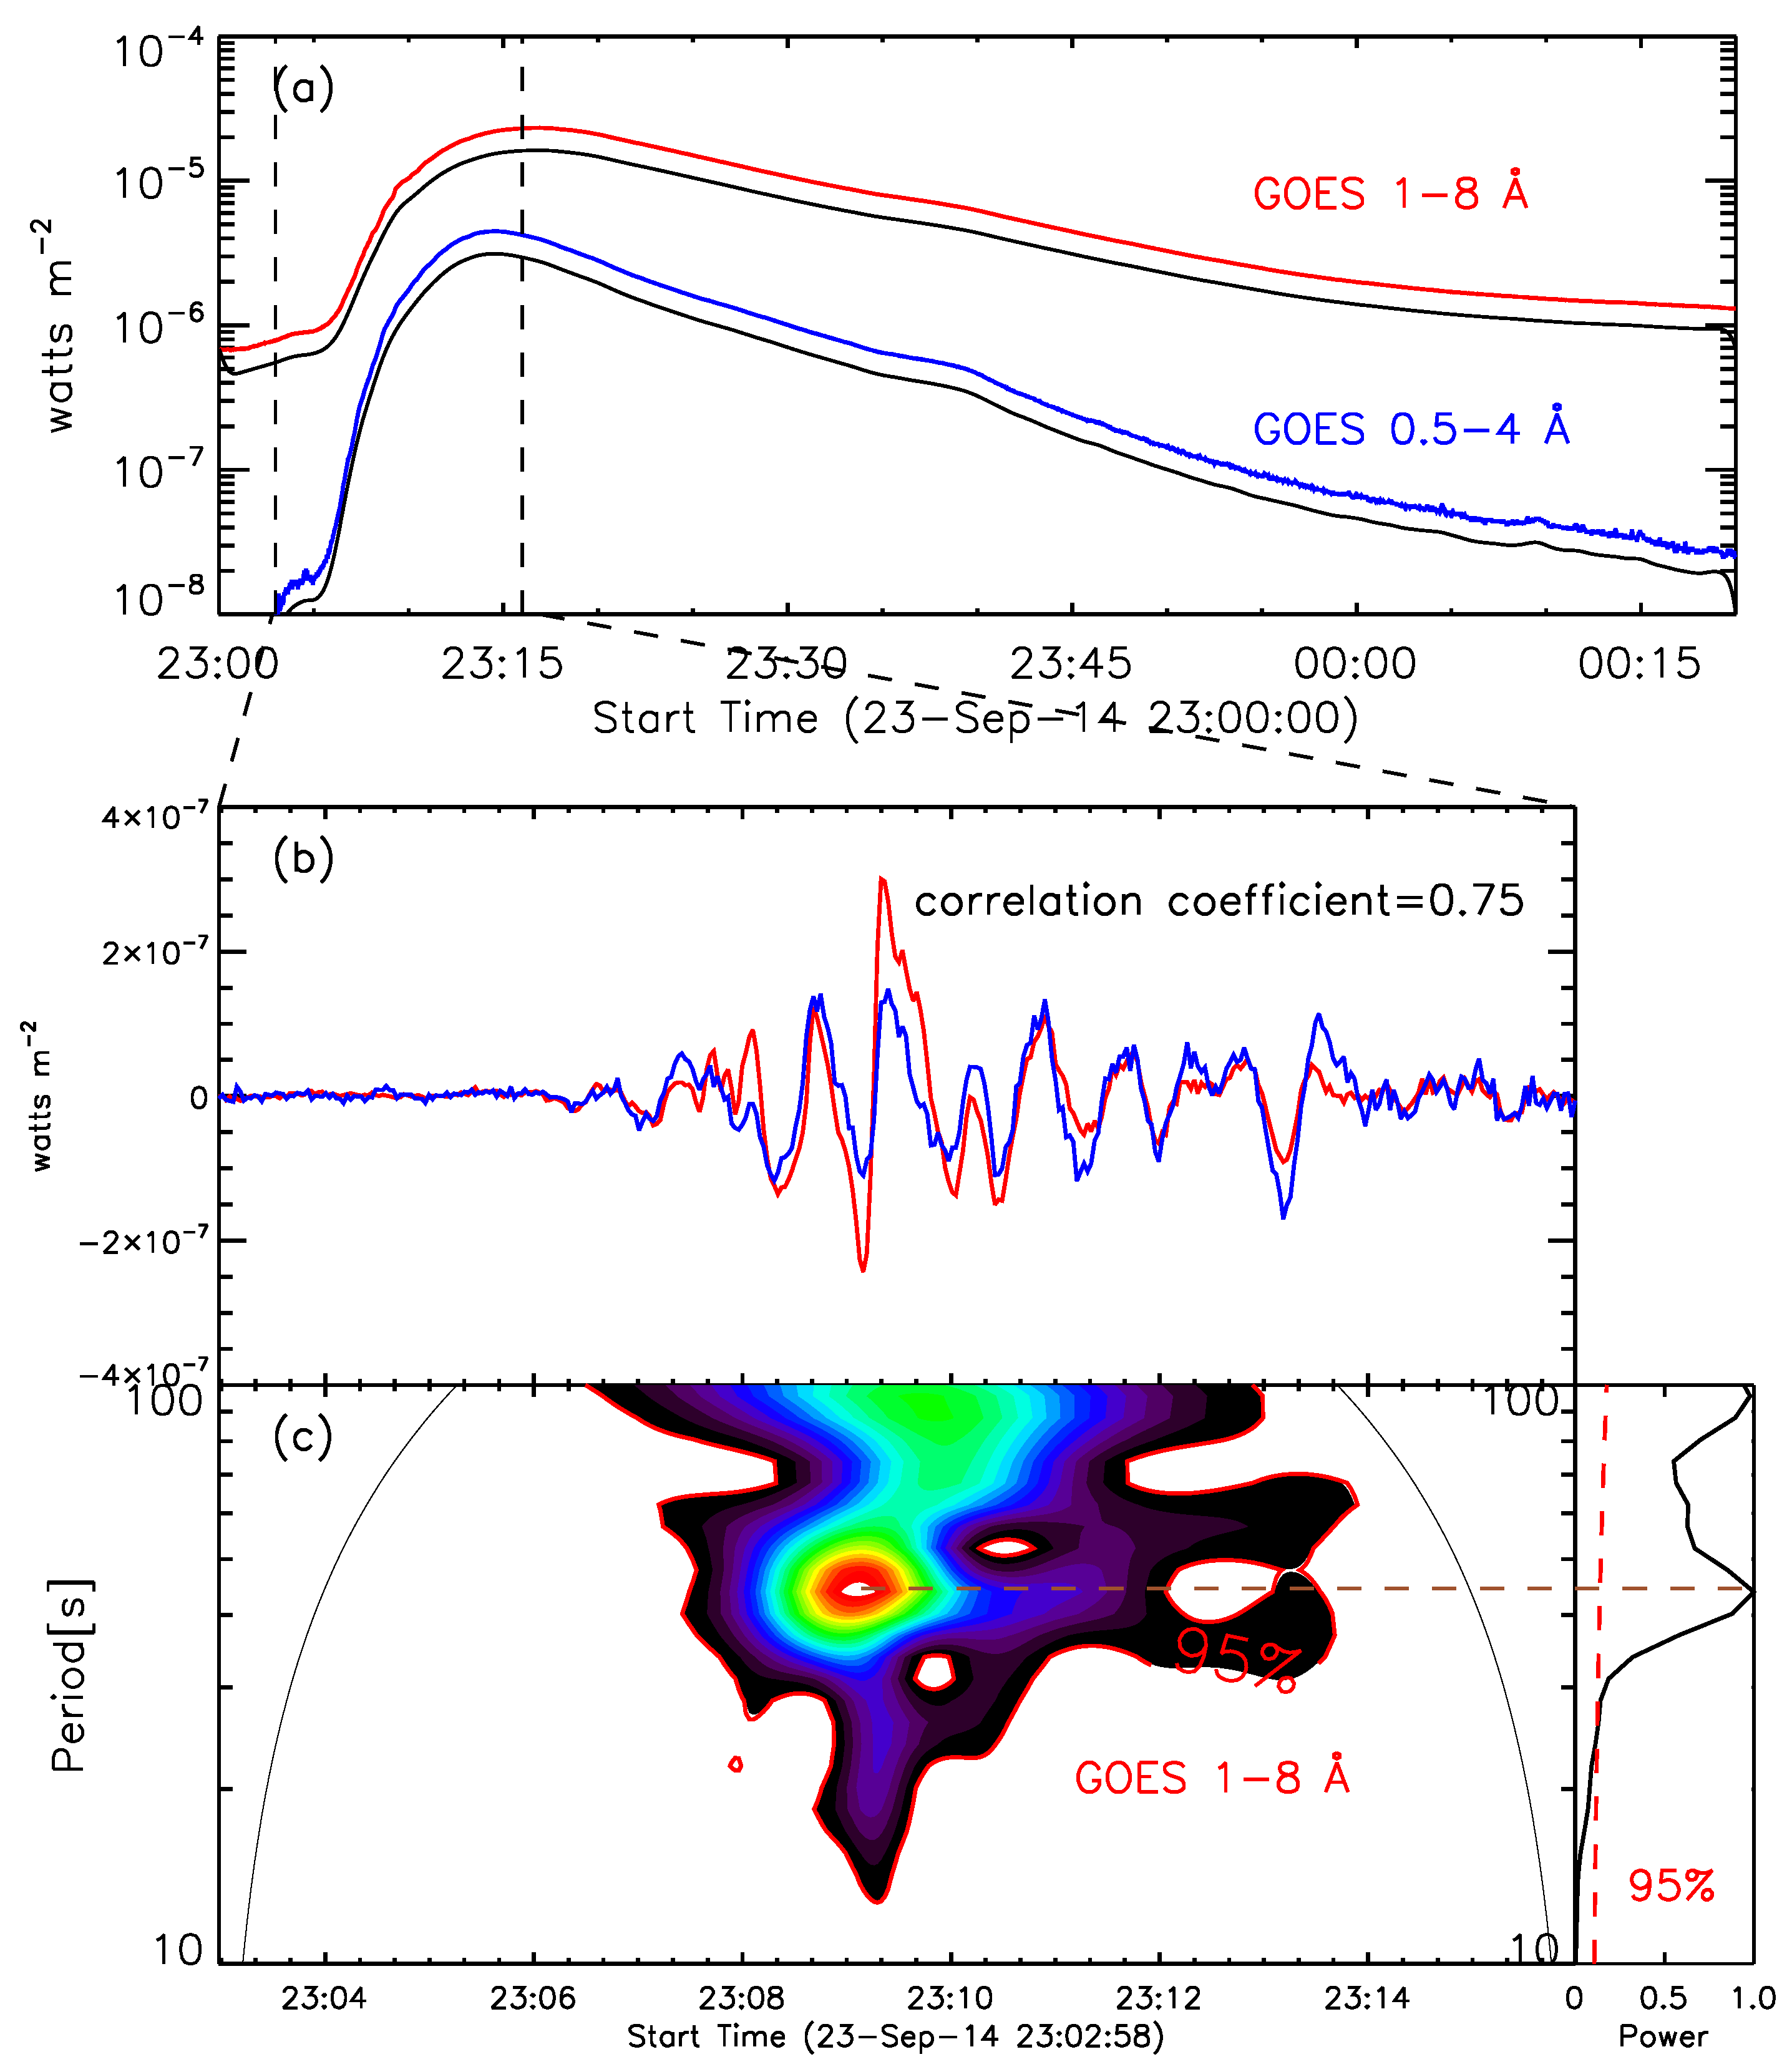
Figure 1. (a) The light curves of GOES 0.5–4 Å (blue), and 1–8 Å (red), and their slowly-varying components (black, multiplied by 0.7) for the 23 September 2014 flare. (b) Fast-varying components (blue line has multiplied by 5) in the interval between two vertical dashed lines and their correlation coefficient. (c) The wavelet spectra and global wavelet spectrum of the fast-varying component at GOES 1–8 Å. The red contours represent a significance level of 95%.
Universe 09 00215 g001
Figure 2. (a) the light curves of radio at 1 GHz (red), 2 GHz (brown), 4 GHz (blue) and 9 GHz (purple), with the slowly-varying components of 2 GHz and 4 GHz (black, multiplied by 0.9). (b) the fast-varying components of the light curves of 2 GHz and 4 GHz, and their correlation coefficient. (c) the wavelet spectrum and global wavelet spectrum of 2 GHz, and the red contours represent a significance level of 95%.
Universe 09 00215 g002
Figure 3. (a1a4) the light curves of RHESSI at 3–6 keV, 6–12 keV, 12–25 keV and 25–50 keV, and their slowly-varying components (red, multiplied by 0.7). (b1b4) the fast-varying components of the light curves. (c1c4) the wavelet spectra of 3–6, 6–12, 12–25 and 25–50 keV, and the contours represent a significance level of 95%.
Universe 09 00215 g003
Figure 4. The maps of SDO/AIA at (a) 94 Å, (b) 131 Å, (c) 171 Å, (d) 193 Å, (e) 211 Å, (f) 304 Å, (g) 335 Å, (h) 1600 Å and (i) 1700 Å at around 23:16 UT. The white box in the AIA 211 Å image (e) represents the whole flare area. Two black boxes in the AIA 1700 Å image (i) are flare ribbons of R1 and R2. The red arrow in the AIA 335 Å and AIA 1600 Å image represents the slice of S1.
Universe 09 00215 g004
Figure 5. (a) SDO/HMI images overlaid the RHESSI contours at 6–12 keV (brown), 12–25 keV (blue), and 25–50 keV (red). P and N indicate positive and negative polarities. The contour levels are 50%, 70%, 90% of the peak flux of X-rays. (b) SDO/AIA image overlaid the RHESSI contours at 6–12 keV (brown), 12–25 keV (blue), and 25–50 keV (red). The red line represents a loop between two footpoints.
Universe 09 00215 g005
Figure 6. Same as Figure 1, the light curves (black) of AIA 94 Å, 171 Å, 211 Å and 335 Å (white box marked in Figure 4e), with the slowly-varying components (blue, after multiplying by 0.6), the fast-varying components and their wavelet spectra. The contours represent a significance level of 95%.
Universe 09 00215 g006
Figure 7. (a1,a2) the light curves of R1 and R2 of 335 Å marked by the black boxes in Figure 4i, and their slowly-varying components (blue, multiplied by 0.8). (b1,b2,c1,c2) the fast-varying components of the light curves, and the wavelet spectra as well as global wavelet spectrum between 23:03 UT to 23:16 UT. (d1,d2) the time-distance diagrams at 335 Å and 1600 Å, and the velocities of R1, R2 and jet are given. The red dashed lines mark the positions of five peaks.
Universe 09 00215 g007
Figure 8. Correlation of various fast-varying components during the time interval between 23:03 to 23:16 UT, namely GOES 1–8 Å flux versus different wavelengths of AIA (94 Å, 171 Å, 211 Å, 335 Å) and RHESSI (3–6 keV, 6–12 keV, 12–25 keV, 25–50 keV), and RHESSI 25–50 keV versus radio wavelengths (1 GHz, 2 GHz, 4 GHz, 9 GHz). The correlation coefficients (cc) are given.
Universe 09 00215 g008
Disclaimer/Publisher’s Note: The statements, opinions and data contained in all publications are solely those of the individual author(s) and contributor(s) and not of MDPI and/or the editor(s). MDPI and/or the editor(s) disclaim responsibility for any injury to people or property resulting from any ideas, methods, instructions or products referred to in the content.