Article

Pasta Phases in Neutron Star Mantle: Extended Thomas–Fermi vs. Compressible Liquid Drop Approaches

by
Nikolai N. Shchechilin
1,*,
Nikita A. Zemlyakov
2,3,
Andrey I. Chugunov
2 and
Mikhail E. Gusakov
2
1
Institut d’Astronomie et d’Astrophysique, CP-226, Université Libre de Bruxelles, 1050 Brussels, Belgium
2
Ioffe Institute, Politekhnicheskaya str. 26, 194021 St. Petersburg, Russia
3
Institute of Physics and Mechanics, Peter the Great St. Petersburg Polytechnic University, Politekhnicheskaya str. 29, 195251 St. Petersburg, Russia
*
Author to whom correspondence should be addressed.
Universe 2022, 8(11), 582; https://doi.org/10.3390/universe8110582
Submission received: 7 October 2022 / Revised: 31 October 2022 / Accepted: 2 November 2022 / Published: 4 November 2022
(This article belongs to the Section Compact Objects)

Abstract

:
Nuclear pasta phases in the neutron stars mantle can affect the mechanical and transport properties of superdense matter, thus playing an important role in the dynamics and evolution of neutron stars. In this paper, we compare results obtained by the Extended Thomas–Fermi (ETF) method with the compressible liquid drop model (CLDM), based on the thermodynamically consistent description of the surface properties calculated for the two-phase plane interface and the same energy-density functional (for numerical illustration, we applied the Skyrme-type functional SLy4). Our ETF calculations found that pasta phases in cylindrical form cover a significant crustal region (both normal and inverse phases, aka spaghetti and bucatini are presented). Meanwhile, within the applied CLDM framework, which includes the thermodynamically required effect of neutron adsorption on the cluster’s surface but neglects curvature corrections, only the spaghetti phase was found to be energetically favorable in the small density range prior to crust–core transition. On the other hand, the recent CLDM of Dinh Thi et al., 2021, which, on the contrary, accounts for curvature term but neglects neutron adsorption, predicts pasta phase onset in better agreement with the ETF. This fact highlights the importance of the curvature effects and allows counting on the potential validity of the CLDMs as a convenient, transparent and accurate tool for investigation of the pasta-phase properties.

1. Introduction

Neutron stars (NS) are extremely compact astrophysical objects. In their central regions, the density exceeds nuclear density by a factor of few and decreases by many orders of magnitude while approaching the stellar surface. In such a tremendous density range, three structural parts of NS are usually identified: the outer crust, the inner crust and the core. In the outer crust, the nuclear matter is bound into nearly spherical nuclei, surrounded by relativistic electron gas. In the inner crust, a sea of quasi-free neutrons is added to the outer crust components; while nuclei (nuclear clusters) become more and more neutron-rich, being immersed into this sea. Finally, the core of NS consists of homogeneous nuclear matter. The problem of the transition between the clustered nuclear matter of the crust and the homogeneous matter of the core is non-trivial (e.g., [1]). Additional complexity (see [2]) is associated with so-called mantle layers, which contain exotic pasta-like nuclear shapes (cylindrical, plate, etc.), which are expected to be located in the innermost part of the crust.
If the pasta layers exist, they can manifest themselves in various ways. In particular, they determine the micro-physical structure of matter, which is crucial for transport [3,4,5,6,7] and mechanical [8,9,10,11] properties. As a result, the mantle can affect glitches [12], NS cooling [13], rotation and magnetic field evolution [14], crustal oscillations [15], etc. However, direct observational constraints for the mantle are still uncertain (see, e.g., [16,17,18]).
In a seminal work [19], pasta phases were predicted within a simplified version of the compressible liquid drop model (CLDM). Since then, different theoretical frameworks have been applied to analyze pasta phases. Besides the CLDM [20,21,22,23,24], more sophisticated and numerically expansive methods were employed, such as semi-classical molecular dynamic simulations (see [25] for review), the (Extended) Thomas–Fermi (ETF) calculations [26,27,28,29,30,31] and quantum Hartree–Fock (HF) approaches [32,33,34]. Some of them found not only traditional pasta shapes—spheres, cylinders (or so-called spaghetti), plates (lasagna) and their inverse versions (bubbles or Swiss cheese and tubes or bucatini), but also more complex structures, such as waffles [35], parking-garages [36], other types of domains and defects [37] and so on [34]. Nevertheless, the results of theoretical calculations of pasta phases suffer from a lack of experimental data and remain rather model-dependent. This also stems from the fact that calculations imply different energy-density functionals that are fitted on the one hand to reproduce the atomic masses and properties of ordinary nuclei, and on the other hand, to agree with multiple microscopic calculations of the dense symmetric or pure neutron matter and astrophysical constraints. Hence, pasta phases occur in the region where we should appeal to interpolation between the most reliable nuclear physics constraints.
Statistical methods are often applied to explore the sensitivity of pasta-phase predictions to various nuclear matter parameters. For this purpose, CLDM is perfectly suited, as it is proven to be a reasonable [38], high-speed and physically transparent approach [39]. Moreover, the CLDM provides the possibility for convenient investigation of the pasta-phase properties [8]. In the recent works based on the CLDM approach [40,41,42], the authors obtained correlations between bulk and surface matter parameters and pasta occurrence by Bayesian analysis. They concluded that the mantle region covers, on average, about 15% of the crust by radius and 50% by mass.
Here we address the accuracy of CLDM by comparison with ETF calculations within the same Skyrme-type energy-density functional. Specifically, we apply the ETF approach (Section 2.1), based on [29], to determine the presence and order of the pasta-phases. We also employ CLDM in form suggested in [39,43], where the surface energy term is determined for a plain two-phase interface for the same functional. It is worth stressing that the surface energy is described in a thermodynamically consistent way by taking into account the neutron adsorption (neutron skin, Section 2.2); however, the curvature corrections are neglected (so we call it CLDMnc below). Finally, we compare our results with calculations by Dinh Thi et al. [40] (DCFG21 further), which were based on another version of CLDM which includes curvature effects but does not account for neutron adsorption—not explicitly at least (Section 3). We found better agreement in the size of the area occupied by pasta phases between the CLDM and ETF if the curvature corrections were included, confirming the importance of the curvature term for transition to the pasta phases, as initially suggested in [44] for transition to the so-called bubble phase (inverted spheres). However, the sets of pasta phases differ in all considered models. Our main conclusions are outlined in Section 4.

2. Basic Formalism

For simplicity, we work with widely applied approximation, which assumes matter to be in the zero-temperature ground state [45] (it is generally believed that it is the state which is reached during gradual cooling from the extremely hot, T 10 11 K, proto-NS to the temperatures of observed NSs, which can be considered as negligibly small; see, however, [34,46,47]). We also neglect the effects of finite magnetic field B, which become important only for B 10 17 G [48,49]. In this approximation, to find an appropriate nuclear matter configuration at a given net baryon number density n, the energy density E should be minimized. Here we consider the charge-neutral Wigner–Seitz cells of three shapes with different dimensions D (sphere ( D = 3 ), cylinder ( D = 2 ), and plate ( D = 1 )) and determine the most energetically favored one. The cells consist of microscopically inhomogeneous nuclear matter with a total nucleon number A, including the proton number Z. For D = 2 , A and Z are taken per unit length; for D = 1 they are taken per unit area. For normal (non-inverted) phases and D = 2 , 3 , the nuclear cluster is located in the center of the cell and the local baryon number density decreases while approaching from the center to the boundary of the cell. For inverted phases, the situation is the opposite: the denser regions are located near the cell boundary.

2.1. Extended Thomas–Fermi Calculations

Let us start with a short description of the general ETF formalism. We follow [29], where ETF was applied for the nuclear pasta calculations. Within ETF, it is convenient to minimize the energy per baryon e = E / n , which can be written as:
e ETF = e nuc + e C + e e Y p Q β .
Here, the first term, e nuc , describes the nuclear interaction; the second, e C , is Coulomb energy; the third, e e , represents electron contribution. The neutron mass is omitted, and the mass difference between neutron and electron plus proton, Q β , is taken into account in the last term, where Y p = Z / A .
The dominant term is nuclear energy density. To quantify it, we incorporate energy-density functional SLy4 [50] based on the Skyrme-type effective interactions [51,52], which is widely used in NS physics and provides us with the opportunity to compare our work with other studies presented in the literature. The Skyrme functional e nuc depends on the neutron (n) and proton (p) number densities ρ q , the kinetic energy densities τ q and spin–orbit densities J q , where q = n , p . The ETF approach implies the Wigner–Kirkwood expansion of the canonical density matrix in statistical equilibrium in powers of the Plank constant and allows one to express τ q , J q via the baryon number densities and its gradients (see [53] for details).
Despite the fact that ETF is a semi-classical method, it demonstrates good agreement with a more detailed HF approach [54] and even with HF-Bogoliubov calculations if one includes the pairing and shell effects on top of ETF using the Strutinsky integral correction approach [55]. However, here we neglect the latter for simplicity and adequate comparison with CLDM, which lacks pairing and shell effects by design.
Generally, within the ETF approach, the Euler–Lagrange equations should be solved to minimize energy and obtain equilibrium number density profiles. However, following [56], we apply a simplified procedure which is based on the analytical nucleon profiles:
ρ q ( r ) = ρ B q + ρ Λ q 1 + exp C q R r R 2 1 exp r C q a q .
Here ρ B q , ρ Λ q correspond to the background and cluster densities, C q , a q sets the cluster size and surface diffuseness and R determines the cell radius. r represents the radial coordinate for spheres and cylinders, whereas for plates, it is the coordinate perpendicular to the plane. Note, in the case of inverse geometries (bucatini and swiss cheese), ρ Λ q , which characterizes the central density, is negative, and C q relates to the size of the bubble. An important property of this parametrization is nulling all the derivatives at the cell boundary. It allows one to reduce the full fourth-order ETF expansion to the gradient and Laplacian terms by integration by parts [53]. Nuclear energy then takes the form:
e nuc = 1 A E ( ρ q ( r ) , ρ q ( r ) , ρ q ( r ) ) d D r .
The Coulomb energy can be derived from the Laplace equation [29]. The electron energy is well-known [57].
Since all quantities in (1) are specified, we can proceed to numerical minimization of e ETF by adjusting parameters { ρ B q , ρ Λ q , C q , a q } and imposing the fixed n condition.

2.2. Compressible Liquid Drop Model

In this section, we discuss the model constructed in [39,43]. In contrast to ETF, the CLDM approach does not consider a smooth distribution of nucleons inside the cell explicitly. Instead, the cell is modeled by an imaginary (reference) system which consists of three components: (i) a nuclear cluster with constant nucleon number density ( n pi , n ni ); (ii) the remaining part of the cell, filled by dripped particles with constant density ( n pd , n nd ); and (iii) the surface of the cluster. As a result, the nuclear energy is decomposed into the bulk energy contributions associated with the cluster, E i bulk , and dripped particles, E d bulk , and the surface term, E surf . Thus, the energy per baryon can be written as:
e CLDM = 1 n u E i bulk + ( 1 u ) E d bulk + E surf + e e + e C Y p Q β .
Here u denotes the volume fraction of the cluster. The electron energy e e is the same as for ETF, and the Coulomb energy e C is calculated analytically. Here, as usual, we neglect the diffusiveness of the proton distribution profile while calculating e C (see, e.g., [45] for explicit formulae; for the inverse shapes, it is sufficient to substitute u with 1 u in the Coulomb and surface terms [38,45]).
The surface energy describes corrections required to reproduce the energy of the cell with maximal accuracy. It requires additional consideration and can be introduced by at least two approaches.
The first one is based on consideration of a two-phase system in plane geometry, while neglecting Coulomb effects [22,58]. In this case, one can apply quite a similar approach to the one discussed in the previous section. However, the simple two-phase coexistence conditions allow us to reduce the number of free parameters for nucleon profile optimization. The formalism of references [22,58] naturally leads to a thermodynamically consistent description, which includes adsorption of neutrons and (generally) protons on the interface surface. It should be stressed that the amount of adsorbed particles and surface energy per unit area depend on the reference system (i.e., position of R ref ), which is not uniquely determined. For the inner crust, it is useful to use the so-called proton reference R p , where no protons are adsorbed to the surface because it simplifies the calculation of the Coulomb energy. In this way, only neutrons are adsorbed on the cluster surface; they represent neutron skin. As a result, the surface energy can be written as [38]:
E surf = u D R p σ s + ν s μ n ,
where σ s represents the surface tension, ν s is the surface number density of the adsorbed neutrons and μ n is neutron chemical potential.
We calculate surface tension using the fourth-order Wigner–Kirkwood expansion and the approach of [22,58,59] for SLy4 effective interaction and parametrize σ s as function of μ n , as it is applied in our CLDMnc [39,43]. It is worth noting that references [22,58] suggest a perturbative approach to include corrections associated with finite curvature of the surface, but here we neglect them. The fully thermodynamically consistent description of the latter deserves additional work, which we plan to publish elsewhere.
An alternative approach to calculating surface energy consists of the fitting of the CLDM directly to experimentally-known atomic masses (e.g., [41]) or to the calculated energies of the very neutron-rich nuclei in the crust (for example, [46,60] used ETF energies, and [42] fit it to the results of HF calculations). In astrophysical literature, typically, this fit is performed using a simple analytical formula, as suggested in [61]; the neutron adsorption is often neglected (not included explicitly). According to this formula, the behavior of surface tension at very-high-isospin asymmetry is described by the parameter p. It is poorly constrained if surface energy parameters are fitted to experimentally known nuclei, and it is instructive to adjust p by the requirement to reproduce the crust–core transition density [62,63]. However, it should be noted that by construction, CLDM lacks the shell and pairing effects, having smooth dependence on the parameters. Furthermore, the Coulomb term is typically presented by a simple analytical formula which neglects the diffusiveness of the proton distribution (see, however, [64]), and the neutron adsorption is often neglected. Therefore, the surface energy, fitted within this approach, includes a complicated mixture of different physical effects, being essentially a reliable quantity to describe energy density in the crust, but one should be careful with straightforward interpretations of CLDM parameters (e.g., cluster radius). Besides that, direct use of experimental data potentially can lead to biases: the surface parameters would not exactly correspond to the applied energy-density functional; i.e., they can differ from the results of consistent calculations, performed as described in the first approach.
To illustrate the above claims, we present the dependence of surface tension on the neutron excess ( δ = ( n ni n pi ) / n i ) in Figure 1 for both approaches. Dashed lines demonstrate σ s applied in CLDMnc, which were calculated for plane interface with Sly4 potential and 4-th order ETF approaches. 1 The dash–dot line represents σ s of DCFG21, which was obtained by fitting of their CLDM to the experimental Atomic Mass Evaluation 2016 [65]. One should notice not only the difference in the behavior of two functions, calculated by different approaches, but the fact that explicit accounting for the neutron skin, whose typical thickness is about 0.8 fm for the considered density range [22,59], leads to a substantial modification in the surface energy per unit area ( σ s + ν s μ n , shown by the solid line in Figure 1). Therefore, it is clear that the quantities of the two CLDM might deviate significantly. Below we will discuss the predictions of our CLDMnc and CLDM of DCFG21 for the pasta phases.
Finally, after all terms are specified, we can apply CLDM, i.e., calculate e CLDM for a given n by minimizing (4) with respect to internal CLDM parameters n ni , n pi , n no , n po , u , R p . This procedure is reduced to a system of algebraic equations (see, e.g., [39]), as all the derivatives can be calculated analytically. It significantly speeds up calculations, making CLDM very convenient in practical applications.

3. Results

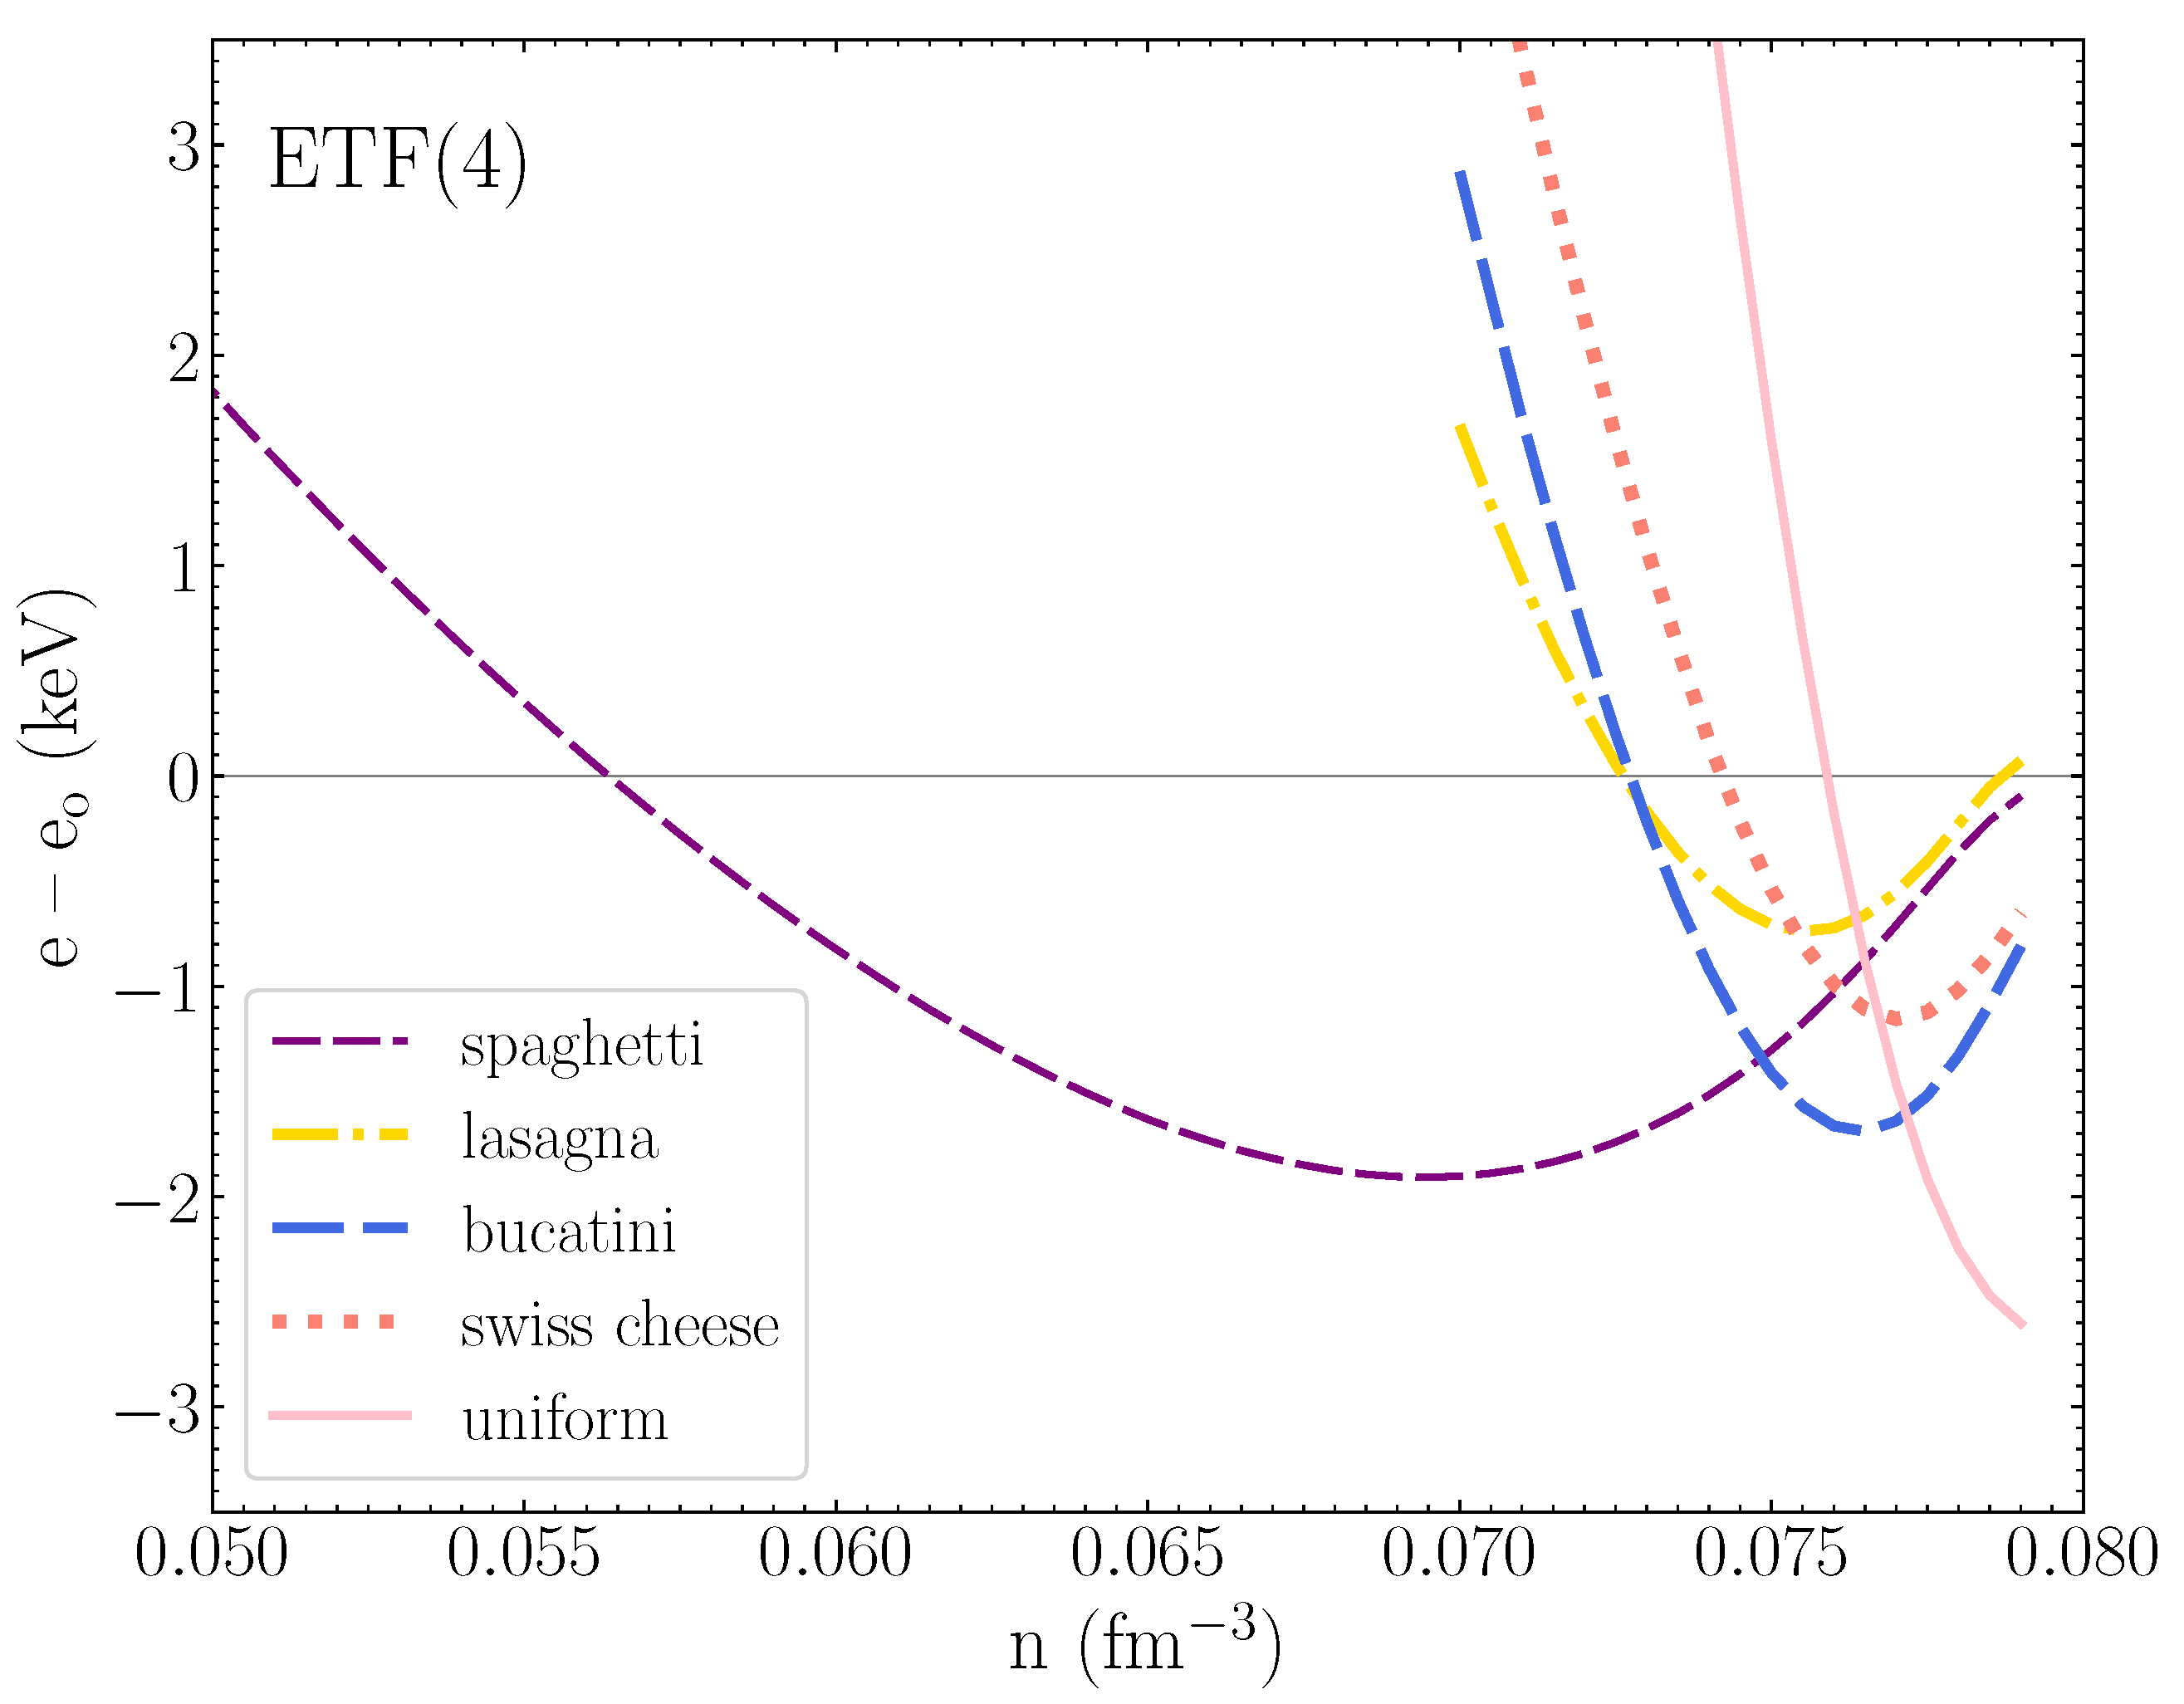
As described in Section 2.1, by applying the ETF approach, we adjusted the proton and neutron distribution profiles to minimize energy at a fixed nucleon number density n. We performed calculations while assuming different shapes of the Wigner–Seits cell. The results, using the fourth-order Wigner–Kirkwood expansion, are presented in Figure 2. To improve visibility, the energies are shown after subtraction of the energy for the spheres, e 0 , calculated for the same n. We found the spaghetti-like pasta phase becomes the most energetically favorable at n 0.056 fm 3 . At became n 0.075 fm 3 equilibrium configuration switched to the inverse cylindrical form, so-called bucatini, and at n cc 0.077 fm 3 the NS core should start—the energy of uniform nuclear matter is lower than any of considered non-uniform phases. However, it should be noted that when considering phase transitions using energy minimization at a fixed baryon number density one may encounter pressure jumps between phases. By estimating the pressure in the framework of [66], we determined that it remains almost constant across the sphere–spaghetti and bucatini–core phase transitions. Nevertheless, we found that the pressure drops by ≈5% at n 0.075 fm 3 , which corresponds to the spaghetti–bucatini interface. Thus, it is crucial to apply Maxwell construction to describe this phase transition correctly. This resulted in a density jump from ≈0.074 fm 3 in the spaghetti phase to ≈0.076 fm 3 in the bucatini phase. Therefore, the bucatini region was reduced to n (0.076–0.077) fm 3 . Other pasta shapes, such as lasagna and Swiss cheese, have slightly higher energies; thus, they should be absent in zero-temperature ground state mantle, as was modeled by the ETF approach with the SLy4 nuclear functional.2
The other thing to notice is that the energy difference between various pasta phases is very small. Near the crust–core transition, these differences can be smaller than 1 keV per baryon. Similar behavior was also seen in other papers [27,29]. We should warn the reader that the precision of the ETF approach (see, e.g., [54]) can be not enough to determine the phase correctly. This is because ETF is a semi-classical approach, and the quantum corrections are not fully incorporated. The latter might play an important role in the nuclear pasta predictions (see, e.g., [30]). Moreover, the real nuclear matter structure is beyond the Wigner–Seits approximation (e.g., [67]), and it can be important at ∼1 keV precision [68].
We also computed pasta phases within CLDMnc [39,43]. We demonstrate our results in Figure 3 in the same manner as for ETF calculations.3 One can clearly see that the predictions of two methods differ substantially. Firstly, a much smaller region n (0.074–0.076) fm 3 is covered by the spaghetti phase, and other phases appear to be energetically unfavorable. After applying the Maxwell construction to describe the phase transition to the core, we conclude that the density region of the spaghetti phase shrinks to n (0.074–0.075) fm 3 . (The density jump at the transition from spheres to the spaghetti is negligible). Secondly, the energy differences between pasta phases are much larger (note that the scale is not the same as in Figure 2) and the slopes of the various curves at the given density are steeper.
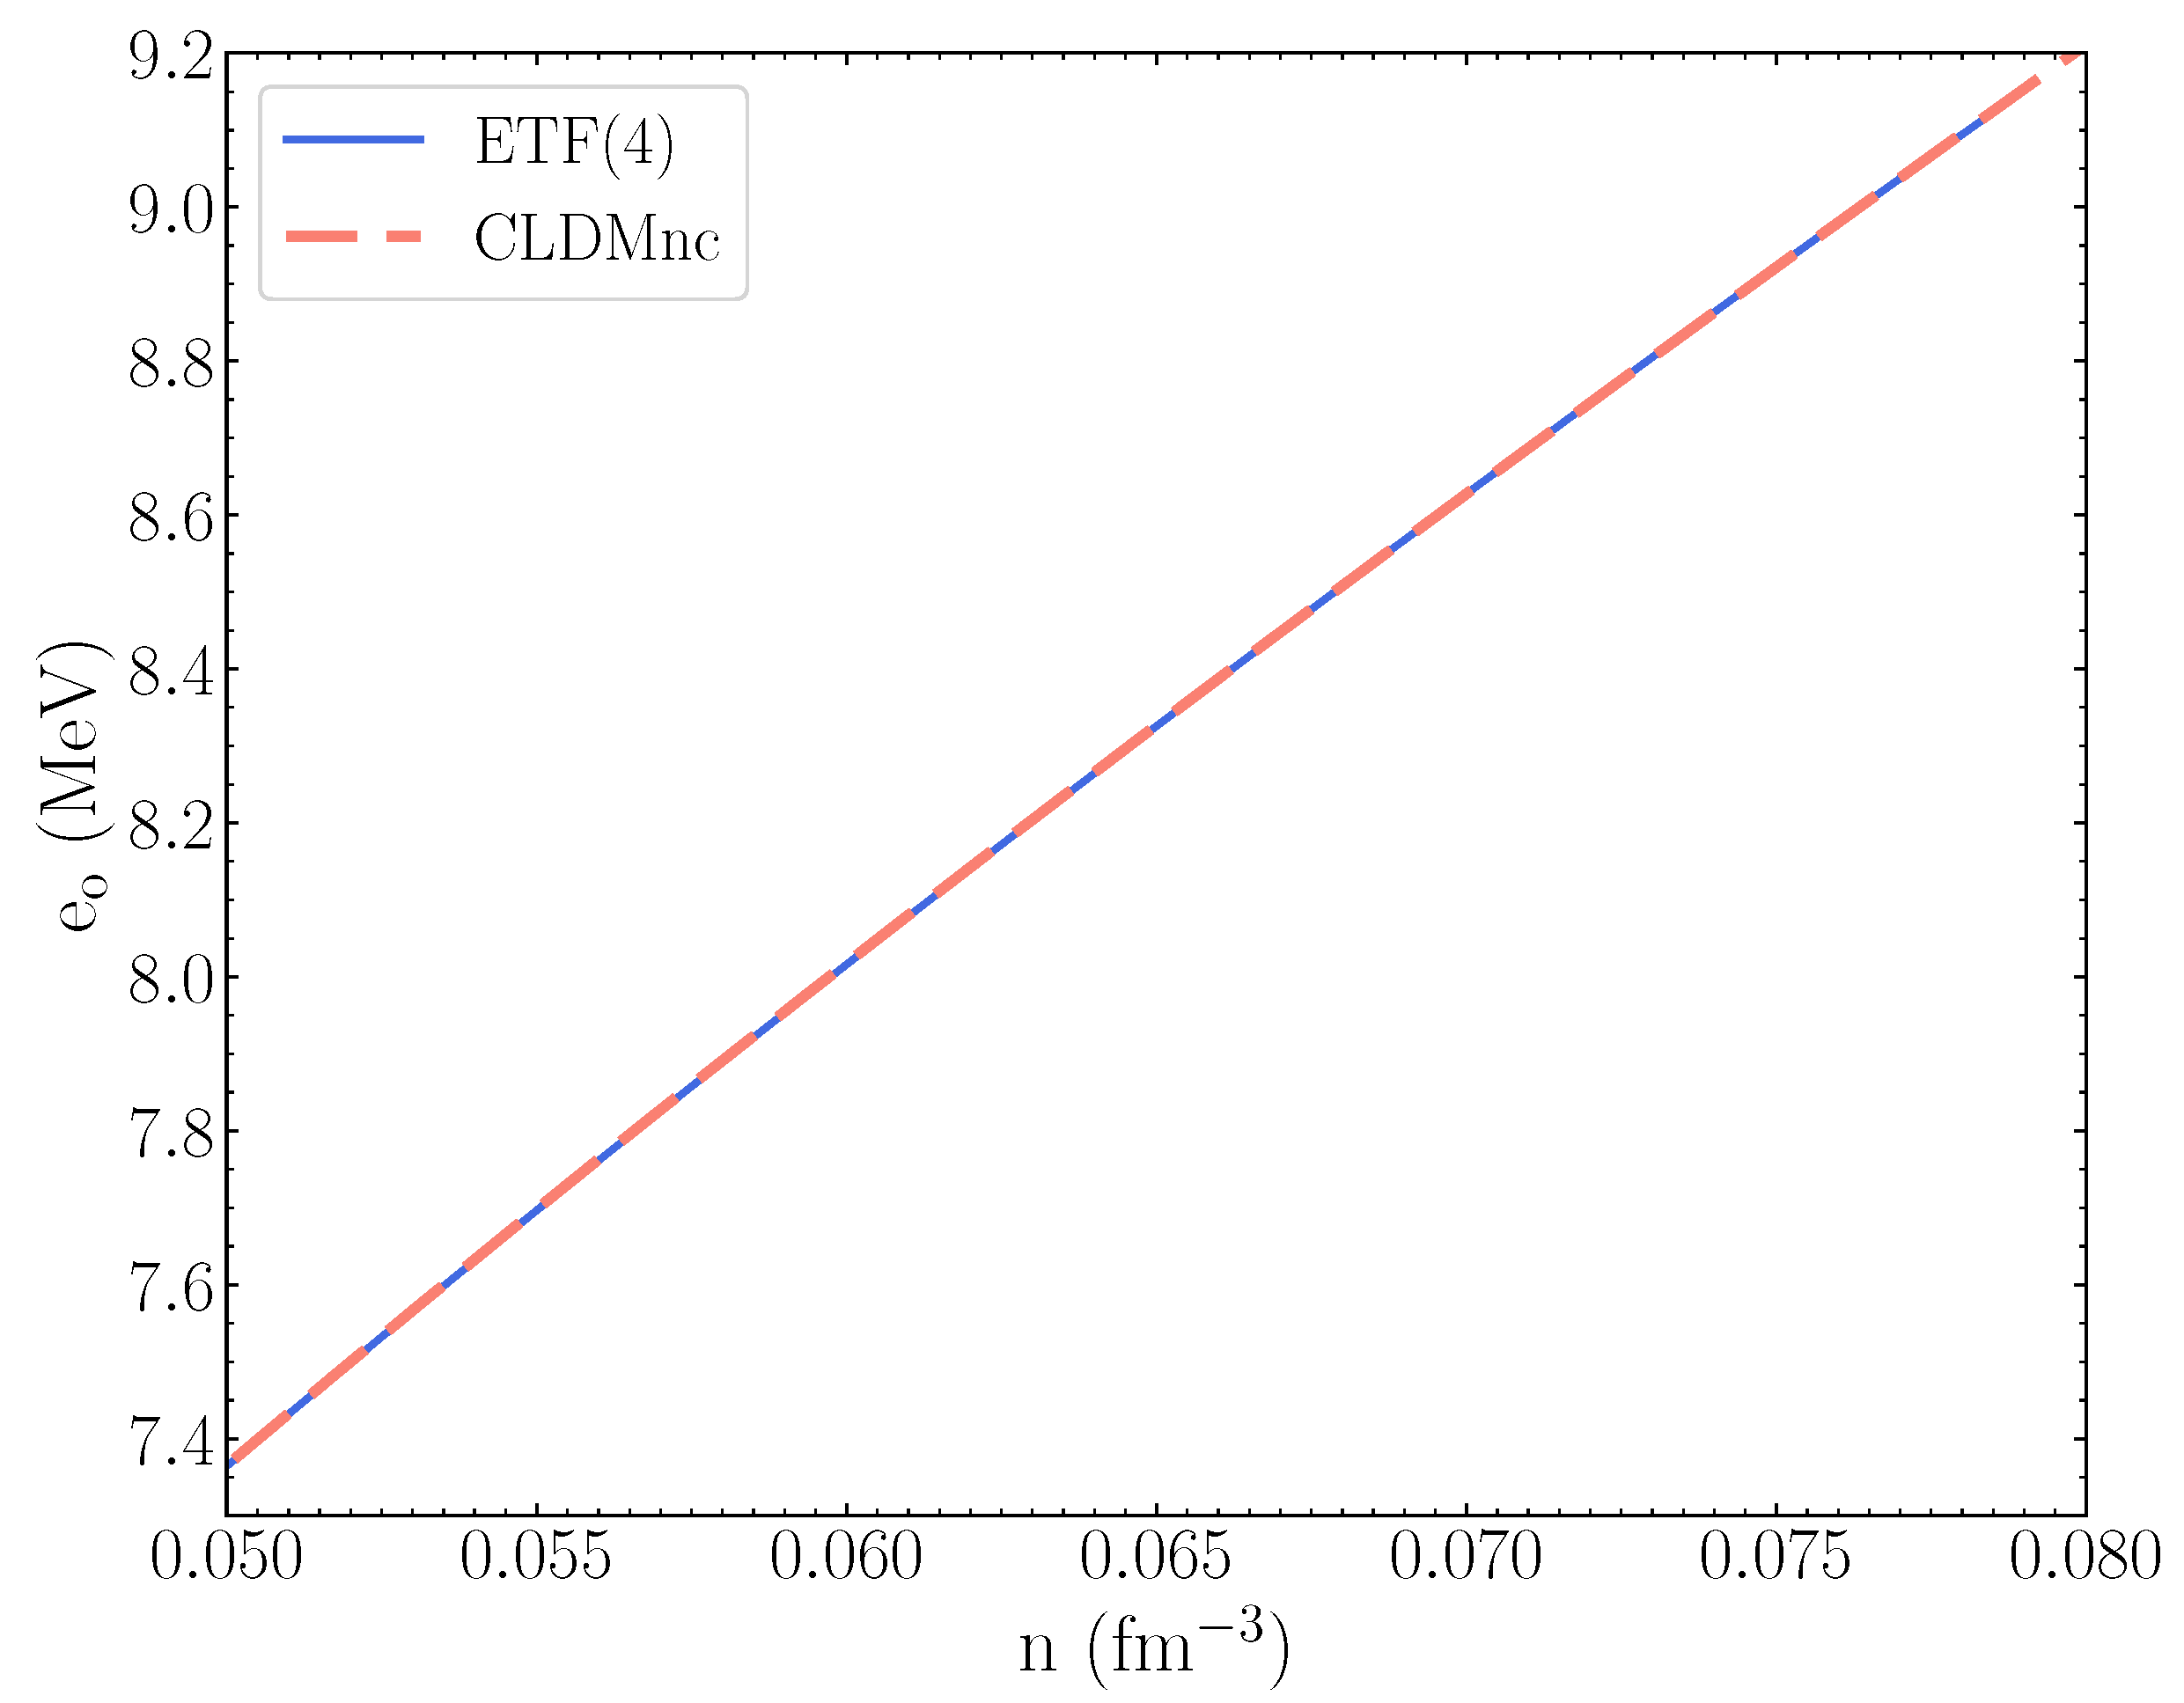
In Figure 4, we show the energy per nucleon for spheres in the ETF calculations and within the CLDMnc approach. On the provided scale, two curves can hardly be distinguished, emphasizing the dominance of the roughly equal bulk energy contribution and the relative smallness of the effects responsible for the transitions between pasta phases.
Our ETF calculations predict the crust to be thicker by 1% than within CLDMnc; it is associated with the location of the crust–core interface at higher pressures for the ETF model.
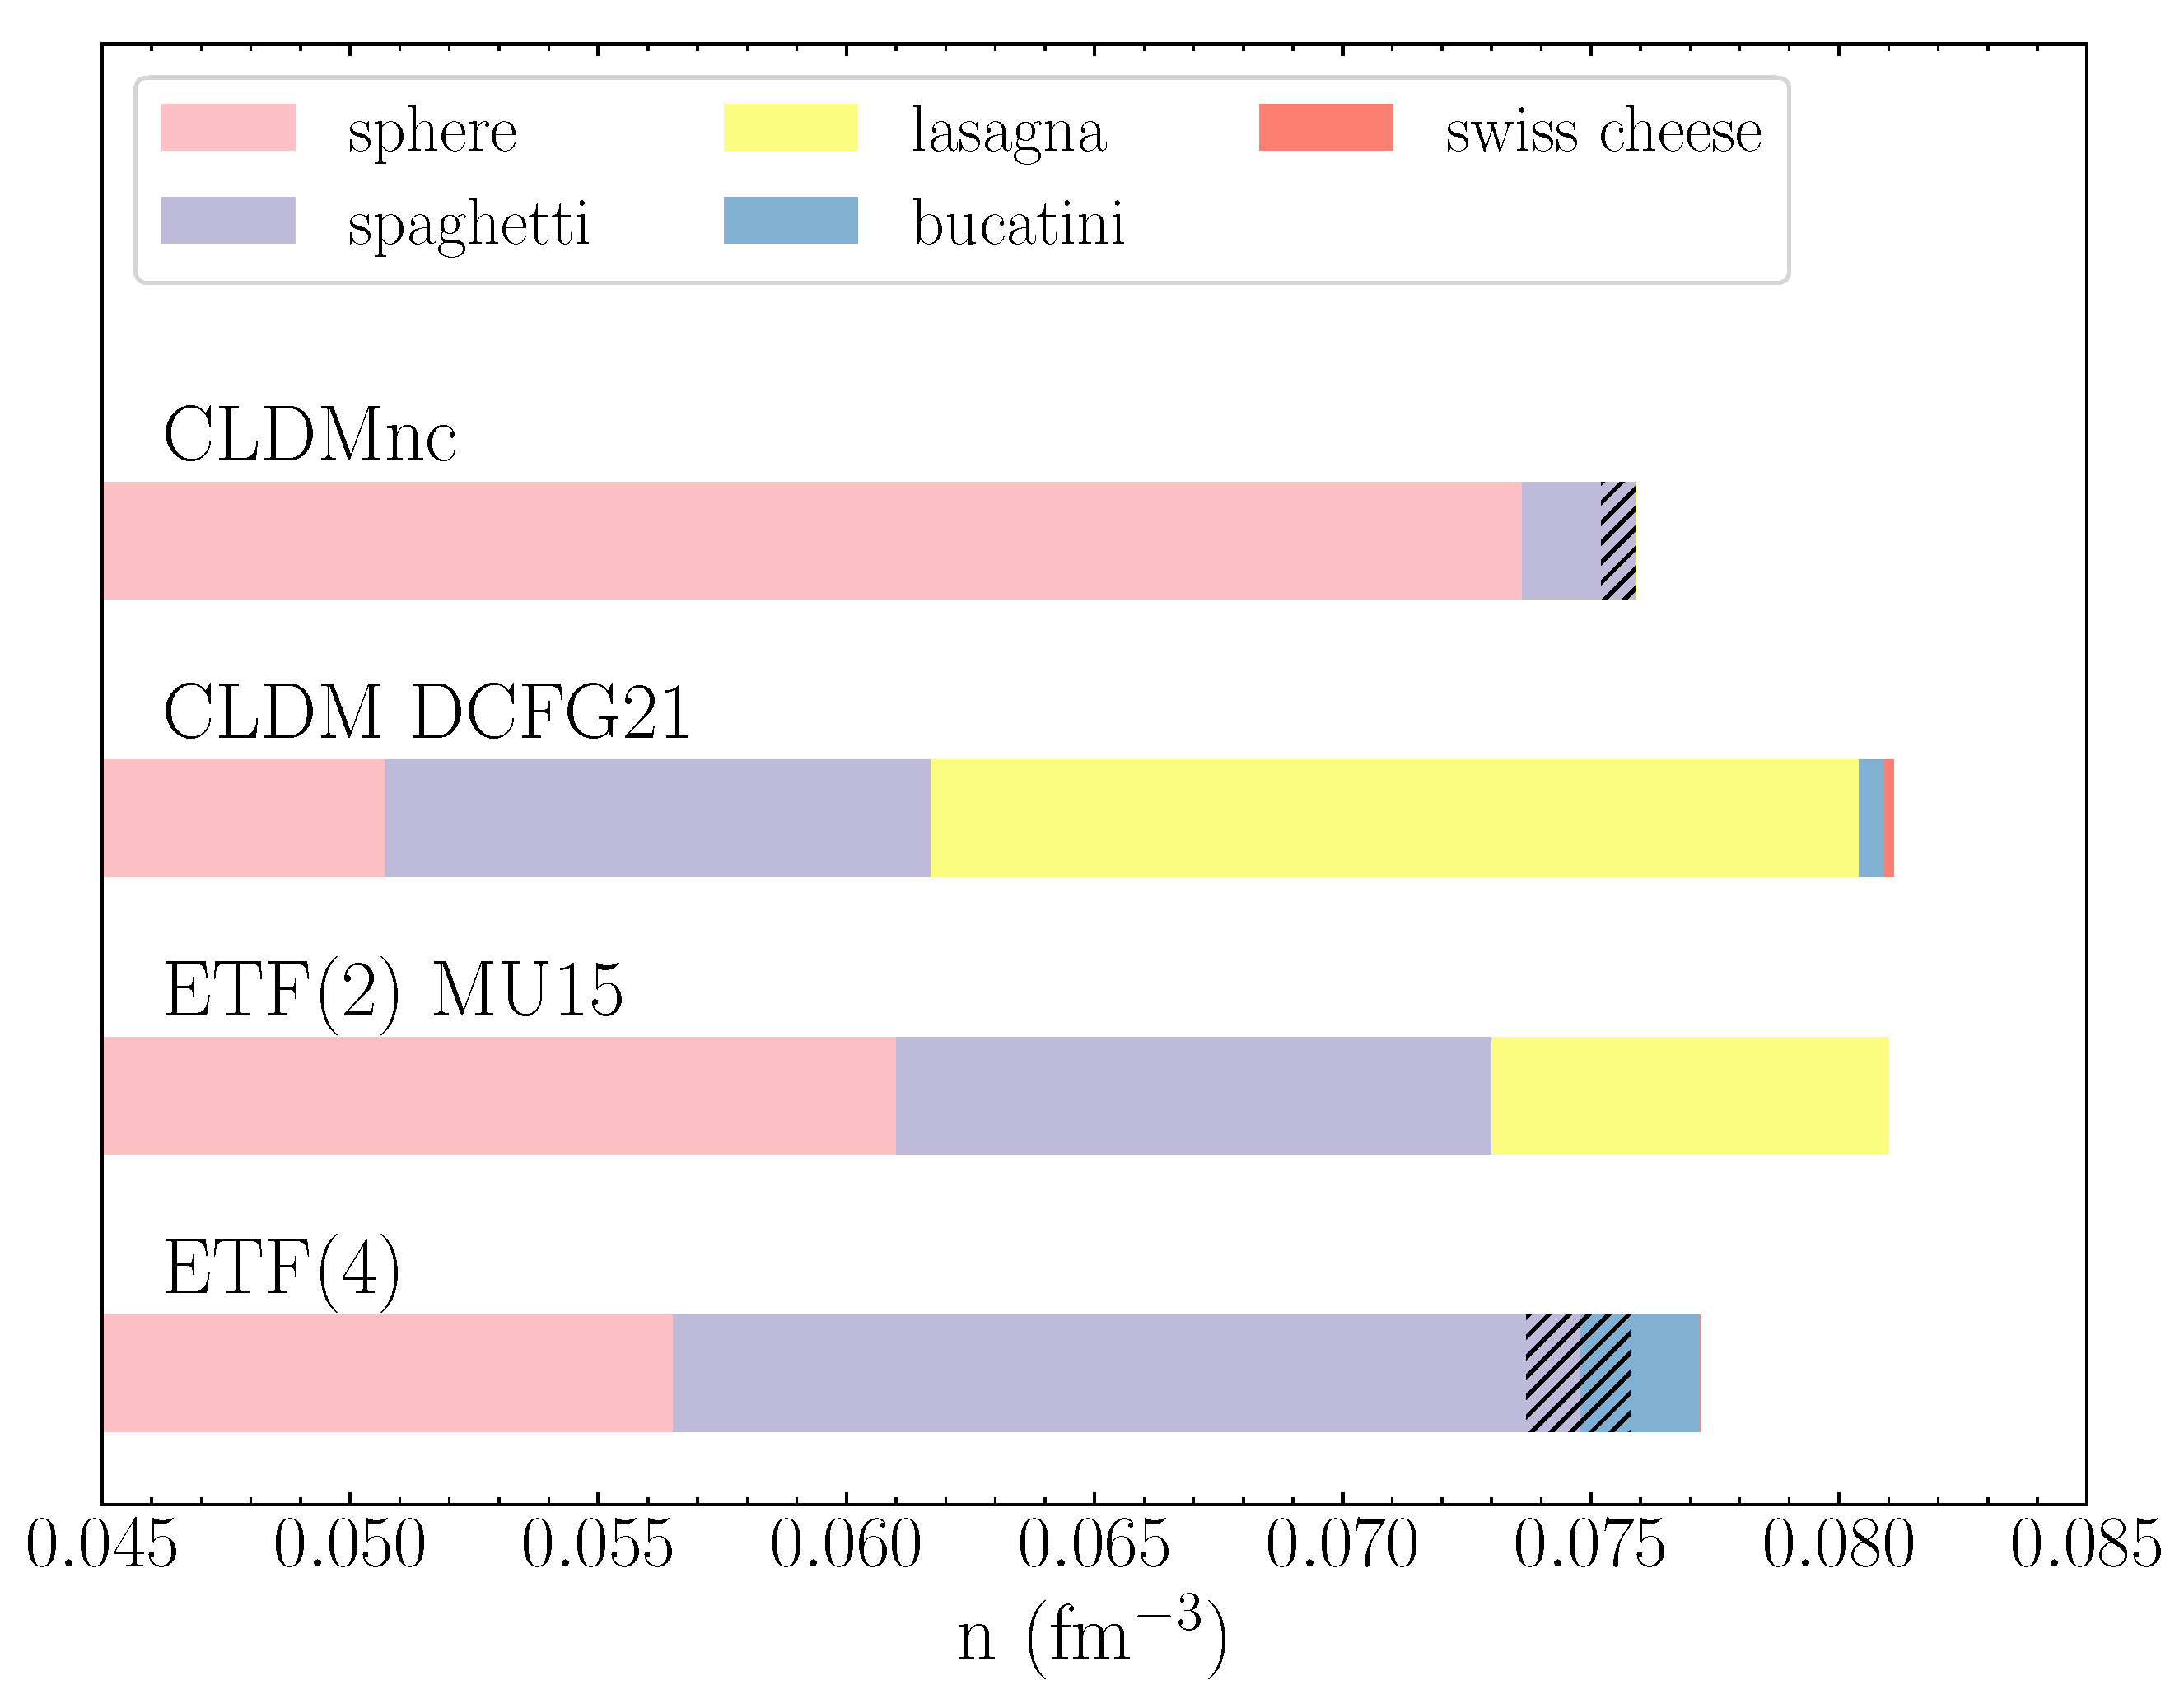
For the sake of comparison in Figure 5, we demonstrate the sequences of the pasta phases in the CLDM and ETF obtained in the literature. We can see that the CLDM model of DCFG21 predicts a “full traditional set” of the pasta phases in the broad density range, unlike CLDMnc, being closer to our ETF results and ETF calculations by Martin and Urban [28] (MU15 in Figure 5). This could stem from the fact that DCFG21 includes curvature correction, which significantly affects the pasta phase’s onset. Indeed, the curvature term might increase the total energy for the spheres more than for the spaghetti or lasagna phases. Thus, inclusion of this term into our CLDMnc likely will lead to the enlargement of the pasta region (see Figure 3), improving agreement with ETF calculations.
On the other hand, the CLDMs of [22,38] (not shown in Figure 5) take into account the curvature term and do not find the pasta phases. The difference may be associated with the method of surface energy calculation. Namely, [22,38] calculated it directly (with the second-order ETF expansion) for SLy4, whereas DCFG21 determines surface energy parameters by fitting to the experimental data, and thus, as mentioned in Section 2.2, the surface energy effectively incorporates several physical effects, extrapolated to high isospin asymmetry. Generally, it is unclear which of these effects is the most crucial for the prediction of the pasta phases. We plan to reveal this by incorporating curvature effects into our model in future works.
The pasta region in MU15 is shifted to a higher density than in our ETF calculations. Furthermore, MU15 predicts the lasagna phase instead of the bucatini one. There could be several reasons for this difference. Namely, MU15 utilizes different profile parametrization (simple Fermi–Dirac, where derivatives do not vanish at the cell boundary), which in principle could be substantial. Another point is that the authors made use of the second-order Wigner–Kirkwood expansion in their approach, in contrast to the fourth-order one of this work. The importance of these facts is partly confirmed by the paper [29], the authors of which used fourth-order ETF terms and found earlier (≈0.050 fm 3 vs. 0.057 fm 3 ) pasta-phase onset than in the MU15 model for the BSk24 nuclear functional.

4. Discussion and Conclusions

In this paper, we compared two methods for the calculation of the pasta phases in the NS crust. Namely, we employed the fourth-order ETF method and a more simplified CLDMnc, both based on the Skyrme-type effective interaction SLy4. We considered Wigner–Seits cells of different dimensions ( D = 3 spheres, D = 2 cylinders and D = 1 plates) to determine the most energetically favorable one at the given baryon number density n.
Within the ETF framework, we found that the pasta phases in the form of spaghetti and bucatini cover a significant region from n 0.056 fm 3 to ≈0.077 fm 3 . Other pasta shapes are absent in our treatment of the NS mantle, although the energy difference is too small to exclude them with high confidence (even if we limit ourselves to SLy4 potential). Our calculations generally confirm the results of MU15 [28], which also find pasta phases in the ETF approach within the SLy4 nuclear functional. However, they obtained the lasagna phase instead of bucatini as the last before the crust–core transition. They also found the pasta region to occur at higher densities than in our calculations. The key to this (slight) disagreement might be in the simpler parametrization of the nucleon density profile and in lower accuracy of the second-order ETF expansion applied in [28].
We also applied the thermodynamically consistent CLDMnc model while taking into account the neutron adsorption on the cluster surface. We used surface energy calculated by the fourth-order ETF method for the plane geometry and did not include the curvature corrections. The reason is that the fully thermodynamically consistent treatment of the latter deserves additional work, which we plan to publish later. Our CLDMnc implies the presence of the pasta phases in the form of spaghetti, but in the very small density range from n 0.074 fm 3 to ≈0.075 fm 3 . This result differs from [22,38], which found no pasta, although curvature terms were included (however, note, that the surface energy was obtained only within the second-order ETF expansion). Nevertheless, the CLDMnc crust–core transition point ( n cc 0.075 fm 3 ) almost coincides with that of [22], the authors of which obtained n cc 0.076 fm 3 .
It is interesting that the recently constructed CLDM [40] predicts the wide region of pasta phases n ( 0.051 0.081 ) fm 3 for SLy4, and therefore, their results are in better agreement with our ETF calculations. The explanation might come from their different treatment of the surface energy term (direct fit of the experimental atomic masses and extrapolation to high-isospin asymmetry). Moreover, they included the curvature correction and stress its importance for the prediction of the pasta phases [41].
We are going to incorporate a curvature term in a thermodynamically consistent way in further works to improve our CLDM. We believe that it should help to construct a robust and convenient model for exploring the NS crust. We also plan to extend our work to the other energy-density functionals.

Author Contributions

Calculations of pasta phases and surface tension; original draft preparation, N.N.S.; CLDMnc calculations, N.A.Z.; supervision, A.I.C. and M.E.G. All authors have read and agreed to the published version of the manuscript.

Funding

This research was funded by the Russian Science Foundation, grant number 22-12-00048 https://rscf.ru/project/22-12-00048/ (accessed on 28 September 2022).

Data Availability Statement

Data are available upon reasonable request.

Conflicts of Interest

The authors declare no conflict of interest.

Notes

1
Numerical results differ a bit from [22,59], where the second-order ETF approach with a modified coefficient of the Weizsacker term was applied.
2
According to [34], the NS temperatures of few keV can allow for a mixture of different phases.
3
Numerical results do not coincide with [43], which were based on surface tension calculated by the second-order ETF approach with a modified coefficient of the Weizsacker term.

References

  1. Zdunik, J.L.; Fortin, M.; Haensel, P. Neutron star properties and the equation of state for the core. Astron. Astrophys. 2017, 599, A119. [Google Scholar] [CrossRef] [Green Version]
  2. Newton, W.G.; Balliet, L.; Budimir, S.; Crocombe, G.; Douglas, B.; Blake Head, T.; Langford, Z.; Rivera, L.; Sanford, J. Ensembles of unified crust and core equations of state in a nuclear-multimessenger astrophysics environment. arXiv 2021, arXiv:2112.12108. [Google Scholar] [CrossRef]
  3. Gusakov, M.E.; Yakovlev, D.G.; Haensel, P.; Gnedin, O.Y. Direct Urca process in a neutron star mantle. Astron. Astrophys. 2004, 421, 1143–1148. [Google Scholar] [CrossRef] [Green Version]
  4. Yakovlev, D.G. Electron transport through nuclear pasta in magnetized neutron stars. Mon. Not. R Astron. Soc. 2015, 453, 581–590. [Google Scholar] [CrossRef] [Green Version]
  5. Schmitt, A.; Shternin, P. Reaction rates and transport in neutron stars. arXiv 2017, arXiv:1711.06520. [Google Scholar]
  6. Yakovlev, D.G.; Gusakov, M.E.; Haensel, P. Bulk viscosity in a neutron star mantle. Mon. Not. R Astron. Soc. 2018, 481, 4924–4930. [Google Scholar] [CrossRef]
  7. Lin, Z.; Caplan, M.E.; Horowitz, C.J.; Lunardini, C. Fast neutrino cooling of nuclear pasta in neutron stars: Molecular dynamics simulations. Phys. Rev. C 2020, 102, 045801. [Google Scholar] [CrossRef]
  8. Pethick, C.J.; Potekhin, A.Y. Liquid crystals in the mantles of neutron stars. Phys. Lett. B 1998, 427, 7–12. [Google Scholar] [CrossRef] [Green Version]
  9. Caplan, M.E.; Schneider, A.S.; Horowitz, C.J. Elast. Nucl. Pasta. Phys. Rev. Lett. 2018, 121, 132701. [Google Scholar] [CrossRef] [Green Version]
  10. Pethick, C.J.; Zhang, Z.W.; Kobyakov, D.N. Elastic properties of phases with nonspherical nuclei in dense matter. Phys. Rev. C 2020, 101, 055802. [Google Scholar] [CrossRef]
  11. Xia, C.J.; Maruyama, T.; Yasutake, N.; Tatsumi, T.; Zhang, Y.X. Elastic properties of nuclear pasta in a fully three-dimensional geometry. arXiv 2022, arXiv:2209.13310. [Google Scholar]
  12. Piekarewicz, J.; Fattoyev, F.J.; Horowitz, C.J. Pulsar glitches: The crust may be enough. Phys. Rev. C 2014, 90, 015803. [Google Scholar] [CrossRef]
  13. Horowitz, C.J.; Berry, D.K.; Briggs, C.M.; Caplan, M.E.; Cumming, A.; Schneider, A.S. Disordered Nuclear Pasta, Magnetic Field Decay, and Crust Cooling in Neutron Stars. Phys. Rev. Lett. 2015, 114, 031102. [Google Scholar] [CrossRef] [Green Version]
  14. Pons, J.A.; Viganò, D.; Rea, N. A highly resistive layer within the crust of X-ray pulsars limits their spin periods. Nat. Phys. 2013, 9, 431–434. [Google Scholar] [CrossRef]
  15. Gearheart, M.; Newton, W.G.; Hooker, J.; Li, B.A. Upper limits on the observational effects of nuclear pasta in neutron stars. Mon. Not. R Astron. Soc. 2011, 418, 2343–2349. [Google Scholar] [CrossRef] [Green Version]
  16. Merritt, R.L.; Cackett, E.M.; Brown, E.F.; Page, D.; Cumming, A.; Degenaar, N.; Deibel, A.; Homan, J.; Miller, J.M.; Wijnands, R. The Thermal State of KS 1731-260 after 14.5 years in Quiescence. Astrophys. J. 2016, 833, 186. [Google Scholar] [CrossRef] [Green Version]
  17. Ootes, L.S.; Wijnands, R.; Page, D. Long-term temperature evolution of neutron stars undergoing episodic accretion outbursts. Astron. Astrophys. 2019, 630, A95. [Google Scholar] [CrossRef] [Green Version]
  18. Lalit, S.; Meisel, Z.; Brown, E.F. Crust-cooling Models Are Insensitive to the Crust-Core Transition Pressure for Realistic Equations of State. Astrophys. J. 2019, 882, 91. [Google Scholar] [CrossRef] [Green Version]
  19. Ravenhall, D.G.; Pethick, C.J.; Wilson, J.R. Structure of Matter below Nuclear Saturation Density. Phys. Rev. Lett. 1983, 50, 2066–2069. [Google Scholar] [CrossRef]
  20. Hashimoto, M.; Seki, H.; Yamada, M. Shape of nuclei in the crust of a neutron star. Prog. Theor. Phys. 1984, 71, 320–326. [Google Scholar] [CrossRef] [Green Version]
  21. Lorenz, C.P.; Ravenhall, D.G.; Pethick, C.J. Neutron star crusts. Phys. Rev. Lett. 1993, 70, 379–382. [Google Scholar] [CrossRef]
  22. Douchin, F.; Haensel, P.; Meyer, J. Nuclear surface and curvature properties for SLy Skyrme forces and nuclei in the inner neutron-star crust. Nucl. Phys. A 2000, 665, 419–446. [Google Scholar] [CrossRef]
  23. Newton, W.G.; Gearheart, M.; Li, B.A. A Survey of the Parameter Space of the Compressible Liquid Drop Model as Applied to the Neutron Star Inner Crust. Astrophys. J. Suppl. Ser. 2012, 204, 9. [Google Scholar] [CrossRef] [Green Version]
  24. Newton, W.G.; Preston, R.; Balliet, L.; Ross, M. From neutron skins and neutron matter to the neutron star crust. arXiv 2021, arXiv:2111.07969. [Google Scholar] [CrossRef]
  25. Caplan, M.E.; Horowitz, C.J. Colloquium: Astromaterial science and nuclear pasta. Rev. Mod. Phys. 2017, 89, 041002. [Google Scholar] [CrossRef] [Green Version]
  26. Oyamatsu, K. Nuclear shapes in the inner crust of a neutron star. Nucl. Phys. A 1993, 561, 431–452. [Google Scholar] [CrossRef]
  27. Sharma, B.K.; Centelles, M.; Viñas, X.; Baldo, M.; Burgio, G.F. Unified equation of state for neutron stars on a microscopic basis. Astron. Astrophys. 2015, 584, A103. [Google Scholar] [CrossRef]
  28. Martin, N.; Urban, M. Liquid-gas coexistence versus energy minimization with respect to the density profile in the inhomogeneous inner crust of neutron stars. Phys. Rev. C 2015, 92, 015803. [Google Scholar] [CrossRef] [Green Version]
  29. Pearson, J.M.; Chamel, N.; Potekhin, A.Y. Unified equations of state for cold nonaccreting neutron stars with Brussels-Montreal functionals. II. Pasta phases in semiclassical approximation. Phys. Rev. C 2020, 101, 015802. [Google Scholar] [CrossRef] [Green Version]
  30. Pearson, J.M.; Chamel, N. Unified equations of state for cold nonaccreting neutron stars with Brussels-Montreal functionals. III. Inclusion of microscopic corrections to pasta phases. Phys. Rev. C 2022, 105, 015803. [Google Scholar] [CrossRef]
  31. Ji, F.; Hu, J.; Shen, H. Nuclear pasta and symmetry energy in the relativistic point-coupling model. Phys. Rev. C 2021, 103, 055802. [Google Scholar] [CrossRef]
  32. Schuetrumpf, B.; Nazarewicz, W. Twist-averaged boundary conditions for nuclear pasta Hartree-Fock calculations. Phys. Rev. C 2015, 92, 045806. [Google Scholar] [CrossRef]
  33. Fattoyev, F.J.; Horowitz, C.J.; Schuetrumpf, B. Quantum nuclear pasta and nuclear symmetry energy. Phys. Rev. C 2017, 95, 055804. [Google Scholar] [CrossRef] [Green Version]
  34. Newton, W.G.; Cantu, S.; Wang, S.; Stinson, A.; Kaltenborn, M.A.; Stone, J.R. Glassy quantum nuclear pasta in neutron star crusts. Phys. Rev. C 2022, 105, 025806. [Google Scholar] [CrossRef]
  35. Schneider, A.S.; Berry, D.K.; Briggs, C.M.; Caplan, M.E.; Horowitz, C.J. Nuclear “waffles”. Phys. Rev. C 2014, 90, 055805. [Google Scholar] [CrossRef] [Green Version]
  36. Berry, D.K.; Caplan, M.E.; Horowitz, C.J.; Huber, G.; Schneider, A.S. “Parking-garage” structures in nuclear astrophysics and cellular biophysics. Phys. Rev. C 2016, 94, 055801. [Google Scholar] [CrossRef] [Green Version]
  37. Schneider, A.S.; Caplan, M.E.; Berry, D.K.; Horowitz, C.J. Domains and defects in nuclear pasta. Phys. Rev. C 2018, 98, 055801. [Google Scholar] [CrossRef] [Green Version]
  38. Viñas, X.; Gonzalez-Boquera, C.; Sharma, B.K.; Centelles, M. Pasta-phase Transitions in the Inner Crust of Neutron Stars. Acta Phys. Pol. B Proc. Suppl. 2017, 10, 259. [Google Scholar]
  39. Gusakov, M.E.; Chugunov, A.I. Thermodynamically Consistent Equation of State for an Accreted Neutron Star Crust. Phys. Rev. Lett. 2020, 124, 191101. [Google Scholar] [CrossRef]
  40. Dinh Thi, H.; Carreau, T.; Fantina, A.F.; Gulminelli, F. Uncertainties in the pasta-phase properties of catalysed neutron stars. Astron. Astrophys. 2021, 654, A114. [Google Scholar] [CrossRef]
  41. Dinh Thi, H.; Fantina, A.F.; Gulminelli, F. The effect of the energy functional on the pasta-phase properties of catalysed neutron stars. Eur. Phys. J. A 2021, 57, 296. [Google Scholar] [CrossRef]
  42. Balliet, L.E.; Newton, W.G.; Cantu, S.; Budimir, S. Prior Probability Distributions of Neutron Star Crust Models. Astrophys. J. 2021, 918, 79. [Google Scholar] [CrossRef]
  43. Zemlyakov, N.A.; Chugunov, A.I.; Shchechilin, N.N. Non-spherical nucleon clusters in the mantle of a neutron star: CLDM based on Skyrme-type forces. J. Phys. Conf. Ser. 2021, 2103, 012004. [Google Scholar] [CrossRef]
  44. Pethick, C.; Ravenhall, D.; Lattimer, J. Effect of nuclear curvature energy on the transition between nuclei and bubbles in dense matter. Phys. Lett. B 1983, 128, 137–140. [Google Scholar] [CrossRef]
  45. Haensel, P.; Potekhin, A.; Yakovlev, D. Neutron Stars 1: Equation of State and Structure. In Astrophysics and Space Science Library; Springer: Berlin/Heidelberg, Germany, 2007. [Google Scholar]
  46. Carreau, T.; Gulminelli, F.; Chamel, N.; Fantina, A.F.; Pearson, J.M. Crystallization of the inner crust of a neutron star and the influence of shell effects. Astron. Astrophys. 2020, 635, A84. [Google Scholar] [CrossRef] [Green Version]
  47. Potekhin, A.Y.; Chabrier, G. Crust structure and thermal evolution of neutron stars in soft X-ray transients. Astron. Astrophys. 2021, 645, A102. [Google Scholar] [CrossRef]
  48. Pais, H.; Bertolino, B.; Fang, J.; Wang, X.; Providência, C. Strong magnetic fields: Neutron stars with an extended inner crust. Eur. Phys. J. A 2021, 57, 193. [Google Scholar] [CrossRef]
  49. Bao, S.S.; Hu, J.N.; Shen, H. Impact of strong magnetic fields on the inner crust of neutron stars. Phys. Rev. C 2021, 103, 015804. [Google Scholar] [CrossRef]
  50. Chabanat, E.; Bonche, P.; Haensel, P.; Meyer, J.; Schaeffer, R. A Skyrme parametrization from subnuclear to neutron star densitiesPart II. Nuclei far from stabilities. Nucl. Phys. A 1998, 635, 231–256. [Google Scholar] [CrossRef]
  51. Skyrme, T.H.R. CVII. The nuclear surface. Philos. Mag. 1956, 1, 1043–1054. [Google Scholar] [CrossRef]
  52. Vautherin, D.; Brink, D.M. Hartree-Fock Calculations with Skyrme’s Interaction. I. Spherical Nuclei. Phys. Rev. C 1972, 5, 626–647. [Google Scholar] [CrossRef]
  53. Brack, M.; Guet, C.; Håkansson, H.B. Selfconsistent semiclassical description of average nuclear properties—A link between microscopic and macroscopic models. Phys. Rep. 1985, 123, 275–364. [Google Scholar] [CrossRef] [Green Version]
  54. Shelley, M.; Pastore, A. How accurately can the Extended Thomas–Fermi method describe the inner crust of a neutron star? J. Phys. Conf. Ser. 2020, 1668, 012037. [Google Scholar] [CrossRef]
  55. Shelley, M.; Pastore, A. Comparison between the Thomas–Fermi and Hartree-Fock-Bogoliubov Methods in the Inner Crust of a Neutron Star: The Role of Pairing Correlations. Universe 2020, 6, 206. [Google Scholar] [CrossRef]
  56. Pearson, J.M.; Chamel, N.; Potekhin, A.Y.; Fantina, A.F.; Ducoin, C.; Dutta, A.K.; Goriely, S. Unified equations of state for cold non-accreting neutron stars with Brussels-Montreal functionals - I. Role of symmetry energy. Mon. Not. R Astron. Soc. 2018, 481, 2994–3026. [Google Scholar] [CrossRef]
  57. Shapiro, S.L.; Teukolsky, S.A. Black Holes, White Dwarfs, and Neutron Stars: The Physics of Compact Objects; Cornell University: Ithaca, NY, USA, 1983. [Google Scholar]
  58. Centelles, M.; Del Estal, M.; Viñas, X. Semiclassical treatment of asymmetric semi-infinite nuclear matter: Surface and curvature properties in relativistic and non-relativistic models. Nucl. Phys. A 1998, 635, 193–230. [Google Scholar] [CrossRef] [Green Version]
  59. Shchechilin, N.N.; Chugunov, A.I. Surface energy of nuclear matter above and below neutron drip with the Skyrme-type effective interactions. In Proceedings of the Journal of Physics Conference Series. J. Phys. Conf. Ser. 2020, 1697, 012025. [Google Scholar] [CrossRef]
  60. Furtado, U.J.; Gulminelli, F. Parametrization of the surface energy in the ETF approximation. J. Phys. G Nucl. Phys. 2021, 48, 015102. [Google Scholar] [CrossRef]
  61. Lattimer, J.M.; Pethick, C.J.; Ravenhall, D.G.; Lamb, D.Q. Physical properties of hot, dense matter: The general case. Nucl. Phys. A 1985, 432, 646–742. [Google Scholar] [CrossRef]
  62. Carreau, T.; Gulminelli, F.; Margueron, J. General predictions for the neutron star crustal moment of inertia. Phys. Rev. C 2019, 100, 055803. [Google Scholar] [CrossRef] [Green Version]
  63. Carreau, T.; Gulminelli, F.; Margueron, J. Bayesian analysis of the crust-core transition with a compressible liquid-drop model. Eur. Phys. J. A 2019, 55, 188. [Google Scholar] [CrossRef]
  64. Mackie, F.D.; Baym, G. Compressible liquid drop nuclear model and mass formula. Nucl. Phys. A 1977, 285, 332–348. [Google Scholar] [CrossRef]
  65. Wang, M.; Audi, G.; Kondev, F.G.; Huang, W.J.; Naimi, S.; Xu, X. The AME2016 atomic mass evaluation (II). Tables, graphs and references. Chin. Phys. C 2017, 41, 030003. [Google Scholar] [CrossRef]
  66. Pearson, J.M.; Chamel, N.; Goriely, S.; Ducoin, C. Inner crust of neutron stars with mass-fitted Skyrme functionals. Phys. Rev. C 2012, 85, 065803. [Google Scholar] [CrossRef] [Green Version]
  67. Chamel, N.; Naimi, S.; Khan, E.; Margueron, J. Validity of the Wigner-Seitz approximation in neutron star crust. Phys. Rev. C 2007, 75, 055806. [Google Scholar] [CrossRef] [Green Version]
  68. Baldo, M.; Saperstein, E.E.; Tolokonnikov, S.V. The role of the boundary conditions in the Wigner Seitz approximation applied to the neutron star inner crust. Nucl. Phys. A 2006, 775, 235–244. [Google Scholar] [CrossRef]
Figure 1. Surface tension of nuclear matter σ s versus neutron excess δ . The blue dashed line describes σ s , and the navy solid line represents surface energy per unit area, calculated thermodynamically consistently, i.e., taking into account the neutron skin. σ s from [40] is added for comparison (red dash–dot line).
Universe 08 00582 g001
Figure 2. Difference in energy per nucleon between pasta phases and spheres versus baryon number density for ETF calculations. Thin violet and thick blue dashed lines represent spaghetti and bucatini, respectively; the yellow dash–dot line denotes lasagna; red dots map Swiss cheese; finally, the pink solid line is for uniform matter.
Universe 08 00582 g002
Figure 3. The same as Figure 2 but for CLDMnc.
Universe 08 00582 g003
Figure 4. Energy per nucleon without neutron mass for spheres as a function of baryon number density in the ETF model (blue solid line) and in the CLDMnc model (red dashed).
Universe 08 00582 g004
Figure 5. Sequence of pasta phases in the mantle of NS. Pink region represents spheres, violet denotes spaghetti, yellow indicates lasagna, blue is for bucatini and red is for Swiss cheese. The fourth-order ETF calculations (ETF(4)) and CLDMnc of this work are presented. The CLDM model of [41] (DCFG21) and second-order ETF results [ETF(2)] of [28] (MU15) were added for comparison. For ETF(4) and CLDMnc, we also indicate a density jump between phases according to Maxwell construction (the hatched region); only jumps visible on the scale of the plot are shown.
Universe 08 00582 g005
Publisher’s Note: MDPI stays neutral with regard to jurisdictional claims in published maps and institutional affiliations.