1H-NMR Metabolomics Identifies Significant Changes in Metabolism over Time in a Porcine Model of Severe Burn and Smoke Inhalation


Abstract
1. Introduction
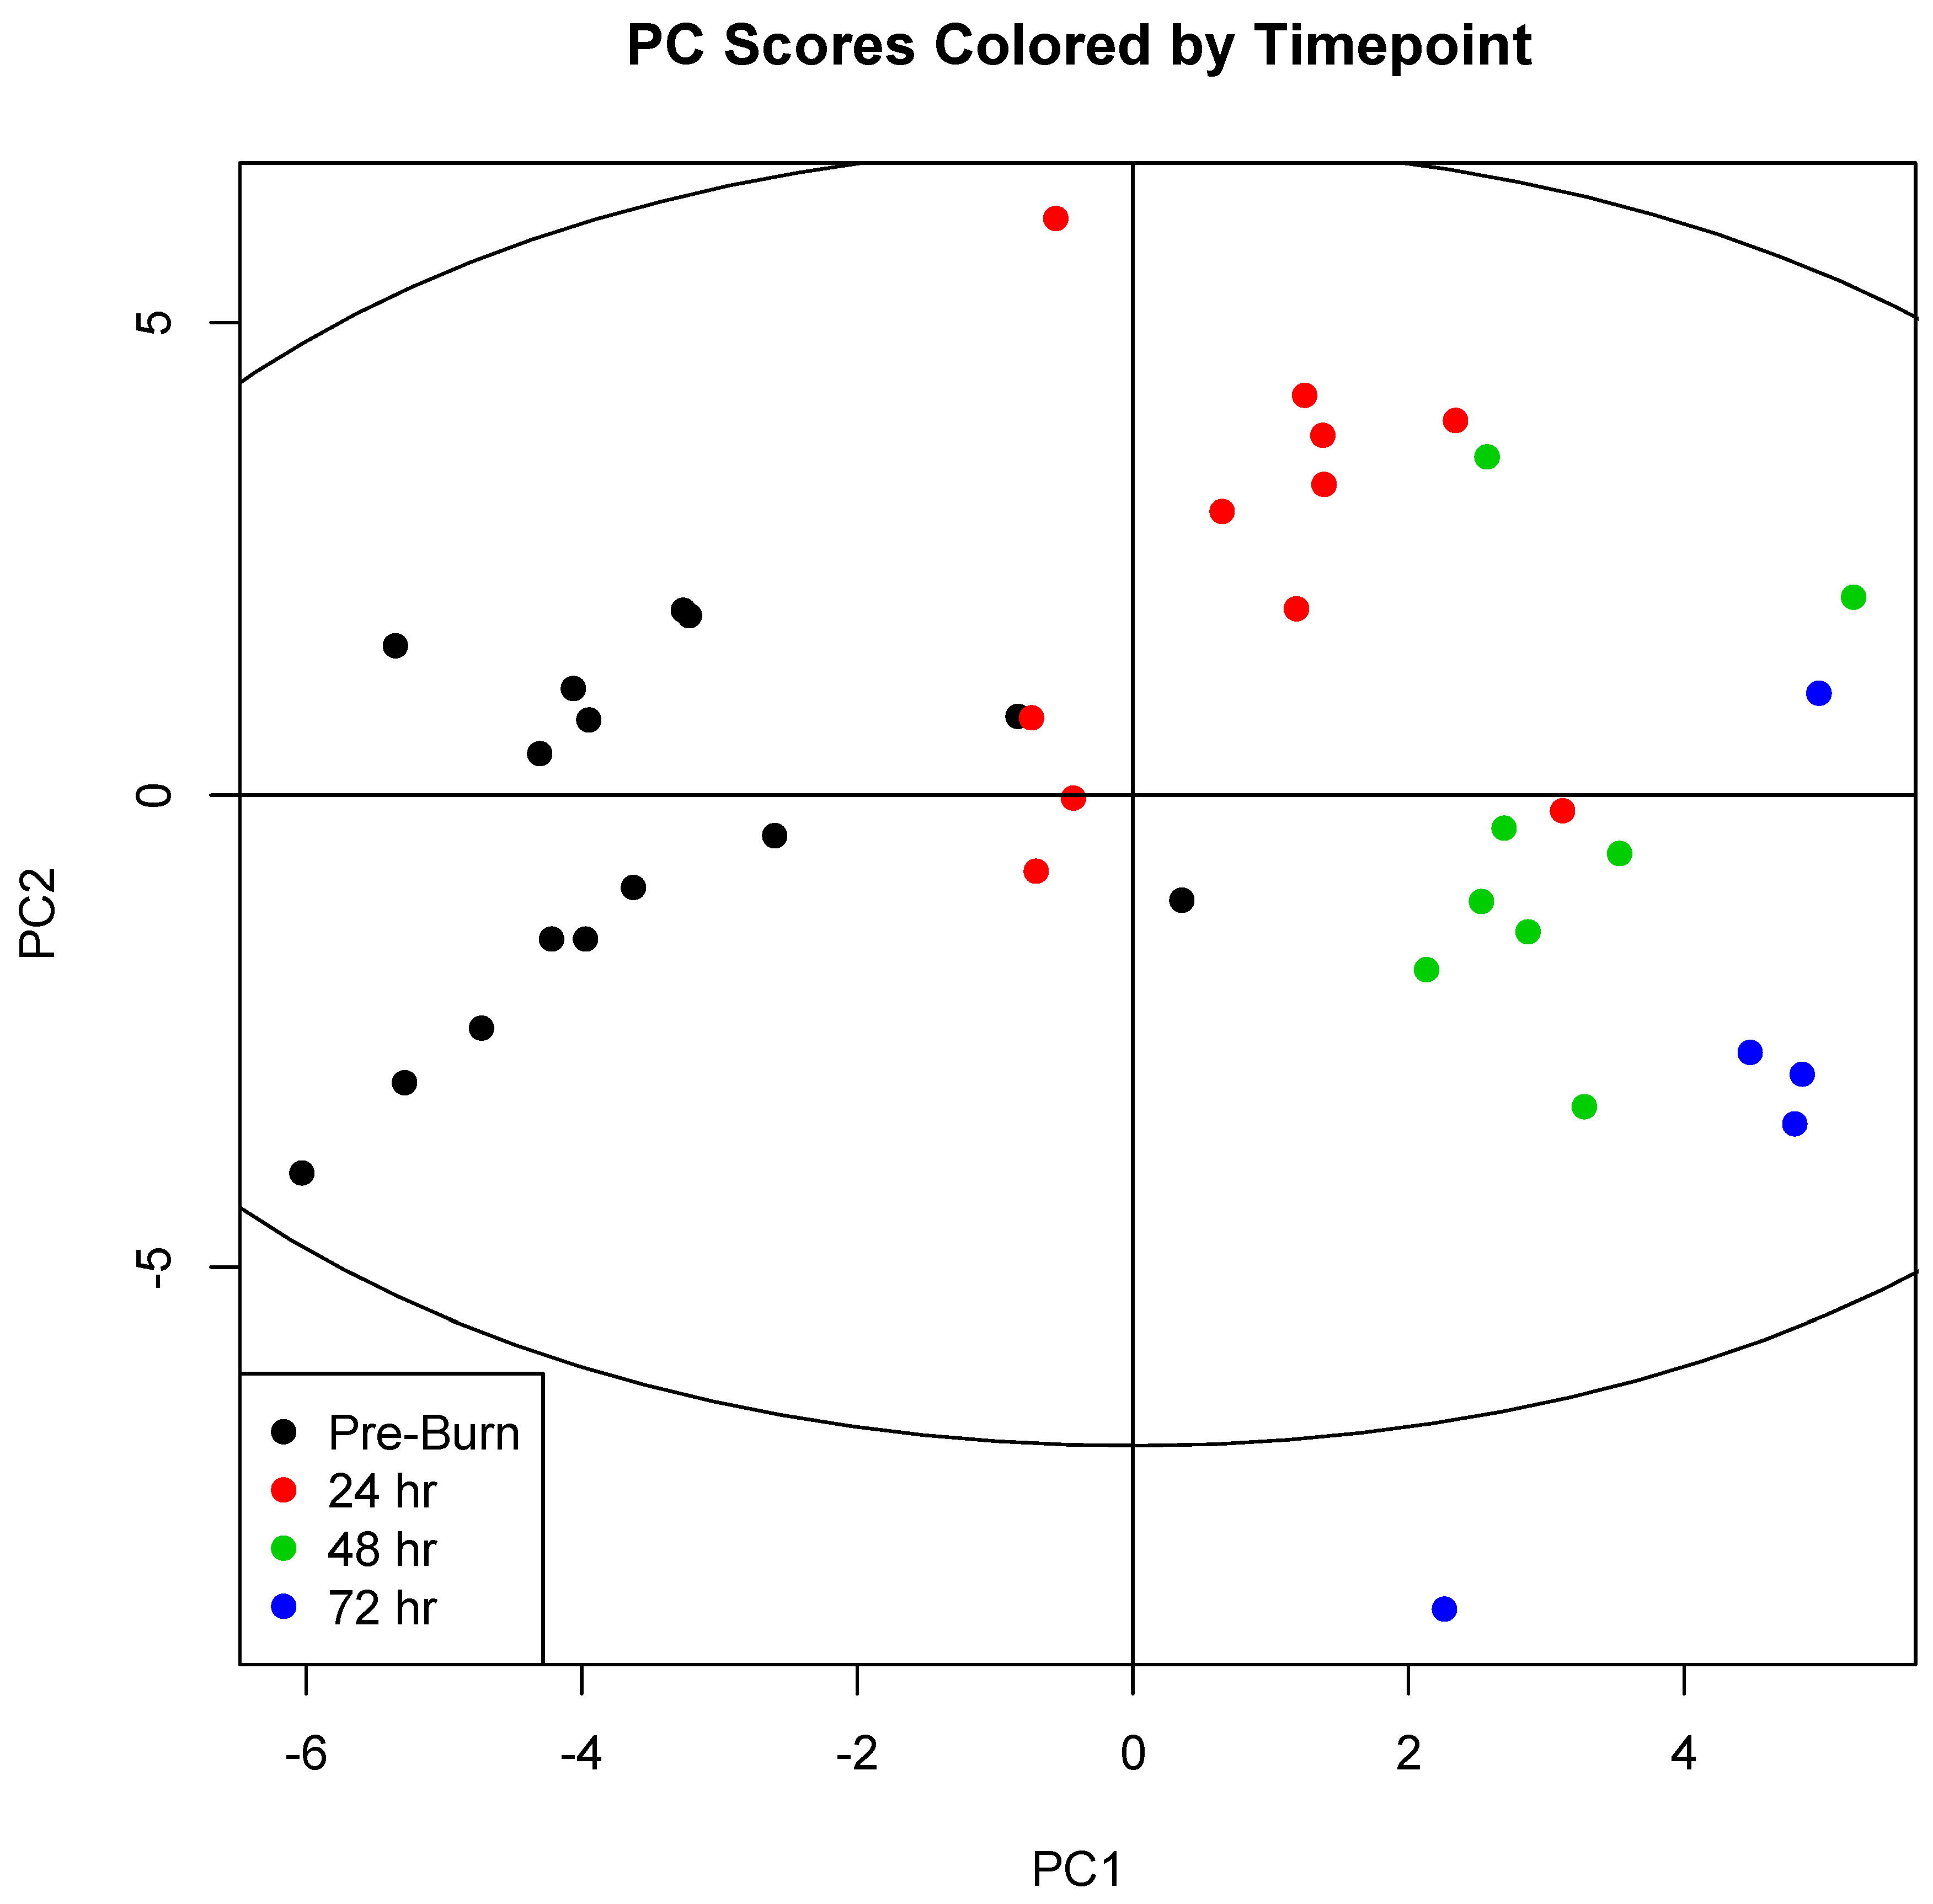
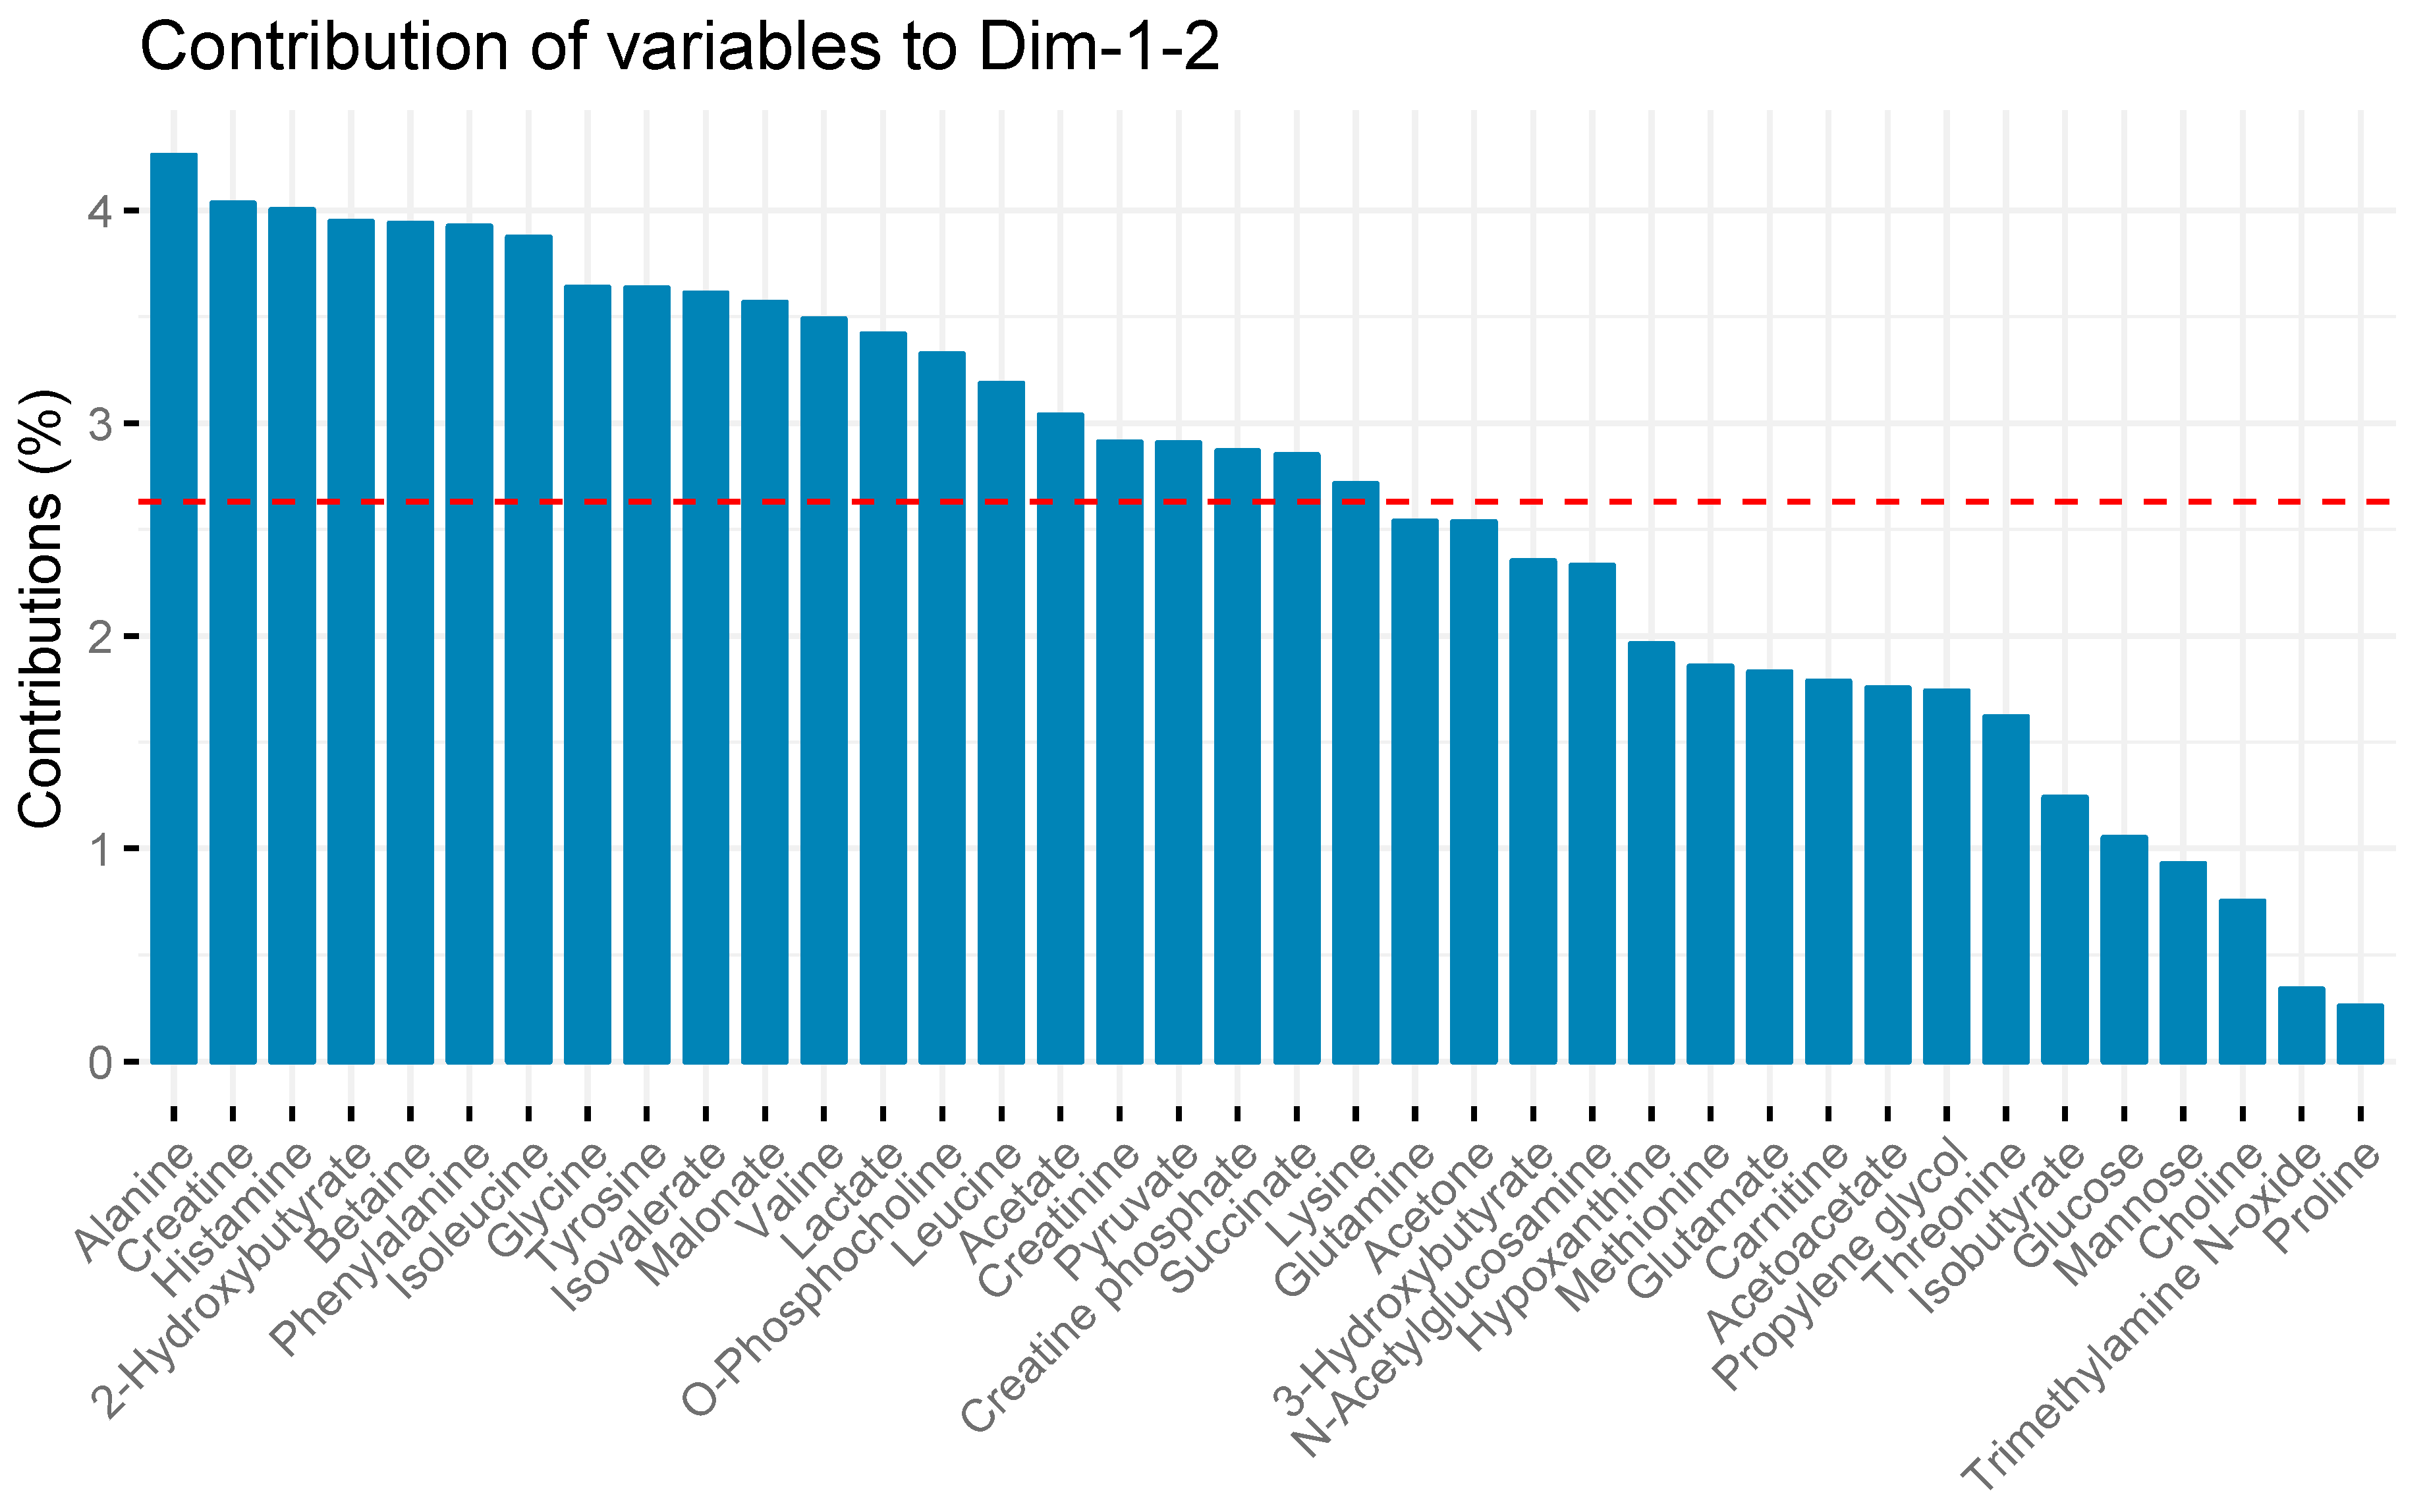
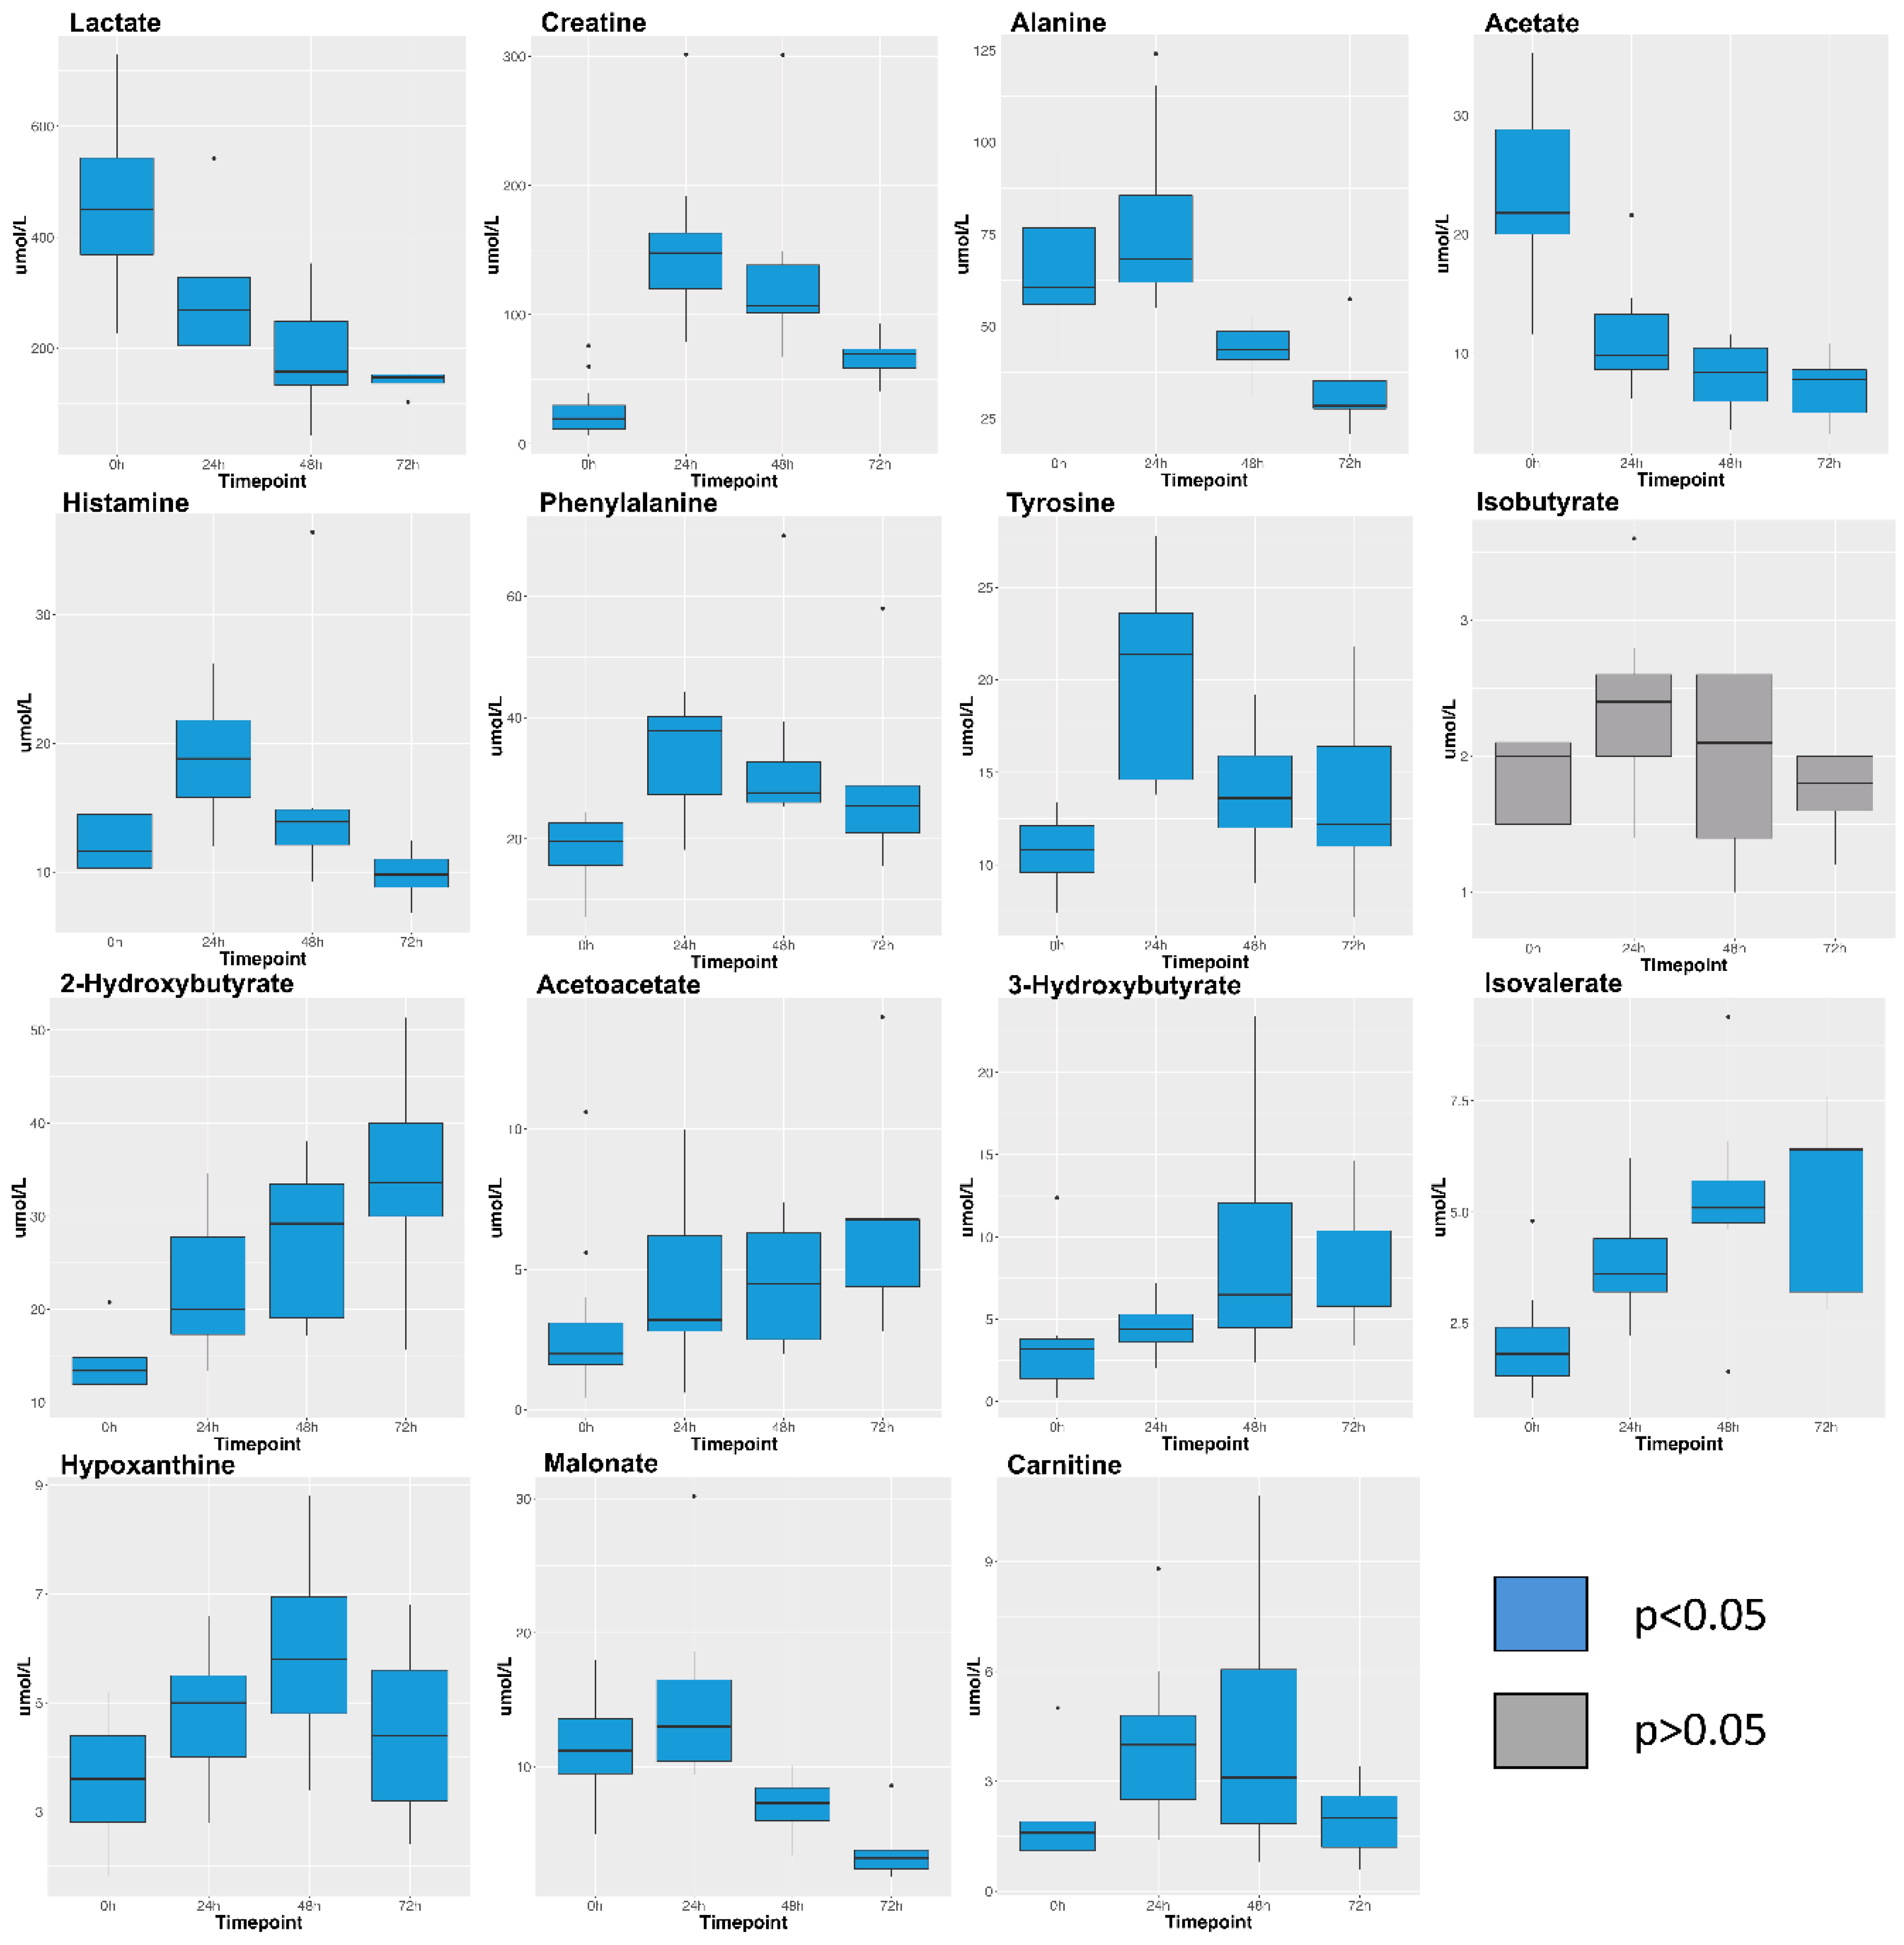
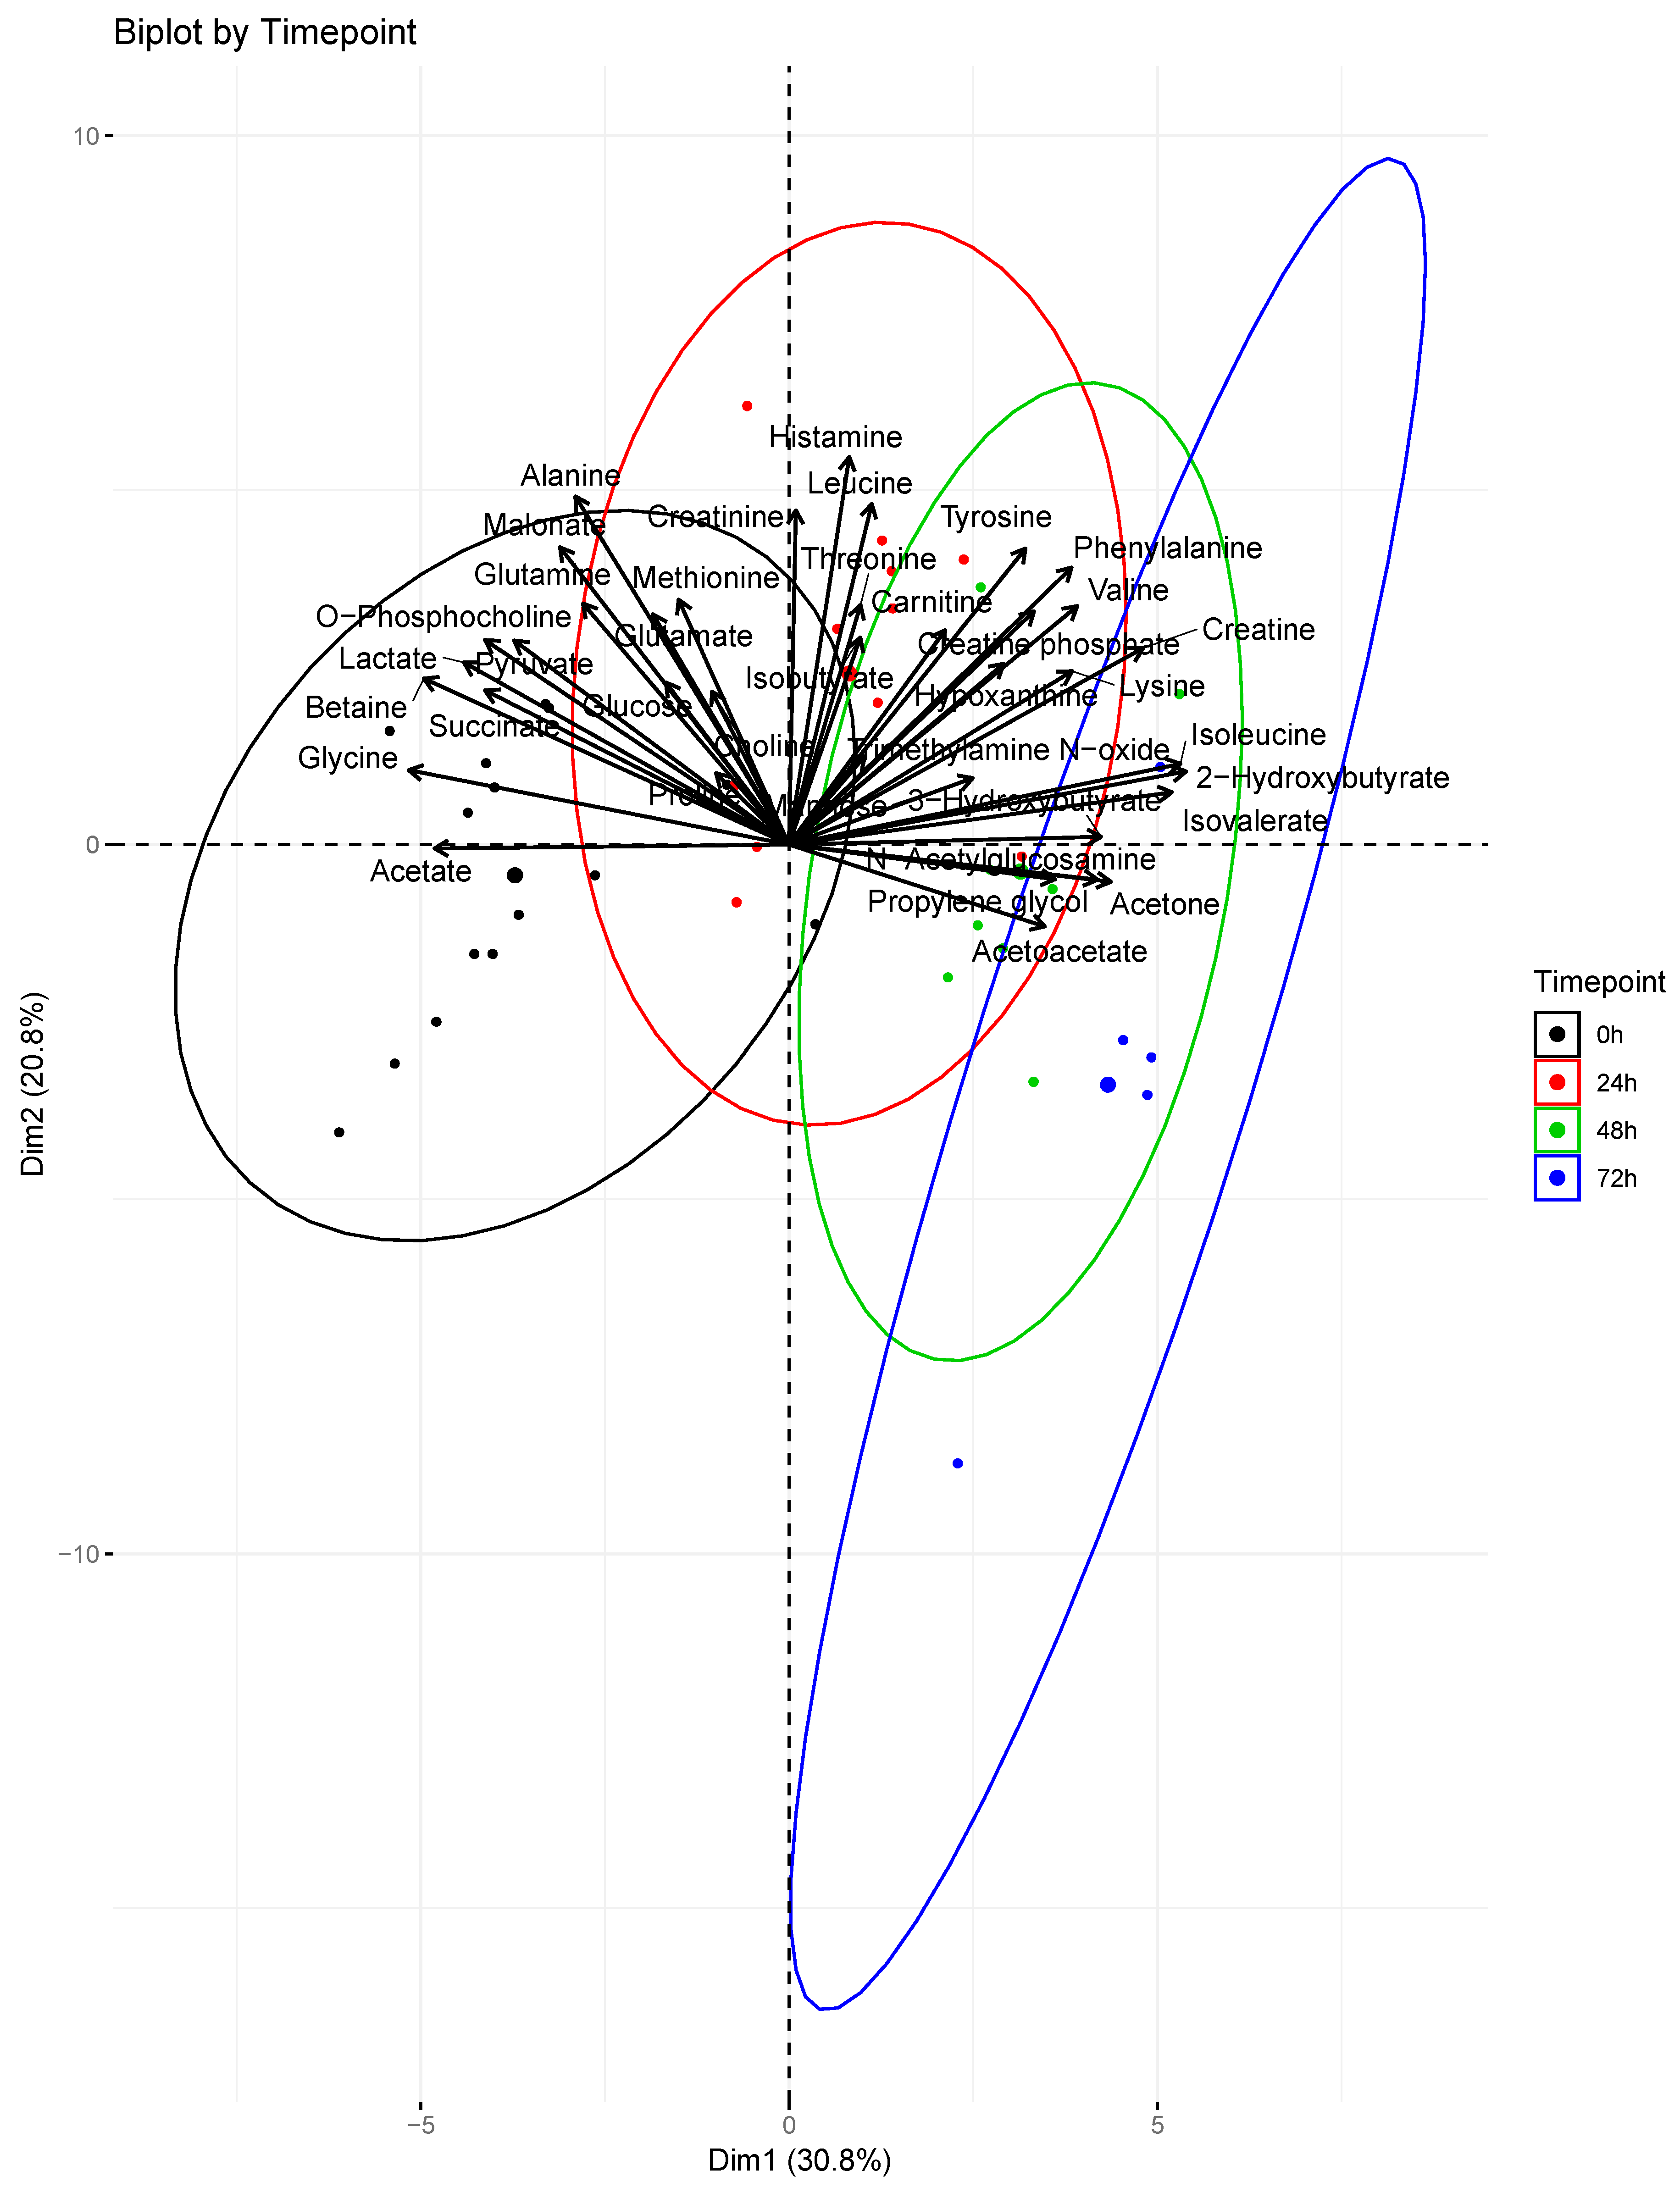
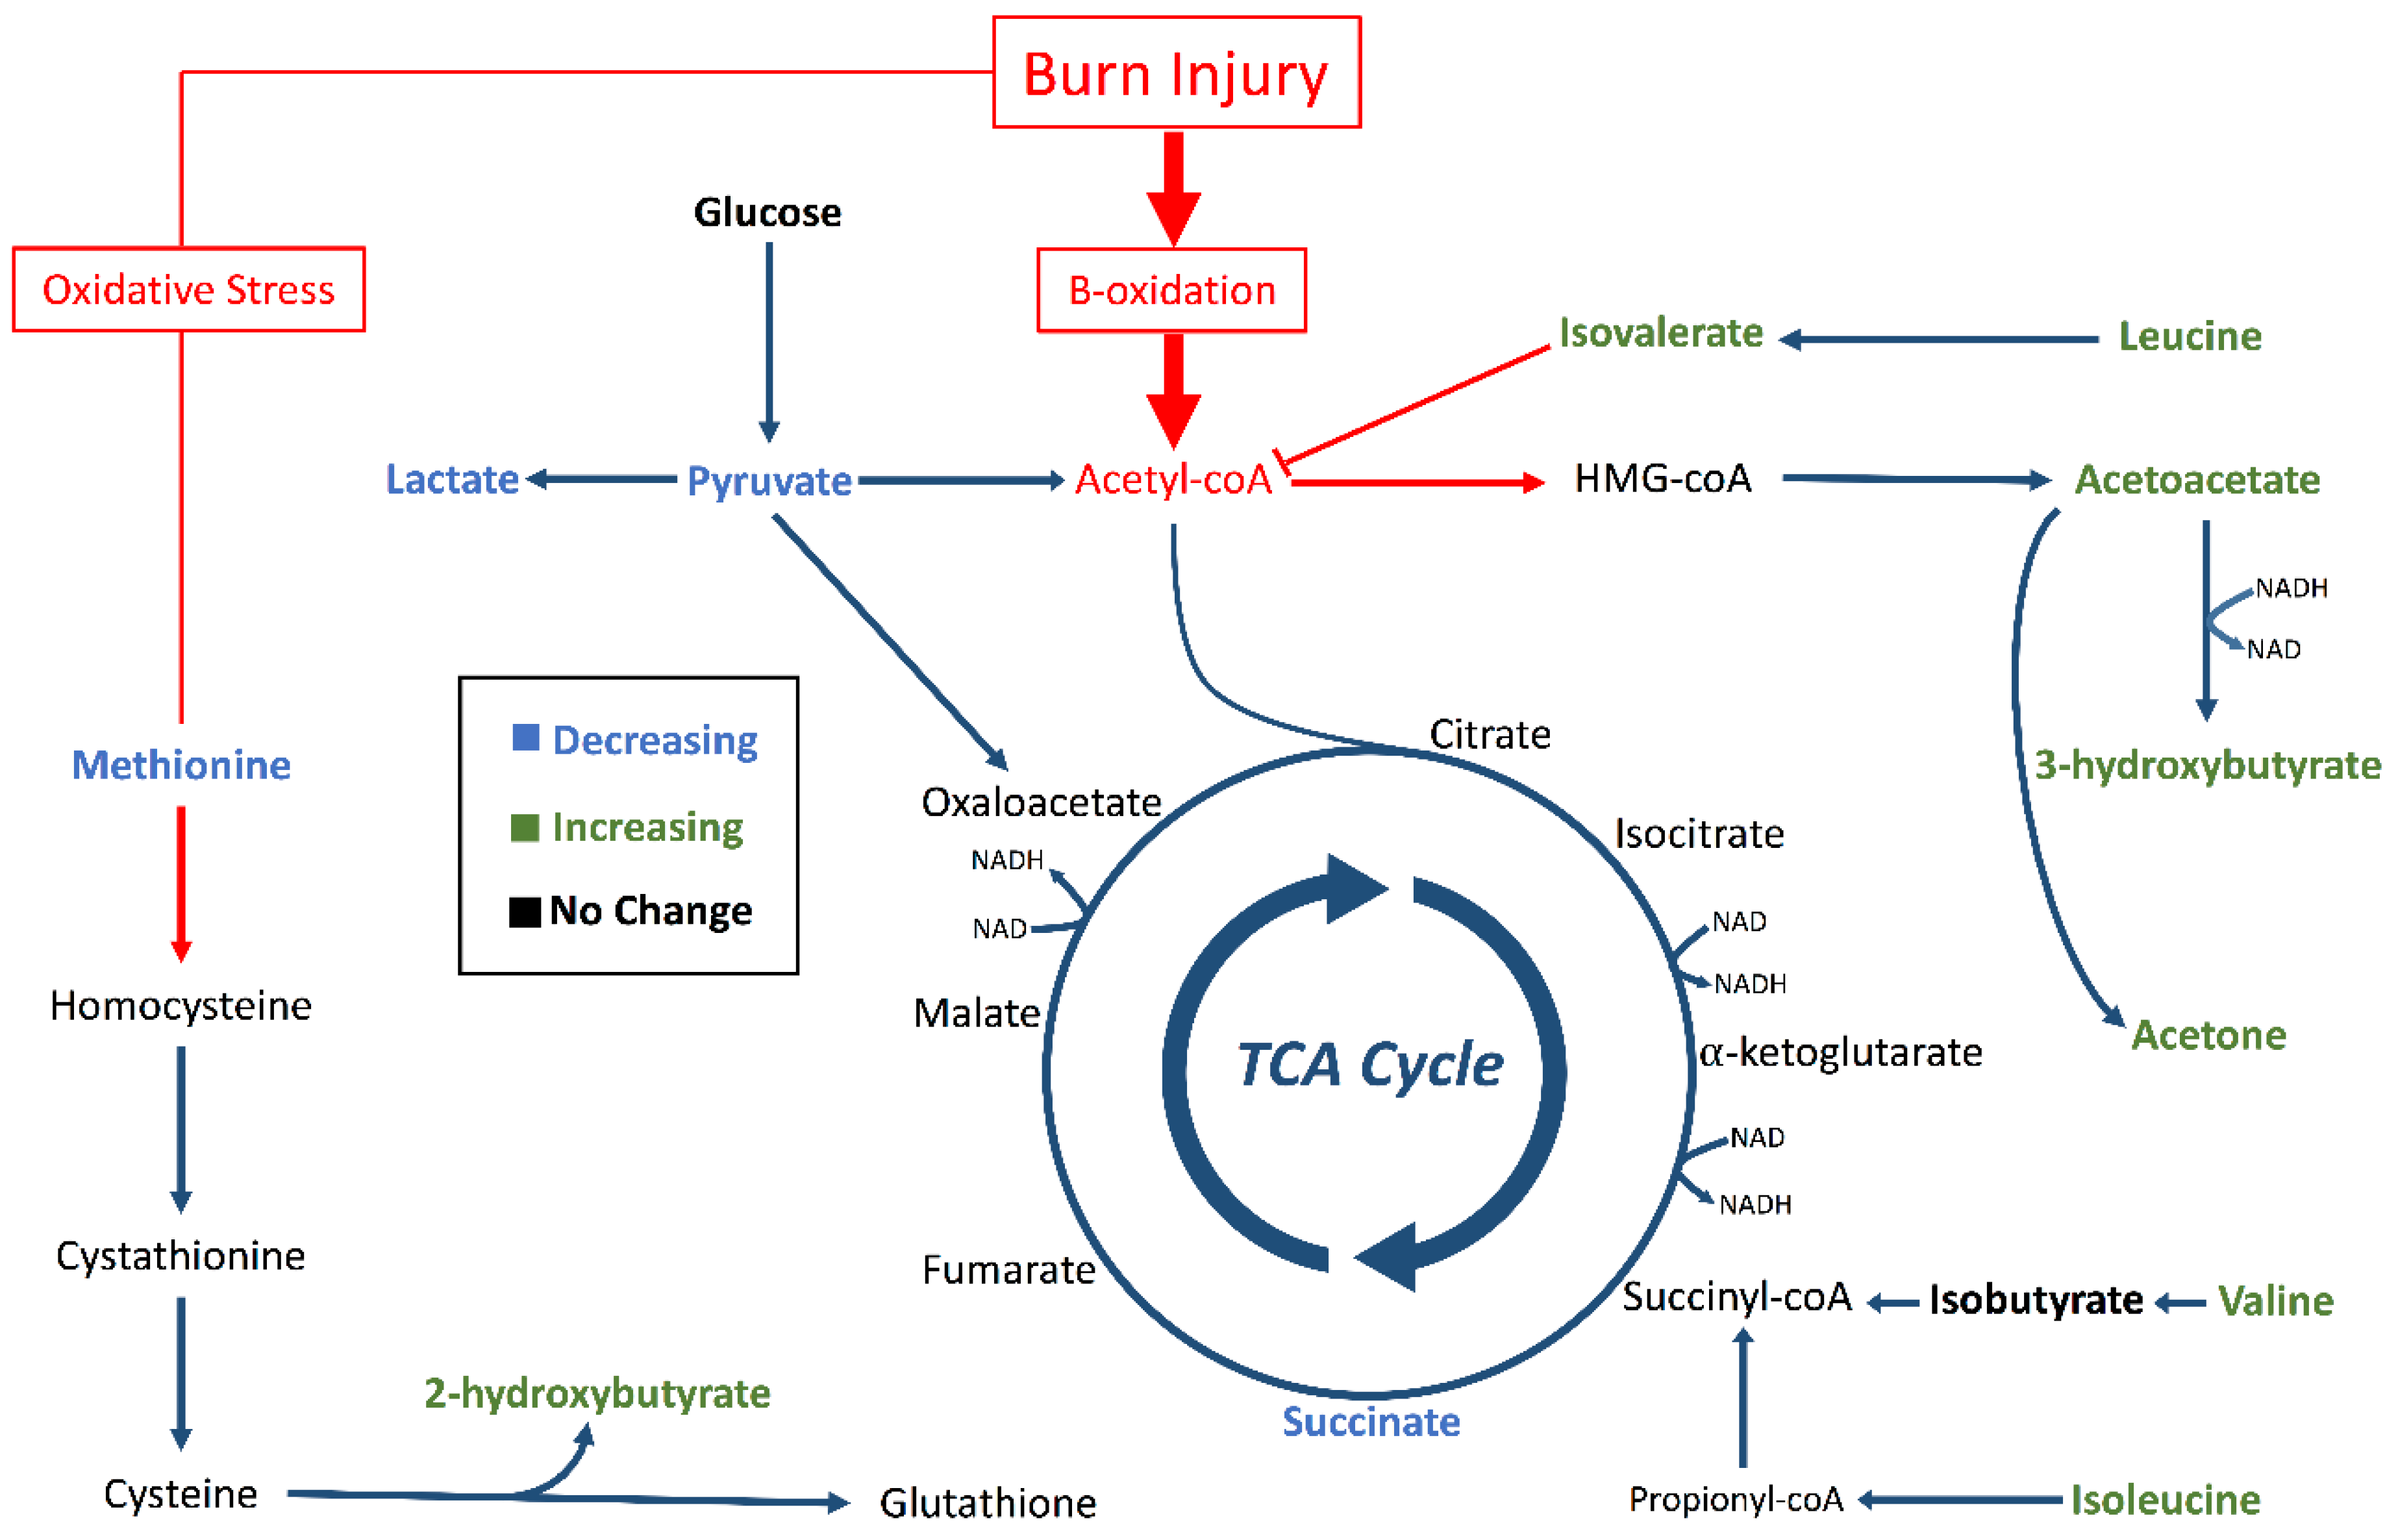
2. Results
3. Discussion
4. Materials and Methods
5. Conclusions
Supplementary Materials
Author Contributions
Funding
Acknowledgments
Conflicts of Interest
References
- Cuthbertson, D. Post-shock metabolic response. Lancet 1942, 239, 433–437. [Google Scholar] [CrossRef]
- Xiao, W.; Mindrinos, M.N.; Seok, J.; Cuschieri, J.; Cuenca, A.G.; Gao, H.; Hayden, D.L.; Hennessy, L.; Moore, E.E.; Minei, J.P. A genomic storm in critically injured humans. J. Exp. Med. 2011, 208, 2581–2590. [Google Scholar] [CrossRef] [PubMed]
- Wilmore, D.W.; Aulick, L.H. Metabolic changes in burned patients. Surg. Clin. N. Am. 1978, 58, 1173–1187. [Google Scholar] [CrossRef]
- Palmieri, T.L. Inhalation injury: Research progress and needs. J. Burn Care Res. 2007, 28, 549–554. [Google Scholar] [CrossRef] [PubMed]
- Foster, K.N.; Holmes IV, J.H. Inhalation injury: State of the science 2016. J. Burn Care Res. 2017, 38, 137–141. [Google Scholar] [CrossRef] [PubMed]
- Bathe, O.F.; Farshidfar, F. From genotype to functional phenotype: Unraveling the metabolomic features of colorectal cancer. Genes 2014, 5, 536–560. [Google Scholar] [CrossRef] [PubMed]
- Peltz, E.D.; D’Alessandro, A.; Moore, E.E.; Chin, T.; Silliman, C.C.; Sauaia, A.; Hansen, K.C.; Banerjee, A. Pathologic metabolism: An exploratory study of the plasma metabolome of critical injury. J. Trauma Acute Care Surg. 2015, 78, 742. [Google Scholar] [CrossRef]
- Cohen, M.J.; Serkova, N.J.; Wiener-Kronish, J.; Pittet, J.F.; Niemann, C.U. 1h-nmr-based metabolic signatures of clinical outcomes in trauma patients—beyond lactate and base deficit. J. Trauma Acute Care Surg. 2010, 69, 31–40. [Google Scholar] [CrossRef]
- Lusczek, E.R.; Muratore, S.L.; Dubick, M.A.; Beilman, G.J. Assessment of key plasma metabolites in combat casualties. J. Trauma Acute Care Surg. 2017, 82, 309–316. [Google Scholar] [CrossRef]
- Parent, B.A.; Seaton, M.; Sood, R.F.; Gu, H.; Djukovic, D.; Raftery, D.; O’Keefe, G.E. Use of metabolomics to trend recovery and therapy after injury in critically ill trauma patients. JAMA Surg. 2016, 151, e160853. [Google Scholar] [CrossRef]
- Yi, L.; Shi, S.; Wang, Y.; Huang, W.; Xia, Z.A.; Xing, Z.; Peng, W.; Wang, Z. Serum metabolic profiling reveals altered metabolic pathways in patients with post-traumatic cognitive impairments. Sci. Rep. 2016, 6, 21320. [Google Scholar] [CrossRef] [PubMed]
- Blaise, B.J.; Gouel-Chéron, A.l.; Floccard, B.; Monneret, G.; Allaouchiche, B. Metabolic phenotyping of traumatized patients reveals a susceptibility to sepsis. Anal. Chem. 2013, 85, 10850–10855. [Google Scholar] [CrossRef] [PubMed]
- Liu, X.R.; Zheng, X.F.; Ji, S.Z.; Lv, Y.H.; Zheng, D.Y.; Xia, Z.F.; Zhang, W.D. Metabolomic analysis of thermally injured and/or septic rats. Burns 2010, 36, 992–998. [Google Scholar] [CrossRef] [PubMed]
- Zhang, Y.; Cai, B.; Jiang, H.; Yan, H.; Yang, H.; Peng, J.; Wang, W.; Ma, S.; Wu, X.; Peng, X. Use of 1 h-nuclear magnetic resonance to screen a set of biomarkers for monitoring metabolic disturbances in severe burn patients. Crit. Care 2014, 18, R159. [Google Scholar] [CrossRef] [PubMed]
- Linden, K.; Scaravilli, V.; Kreyer, S.F.; Belenkiy, S.M.; Stewart, I.J.; Chung, K.K.; Cancio, L.C.; Batchinsky, A.I. Evaluation of the cytosorb™ hemoadsorptive column in a pig model of severe smoke and burn injury. Shock 2015, 44, 487–495. [Google Scholar] [CrossRef] [PubMed]
- Friedl, H.; Till, G.; Trentz, O.; Ward, P. Roles of histamine, complement and xanthine oxidase in thermal injury of skin. Am. J. Pathol. 1989, 135, 203. [Google Scholar] [PubMed]
- Strudwick, X.L.; Cowin, A.J. The role of the inflammatory response in burn injury. In Hot Topics in Burn Injuries; IntechOpen: London, UK, 2017. [Google Scholar]
- Chang, X.J.; Yang, C.C.; Hsu, W.S.; Xu, W.Z.; Shih, T.S. Serum and erythrocyte amino acid pattern: Studies on major burn cases. Burns 1983, 9, 240–248. [Google Scholar] [CrossRef]
- Davies, J.; Fell, G. Tissue catabolism in patients with burns. Clin. Chim. Acta 1974, 51, 83–92. [Google Scholar] [CrossRef]
- Snell, K. Alanine as a gluconeogenic carrier. Trends Biochem. Sci. 1979, 4, 124–128. [Google Scholar] [CrossRef]
- Demling, R.H.; Seigne, P. Metabolic management of patients with severe burns. World J. Surg. 2000, 24, 673–680. [Google Scholar] [CrossRef]
- Wilmore, D.W.; Long, J.M.; Mason, A.D., Jr.; Skreen, R.W.; Pruitt, B.A., Jr. Catecholamines: Mediator of the hypermetabolic response to thermal injury. Ann. Surg. 1974, 180, 653. [Google Scholar] [CrossRef]
- Herndon, D.N.; Wilmore, D.W.; Mason, A.D.; Pruitt, B.A. Abnormalities of phenylalanine and tyrosine kinetics: Significance in septic and nonseptic burned patients. Arch. Surg. 1978, 113, 133–135. [Google Scholar] [CrossRef]
- Mulier, K.E.; Lexcen, D.R.; Luzcek, E.; Greenberg, J.J.; Beilman, G.J. Treatment with beta-hydroxybutyrate and melatonin is associated with improved survival in a porcine model of hemorrhagic shock. Resuscitation 2012, 83, 253–258. [Google Scholar] [CrossRef]
- Dash, P.K.; Hergenroeder, G.W.; Jeter, C.B.; Choi, H.A.; Kobori, N.; Moore, A.N. Traumatic brain injury alters methionine metabolism: Implications for pathophysiology. Front. Syst. Neurosci. 2016, 10, 36. [Google Scholar] [CrossRef]
- Tang, H.J.; Li, W.; Zhou, M.; Peng, L.Y.; Wang, J.X.; Li, J.H.; Chen, J. Design, synthesis and biological evaluation of novel xanthine oxidase inhibitors bearing a 2-arylbenzo [b] furan scaffold. Eur. J. Med. Chem. 2018, 151, 849–860. [Google Scholar] [CrossRef]
- Jacob, S.; Herndon, D.N.; Hawkins, H.K.; Enkhbaatar, P.; Cox, R.A. Xanthine oxidase contributes to sustained airway epithelial oxidative stress after scald burn. Int. J. Burn. Trauma 2017, 7, 98. [Google Scholar]
- Budd, M.A.; Tanaka, K.; Holmes, L.B.; Efron, M.L.; Crawford, J.D.; Isselbacher, K.J. Isovaleric acidemia: Clinical features of a new genetic defect of leucine metabolism. N. Engl. J. Med. 1967, 277, 321–327. [Google Scholar] [CrossRef]
- Harper, A.; Miller, R.; Block, K. Branched-chain amino acid metabolism. Annu. Rev. Nutr. 1984, 4, 409–454. [Google Scholar] [CrossRef]
- Usher-Smith, J.A.; Thompson, M.J.; Sharp, S.J.; Walter, F.M. Factors associated with the presence of diabetic ketoacidosis at diagnosis of diabetes in children and young adults: A systematic review. BMJ 2011, 343, d4092. [Google Scholar] [CrossRef]
- Mostert, M.; Bonavia, A. Starvation ketoacidosis as a cause of unexplained metabolic acidosis in the perioperative period. Am. J. Case Rep. 2016, 17, 755. [Google Scholar] [CrossRef]
- Abbott, W.; Schiller, W.; Long, C.; Birkhahn, R.; Blakemore, W. The effect of major thermal injury on plasma ketone body levels. J. Parenter. Enter. Nutr. 1985, 9, 153–158. [Google Scholar] [CrossRef]
- Bowman, C.E.; Rodriguez, S.; Alpergin, E.S.S.; Acoba, M.G.; Zhao, L.; Hartung, T.; Claypool, S.M.; Watkins, P.A.; Wolfgang, M.J. The mammalian malonyl-coa synthetase acsf3 is required for mitochondrial protein malonylation and metabolic efficiency. Cell Chem. Biol. 2017, 24, 673–684. [Google Scholar] [CrossRef]
- Herndon, D.N.; Tompkins, R.G. Support of the metabolic response to burn injury. Lancet 2004, 363, 1895–1902. [Google Scholar] [CrossRef]
- Jeschke, M.G.; Chinkes, D.L.; Finnerty, C.C.; Kulp, G.; Suman, O.E.; Norbury, W.B.; Branski, L.K.; Gauglitz, G.G.; Mlcak, R.P.; Herndon, D.N. The pathophysiologic response to severe burn injury. Ann. Surg. 2008, 248, 387. [Google Scholar] [CrossRef]
- Jeschke, M.G. The hepatic response to thermal injury: Is the liver important for postburn outcomes? Mol. Med. 2009, 15, 337–351. [Google Scholar] [CrossRef]
- Hart, D.; Wolf, S.; Mlcak, R.; Chinkes, D.; Ramzy, P.; Obeng, M.; Ferrando, A.; Wolfe, R.; Herndon, D. Persistence of muscle catabolism after severe burn. Surgery 2000, 128, 312–319. [Google Scholar] [CrossRef]
- Yamaguchi, Y.; Yu, Y.M.; Zupke, C.; Yarmush, D.M.; Berthiaume, F.; Tompkins, R.G.; Yarmush, M.L. Effect of burn injury on glucose and nitrogen metabolism in the liver: Preliminary studies in a perfused liver system. Surgery 1997, 121, 295–303. [Google Scholar] [CrossRef]
- National Research Council. Guide for the Care and Use of Laboratory Animals; National Academies Press: Washington, DC, USA, 2010. [Google Scholar]
- Leary, S.L.; Underwood, W.; Anthony, R.; Cartner, S.; Corey, D.; Grandin, T.; Greenacre, C.; Gwaltney-Bran, S.; McCrackin, M.; Meyer, R. Avma Guidelines for the Euthanasia of Animals: 2013 Edition; American Veterinary Medical Association: Schaumburg, IL, USA, 2013. [Google Scholar]
- Salinas, J.; Chung, K.K.; Mann, E.A.; Cancio, L.C.; Kramer, G.C.; Serio-Melvin, M.L.; Renz, E.M.; Wade, C.E.; Wolf, S.E. Computerized decision support system improves fluid resuscitation following severe burns: An original study. Crit. Care Med. 2011, 39, 2031–2038. [Google Scholar] [CrossRef]
- Weljie, A.M.; Newton, J.; Mercier, P.; Carlson, E.; Slupsky, C.M. Targeted profiling: Quantitative analysis of 1h nmr metabolomics data. Anal.Chem. 2006, 78, 4430–4442. [Google Scholar] [CrossRef]
- R Development Core Team. R: A Language and Environment for Statistical Computing. Available online: http://www.R-project.org/ (Computer Program) (accessed on 12 June 2019).
- Lê, S.; Josse, J.; Husson, F. Factominer: An r package for multivariate analysis. J. Stat. Softw. 2008, 25, 1–18. [Google Scholar] [CrossRef]
- Kassambara, A. Practical Guide to Principal Component Methods in r: Pca, m (ca), Famd, Mfa, Hcpc, Factoextra; STHDA: Marseille, France, 2017; Volume 2. [Google Scholar]


| Treatment Group | Weight (kg) | Smoke Breaths | Peak COHb (%) | Survival (h after Injury) |
|---|---|---|---|---|
| Hemoadsorbtion (n = 9) | 41.3 ± 1.6 | 22 ± 0.4 | 85.3 ± 2.0 | 31.3 ± 6.5 |
| Sham (n = 6) | 38.8 ± 1.1 | 21 ± 0.6 | 86.0 ± 3.8 | 57.3 ± 3.4 |
| p-value | 0.26 | 0.14 | 0.86 | 0.054 |
| Metabolite | 0 h Mean (n = 15) | 0 h SE | 24 h Mean (n = 11) | 24 h SE | 48 h Mean (n = 8) | 48 h SE | 72 h Mean (n = 5) | 72 h SE |
|---|---|---|---|---|---|---|---|---|
| 2-Hydroxybutyrate | 14.0 | 0.7 | 22.3 | 2.1 | 27.3 | 2.9 | 34.1 | 5.9 |
| 3-Hydroxybutyrate | 3.2 | 0.7 | 4.5 | 0.4 | 9.1 | 2.5 | 8.0 | 2.0 |
| Acetate | 23.3 | 1.8 | 11.2 | 1.3 | 8.1 | 1.0 | 7.1 | 1.3 |
| Acetoacetate | 2.8 | 0.7 | 4.5 | 0.8 | 4.6 | 0.8 | 7.0 | 1.9 |
| Acetone | 2.2 | 0.3 | 8.7 | 5.8 | 17.1 | 2.4 | 24.0 | 8.2 |
| Alanine | 65.9 | 4.3 | 77.5 | 7.2 | 43.8 | 1.3 | 33.8 | 6.3 |
| Betaine | 44.7 | 3.5 | 31.3 | 4.9 | 10.5 | 1.3 | 4.1 | 1.1 |
| Carnitine | 1.7 | 0.3 | 4.0 | 0.6 | 4.3 | 1.3 | 2.0 | 0.5 |
| Choline | 2.3 | 0.3 | 1.8 | 0.3 | 2.3 | 0.5 | 2.0 | 0.3 |
| Creatine | 25.0 | 5.1 | 151.9 | 18.0 | 133.0 | 25.6 | 67.2 | 8.7 |
| Creatine phosphate | 5.3 | 0.6 | 9.0 | 1.0 | 10.8 | 3.8 | 7.6 | 1.5 |
| Creatinine | 14.9 | 0.9 | 19.8 | 2.2 | 20.0 | 5.5 | 10.4 | 1.4 |
| Glucose | 697.4 | 45.3 | 669.2 | 43.8 | 653.4 | 63.9 | 514.7 | 55.9 |
| Glutamate | 23.9 | 2.0 | 22.4 | 2.2 | 20.1 | 3.2 | 15.3 | 1.3 |
| Glutamine | 38.0 | 4.0 | 33.1 | 3.4 | 26.6 | 5.1 | 16.5 | 1.5 |
| Glycine | 140.7 | 10.2 | 78.2 | 9.0 | 43.1 | 5.3 | 36.5 | 8.4 |
| Histamine | 12.3 | 0.7 | 19.0 | 1.3 | 15.8 | 3.0 | 9.8 | 1.0 |
| Hypoxanthine | 3.6 | 0.3 | 4.8 | 0.4 | 6.0 | 0.6 | 4.5 | 0.8 |
| Isobutyrate | 1.9 | 0.1 | 2.4 | 0.2 | 2.0 | 0.2 | 1.7 | 0.1 |
| Isoleucine | 14.2 | 0.7 | 23.8 | 2.4 | 27.5 | 3.0 | 35.5 | 6.2 |
| Isovalerate | 2.0 | 0.3 | 3.9 | 0.4 | 5.3 | 0.8 | 5.3 | 1.0 |
| Lactate | 458.1 | 35.6 | 285.4 | 31.7 | 187.3 | 35.2 | 139.8 | 9.7 |
| Leucine | 21.4 | 1.5 | 31.4 | 3.2 | 21.2 | 2.5 | 20.2 | 5.8 |
| Lysine | 10.3 | 1.1 | 17.8 | 1.8 | 20.2 | 2.5 | 17.0 | 4.9 |
| Malonate | 11.4 | 0.9 | 14.6 | 1.8 | 7.0 | 0.8 | 4.0 | 1.2 |
| Mannose | 5.5 | 0.6 | 9.8 | 0.9 | 9.2 | 0.8 | 10.4 | 1.2 |
| Methionine | 6.1 | 1.0 | 7.1 | 0.6 | 3.5 | 0.5 | 3.9 | 1.3 |
| N-Acetylglucosamine | 2.2 | 0.6 | 4.4 | 0.8 | 7.0 | 1.4 | 8.8 | 2.8 |
| O-Phosphocholine | 1.9 | 0.2 | 1.4 | 0.2 | 1.0 | 0.1 | 0.6 | 0.1 |
| Phenylalanine | 18.5 | 1.3 | 34.1 | 2.6 | 34.0 | 5.4 | 29.8 | 7.4 |
| Proline | 16.3 | 2.9 | 19.6 | 3.2 | 11.2 | 1.8 | 10.0 | 2.3 |
| Propylene glycol | 6.7 | 1.8 | 9.6 | 3.0 | 18.7 | 4.0 | 27.0 | 9.5 |
| Pyruvate | 21.3 | 2.2 | 16.9 | 2.1 | 10.0 | 0.8 | 8.2 | 0.9 |
| Succinate | 2.8 | 0.3 | 1.9 | 0.2 | 1.4 | 0.1 | 1.2 | 0.1 |
| Threonine | 17.2 | 1.4 | 21.5 | 2.8 | 19.6 | 1.8 | 14.7 | 2.6 |
| Trimethylamine-N-oxide | 4.7 | 1.4 | 5.4 | 1.4 | 5.5 | 1.4 | 5.3 | 1.8 |
| Tyrosine | 10.7 | 0.5 | 20.3 | 1.6 | 13.9 | 1.2 | 13.7 | 2.5 |
| Valine | 35.6 | 1.6 | 59.1 | 4.9 | 49.3 | 5.3 | 57.5 | 12.6 |
© 2019 by the authors. Licensee MDPI, Basel, Switzerland. This article is an open access article distributed under the terms and conditions of the Creative Commons Attribution (CC BY) license (http://creativecommons.org/licenses/by/4.0/).
Share and Cite
Hendrickson, C.; Linden, K.; Kreyer, S.; Beilman, G.; Scaravilli, V.; Wendorff, D.; Necsoiu, C.; Batchinsky, A.I.; Cancio, L.C.; Chung, K.K.; et al. 1H-NMR Metabolomics Identifies Significant Changes in Metabolism over Time in a Porcine Model of Severe Burn and Smoke Inhalation. Metabolites 2019, 9, 142. https://doi.org/10.3390/metabo9070142
Hendrickson C, Linden K, Kreyer S, Beilman G, Scaravilli V, Wendorff D, Necsoiu C, Batchinsky AI, Cancio LC, Chung KK, et al. 1H-NMR Metabolomics Identifies Significant Changes in Metabolism over Time in a Porcine Model of Severe Burn and Smoke Inhalation. Metabolites. 2019; 9(7):142. https://doi.org/10.3390/metabo9070142
Chicago/Turabian StyleHendrickson, Cole, Katharina Linden, Stefan Kreyer, Gregory Beilman, Vittorio Scaravilli, Daniel Wendorff, Corina Necsoiu, Andriy I. Batchinsky, Leopoldo C. Cancio, Kevin K. Chung, and et al. 2019. "1H-NMR Metabolomics Identifies Significant Changes in Metabolism over Time in a Porcine Model of Severe Burn and Smoke Inhalation" Metabolites 9, no. 7: 142. https://doi.org/10.3390/metabo9070142
APA StyleHendrickson, C., Linden, K., Kreyer, S., Beilman, G., Scaravilli, V., Wendorff, D., Necsoiu, C., Batchinsky, A. I., Cancio, L. C., Chung, K. K., & Lusczek, E. R. (2019). 1H-NMR Metabolomics Identifies Significant Changes in Metabolism over Time in a Porcine Model of Severe Burn and Smoke Inhalation. Metabolites, 9(7), 142. https://doi.org/10.3390/metabo9070142