The Effect of Pre-Analytical Conditions on Blood Metabolomics in Epidemiological Studies

 , , ,
, , ,
Abstract
1. Introduction
2. Results
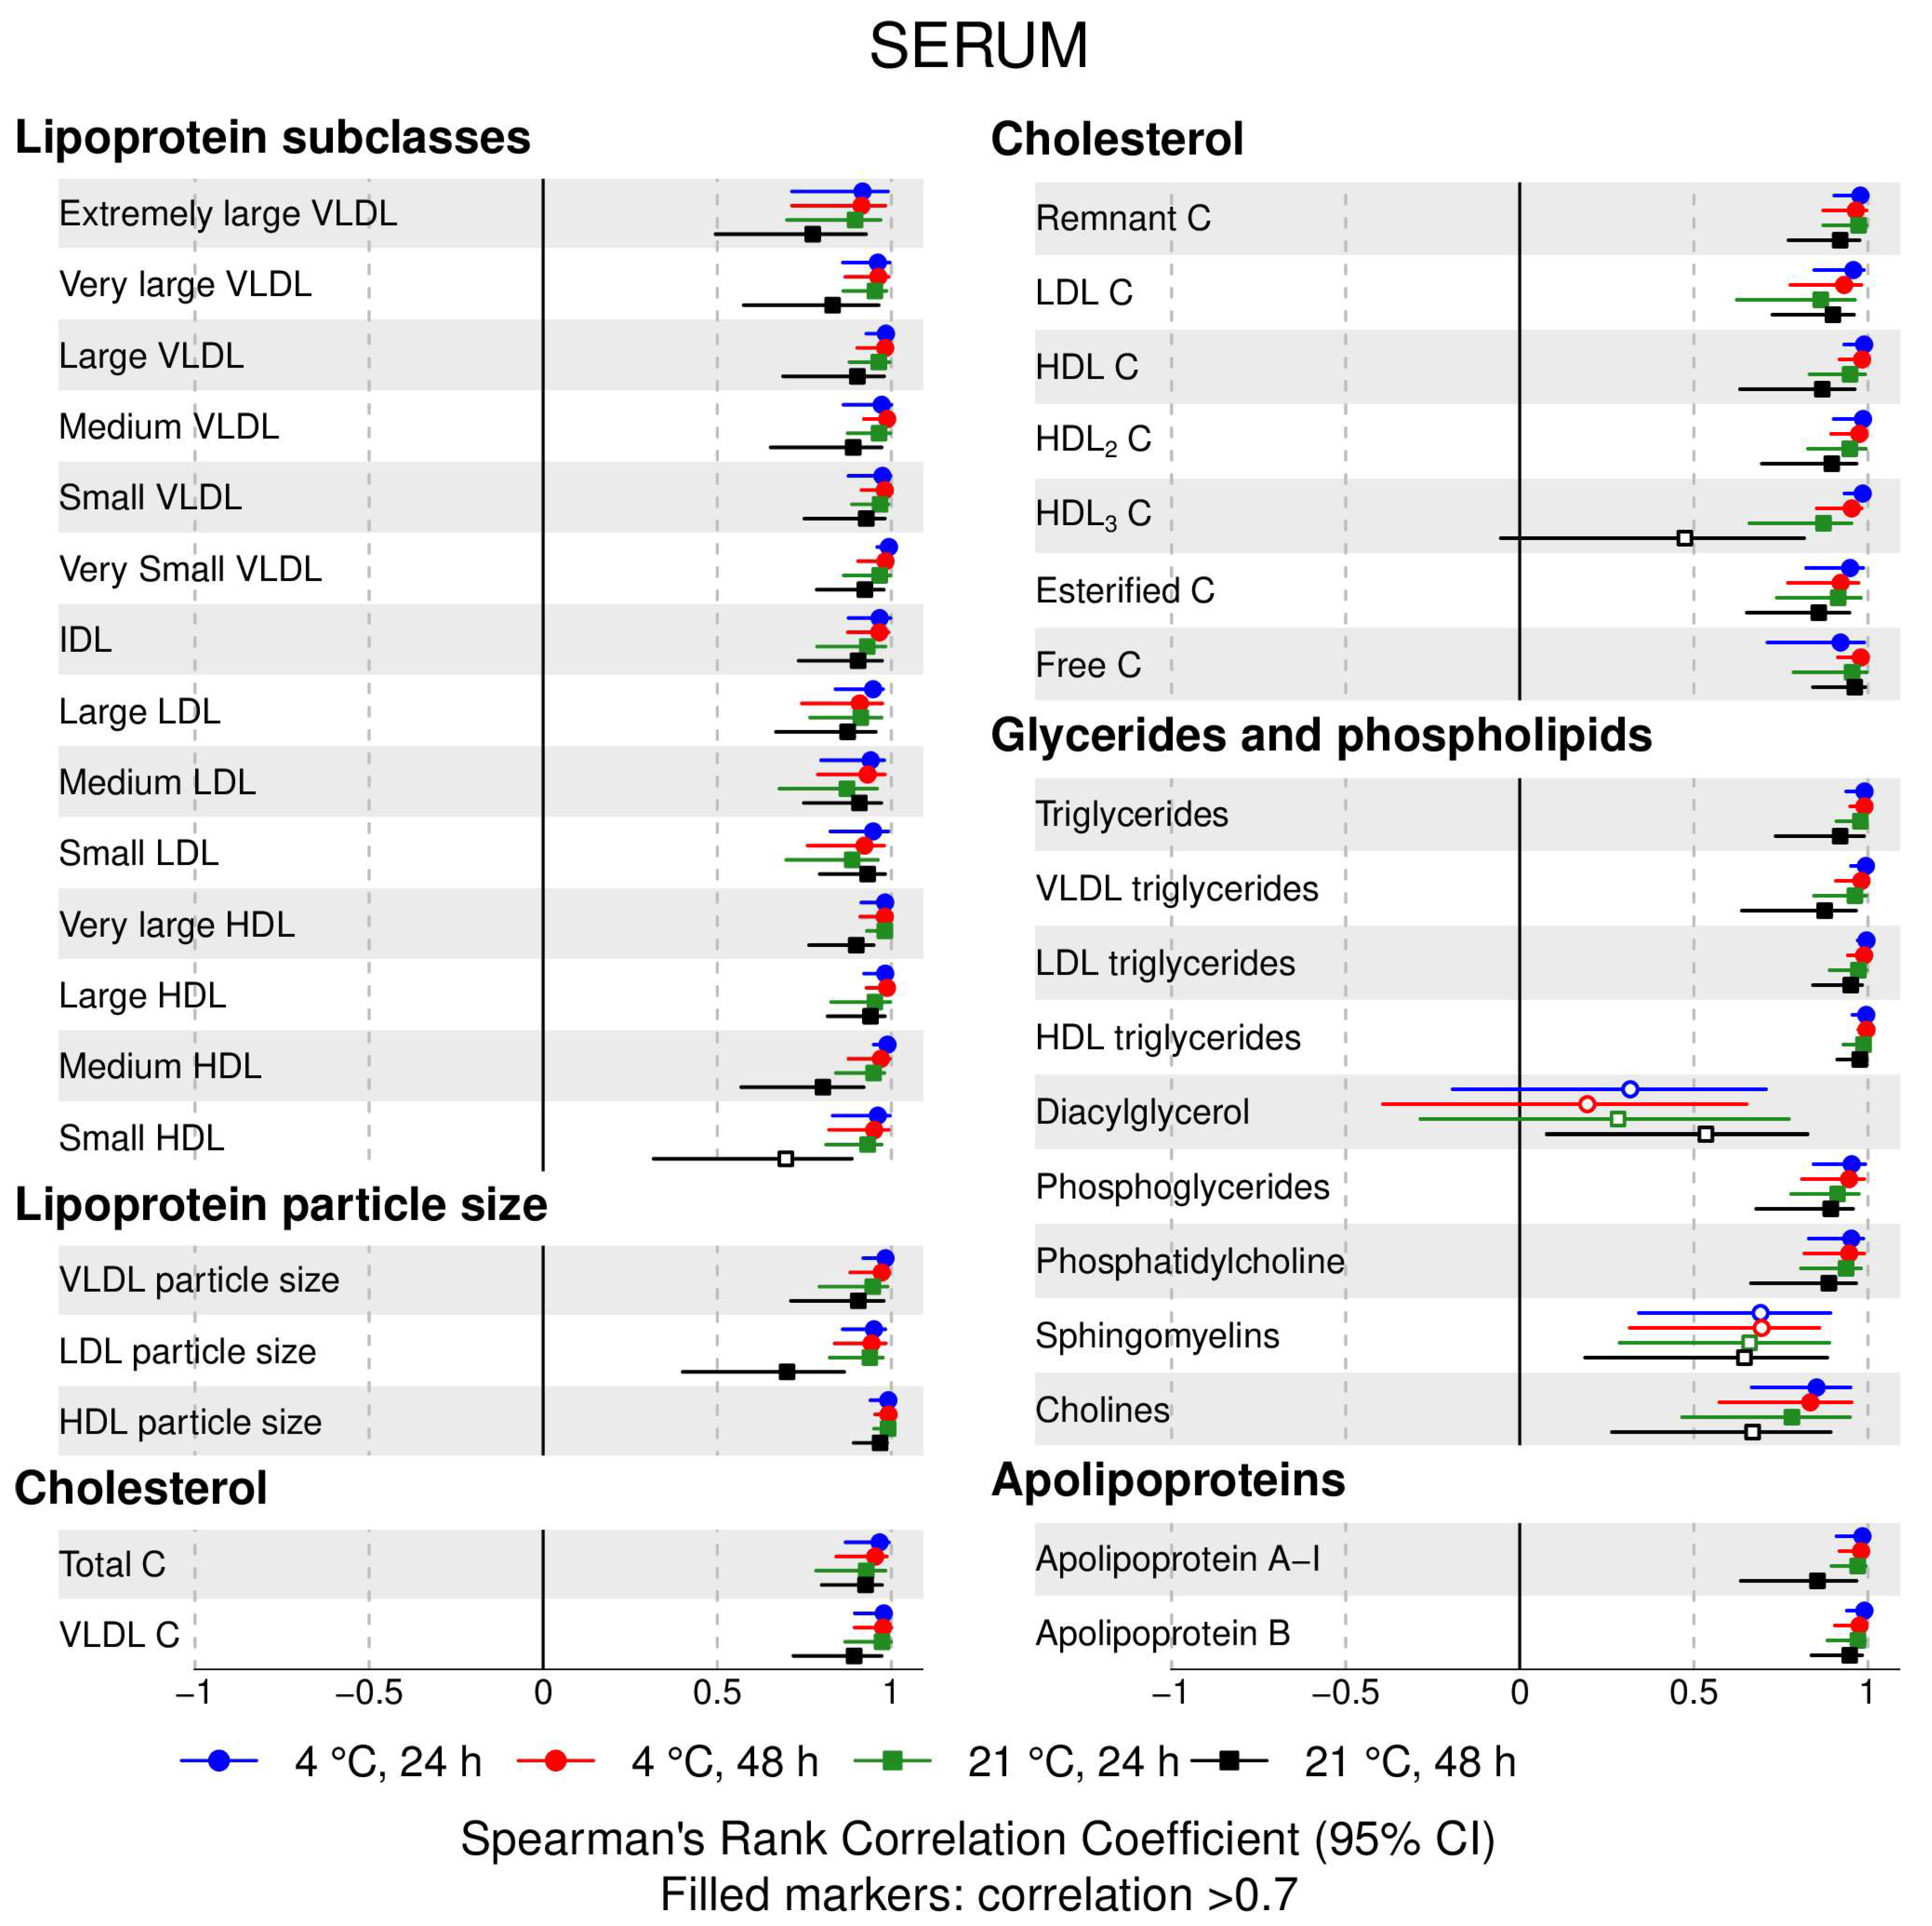
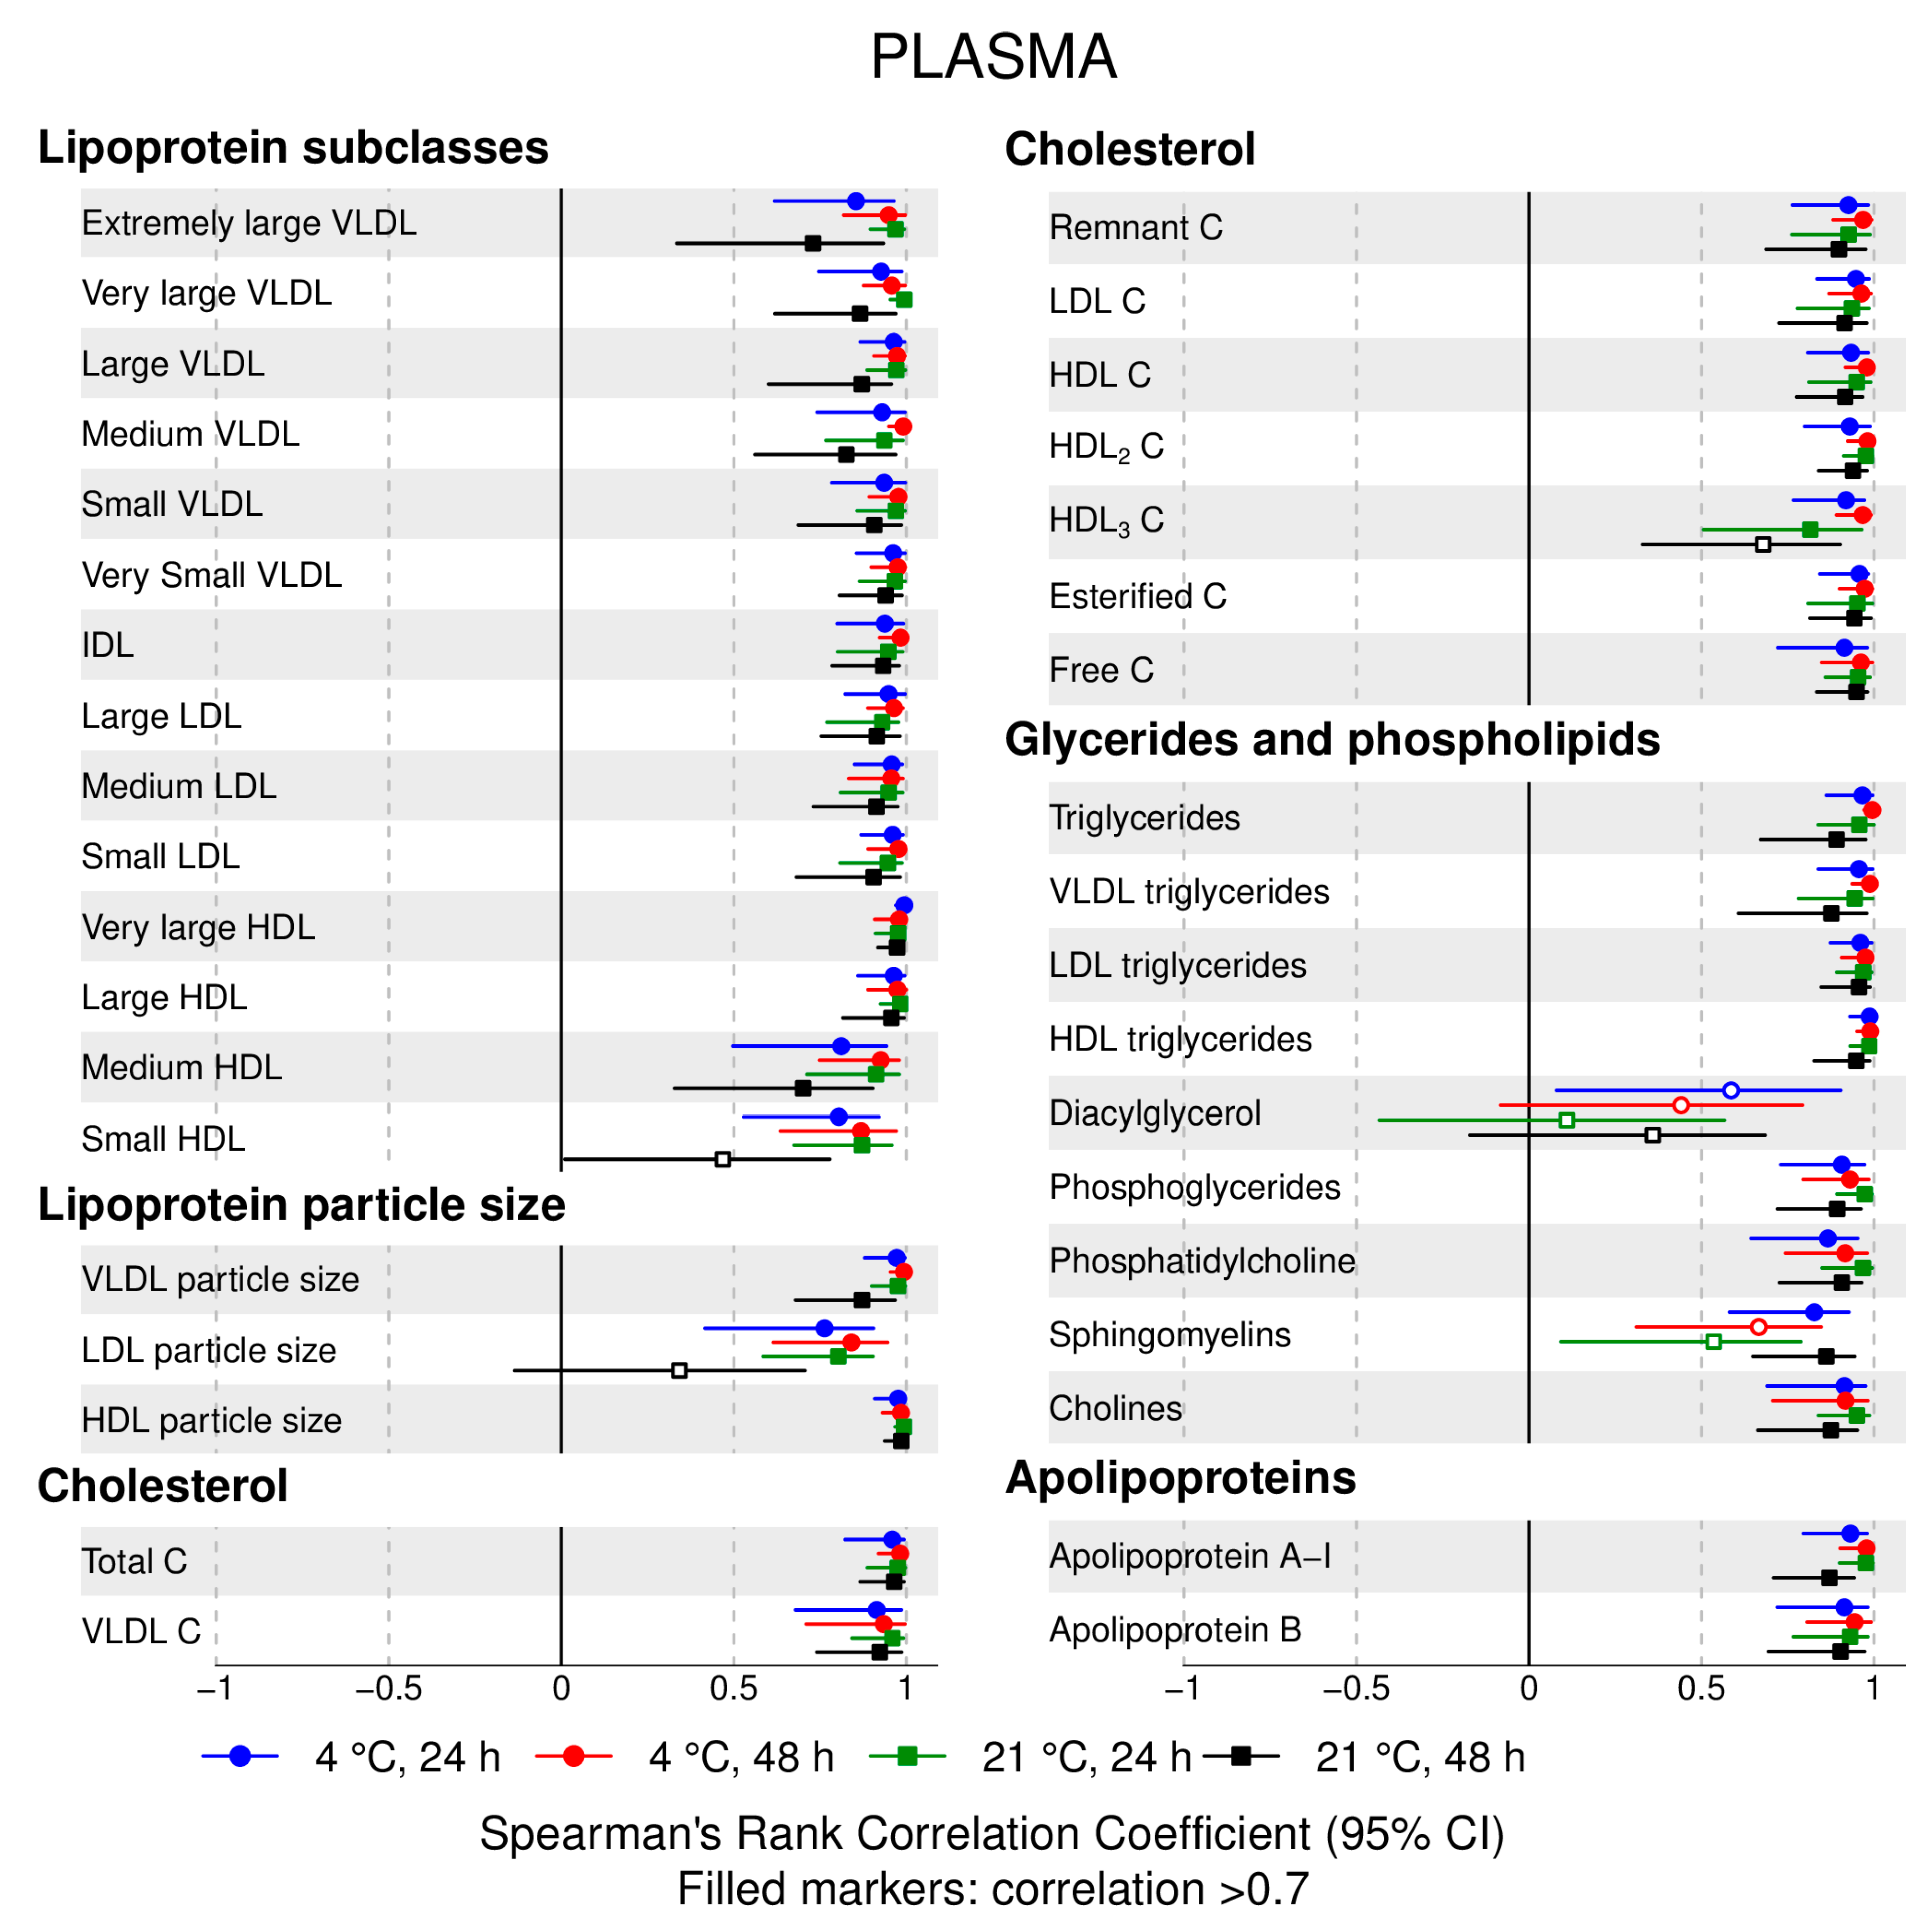
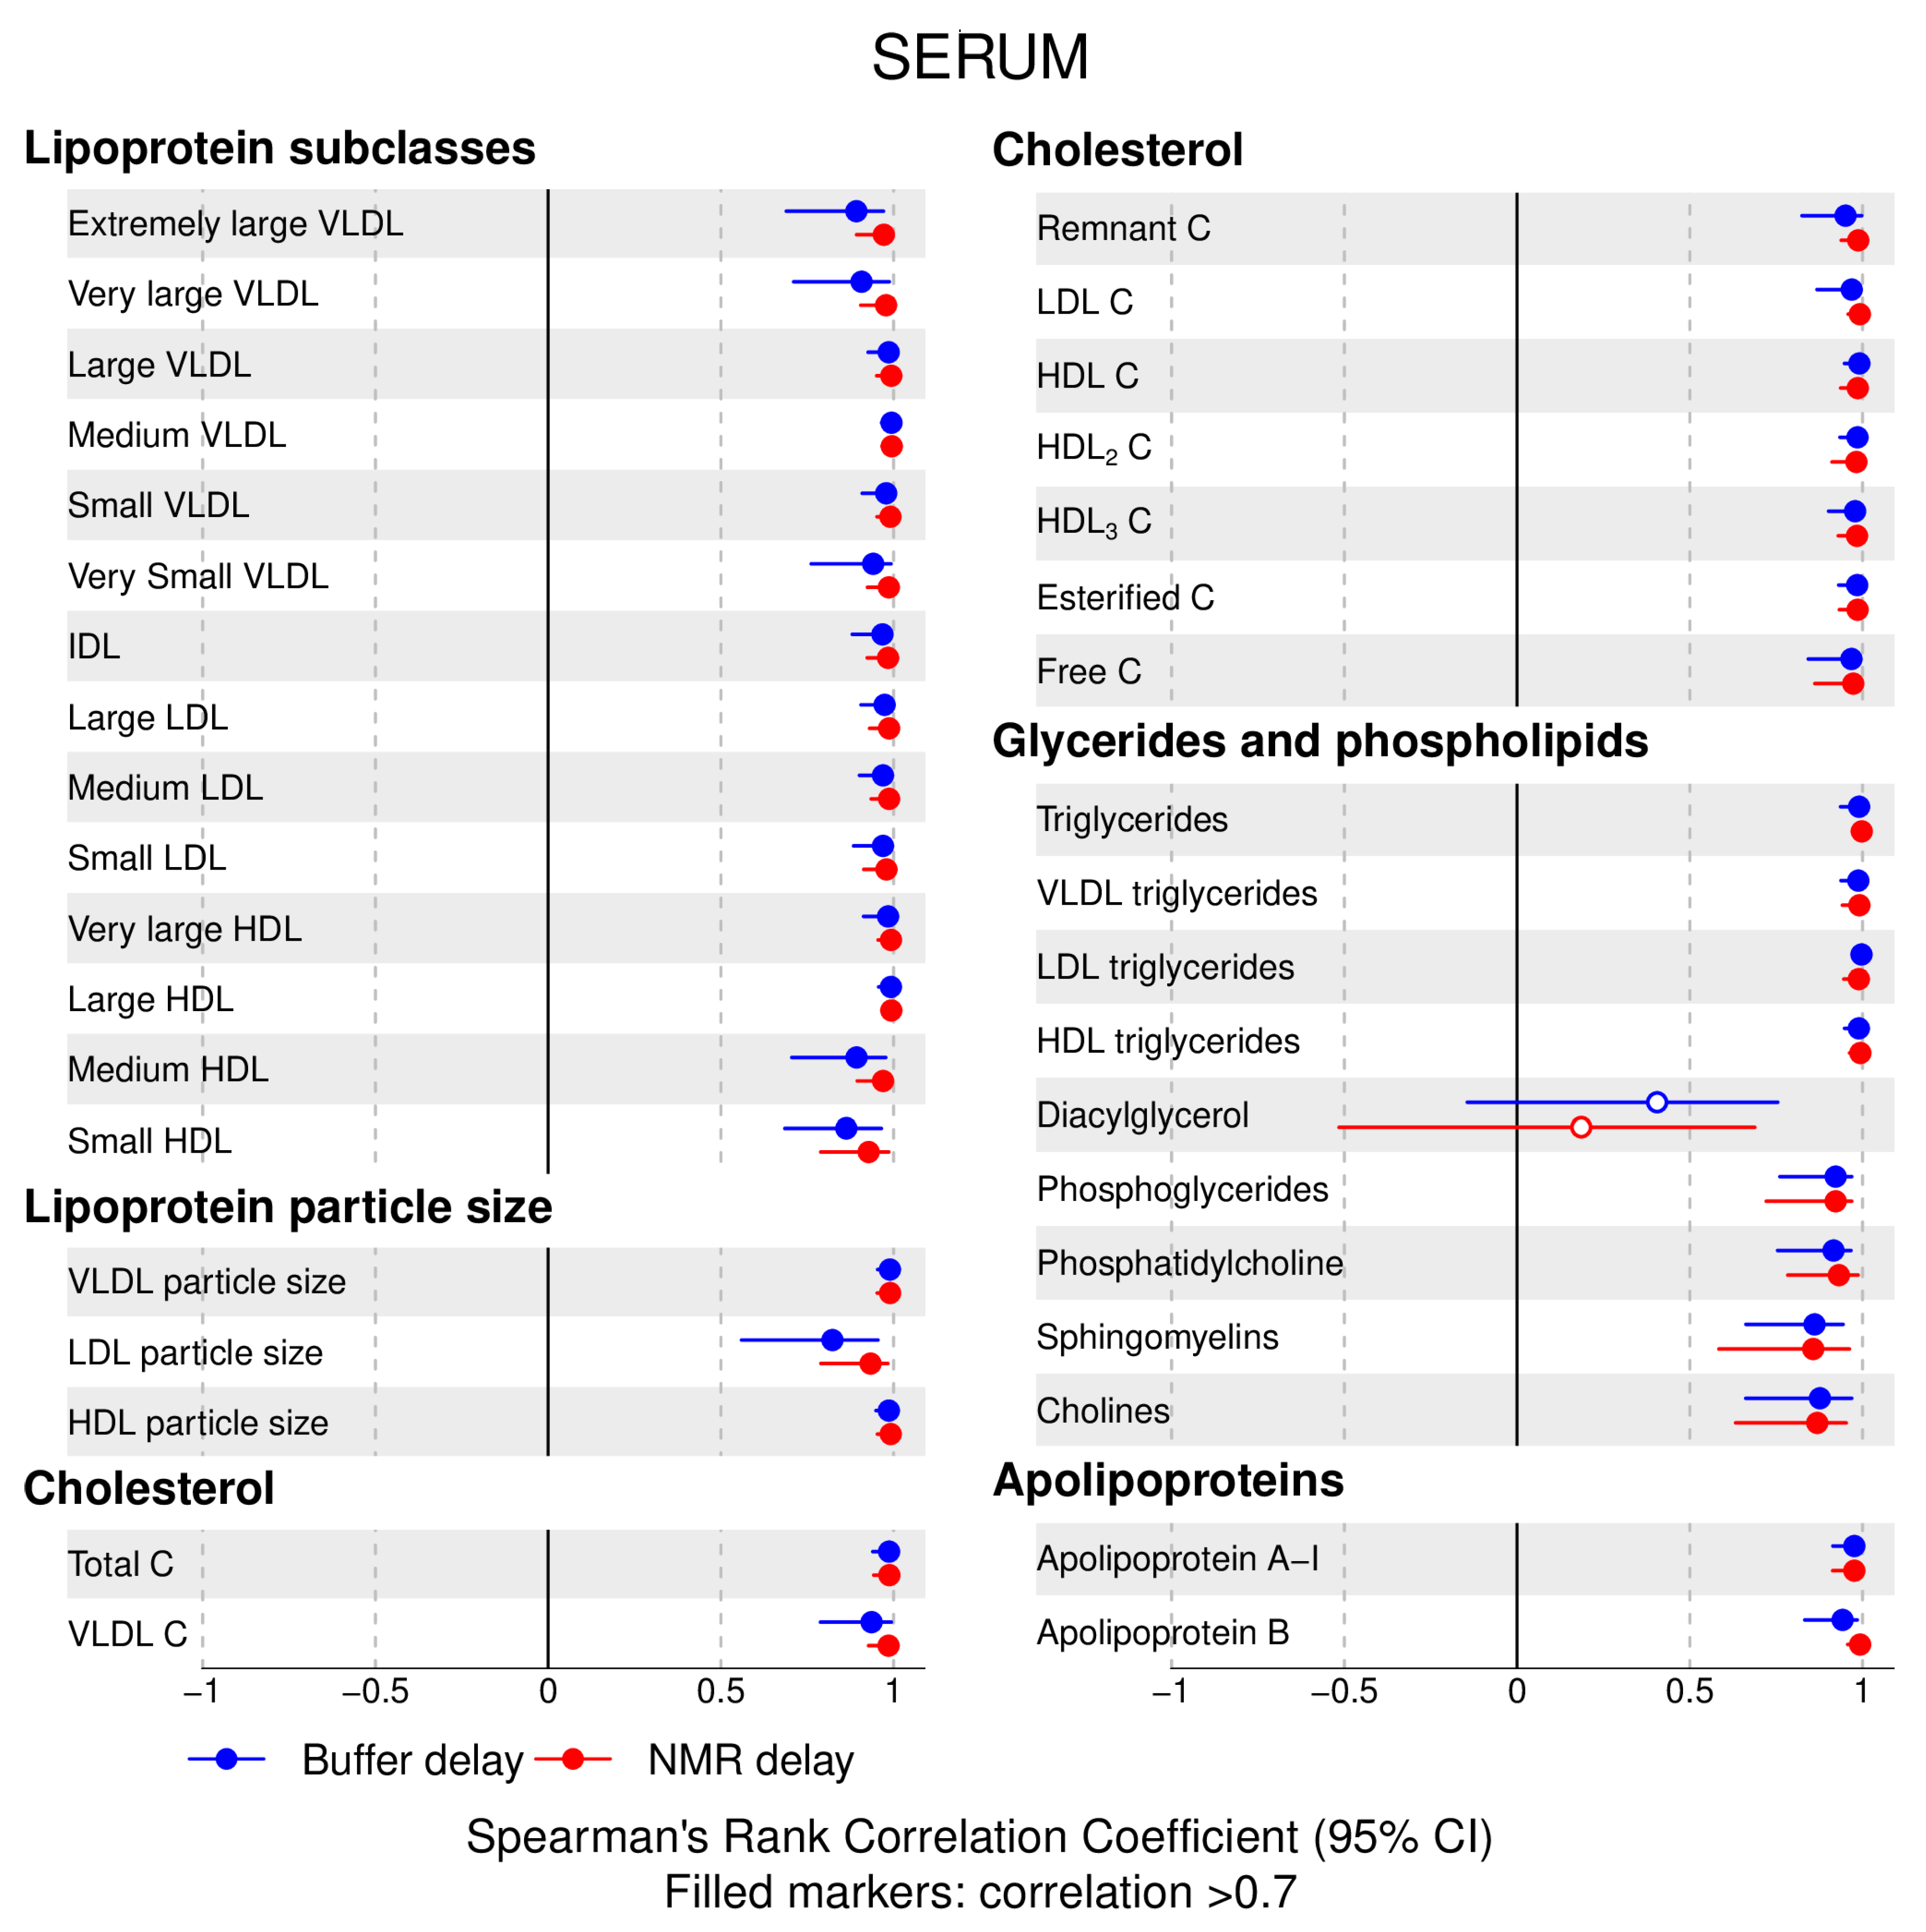
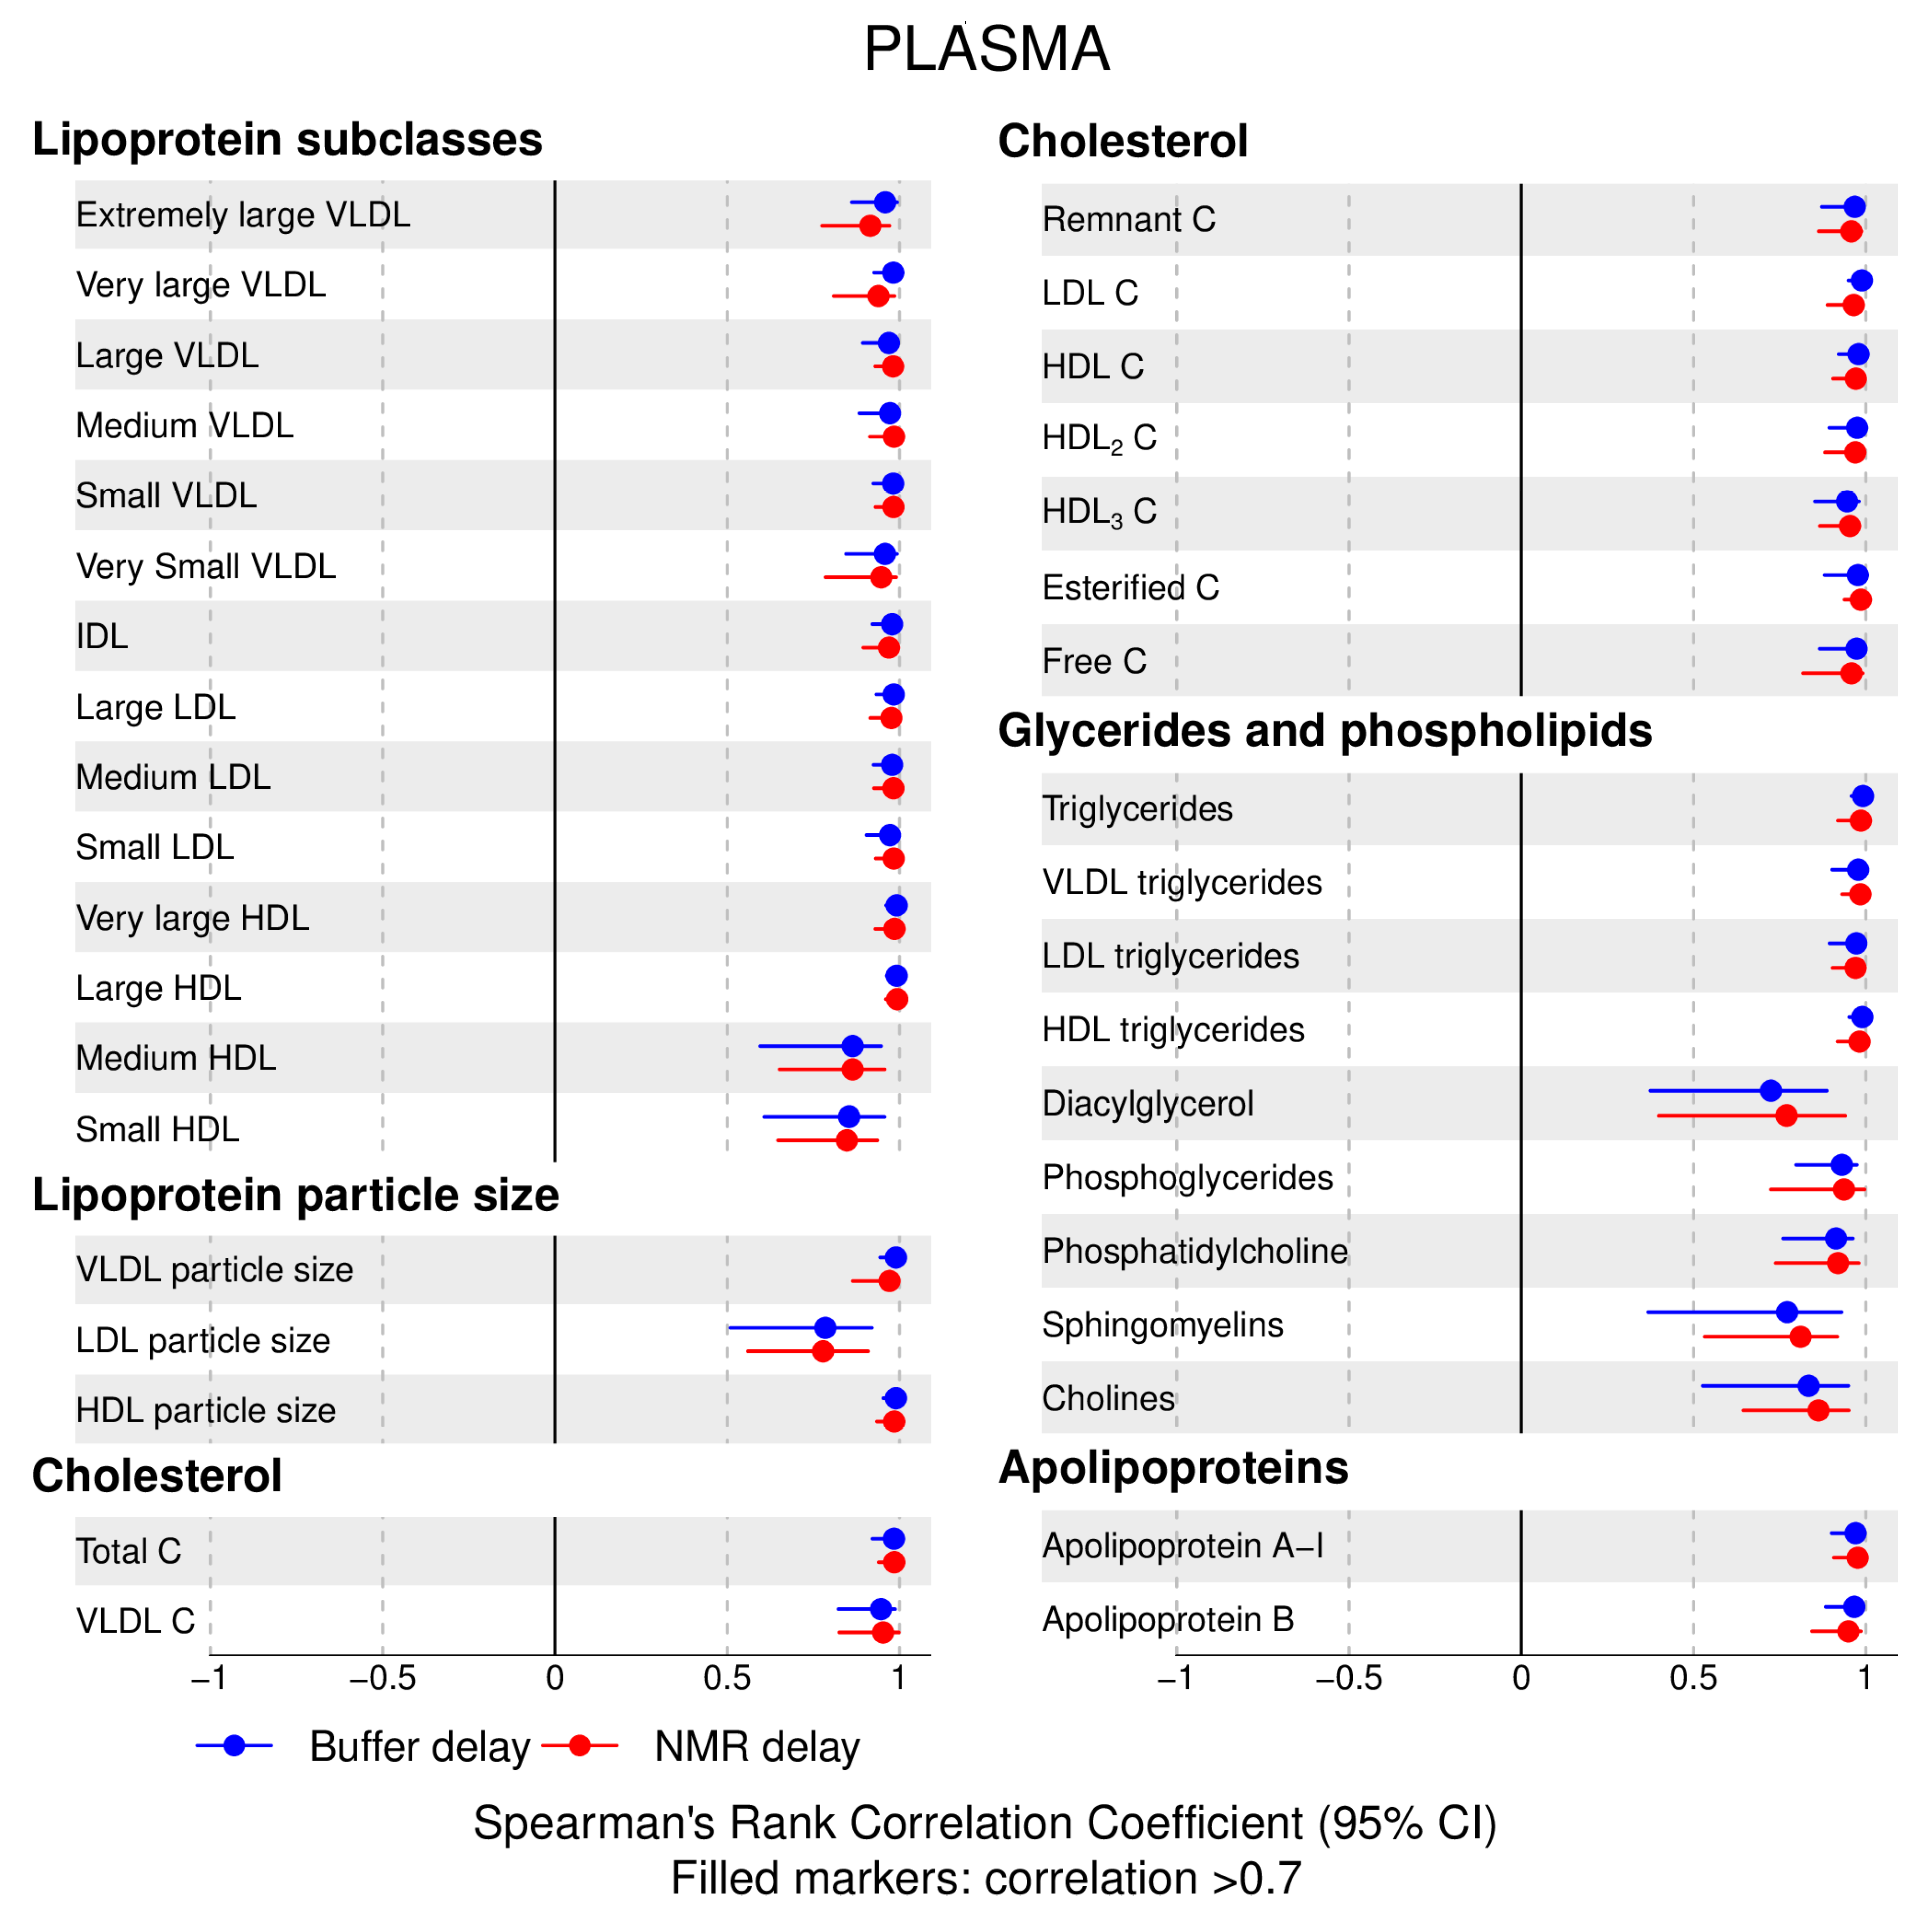
- 72% and 93% of metabolic traits across pre- and post-storage conditions, respectively, had Spearman’s correlations, between metabolite concentrations of samples subjected to reference and variant conditions, above 0.8 (Tables S2–S5, Supplementary Materials; Figure 1, Figure 2, Figure 3, Figure 4, Figure 5, Figure 6, Figure 7 and Figure 8; Figures S1–S4, Supplementary Materials). Exceptions are described in the next two bullet points.
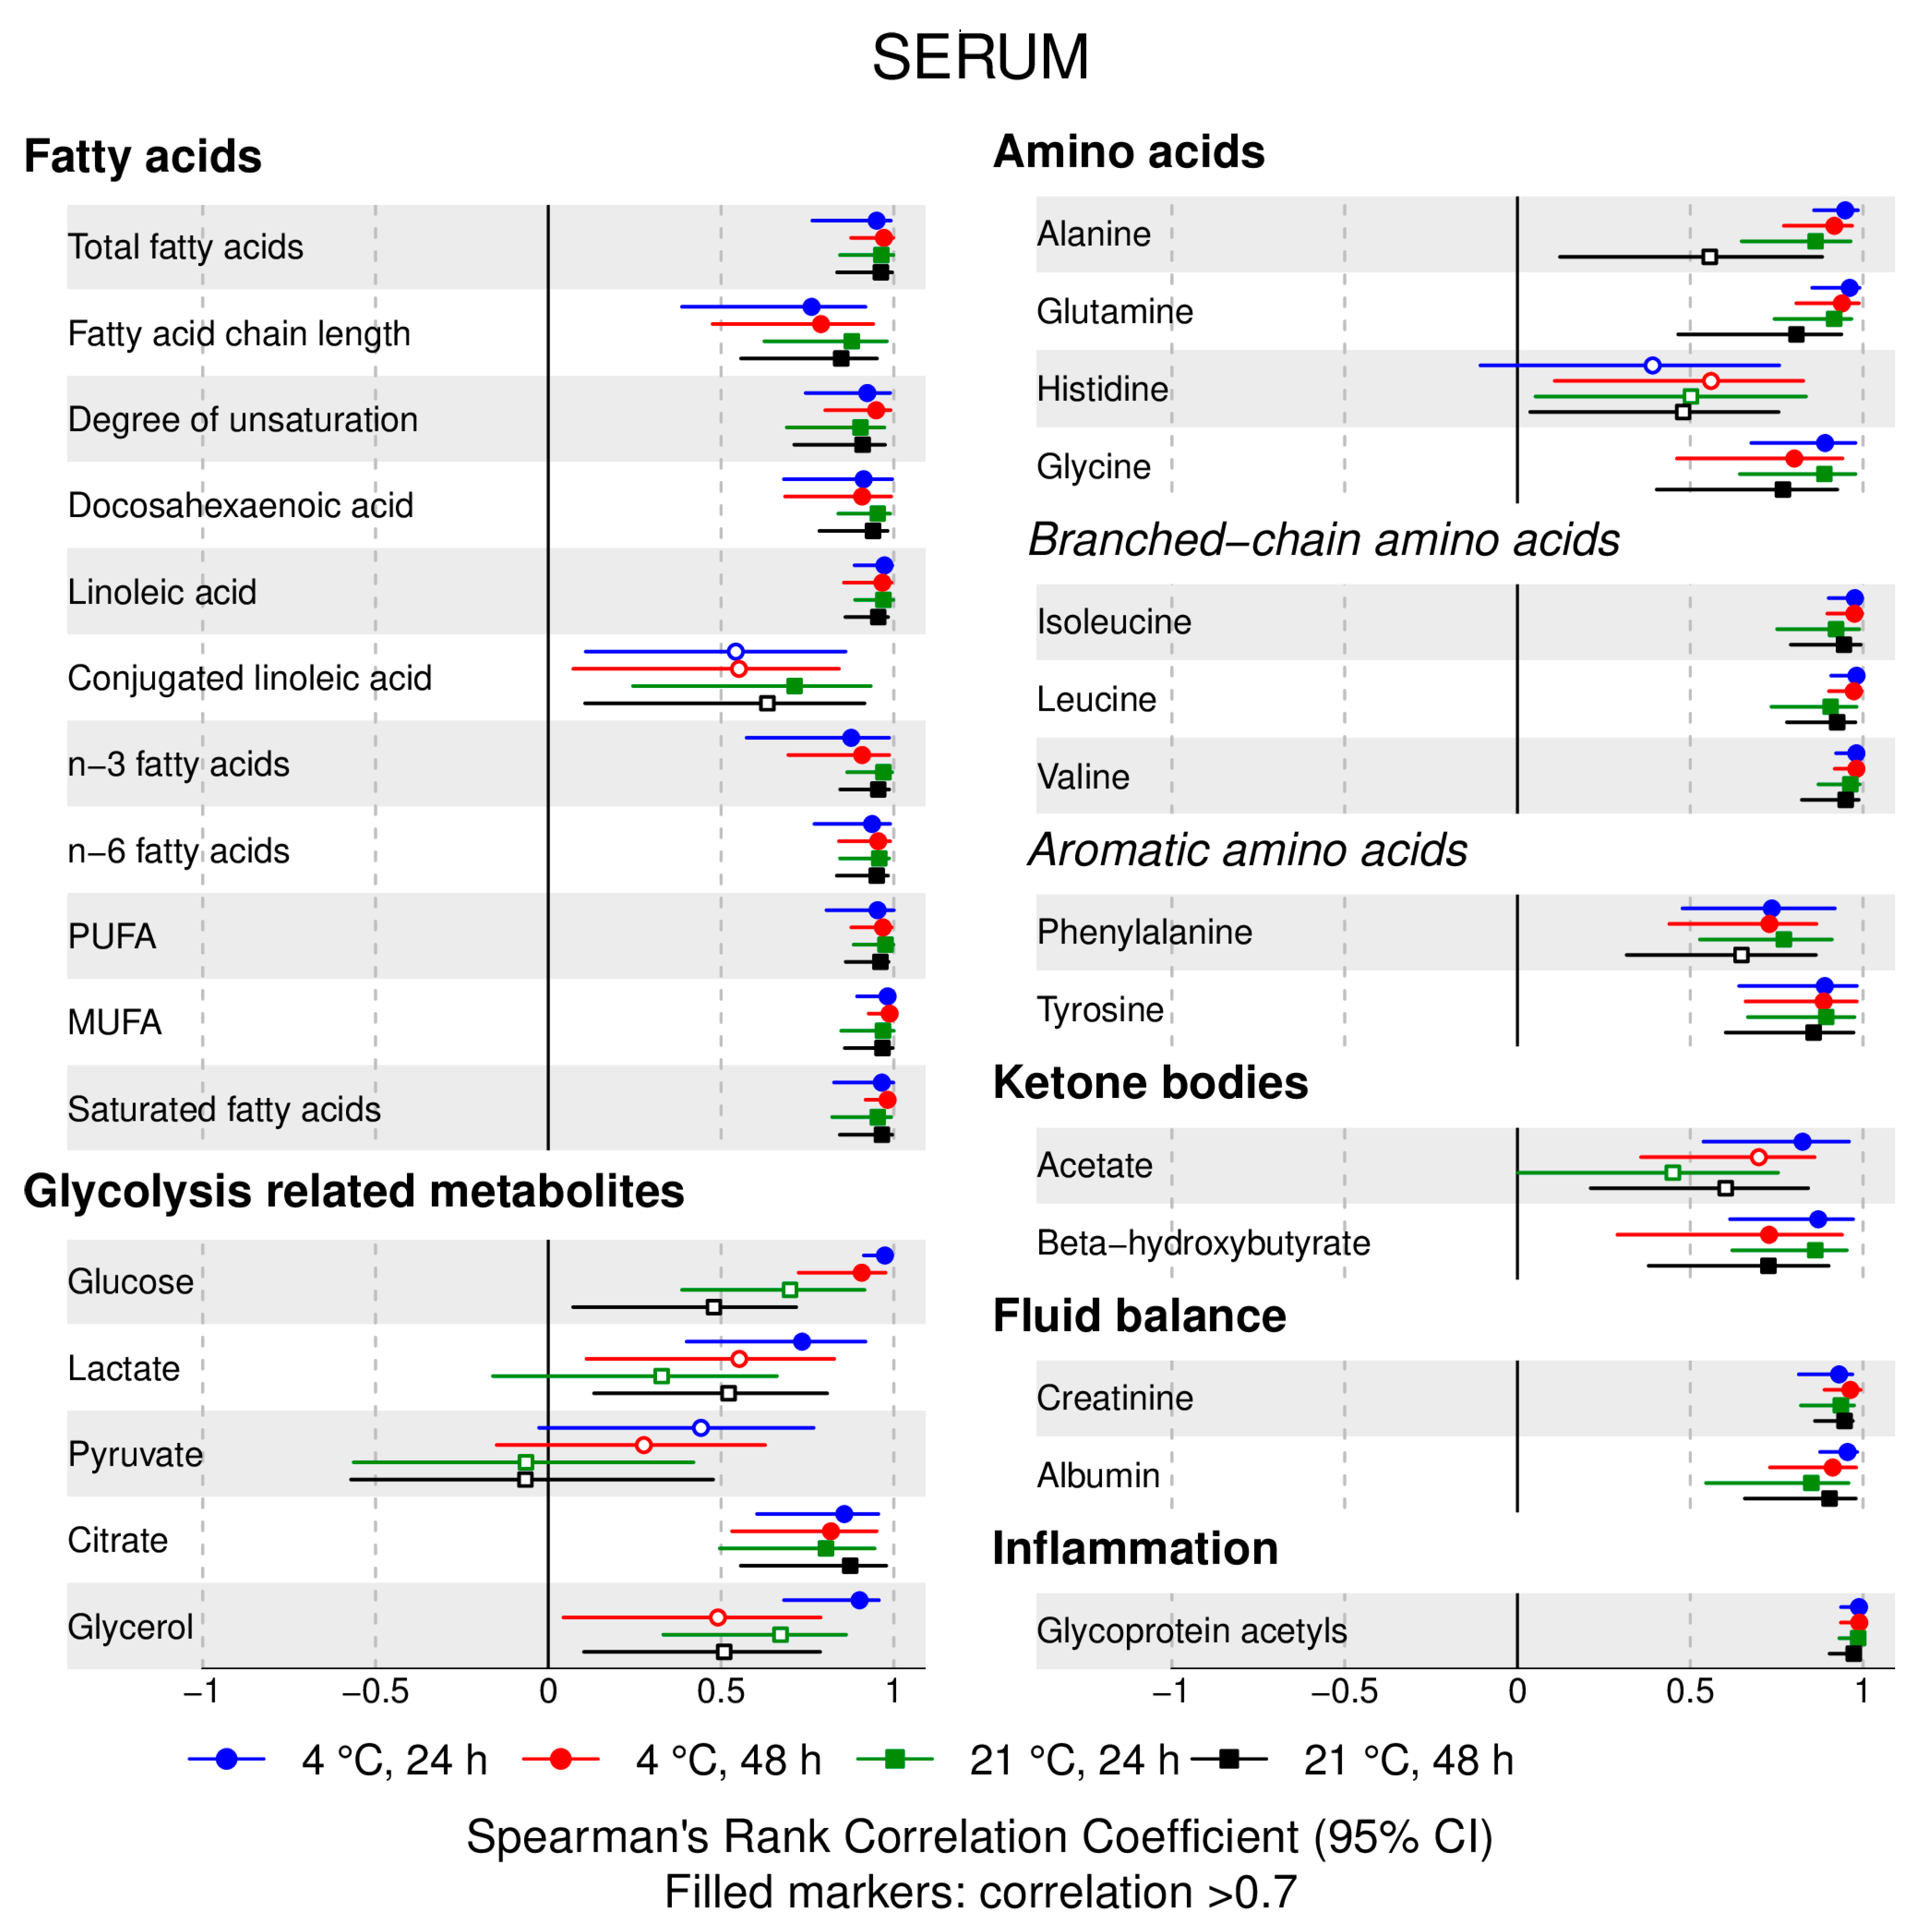
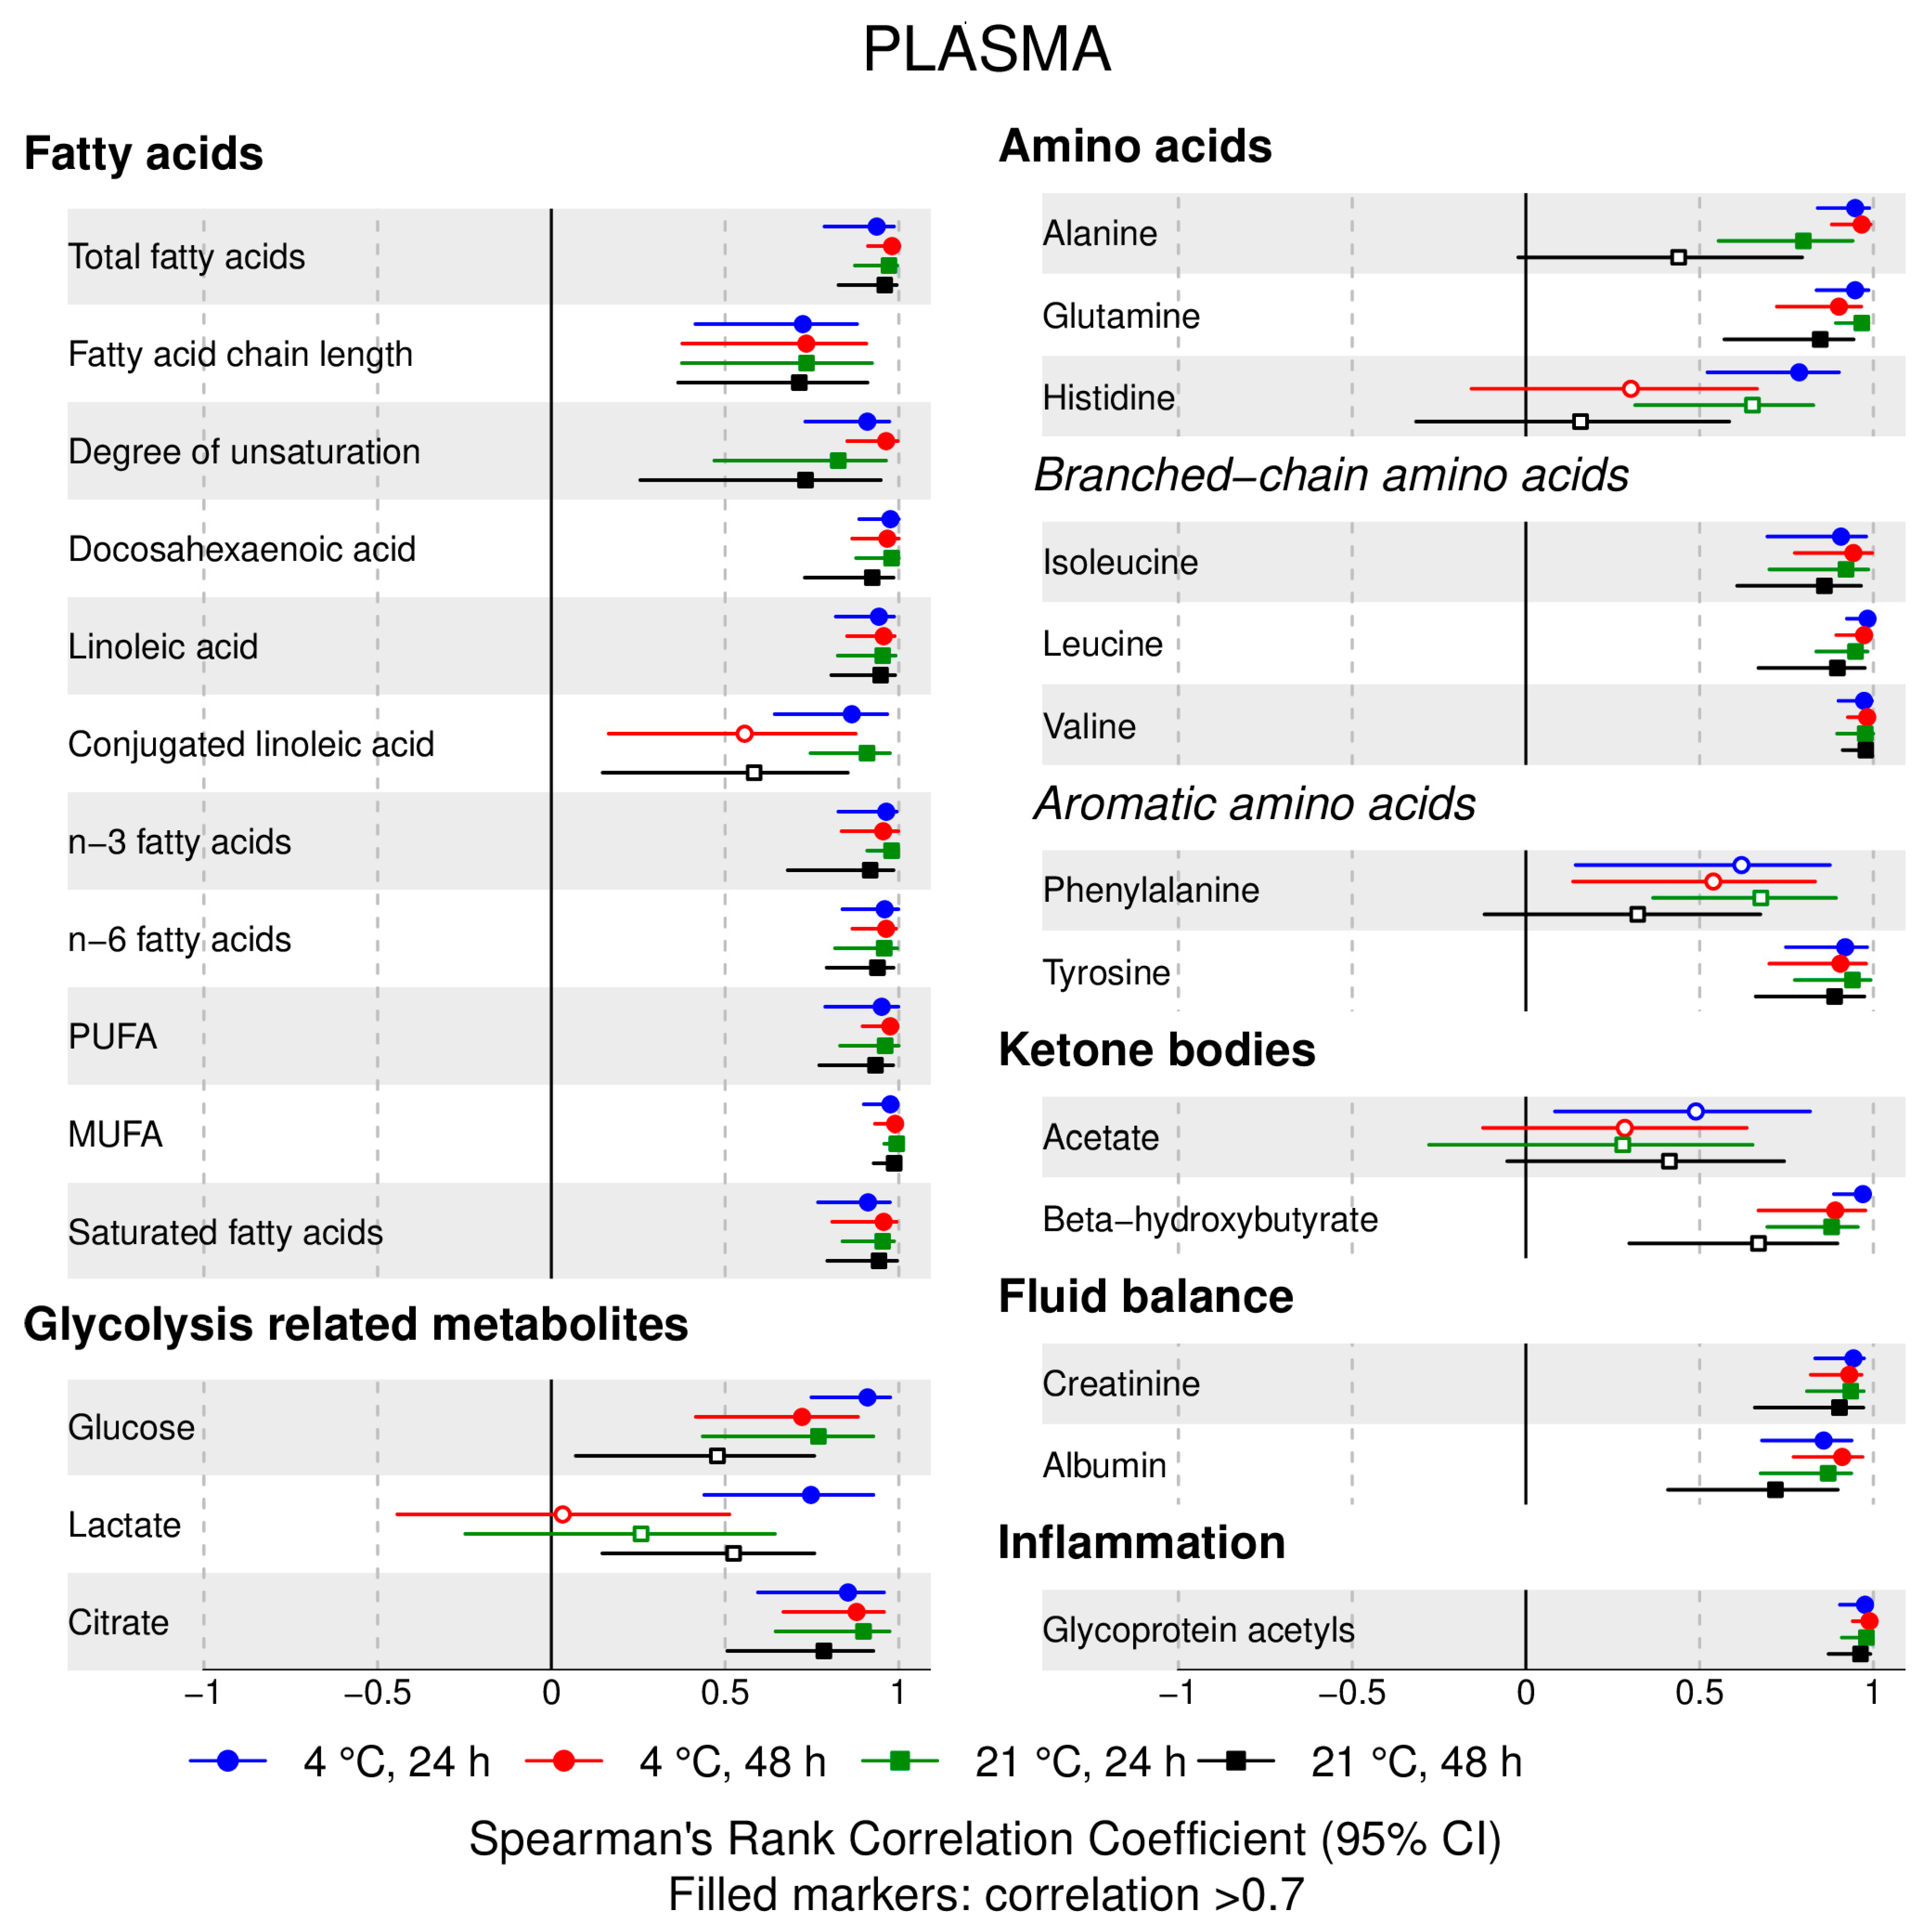
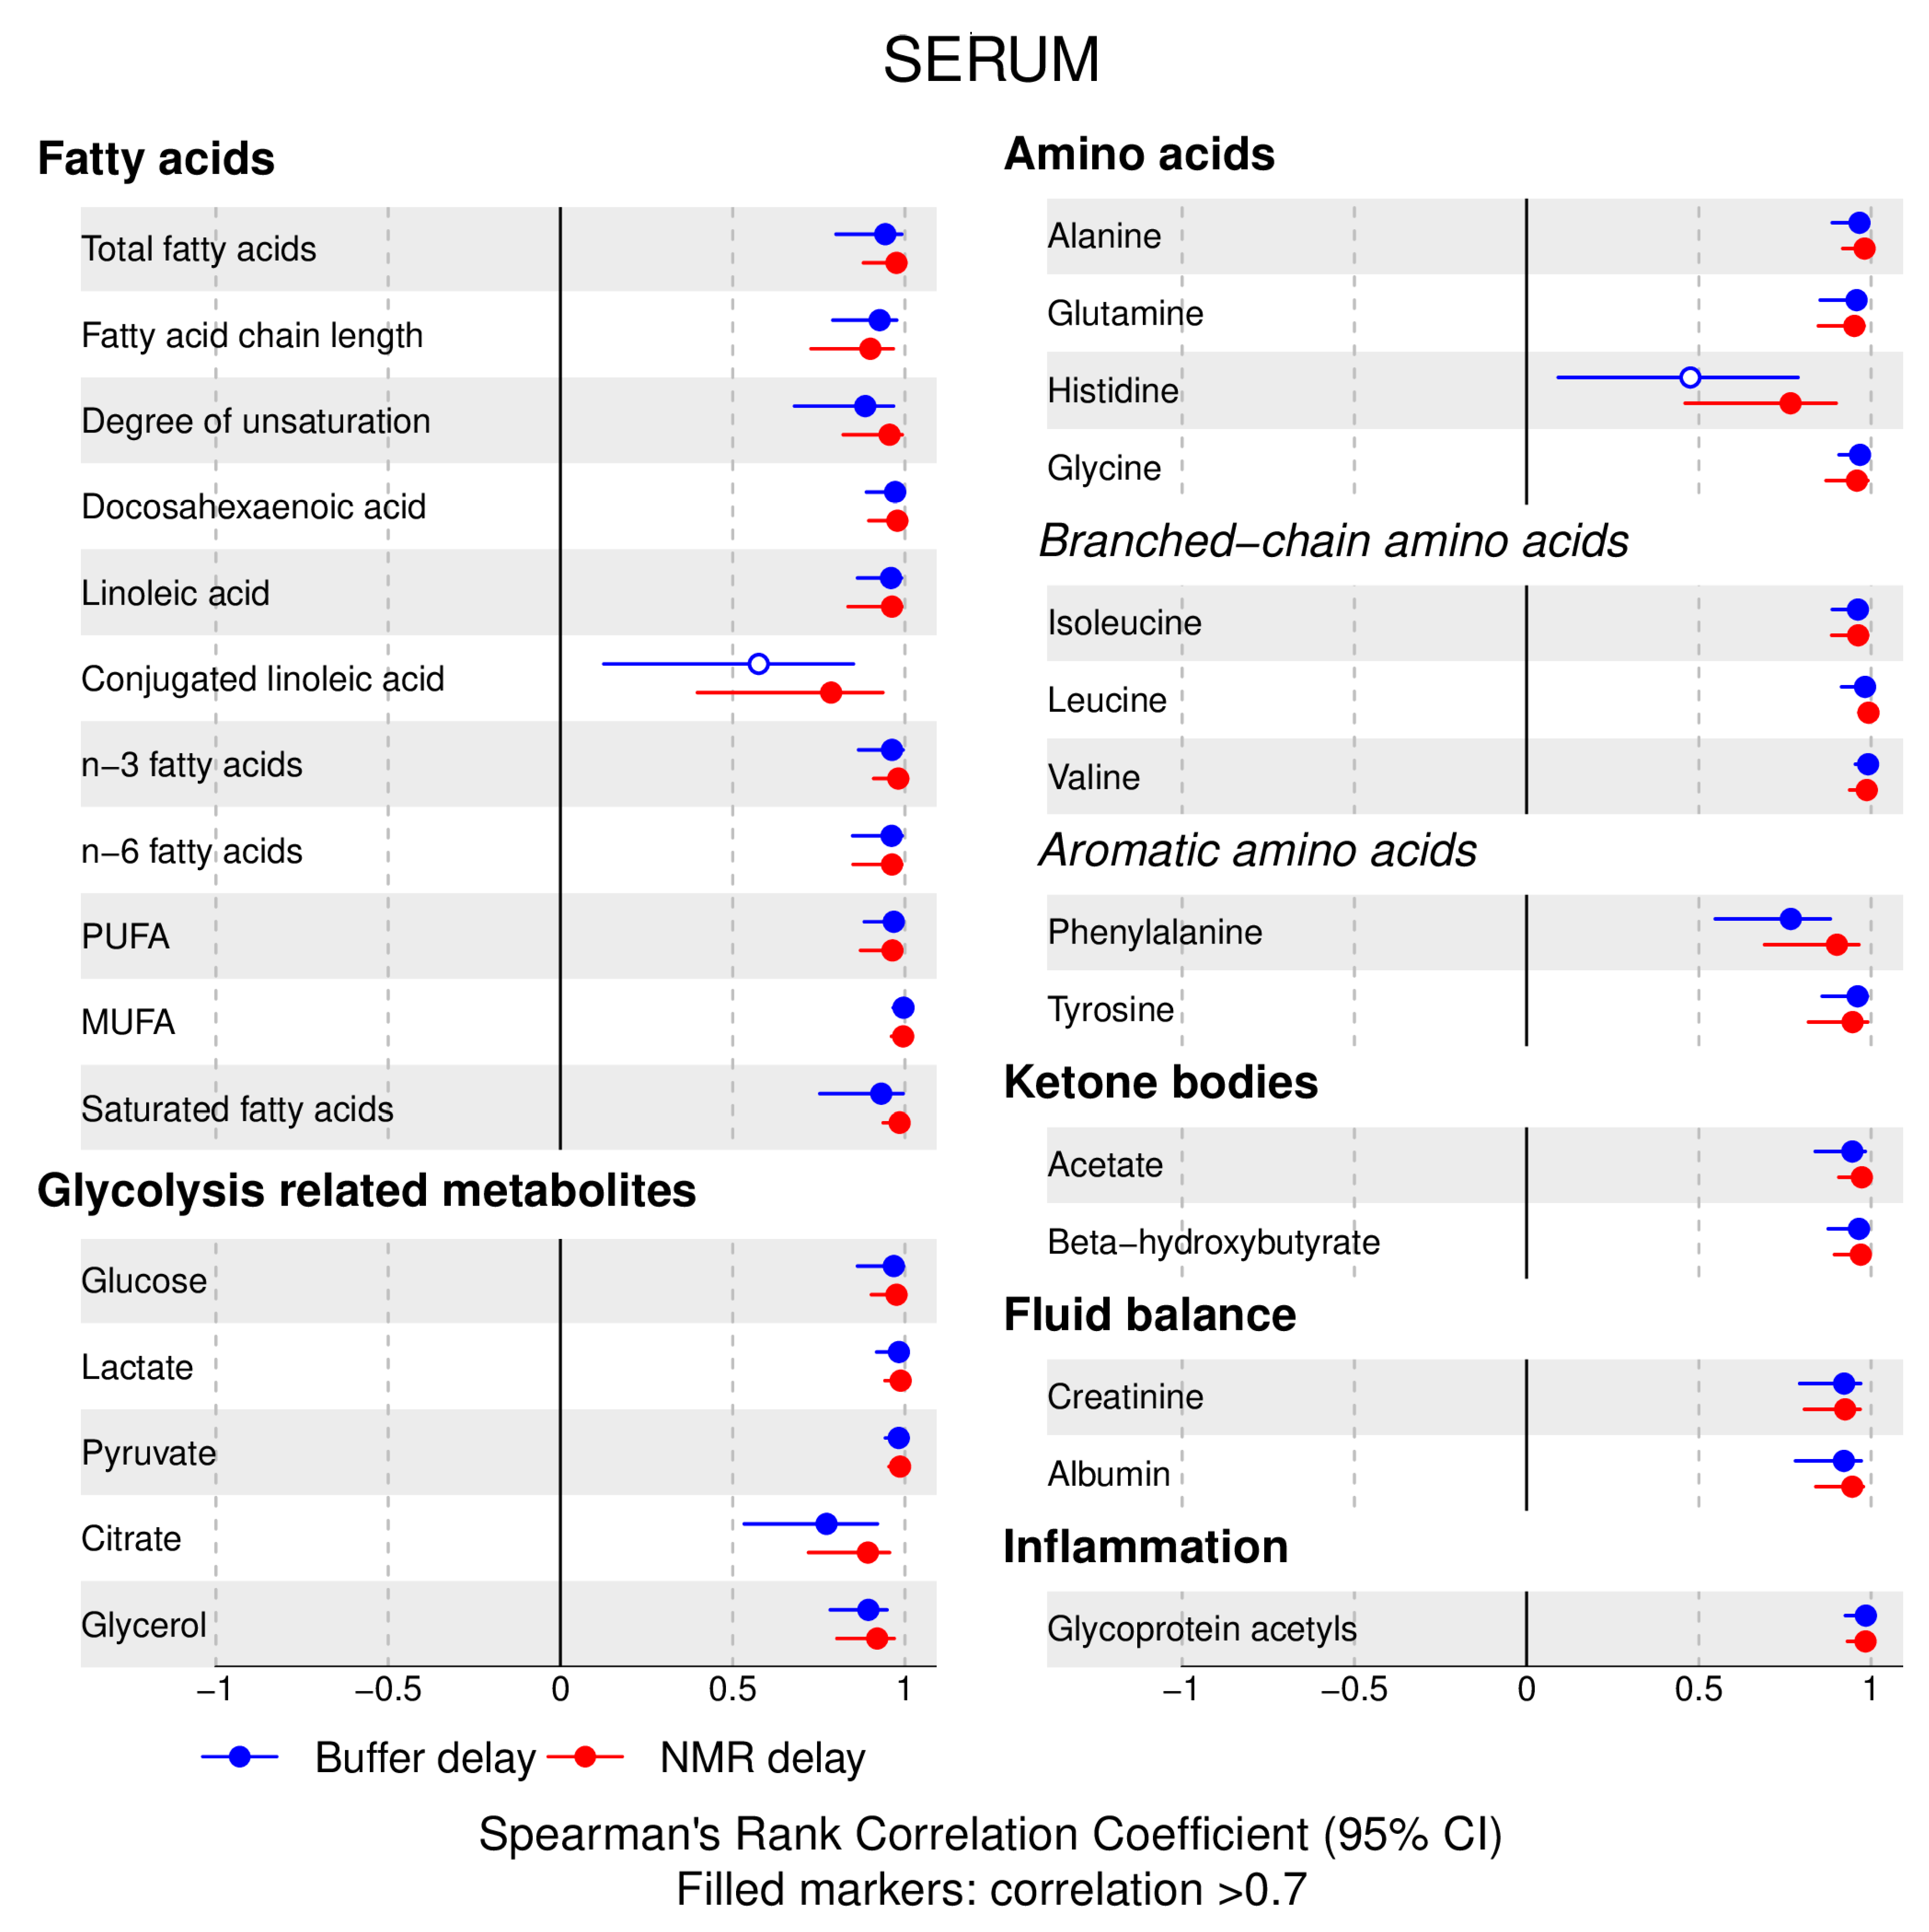
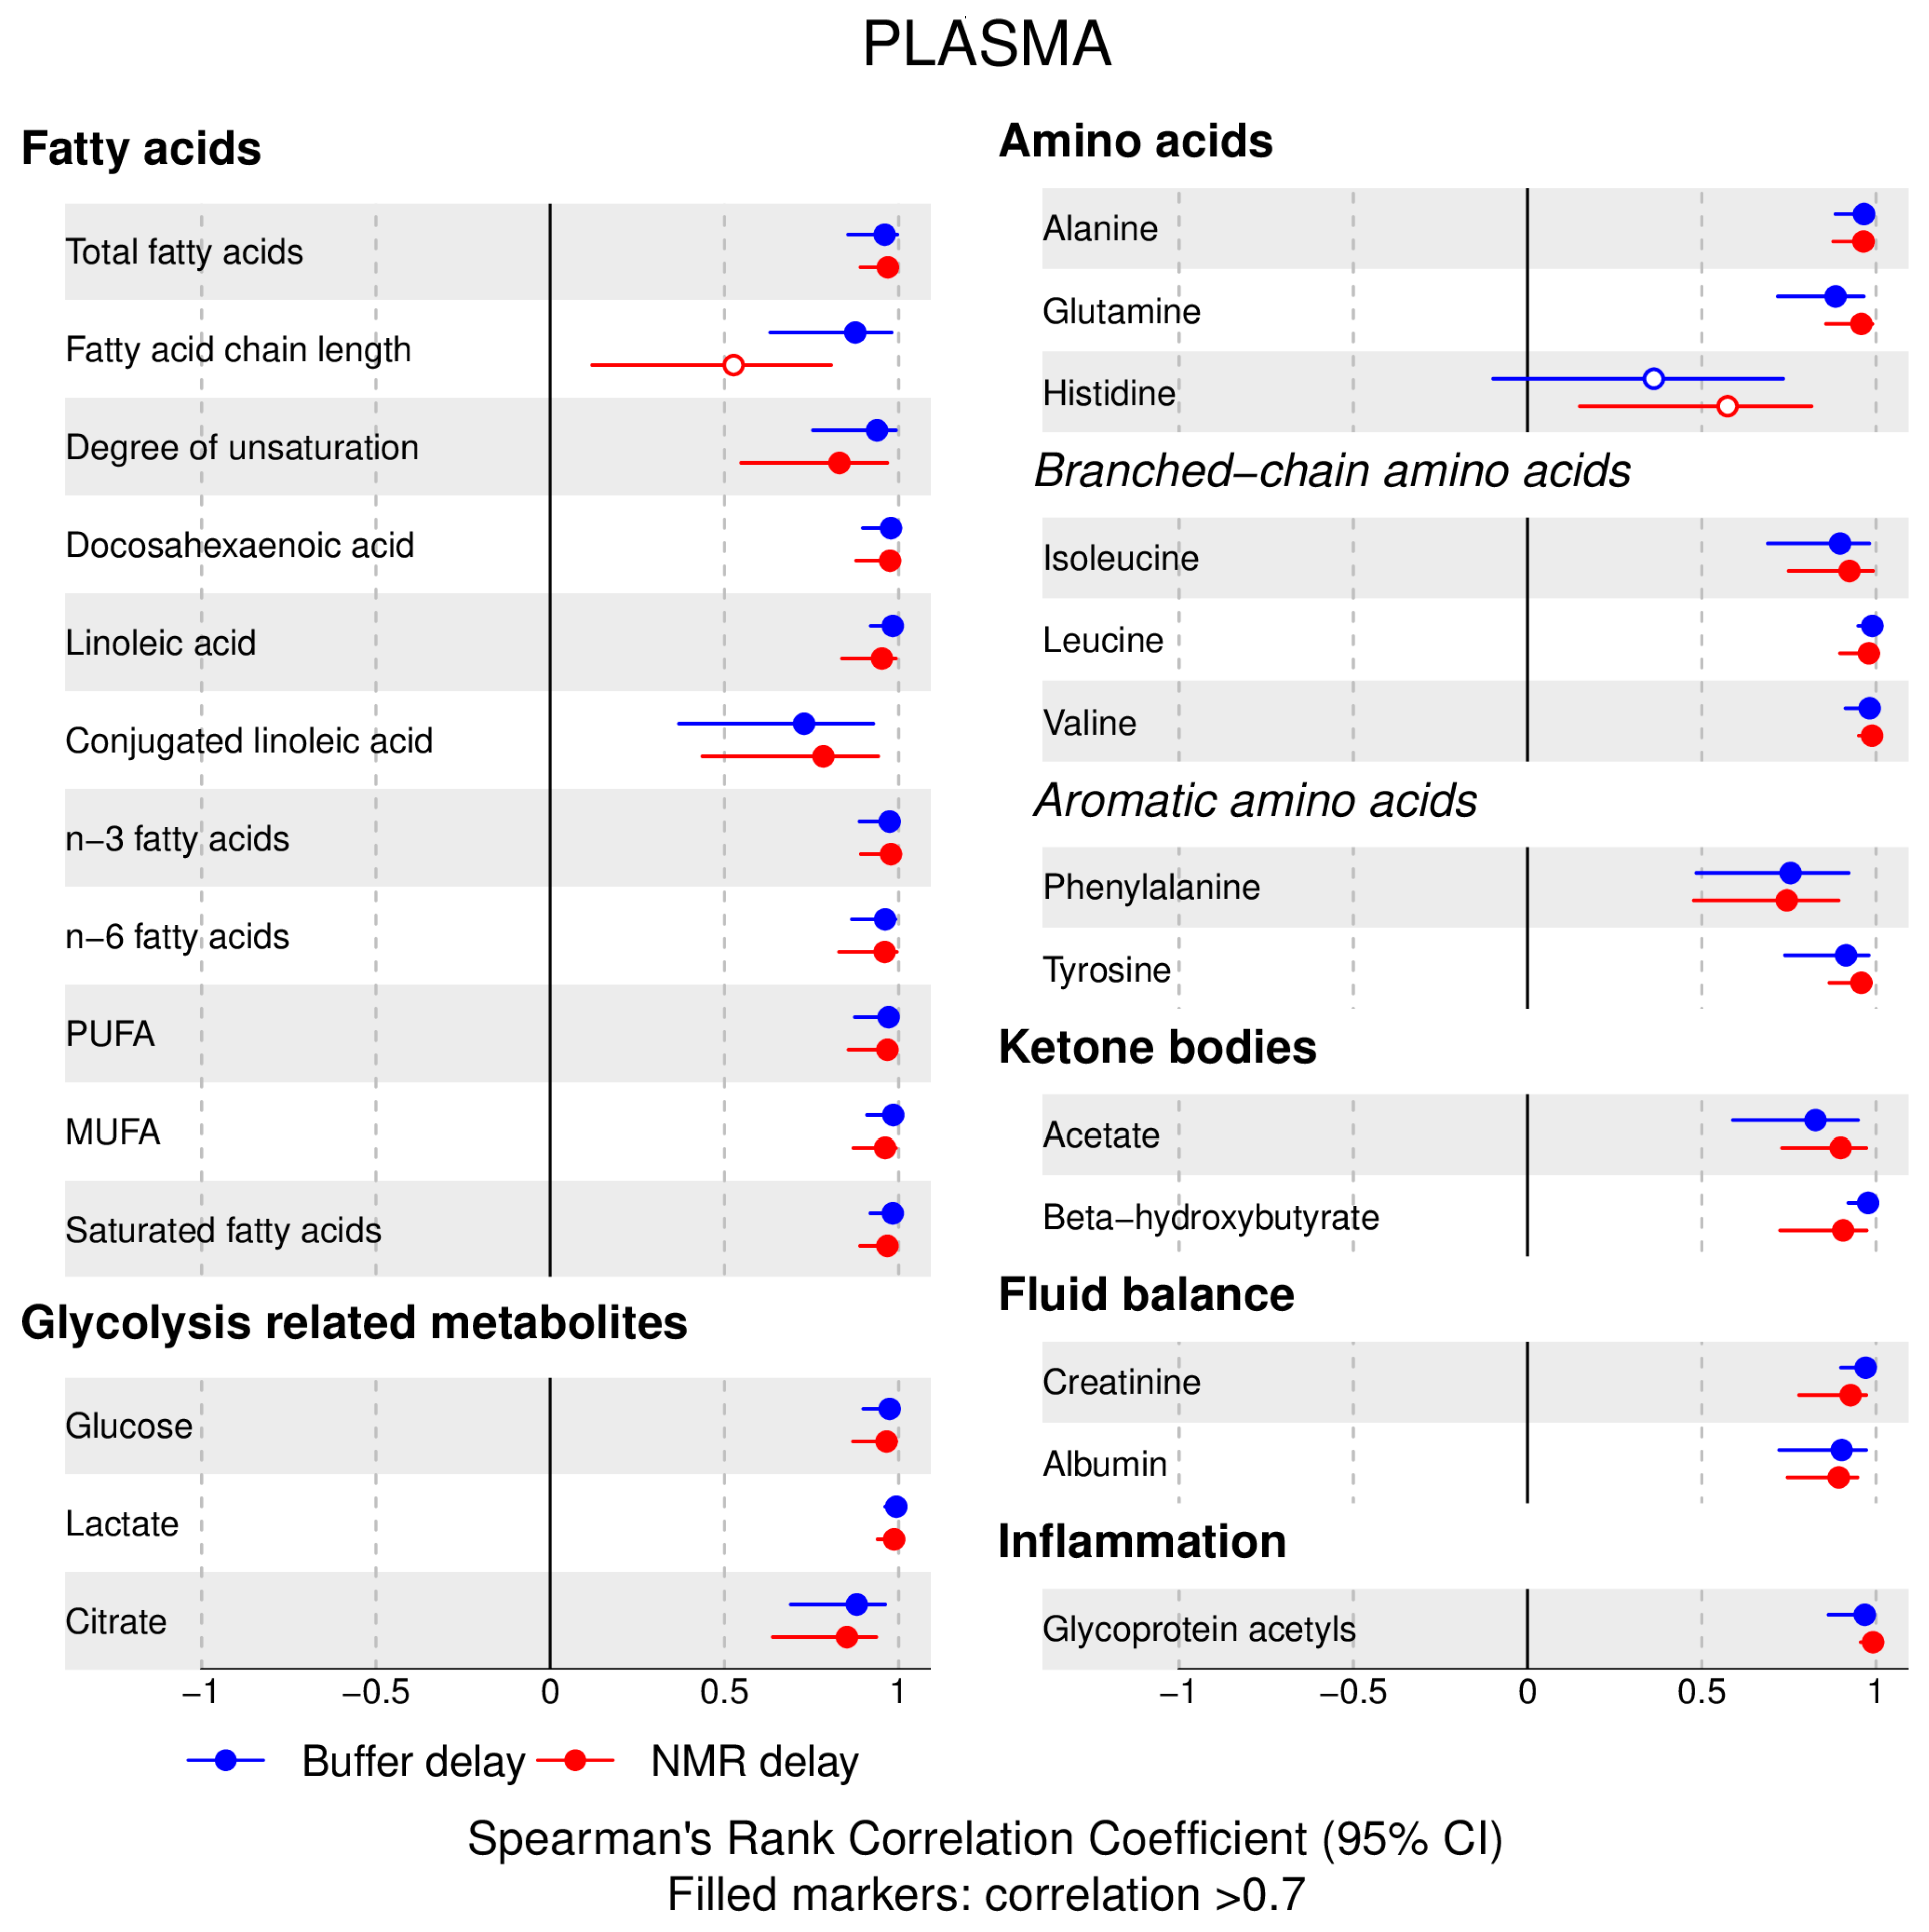
- In both biofluids, diacylglycerol and histidine concentrations had, generally, Spearman’s correlation coefficient of ~0.5 or lower between reference and variant pre- and post-storage conditions (Figure 1, Figure 2, Figure 3, Figure 4, Figure 5, Figure 6 and Figure 7; Tables S2–S5, Supplementary Materials).
- Sphingomyelins, conjugated linoleic acid, lactate, glucose (serum), pyruvate (serum), glycerol (serum), phenylalanine (EDTA-plasma) and acetate had Spearman rank correlations between ~0.7 and −0.06 between concentration of samples subjected to variant pre-storage conditions and reference.
- Glycolysis-related metabolites (glucose, lactate, pyruvate) and amino acids showed marked differences in mean concentration between reference and pre-storage conditions and post-storage conditions (amino acids only) (Figures S5–S7, Supplementary Materials; Tables S6–S9, Supplementary Materials).
- Branched and aromatic amino acids had smaller changes in mean differences from the reference and variant pre-storage conditions in EDTA-plasma than in serum (Figure S5, Supplementary Materials; Tables S6 and S7, Supplementary Materials).
- For pyruvate, pre-storage delay and temperature appeared to interact, with mean levels slightly decreasing/stable from reference levels per 24 h at 4 °C and increasing per 24 h at 21 °C (Figure S5, Supplementary Materials; Table S6, Supplementary Materials).
- As an illustration of the magnitude of effects in serum, mean levels of glucose decreased by 0.91 mmol/L (95% CI: 0.87 to 0.95) and 1.9 mmol/L (95% CI: 1.7 to 2.1) for each 24 h delay, compared with the reference sample, at 4 °C and 21 °C, respectively. Pyruvate levels decreased by 0.013 mmol/L per 24 h (95% CI: 0.008 to 0.018) at 4 °C but increased by 0.73 mmol/L per 24 h (95% CI: 0.64, 0.82) at 21 °C.
- Post-storage conditions affected histidine, phenylalanine and low-density lipoprotein (LDL) particle size, with differences in mean levels of up to 1.4 SD from reference (Figure S6, Supplementary Materials; Tables S8 and S9, Supplementary Materials).
3. Discussion
Potential Bias in Epidemiological Studies of Pre-Analytic Conditions
4. Materials and Methods
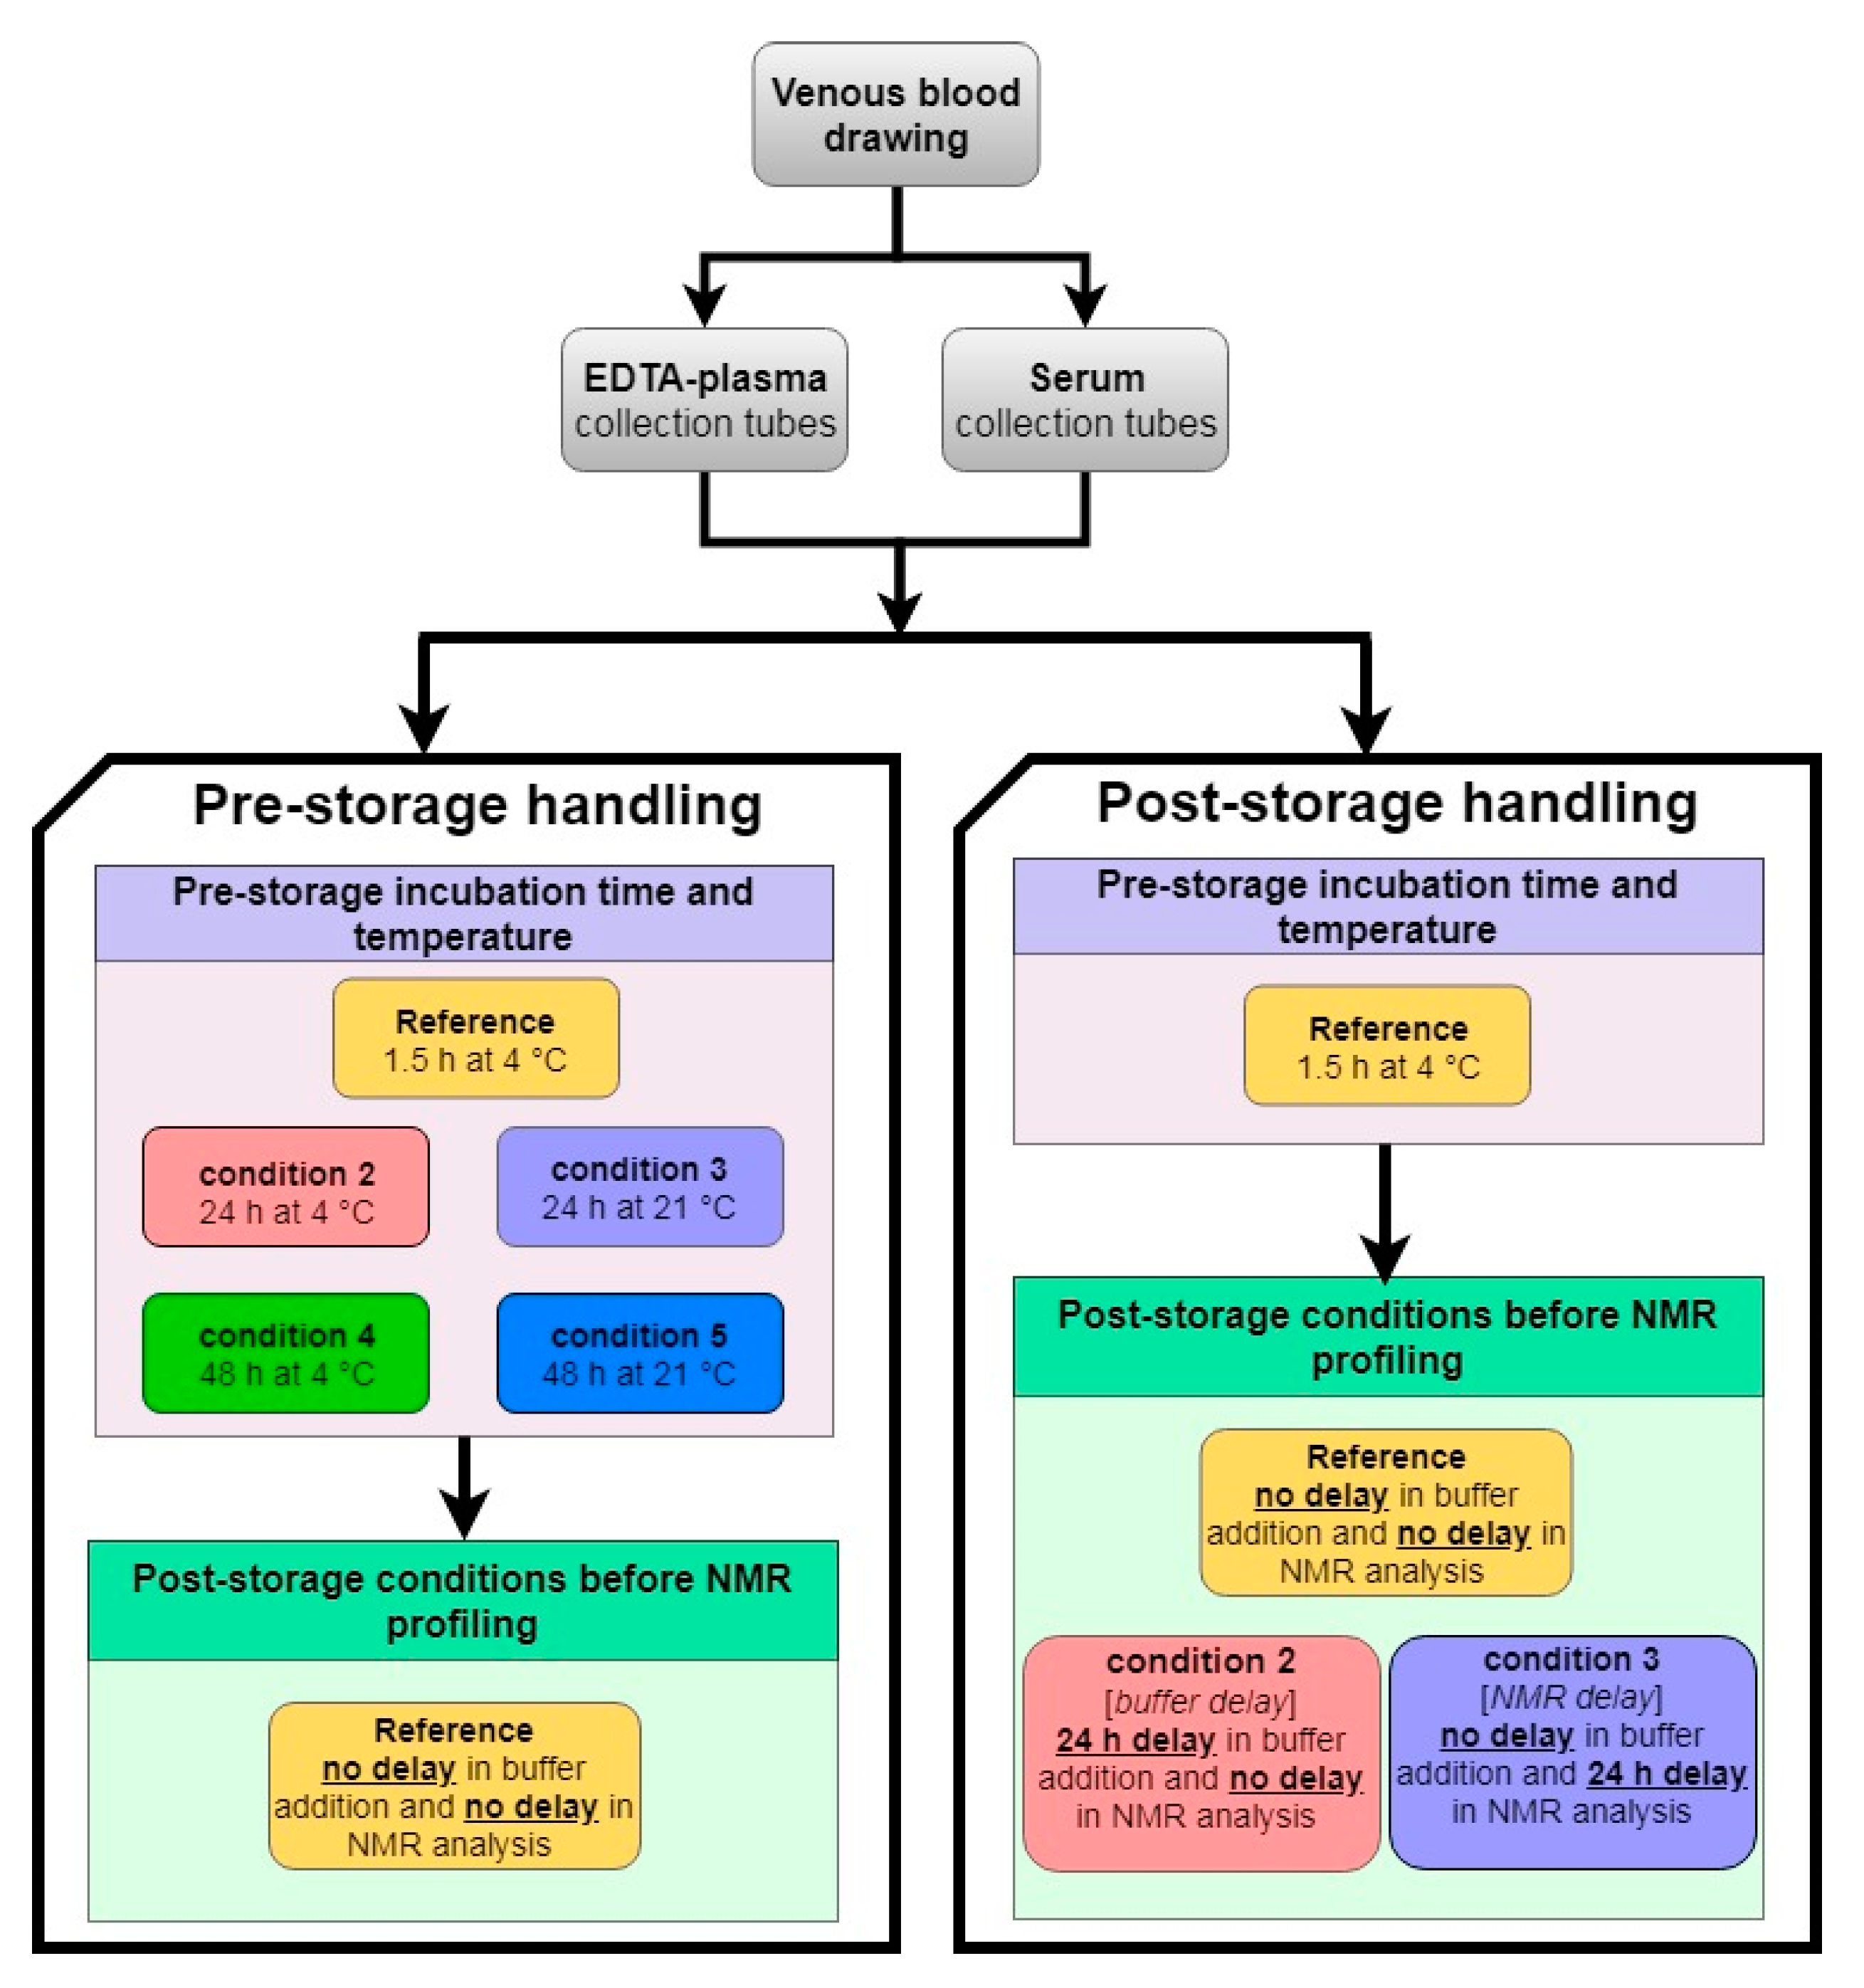
4.1. Reference Samples
4.2. Pre-Storage Handling: Effect of Pre-Centrifugation Delay and Temperature
4.3. Post-Storage Handling: Effect of Buffer Addition Delay and NMR Profiling Delay
4.4. Nuclear Magnetic Resonance Metabolomics Platform
4.5. Statistical Analysis
5. Conclusions
Supplementary Materials
Author Contributions
Funding
Acknowledgments
Conflicts of Interest
Appendix A
Appendix A.1. Supplementary Methods
Appendix A.2. Reference Samples
Appendix A.3. Pre-storage Handling: Effect of Pre-Storage Delay and Temperature
Appendix A.4. Nuclear Magnetic Resonance (NMR) Metabolomics Platform
Appendix A.5. Statistical Analysis
References
- Boyd, A.; Golding, J.; Macleod, J.; Lawlor, D.A.; Fraser, A.; Henderson, J.; Molloy, L.; Ness, A.; Ring, S.; Davey Smith, G.D. Cohort Profile: The ‘Children of the 90s’-the index offspring of the Avon Longitudinal Study of Parents and Children. Int. J. Epidemiol. 2013, 42, 111–127. [Google Scholar] [CrossRef]
- Fraser, A.; Macdonald-Wallis, C.; Tilling, K.; Boyd, A.; Golding, J.; Davey Smith, G.; Henderson, J.; Macleod, J.; Molloy, L.; Ness, A.; et al. Cohort Profile: The Avon Longitudinal Study of Parents and Children: ALSPAC mothers cohort. Int. J. Epidemiol. 2013, 42, 97–110. [Google Scholar] [CrossRef]
- Wright, J.; Small, N.; Raynor, P.; Tuffnell, D.; Bhopal, R.; Cameron, N.; Fairley, L.; Lawlor, D.A.; Parslow, R.; Petherick, E.S.; et al. Cohort Profile: The Born in Bradford multi-ethnic family cohort study. Int. J. Epidemiol. 2013, 42, 978–991. [Google Scholar] [CrossRef]
- Mindell, J.; Biddulph, J.P.; Hirani, V.; Stamatakis, E.; Craig, R.; Nunn, S.; Shelton, N. Cohort Profile: The Health Survey for England. Int. J. Epidemiol. 2012, 41, 1585–1593. [Google Scholar] [CrossRef] [PubMed]
- Understanding Society. The UK Household Longitudinal Study (UKHLS). 2009. Available online: https://www.understandingsociety.ac.uk/ (accessed on 1 January 2019).
- Shah, T.; Engmann, J.; Dale, C.; Shah, S.; White, J.; Giambartolomei, C.; McLachlan, S.; Zabaneh, D.; Cavadino, A.; Finan, C.; et al. Population Genomics of Cardiometabolic Traits: Design of the University College London-London School of Hygiene and Tropical Medicine-Edinburgh-Bristol (UCLEB) Consortium. PLoS ONE 2013, 8. [Google Scholar] [CrossRef]
- Albanes, D.; Moore, S.; Ulrich, C.; Stolzenberg-Solomon, R.; Poole, E.; Temprosa, M.; Verma, M.; Boerwinkle, E.; Casas, J.; Clish, C.; et al. COnsortium for METabolomics Studies (COMETS): Leveraging Resources to Accelerate Scientific Discovery. Faseb J. 2016, 30, lb129. [Google Scholar]
- Psaty, B.M.; O’Donnell, C.J.; Gudnason, V.; Lunetta, K.L.; Folsom, A.R.; Rotter, J.I.; Uitterlinden, A.G.; Harris, T.B.; Witteman, J.C.M.; Boerwinkle, E.; et al. Cohorts for Heart and Aging Research in Genomic Epidemiology (CHARGE) Consortium Design of Prospective Meta-Analyses of Genome-Wide Association Studies From 5 Cohorts. Circ.-Cardiovasc. Gene 2009, 2. [Google Scholar] [CrossRef]
- Lehmann, R. Preanalytics: What can metabolomics learn from clinical chemistry? Bioanalysis 2015, 7, 927–930. [Google Scholar] [CrossRef]
- Carraro, P.; Zago, T.; Plebani, M. Exploring the Initial Steps of the Testing Process: Frequency and Nature of Pre-Preanalytic Errors. Clin. Chem. 2012, 58, 638–642. [Google Scholar] [CrossRef]
- Lippi, G.; Guidi, G.C.; Mattiuzzi, C.; Plebani, M. Preanalytical variability: The dark side of the moon in laboratory testing. Clin. Chem. Lab. Med. 2006, 44, 358–365. [Google Scholar] [CrossRef] [PubMed]
- Szecsi, P.B.; Odum, L. Error tracking in a clinical biochemistry laboratory. Clin. Chem. Lab. Med. 2009, 47, 1253–1257. [Google Scholar] [CrossRef] [PubMed]
- World Health Organization. Use of Anticoagulants in Diagnostic Laboratory Investigations; World Health Organization: Geneva, Switzerland, 2002. [Google Scholar]
- Anton, G.; Wilson, R.; Yu, Z.H.; Prehn, C.; Zukunft, S.; Adamski, J.; Heier, M.; Meisinger, C.; Romisch-Margl, W.; Wang-Sattler, R.; et al. Pre-analytical sample quality: Metabolite ratios as an intrinsic marker for prolonged room temperature exposure of serum samples. PLoS ONE 2015, 10, e0121495. [Google Scholar] [CrossRef]
- Key, T.; Oakes, S.; Davey, G.; Moore, J.; Edmond, L.M.; McLoone, U.J.; Thurnham, D.I. Stability of vitamins A, C, and E, carotenoids, lipids, and testosterone in whole blood stored at 4 degrees C for 6 and 24 hours before separation of serum and plasma. Cancer Epidem. Biomar. 1996, 5, 811–814. [Google Scholar]
- Clark, S.; Youngman, L.D.; Palmer, A.; Parish, S.; Peto, R.; Collins, R. Stability of plasma analytes after delayed separation of whole blood: Implications for epidemiological studies. Int. J. Epidemiol. 2003, 32, 125–130. [Google Scholar] [CrossRef]
- Boyanton, B.L., Jr.; Blick, K.E. Stability studies of twenty-four analytes in human plasma and serum. Clin. Chem. 2002, 48, 2242–2247. [Google Scholar]
- Oddoze, C.; Lombard, E.; Portugal, H. Stability study of 81 analytes in human whole blood, in serum and in plasma. Clin. Biochem. 2012, 45, 464–469. [Google Scholar] [CrossRef] [PubMed]
- Bernini, P.; Bertini, I.; Luchinat, C.; Nincheri, P.; Staderini, S.; Turano, P. Standard operating procedures for pre-analytical handling of blood and urine for metabolomic studies and biobanks. J. Biomol. NMR 2011, 49, 231–243. [Google Scholar] [CrossRef] [PubMed]
- Hernandes, V.V.; Barbas, C.; Dudzik, D. A review of blood sample handling and pre-processing for metabolomics studies. Electrophoresis 2017, 38, 2232–2241. [Google Scholar] [CrossRef] [PubMed]
- Dudzik, D.; Barbas-Bernardos, C.; Garcia, A.; Barbas, C. Quality assurance procedures for mass spectrometry untargeted metabolomics. a review. J. Pharm. Biomed. Anal. 2018, 147, 149–173. [Google Scholar] [CrossRef]
- Holland, N.T.; Smith, M.T.; Eskenazi, B.; Bastaki, M. Biological sample collection and processing for molecular epidemiological studies. Mutat. Res.-Rev. Mutat. 2003, 543, 217–234. [Google Scholar] [CrossRef]
- Kirwan, J.A.; Brennan, L.; Broadhurst, D.; Fiehn, O.; Cascante, M.; Dunn, W.B.; Schmidt, M.A.; Velagapudi, V. Preanalytical Processing and Biobanking Procedures of Biological Samples for Metabolomics Research: A White Paper, Community Perspective (for “Precision Medicine and Pharmacometabolomics Task Group”-The Metabolomics Society Initiative). Clin. Chem. 2018, 64, 1158–1182. [Google Scholar] [CrossRef]
- Bervoets, L.; Louis, E.; Reekmans, G.; Mesotten, L.; Thomeer, M.; Adriaensens, P.; Linsen, L. Influence of preanalytical sampling conditions on the H-1 NMR metabolic profile of human blood plasma and introduction of the Standard PREanalytical Code used in biobanking. Metabolomics 2015, 11, 1197–1207. [Google Scholar] [CrossRef]
- Breier, M.; Wahl, S.; Prehn, C.; Fugmann, M.; Ferrari, U.; Weise, M.; Banning, F.; Seissler, J.; Grallert, H.; Adamski, J.; et al. Targeted metabolomics identifies reliable and stable metabolites in human serum and plasma samples. PLoS ONE 2014, 9, e89728. [Google Scholar] [CrossRef] [PubMed]
- Kamlage, B.; Maldonado, S.G.; Bethan, B.; Peter, E.; Schmitz, O.; Liebenberg, V.; Schatz, P. Quality markers addressing preanalytical variations of blood and plasma processing identified by broad and targeted metabolite profiling. Clin. Chem. 2014, 60, 399–412. [Google Scholar] [CrossRef] [PubMed]
- Nishiumi, S.; Suzuki, M.; Kobayashi, T.; Yoshida, M. Differences in metabolite profiles caused by pre-analytical blood processing procedures. J. Biosci. Bioeng. 2018, 125, 613–618. [Google Scholar] [CrossRef] [PubMed]
- Pinto, J.; Domingues, M.R.; Galhano, E.; Pita, C.; Almeida Mdo, C.; Carreira, I.M.; Gil, A.M. Human plasma stability during handling and storage: Impact on NMR metabolomics. Analyst 2014, 139, 1168–1177. [Google Scholar] [CrossRef]
- Jobard, E.; Tredan, O.; Postoly, D.; Andre, F.; Martin, A.L.; Elena-Herrmann, B.; Boyault, S. A Systematic Evaluation of Blood Serum and Plasma Pre-Analytics for Metabolomics Cohort Studies. Int. J. Mol. Sci. 2016, 17, 2035. [Google Scholar] [CrossRef]
- Fliniaux, O.; Gaillard, G.; Lion, A.; Cailleu, D.; Mesnard, F.; Betsou, F. Influence of common preanalytical variations on the metabolic profile of serum samples in biobanks. J. Biomol. NMR 2011, 51, 457–465. [Google Scholar] [CrossRef] [PubMed]
- Barton, R.H.; Nicholson, J.K.; Elliott, P.; Holmes, E. High-throughput 1H NMR-based metabolic analysis of human serum and urine for large-scale epidemiological studies: Validation study. Int. J. Epidemiol. 2008, 37 (Suppl. 1), i31–i40. [Google Scholar] [CrossRef]
- Teahan, O.; Gamble, S.; Holmes, E.; Waxman, J.; Nicholson, J.K.; Bevan, C.; Keun, H.C. Impact of analytical bias in metabonomic studies of human blood serum and plasma. Anal. Chem. 2006, 78, 4307–4318. [Google Scholar] [CrossRef] [PubMed]
- Overfield, C.V.; Savory, J.; Heintges, M.G. Glycolysis: A re-evaluation of the effect on blood glucose. Clin. Chim. Acta 1972, 39, 35–40. [Google Scholar] [CrossRef]
- Yin, P.; Lehmann, R.; Xu, G. Effects of pre-analytical processes on blood samples used in metabolomics studies. Anal. Bioanal. Chem. 2015, 407, 4879–4892. [Google Scholar] [CrossRef] [PubMed]
- Soininen, P.; Kangas, A.J.; Wurtz, P.; Tukiainen, T.; Tynkkynen, T.; Laatikainen, R.; Jarvelin, M.R.; Kahonen, M.; Lehtimaki, T.; Viikari, J.; et al. High-throughput serum NMR metabonomics for cost-effective holistic studies on systemic metabolism. Analyst 2009, 134, 1781–1785. [Google Scholar] [CrossRef] [PubMed]
- Inouye, M.; Kettunen, J.; Soininen, P.; Silander, K.; Ripatti, S.; Kumpula, L.S.; Hamalainen, E.; Jousilahti, P.; Kangas, A.J.; Mannisto, S.; et al. Metabonomic, transcriptomic, and genomic variation of a population cohort. Mol. Syst. Biol. 2010, 6, 441. [Google Scholar] [CrossRef]
- Soininen, P.; Kangas, A.J.; Wurtz, P.; Suna, T.; Ala-Korpela, M. Quantitative serum nuclear magnetic resonance metabolomics in cardiovascular epidemiology and genetics. Circ. Cardiovasc. Genet. 2015, 8, 192–206. [Google Scholar] [CrossRef]
- Wurtz, P.; Kangas, A.J.; Soininen, P.; Lawlor, D.A.; Davey Smith, G.; Ala-Korpela, M. Quantitative Serum Nuclear Magnetic Resonance Metabolomics in Large-Scale Epidemiology: A Primer on -Omic Technologies. Am. J. Epidemiol. 2017, 186, 1084–1096. [Google Scholar] [CrossRef]
- Wang, Q.; Ferreira, D.L.S.; Nelson, S.M.; Sattar, N.; Ala-Korpela, M.; Lawlor, D.A. Metabolic characterization of menopause: Cross-sectional and longitudinal evidence. BMC Med. 2018, 16. [Google Scholar] [CrossRef]
- Wang, Q.; Wurtz, P.; Auro, K.; Makinen, V.P.; Kangas, A.J.; Soininen, P.; Tiainen, M.; Tynkkynen, T.; Jokelainen, J.; Santalahti, K.; et al. Metabolic profiling of pregnancy: Cross-sectional and longitudinal evidence. BMC Med. 2016, 14. [Google Scholar] [CrossRef]
- Ferreira, D.L.S.; Williams, D.M.; Kangas, A.J.; Soininen, P.; Ala-Korpela, M.; Smith, G.D.; Jarvelin, M.R.; Lawlor, D.A. Association of pre-pregnancy body mass index with offspring metabolic profile: Analyses of 3 European prospective birth cohorts. PLoS Med. 2017, 14. [Google Scholar] [CrossRef]
- Gao, X.; Starmer, J.; Martin, E.R. A multiple testing correction method for genetic association studies using correlated single nucleotide polymorphisms. Genet. Epidemiol. 2008, 32, 361–369. [Google Scholar] [CrossRef]
- Sterne, J.A.; Davey Smith, G. Sifting the evidence—what’s wrong with significance tests? BMJ 2001, 322, 226–231. [Google Scholar] [CrossRef] [PubMed]
- Wasserstein, R.L.; Lazar, N.A. The ASA’s statement on p-values: Context, process, and purpose. Am. Stat. 2016, 70, 129–133. [Google Scholar] [CrossRef]
- Saccenti, E.; Hoefsloot, H.C.J.; Smilde, A.K.; Westerhuis, J.A.; Hendriks, M.M.W.B. Reflections on univariate and multivariate analysis of metabolomics data. Metabolomics 2014, 10, 361–374. [Google Scholar] [CrossRef]
- Jolliffe, I.T.; Cadima, J. Principal component analysis: A review and recent developments. Philos. Trans. A Math. Phys. Eng. Sci. 2016, 374, 20150202. [Google Scholar] [CrossRef] [PubMed]
- Bro, R.; Smilde, A.K. Principal component analysis. Anal. Methods-Uk 2014, 6, 2812–2831. [Google Scholar] [CrossRef]


| Characteristics | n | % |
|---|---|---|
| Female | 29 | 78 |
| Age | ||
| (21–35) | 17 | 46 |
| (36–50) | 10 | 27 |
| (51–65) | 10 | 27 |
| Ever smoked, No | 15 | 41 |
| Time since last alcohol consumption | ||
| Never Drinks | 2 | 5 |
| <1 Week | 16 | 43 |
| 1–4 Weeks | 4 | 11 |
| 24 h before blood collection | 15 | 41 |
© 2019 by the authors. Licensee MDPI, Basel, Switzerland. This article is an open access article distributed under the terms and conditions of the Creative Commons Attribution (CC BY) license (http://creativecommons.org/licenses/by/4.0/).
Share and Cite
Santos Ferreira, D.L.; Maple, H.J.; Goodwin, M.; Brand, J.S.; Yip, V.; Min, J.L.; Groom, A.; Lawlor, D.A.; Ring, S. The Effect of Pre-Analytical Conditions on Blood Metabolomics in Epidemiological Studies. Metabolites 2019, 9, 64. https://doi.org/10.3390/metabo9040064
Santos Ferreira DL, Maple HJ, Goodwin M, Brand JS, Yip V, Min JL, Groom A, Lawlor DA, Ring S. The Effect of Pre-Analytical Conditions on Blood Metabolomics in Epidemiological Studies. Metabolites. 2019; 9(4):64. https://doi.org/10.3390/metabo9040064
Chicago/Turabian StyleSantos Ferreira, Diana L., Hannah J. Maple, Matt Goodwin, Judith S. Brand, Vikki Yip, Josine L. Min, Alix Groom, Debbie A. Lawlor, and Susan Ring. 2019. "The Effect of Pre-Analytical Conditions on Blood Metabolomics in Epidemiological Studies" Metabolites 9, no. 4: 64. https://doi.org/10.3390/metabo9040064
APA StyleSantos Ferreira, D. L., Maple, H. J., Goodwin, M., Brand, J. S., Yip, V., Min, J. L., Groom, A., Lawlor, D. A., & Ring, S. (2019). The Effect of Pre-Analytical Conditions on Blood Metabolomics in Epidemiological Studies. Metabolites, 9(4), 64. https://doi.org/10.3390/metabo9040064