Metabolomics of Breast Milk: The Importance of Phenotypes


 , ,
, , 
Abstract
1. Introduction
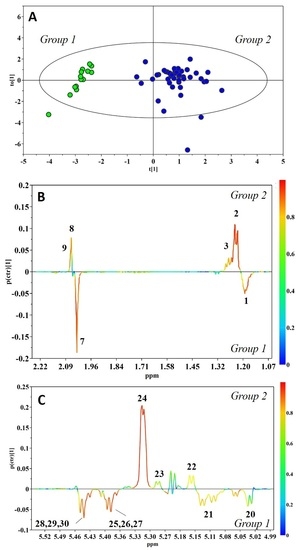
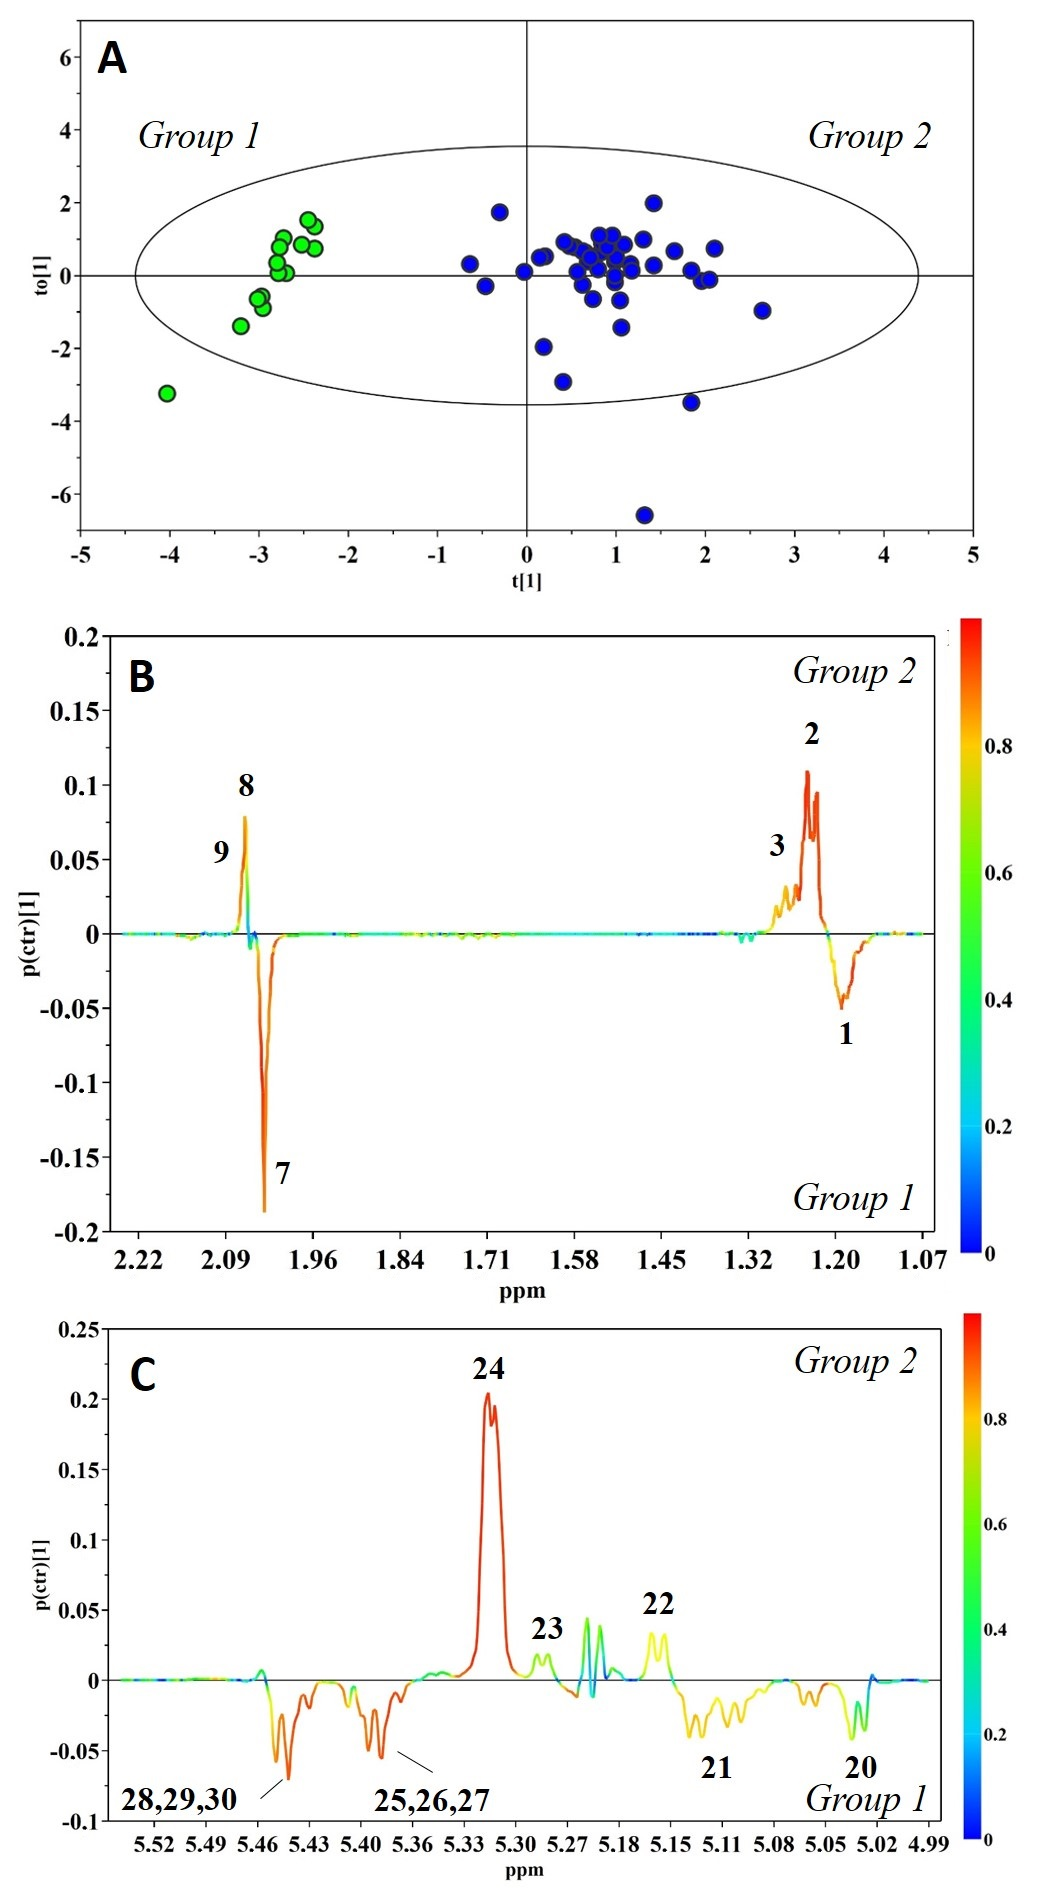
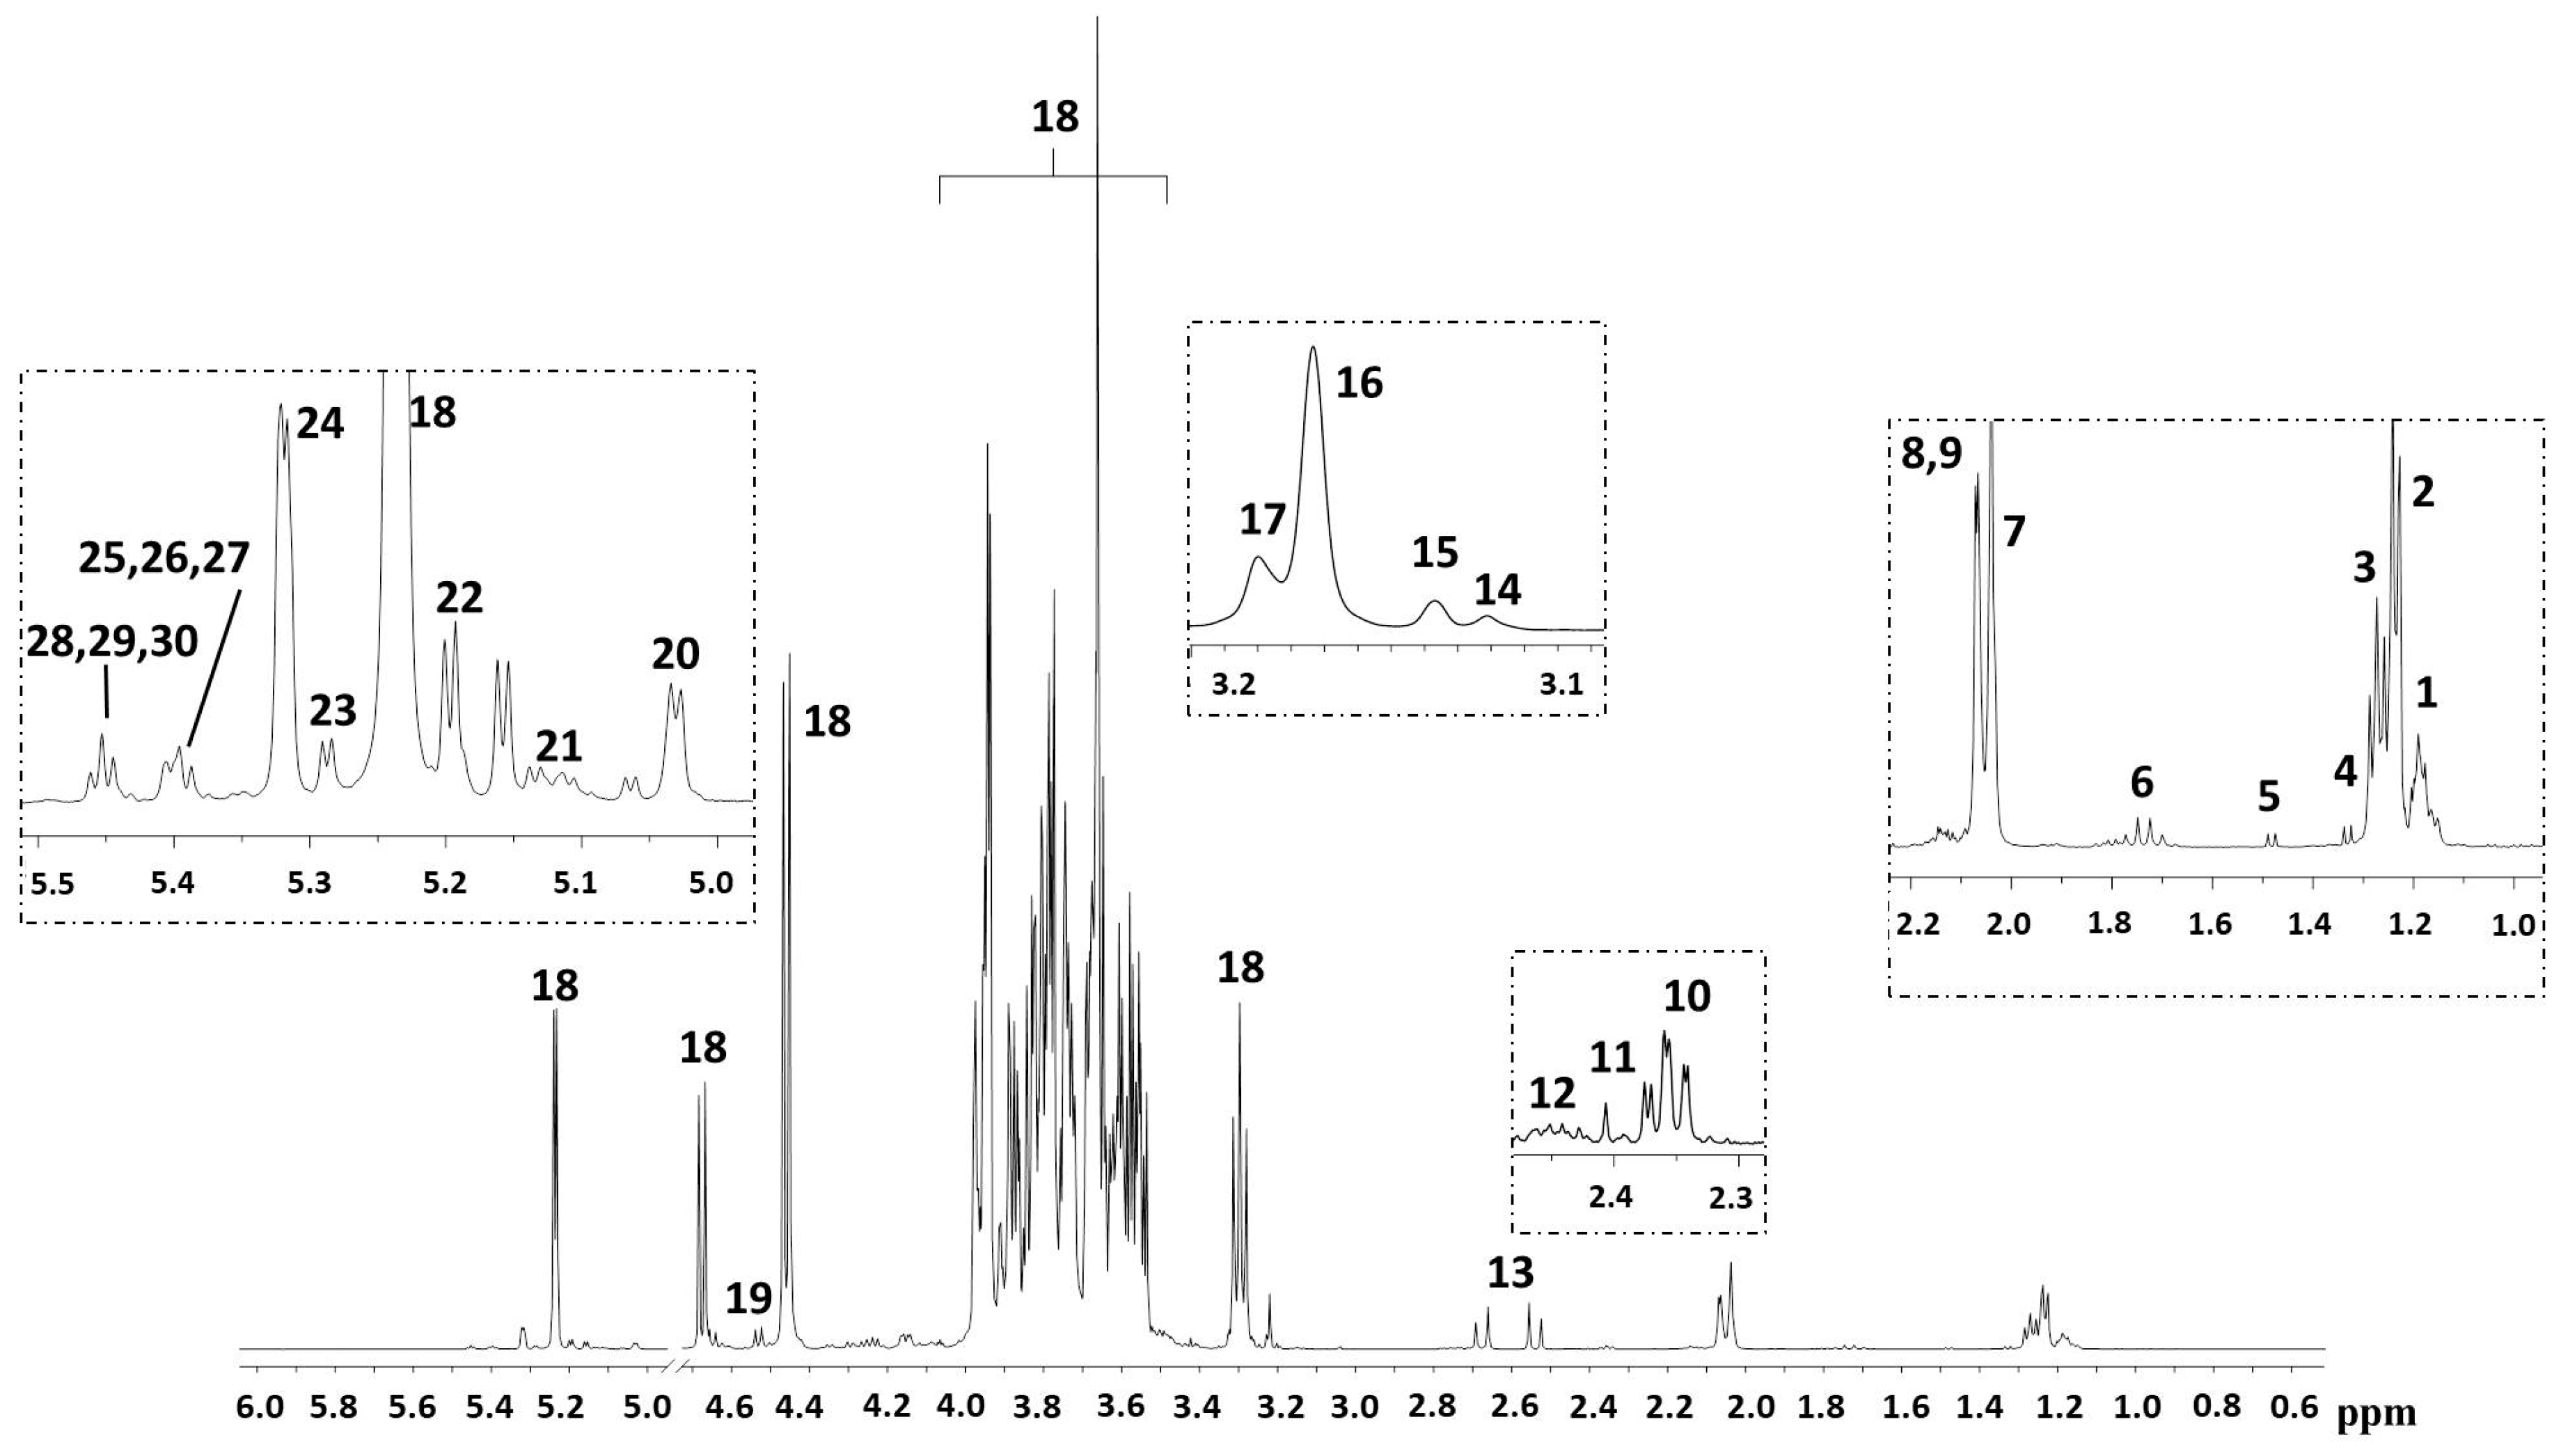
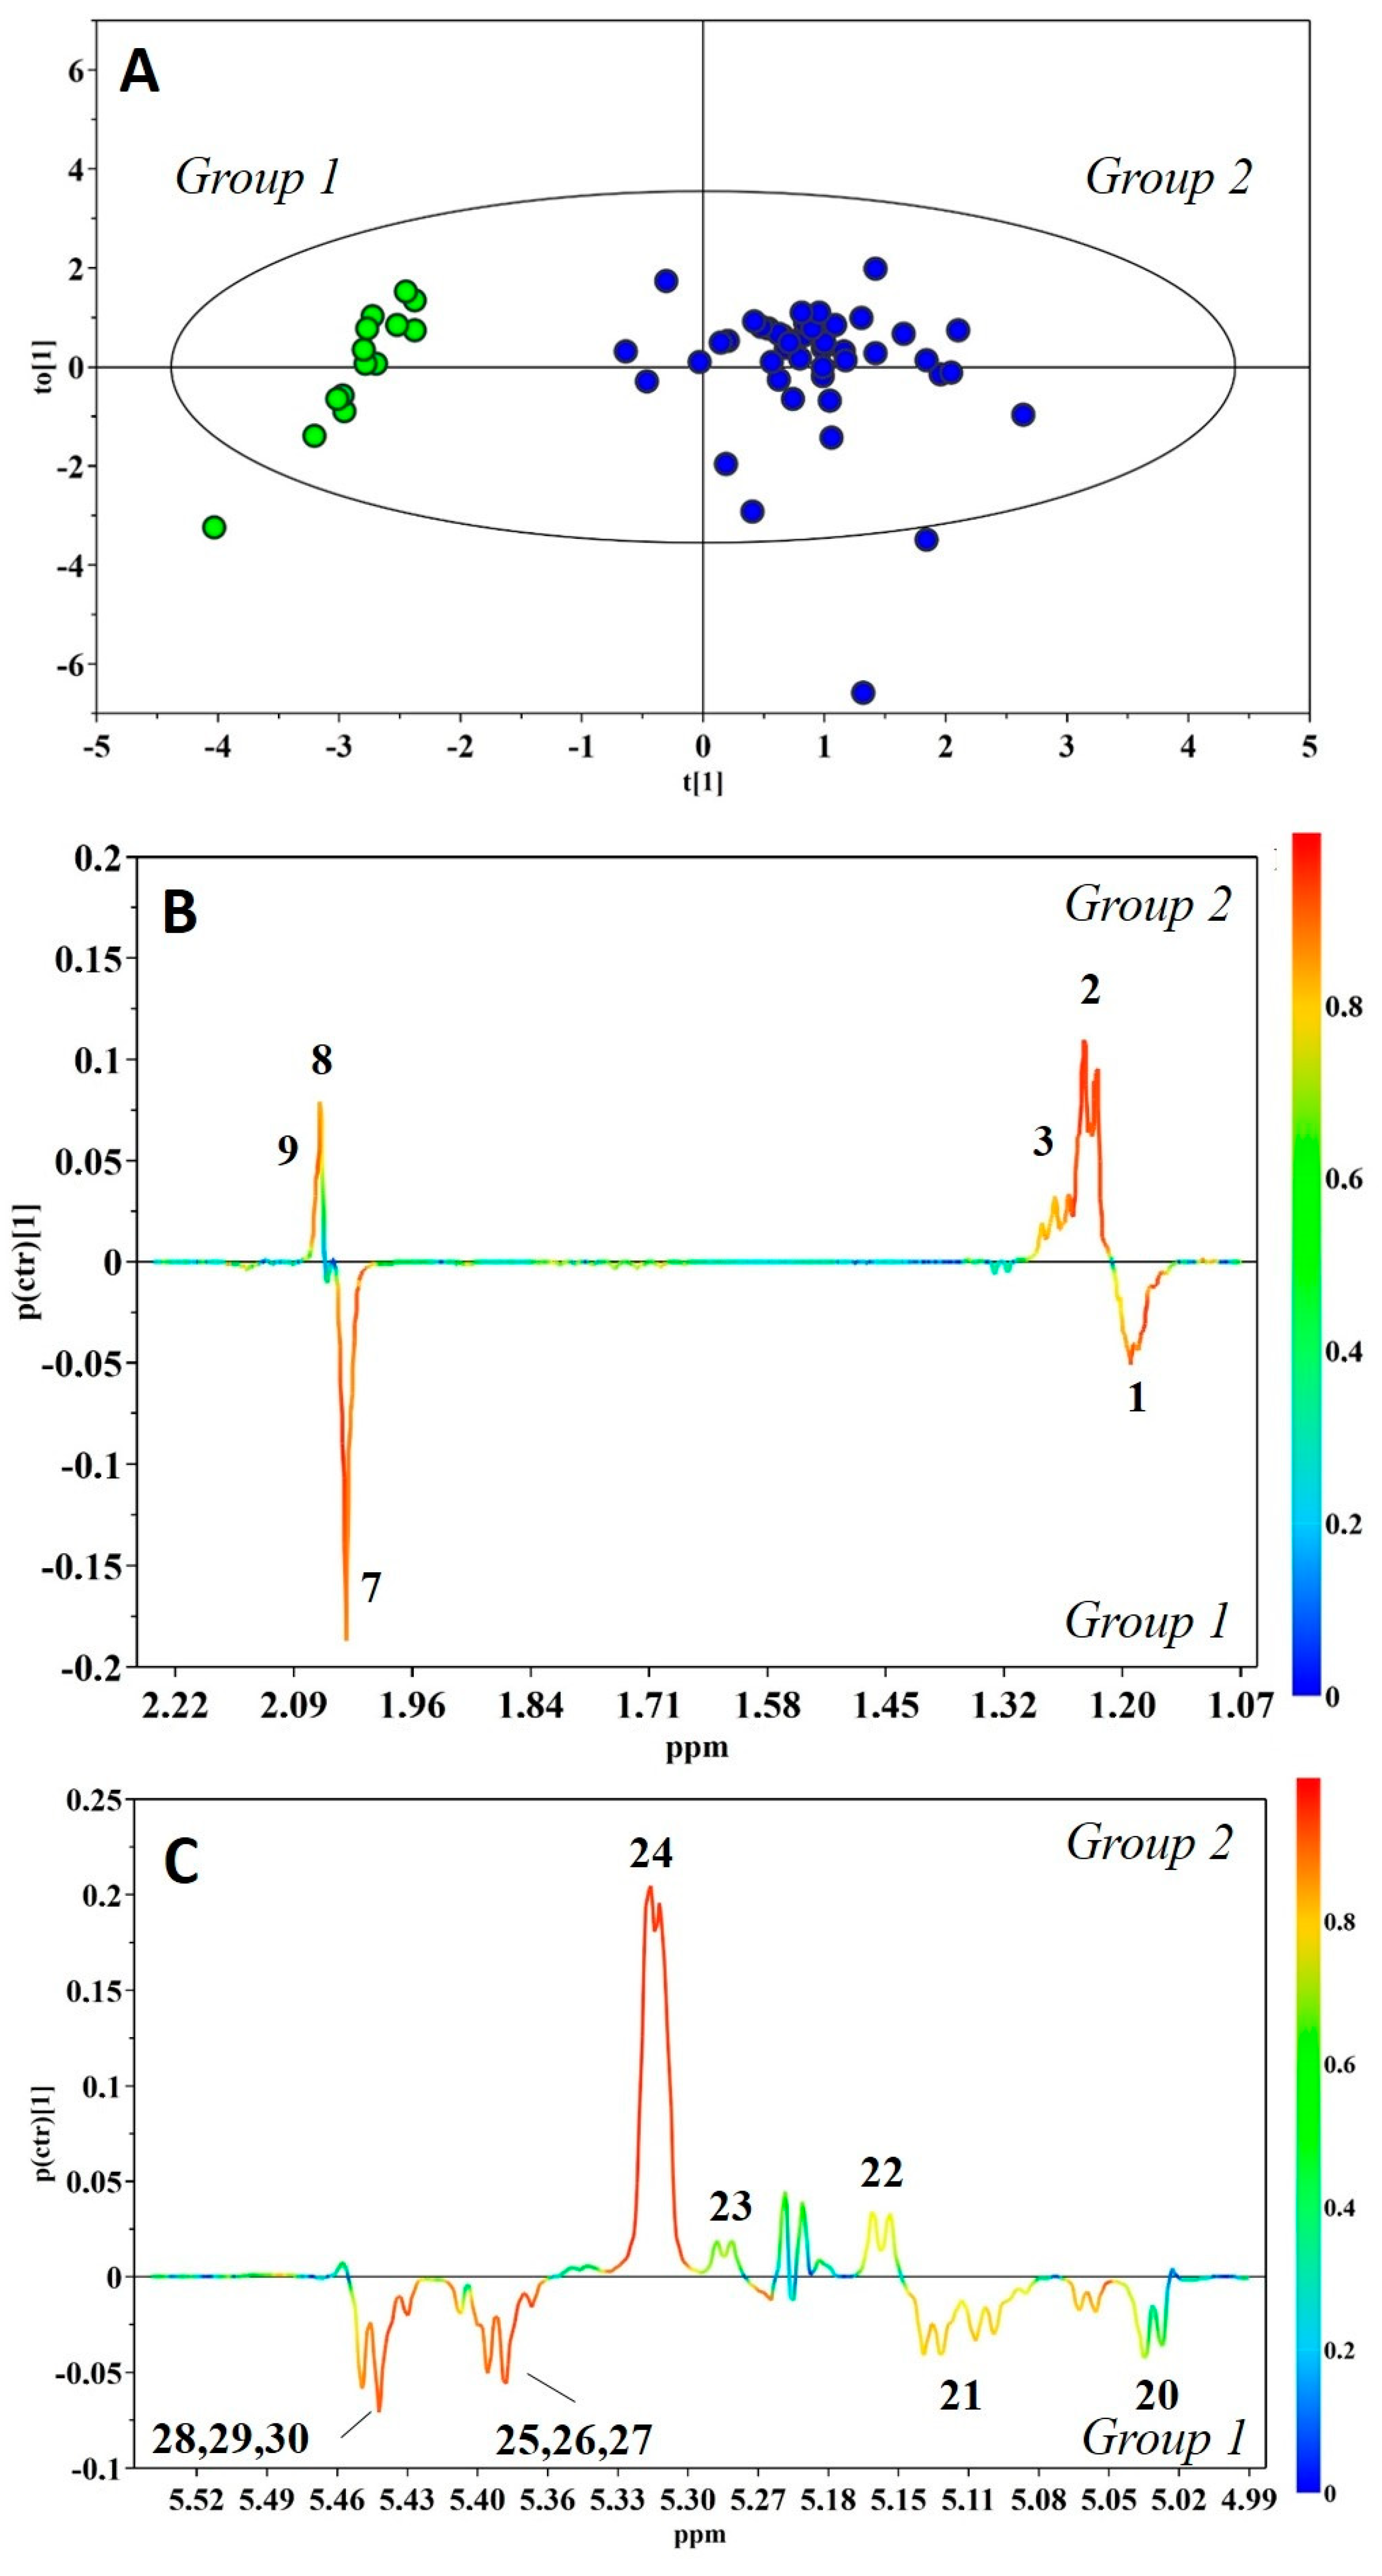
2. Results
3. Discussion
4. Material and Methods
4.1. Study Population
4.2. Milk Sample Preparation
4.3. Data Acquisition
4.4. Nuclear Magnetic Resonance Data Preparation
4.5. Multivariate Analysis of Milk Metabolic Profiles
5. Conclusions
Supplementary Materials
Author Contributions
Funding
Conflicts of Interest
References
- Jenness, R. The composition of human milk. Semin. Perinatol. 1979, 3, 225–239. [Google Scholar] [PubMed]
- Hassiotou, F.; Hartmann, P.E. At the Dawn of a New Discovery: The Potential of Breast Milk Stem Cells. Adv. Nutr. 2014, 5, 770–778. [Google Scholar] [CrossRef] [PubMed]
- Thurl, S.; Munzert, M.; Henker, J.; Boehm, G.; Müller-Werner, B.; Jelinek, J.; Stahl, B. Variation of human milk oligosaccharides in relation to milk groups and lactational periods. Br. J. Nutr. 2010, 104, 1261–1271. [Google Scholar] [CrossRef] [PubMed]
- Le Doare, K.; Holder, B.; Bassett, A.; Pannaraj, P.S. Mother’s Milk: A Purposeful Contribution to the Development of the Infant Microbiota and Immunity. Front. Immunol 2018, 9, 361. [Google Scholar] [CrossRef] [PubMed]
- Cesare Marincola, F.; Dessì, A.; Corbu, S.; Reali, A.; Fanos, V. Clinical impact of human breast milk metabolomics. Clin. Chim. Acta 2015, 451, 103–106. [Google Scholar] [CrossRef] [PubMed]
- Praticò, G.; Capuani, G.; Tommassini, A.; Baldassarre, M.E.; Delfini, M.; Miccheli, A. Exploring human breast milk composition by NMR-based metabolomics. Nat. Prod. Res. 2014, 28, 95–101. [Google Scholar] [CrossRef] [PubMed]
- Smilowitz, J.T.; O’Sullivan, A.; Barile, D.; German, J.B.; Lönnerdal, B.; Slupski, C.M. The human milk metabolome reveals diverse oligosaccharides profiles. J. Nutr. 2013, 143, 1709–1718. [Google Scholar] [CrossRef] [PubMed]
- Spevacek, A.R.; Smilowitz, J.T.; Chin, E.L.; Underwood, M.A.; German, J.B.; Slupsky, C.M. Infant Maturity at Birth Reveals Minor Differences in the Maternal Milk Metabolome in the First Month of Lactation. J. Nutr. 2015, 145, 1698–1708. [Google Scholar] [CrossRef] [PubMed]
- van Leeuwen, S.S.; Schoemaker, R.J.W.; Gerwig, G.J.; van Leusen-van Kan, E.J.M.; Dijkhuizen, L.; Kamerling, J.P. Rapid milk group classification by 1H NMR analysis of Le and H epitopes in human milk oligosaccharide donor samples. Glicobyology 2014, 24, 728–739. [Google Scholar] [CrossRef] [PubMed]
- Wu, J.; Domellöf, M.; Zivkovic, A.M.; Larsson, G.; Öhman, A.; Nording, M.L. NMR-based metabolite profiling of human milk: A pilot study of methods for investigating compositional changes during lactation. Biochem. Biophys. Res. Commun. 2016, 469, 626–632. [Google Scholar] [CrossRef] [PubMed]
- Castaniz-Muñoz, E.; Martin, M.J.; Prieto, P.A. 2-fucosillactose: An abundant, genetically determined soluble glycan present in human milk. Nutr. Rev. 2013, 71, 773–789. [Google Scholar] [CrossRef] [PubMed]
- Kunz, C.; Rudloff, S.; Baier, W.; Klein, N.; Strobel, S. Oligosaccharides in human milk: Structural, functional, and metabolic aspects. Annu. Rev. Nutr. 2000, 20, 699–722. [Google Scholar] [CrossRef] [PubMed]
- Morrow, A.L.; Meinzen-Derr, J.; Huang, P.; Schibler, K.R.; Cahill, T.; Keddache, M.; Kallapur, S.G.; Newburg, D.S.; Tabangin, M.; Warner, B.B.; et al. Fucosyltransferase 2 non-secretor and low secretor status predicts severe outcomes in premature infants. J. Pediatr. 2011, 158, 745–751. [Google Scholar] [CrossRef] [PubMed]
- Newburg, D.S.; Tanritanir, A.C.; Chakrabarti, S. Lactodifucotetraose, a human milk oligosaccharide, attenuates platelet function and inflammatory cytokine release. J. Thromb. Thrombolysis. 2016, 42, 46–55. [Google Scholar] [CrossRef] [PubMed]
- Davis, J.C.; Lewis, Z.T.; Krishnan, S.; Bernstein, R.M.; Moore, S.E.; Prentice, A.M.; Mills, D.A.; Lebrilla, C.B.; Zivkovic, A.M. Growth and Morbidity of Gambian Infants are Influenced by Maternal Milk Oligosaccharides and Infant Gut Microbiota. Sci. Rep. 2017, 7, 40466. [Google Scholar] [CrossRef] [PubMed]
- Vandaraj, S.; Helal, M.; Duska-McEwen, G.O.; Boslett, J.; Pereira, S.L.; Buck, R.H.; Ahmed, N.; Zweier, J.L. The Human Milk Oligosaccharide 3-fucosillactose facilitates pereservation of Nitric Oxide-Induced Vasodilation in Aortic Vessels in Vitro. FASEB J. 2017, 31, 1. [Google Scholar]
- Sela, D.A. Bifidobacterial utilization of human milk oligosaccharides. Int. J. Food Microbiol. 2011, 149, 58–64. [Google Scholar] [CrossRef] [PubMed]
- Quigley, M.A.; Henderson, G.; Anthony, M.Y.; McGuire, W. Formula milk versus donor breast milk for feeding preterm or low birth weight infants. Cochrane. Database Syst. Rev. 2007, 17, CD002971. [Google Scholar]
- De Leoz, M.L.A.; Gaerlan, S.C.; Strum, J.S.; Dimapasoc, L.M.; Mirmiran, M.; Tancredi, D.J.; Smilowitz, J.T.; Kalanetra, K.M.; Mills, D.A.; German, J.B.; et al. Lacto-N-Tetraose, Fucosylation, and Secretor Status are Highly Variable in Human Milk Oligosaccharides from Women Delivering Preterm. J. Prot. Res. 2012, 11, 4662–4672. [Google Scholar] [CrossRef] [PubMed]
- Gardosi, J.; Mongelli, M.; Wilcox, M.; Chang, A. An adjustable fetal weight standard. Ultrasound. Obstet. Gynecol. 1995, 6, 168–174. [Google Scholar] [CrossRef] [PubMed]
- Westerhuis, J.A.; Hoefsloot, H.C.J.; Smit, S.; Vis, D.J.; Smilde, A.K.; van Velzen, E.J.J.; van Duijnhoven, J.P.M.; van Dorsten, F.A. Assessment of PLSDA cross validation. Metabolomics 2008, 4, 81–89. [Google Scholar] [CrossRef]
- Fanos, V.; Pintus, R.; Reali, A.; Dessì, A. Miracles and Mysteries of Breastmilk from Egyptian to 3M’s (Metabolomics, Microbiomics, Multipotent Stem Cells). J. Pediatr. Neonat. Med. 2017, 6, e0606204. [Google Scholar]
- Bardanzellu, F.; Fanos, V.; Reali, A. “Omics” in Human Colostrum and Matue Milk: Looking to Old data with new eyes. Nutrients 2017, 9, E843. [Google Scholar]
- Fanos, V.; Reali, A.; Marcialis, M.A.; Bardanzellu, F. What you have to know about Human Milk Oligosaccharides. J. Pediart. Neonat. Individual. Med. 2018, 7, e0707137. [Google Scholar]
- Marincola, F.C.; Noto, A.; Caboni, P.; Reali, A.; Barberini, L.; Lussu, M.; Murgia, F.; Santoru, M.L.; Atzori, L.; Fanos, V. A metabolomic study of preterm human and formula milk by high resolution NMR and GC/MS analysis: Preliminary results. J. Matern. Fetal. Neonatal. Med. 2012, 25, 62–67. [Google Scholar] [CrossRef] [PubMed]
- Bardanzellu, F.; Fanos, V.; Stringini, F.A.L.; Artini, P.G.; Peroni, D.G. Human Breast Milk: Exploring the Linking Ring Among Emerging Components. Front. Pediatr. 2018, 6, 215. [Google Scholar] [CrossRef] [PubMed]


| AGA (n = 46) | SGA (n = 10) | LGA (n = 2) | |
|---|---|---|---|
| Gestational age (weeks, mean ± SD) | 39.3 ± 1.5 | 39.2 ± 1.7 | 38.6 ± 0.1 |
| Maternal age (y, mean ± SD) | 31.0 ± 5.4 | 31.4 ± 4.9 | 34.5 ± 3.5 |
| Maternal BMI (kg/m2, mean ± SD) | 24.4 ± 4.8 | 22.7 ± 4.3 | 20.2 ± 1.7 |
| Cesarean delivery (%) | 52 | 80 | 50 |
| Gender (M/F) | 25/21 | 3/7 | 2/0 |
| Class | Members | Predicted | Corrected Predictions (%) |
|---|---|---|---|
| Group 1 | 5 | 5 | 100 |
| Group 2 | 10 | 10 | 100 |
© 2018 by the authors. Licensee MDPI, Basel, Switzerland. This article is an open access article distributed under the terms and conditions of the Creative Commons Attribution (CC BY) license (http://creativecommons.org/licenses/by/4.0/).
Share and Cite
Dessì, A.; Briana, D.; Corbu, S.; Gavrili, S.; Cesare Marincola, F.; Georgantzi, S.; Pintus, R.; Fanos, V.; Malamitsi-Puchner, A. Metabolomics of Breast Milk: The Importance of Phenotypes. Metabolites 2018, 8, 79. https://doi.org/10.3390/metabo8040079
Dessì A, Briana D, Corbu S, Gavrili S, Cesare Marincola F, Georgantzi S, Pintus R, Fanos V, Malamitsi-Puchner A. Metabolomics of Breast Milk: The Importance of Phenotypes. Metabolites. 2018; 8(4):79. https://doi.org/10.3390/metabo8040079
Chicago/Turabian StyleDessì, Angelica, Despina Briana, Sara Corbu, Stavroula Gavrili, Flaminia Cesare Marincola, Sofia Georgantzi, Roberta Pintus, Vassilios Fanos, and Ariadne Malamitsi-Puchner. 2018. "Metabolomics of Breast Milk: The Importance of Phenotypes" Metabolites 8, no. 4: 79. https://doi.org/10.3390/metabo8040079
APA StyleDessì, A., Briana, D., Corbu, S., Gavrili, S., Cesare Marincola, F., Georgantzi, S., Pintus, R., Fanos, V., & Malamitsi-Puchner, A. (2018). Metabolomics of Breast Milk: The Importance of Phenotypes. Metabolites, 8(4), 79. https://doi.org/10.3390/metabo8040079