1. Introduction
The assessment of female reproductive potential remains a central task in reproductive medicine. Anti-Müllerian hormone (AMH) has become the most widely used biochemical marker of ovarian reserve. AMH is a dimeric glycoprotein of the transforming growth factor-beta superfamily produced by the granulosa cells of preantral and small antral follicles [
1,
2], and its serum concentration reflects the size of the remaining growing follicle pool [
3,
4]. Unlike FSH and estradiol, AMH concentrations vary comparatively little across the menstrual cycle, which permits measurement on any cycle day [
5,
6].
AMH inhibits both the initial recruitment of primordial follicles and the cyclic selection of the dominant follicle and therefore acts as a negative regulator of follicular development [
7]. Serum concentrations peak during the third decade of life and decline thereafter, reflecting progressive follicular attrition [
8], becoming undetectable around menopause [
9]. This trajectory underlies the use of AMH in predicting the timing of menopause, in stratifying ovarian response before assisted reproductive technology, and in monitoring gonadotoxic treatment [
10,
11,
12,
13].
Reproductive function is not governed by AMH in isolation. Within the hypothalamic–pituitary–ovarian axis, FSH, luteinising hormone (LH), estradiol, progesterone, prolactin and androgens jointly regulate follicular development, ovulation and corpus luteum function [
14]. FSH drives antral follicle maturation, LH triggers ovulation and supports luteal function, and estradiol exerts negative feedback on FSH during the follicular phase before the midcycle surge that initiates ovulation [
15]. Prolactin modulates gonadotrophin secretion and may suppress ovarian function when chronically elevated [
16]. Androgens support early follicular growth at physiological concentrations, whereas androgen excess, as in polycystic ovary syndrome (PCOS), is associated with follicular arrest [
17].
An inverse association between serum AMH and basal FSH is well described: as follicular output falls, reduced inhibin B- and estradiol-mediated negative feedback is accompanied by a rise in pituitary FSH secretion [
18]. Conversely, the elevated AMH concentrations characteristic of PCOS frequently accompany an increased LH/FSH ratio [
19]. The relationship between AMH and estradiol is less consistent across studies, partly because of cycle-dependent variation in estradiol [
20]. Positive associations between AMH and testosterone have been reported in PCOS [
21], and reproductive and lifestyle factors, including body mass index and smoking are also associated with AMH concentrations [
22].
Two methodological issues recur in this literature. First, most studies analyse untransformed, markedly skewed hormone distributions with linear correlation methods, which can misrepresent the strength of an association. Second, AMH datasets drawn from clinical populations regularly contain a substantial proportion of results at the lower reporting limit of the assay. Substituting a fixed value for such results or analysing them as though they were measured, produces biassed estimates; methods for left-censored data are required instead [
23,
24]. AMH measurement is further complicated by differences between assay generations and platforms, which limit the comparability of absolute concentrations across studies [
25,
26].
Against this background, the present study examined the associations between serum AMH and age, FSH, LH, estradiol, progesterone and prolactin in a retrospective cohort of women attending a tertiary gynaecology outpatient clinic, using transformation to address skewness and a censored-outcome model to accommodate results at the assay floor. The aim was to determine which of these routinely measured variables remain associated with AMH after mutual adjustment within this dataset and not to derive reference intervals or normative data.
2. Materials and Methods
2.2. AMH Assay and Analytical Characteristics
Serum anti-Müllerian hormone (AMH) concentrations were measured using the VIDAS® AMH assay (Ref. 417011; bioMérieux, Marcy-l’Étoile, France) on the VIDAS® 3 automated immunoassay platform, based on the enzyme-linked fluorescent assay (ELFA) principle. The assay is validated for the quantitative determination of AMH in human serum and lithium-heparin plasma. In the present study, serum samples were used for AMH measurement, with a required sample volume of 200 μL.
According to the manufacturer’s specifications, the validated analytical measurement range of the VIDAS® AMH assay is 0.02–9.00 ng/mL. The limit of detection (LoD) is 0.01 ng/mL, whereas the lower limit of quantification (LoQ) is 0.02 ng/mL. Accordingly, 0.01 ng/mL represents the analytical detection limit, whereas 0.02 ng/mL represents the lowest concentration within the validated quantitative measurement range. Samples with AMH concentrations exceeding 9.00 ng/mL can be diluted according to the manufacturer’s recommended procedure and reanalysed, with the final concentration calculated using the appropriate dilution factor.
The manufacturer’s analytical precision evaluation included five AMH concentration levels (0.22, 1.08, 2.99, 5.45, and 7.37 ng/mL). Reported coefficients of variation (CVs) for repeatability (within-run precision) ranged from 4.1% to 4.8%, intra-lot CVs ranged from 6.6% to 8.2%, and intra-laboratory precision CVs ranged from 8.3% to 10.6%. The coefficient of variation between reagent lots did not exceed 11%.
Calibration and internal quality control procedures were performed in accordance with the manufacturer’s instructions. The VIDAS® AMH assay uses the S1 calibrator and C1 control, with calibration and control validity specified by the manufacturer. Calibration was performed according to the manufacturer’s recommendations and repeated when required, including following reagent-lot changes. Patient results were accepted only when internal quality control results fulfilled the laboratory’s predefined acceptance criteria. Other reproductive and pituitary hormones were measured using validated automated immunoassays according to the respective manufacturers’ instructions, with routine calibration and internal quality control procedures performed in accordance with the laboratory’s established quality-management procedures.
The same VIDAS® AMH assay and VIDAS® 3 platform were used throughout the study period, with no change in the AMH assay platform or reagent generation during the study period. Because the validated lower limit of quantification of the AMH assay was 0.02 ng/mL, 0.02 ng/mL was used as the censoring threshold in the revised Tobit analysis. The previous use of 0.01 ng/mL, corresponding to the assay LoD rather than the LoQ, was corrected in the revised statistical analysis.
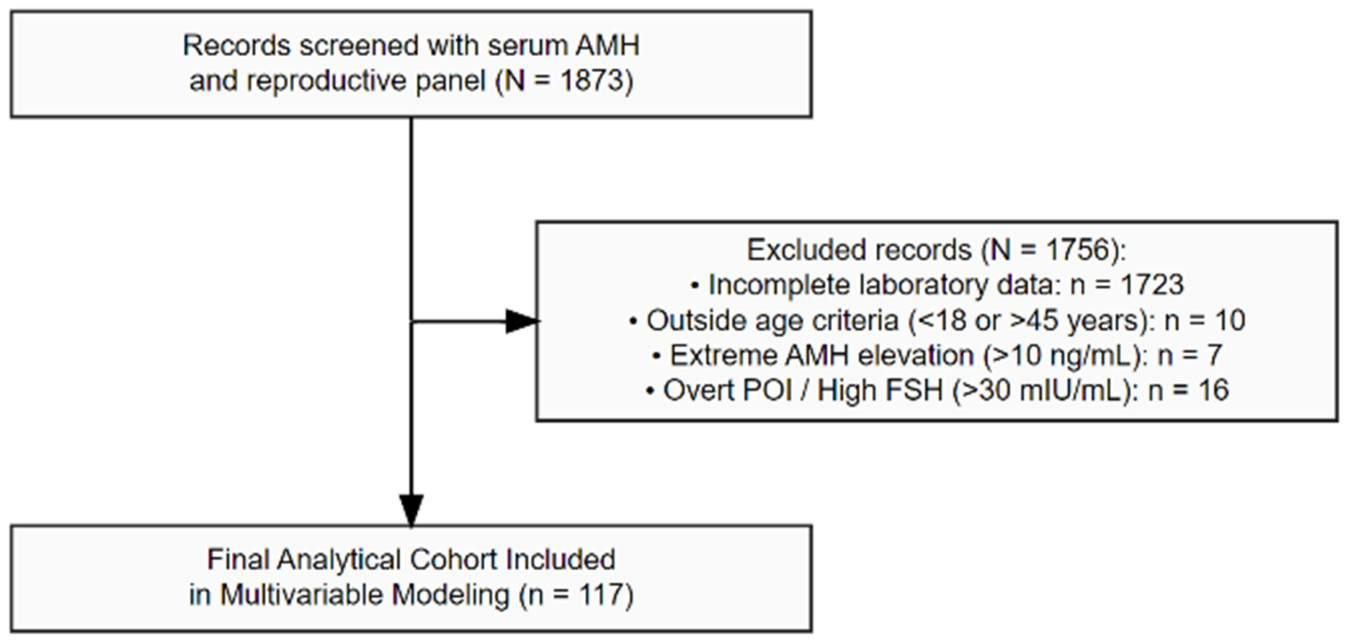
Serum AMH concentrations exceeding 10 ng/mL were considered high upper-tail observations for analytical purposes and were not interpreted as evidence of polycystic ovary syndrome (PCOS) or other pathology. Although elevated AMH concentrations may occur in women with PCOS, AMH alone is not sufficient to establish a diagnosis of PCOS, and high AMH values may also be observed in women without PCOS. Therefore, the threshold of 10 ng/mL was used solely as a laboratory-based eligibility criterion to limit the potential influence of extreme upper-tail observations on the primary statistical analysis and was not applied as a clinical diagnostic threshold.
Records with AMH > 10 ng/mL were excluded from the primary analysis to reduce the potential influence of extreme upper-tail observations on regression estimates. The clinical and endocrine characteristics of these women are presented in
Supplementary Table S2. To assess the robustness of the findings to the inclusion of these observations, all primary analyses were repeated with participants with AMH > 10 ng/mL retained in the dataset as a sensitivity analysis. The results were compared with those of the primary analysis.
2.5. Statistical Analysis
Continuous variables are summarised as mean ± standard deviation, median with interquartile range, and minimum–maximum values (n = 117), with the number of available observations reported for each variable.
Serum hormone concentrations were markedly right-skewed and were therefore analysed both untransformed and after Box–Cox power transformation [
28]. The transformation was defined as y(λ) = (y
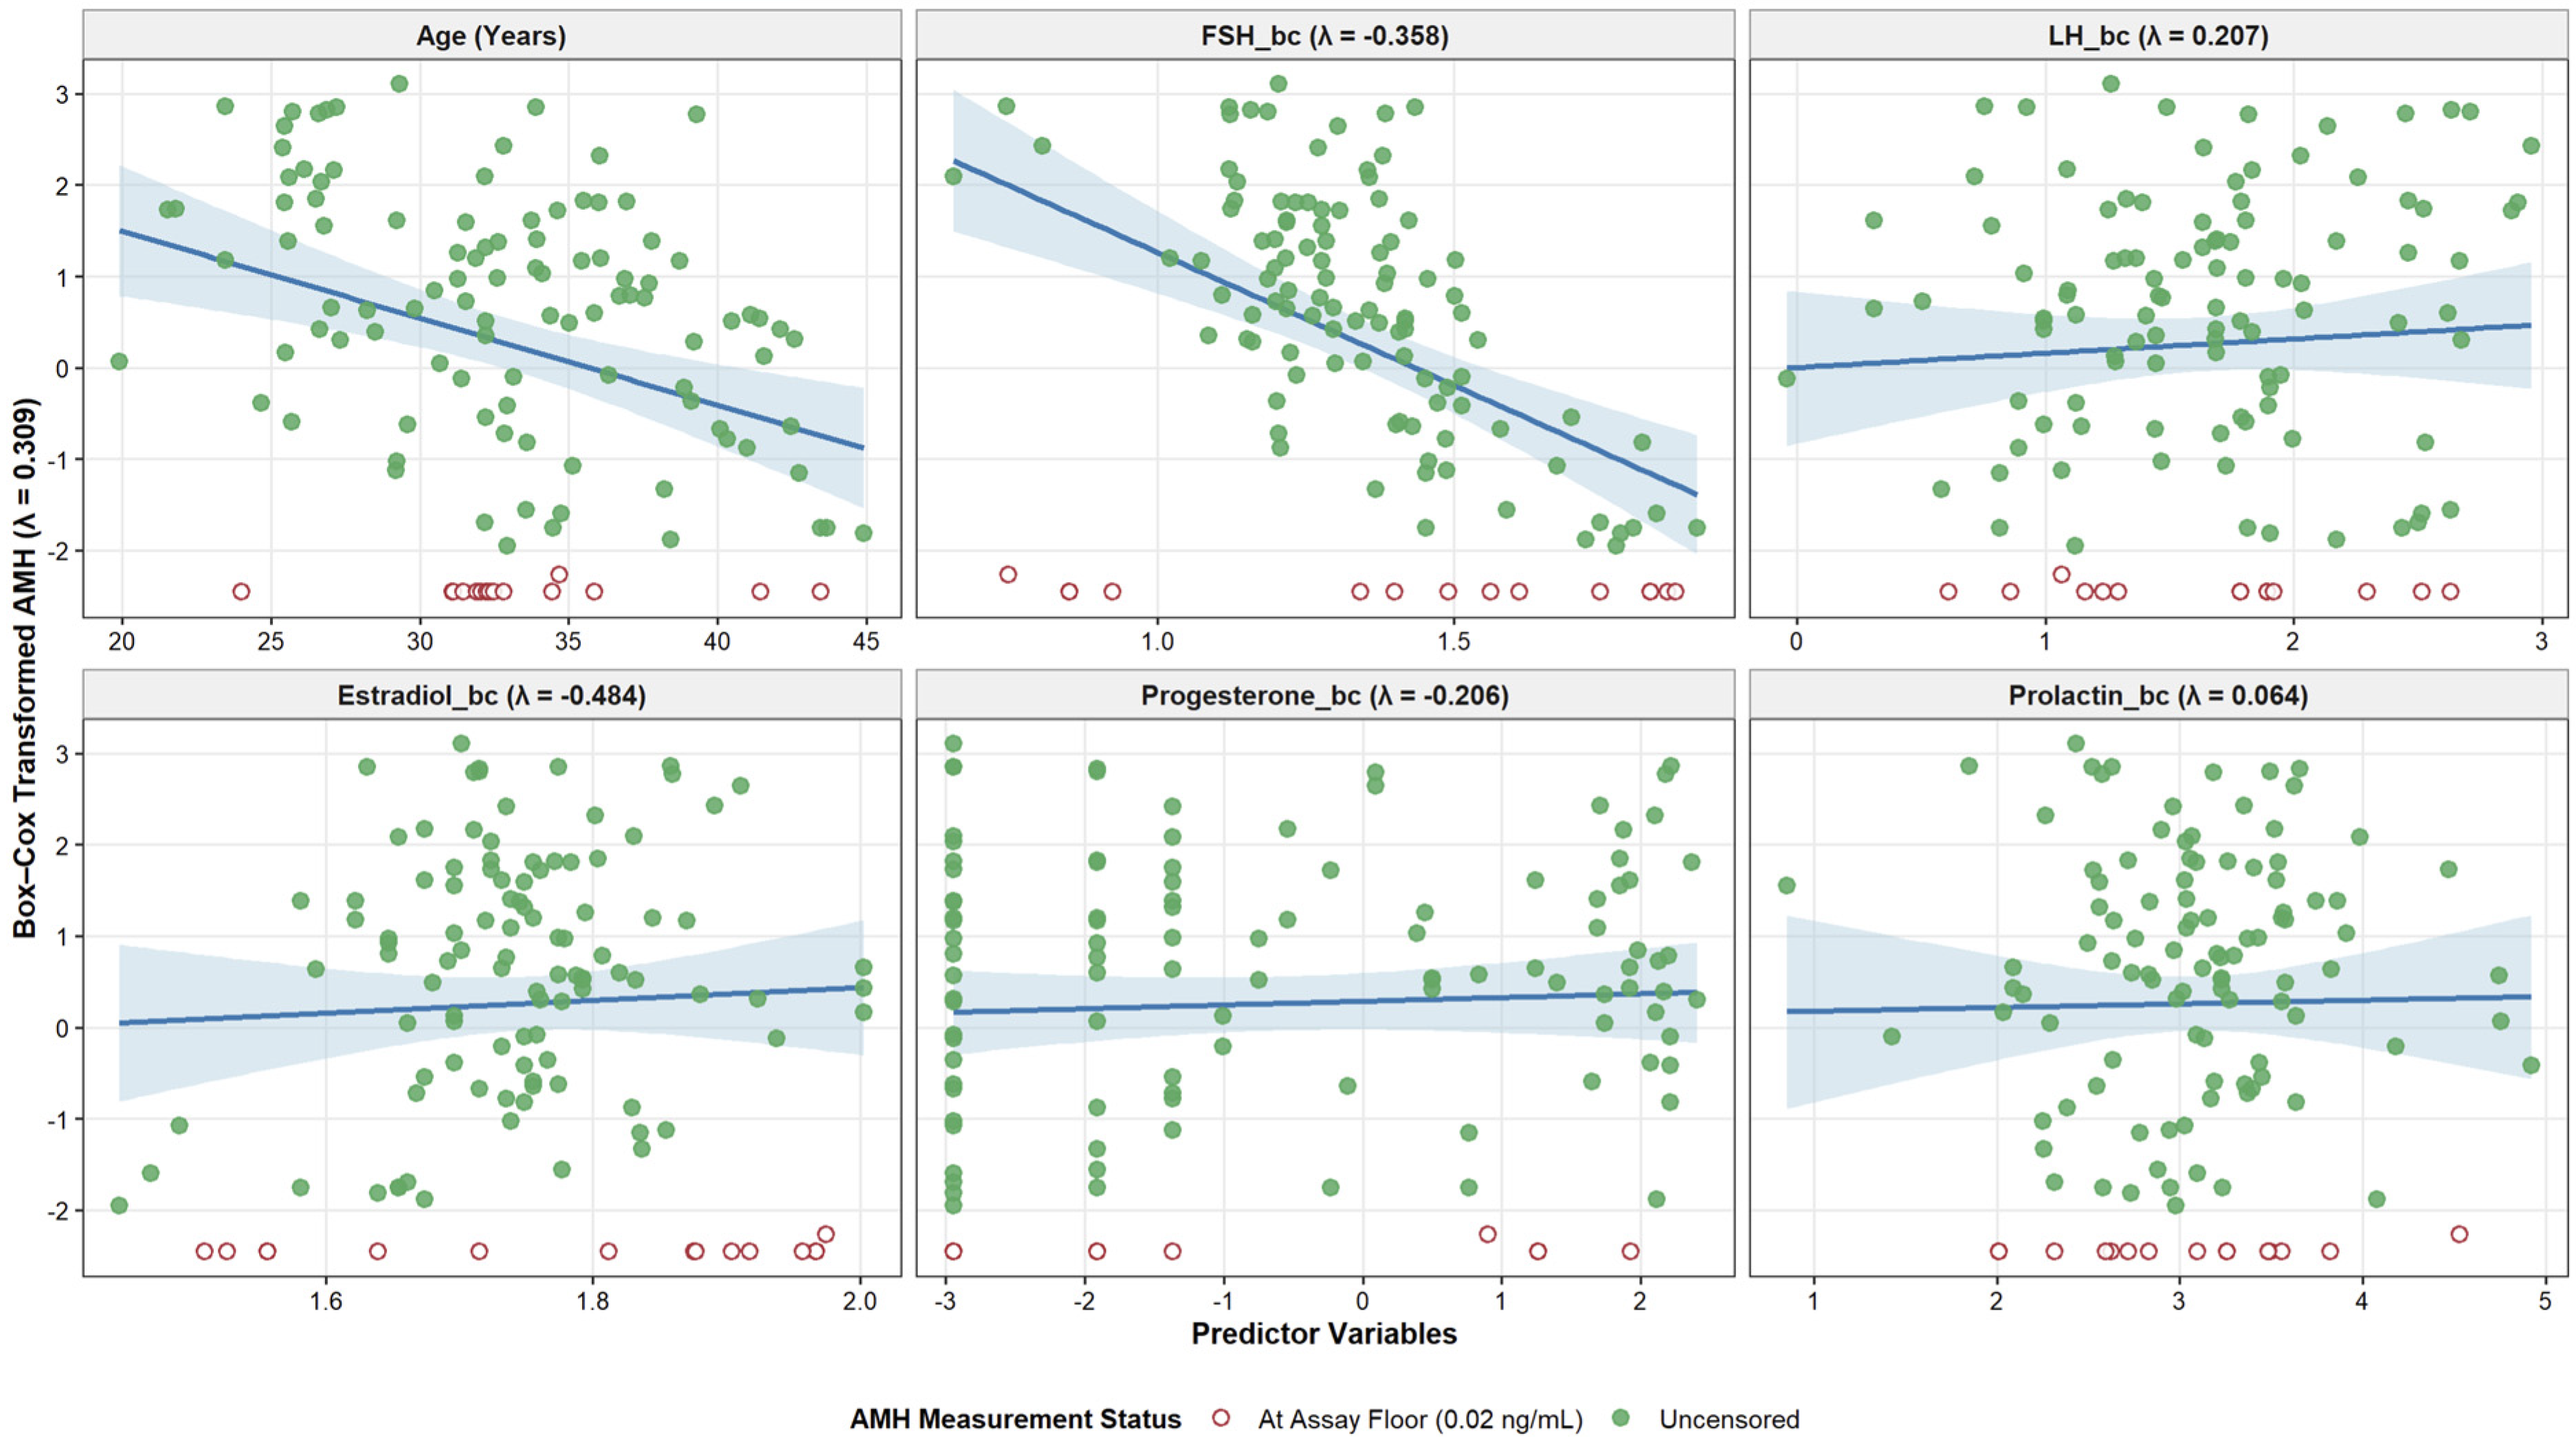
λ − 1)/λ for λ ≠ 0 and y(λ) = ln(y) for λ = 0. For each variable, the optimal power parameter (λ) was estimated by maximum likelihood: the profile log-likelihood was first evaluated over a coarse grid from −2.000 to +2.000 to locate the neighbourhood of the optimum, and the optimum was then identified over a fine grid in increments of 0.001, using the boxcox function of the MASS package; the value maximising the log-likelihood was retained. Estimated λ parameters were: AMH (λ = 0.309), FSH (λ = −0.358), LH (λ = 0.207), estradiol (λ = −0.484), progesterone (λ = −0.206), and prolactin (λ = 0.064); age was not transformed. λ estimates and their 95% confidence intervals are given in
Supplementary Table S3.
Bivariate associations were quantified with Pearson correlation coefficients on both scales and with Spearman rank correlation coefficients.
Because 12.82% (
n = 15) of AMH results lay at the analytical reporting floor (0.02 ng/mL), the multivariable analysis used a Tobit model for a left-censored outcome [
23,
24], fitted by maximum likelihood using the AER package. The dependent variable was Box–Cox-transformed AMH. Critically, the censoring limit supplied to the model was the Box–Cox transform of 0.02 ng/mL evaluated at λ = 0.309 (BC
AMH = −2.270), rather than the untransformed value, so that the censoring point corresponded to the scale on which the outcome was modelled.
Predictors were specified a priori on clinical and physiological grounds rather than selected according to their bivariate association with the outcome, because data-driven selection based on a correlation threshold produces unstable estimates and standard errors that are conditional on the selection step [
29]. The prespecified model therefore included age, FSH_bc, LH_bc, estradiol_bc, progesterone_bc, and prolactin_bc, each on its transformed scale where applicable; prolactin, which had previously been omitted on the basis of its bivariate coefficient, was retained.
Because the decline of AMH with age is known to be non-linear, age was additionally modelled with a restricted cubic spline with knots at the 10th, 50th, and 90th percentiles, and the linear and spline specifications were compared by likelihood ratio test; the linear specification was retained only if it was not rejected.
Model diagnostics indicated no evidence of problematic multicollinearity, with variance inflation factors (VIF) ranging from 1.044 to 1.349 (
Supplementary Table S1). Diagnostics further comprised inspection of standardised residuals against fitted values, quantile–quantile plots of residuals (
Supplementary Figure S1), and assessment of influential observations. Effect estimates are reported as unstandardised coefficients (β) with 95% confidence intervals. Because predictors were transformed with different λ values, unstandardized coefficients are not directly comparable across predictors; average marginal effects on the AMH_bc scale and standardized beta coefficients (β*), obtained after scaling each predictor to unit standard deviation, are reported in
Supplementary Table S4 and used for direct effect comparisons across transformed predictors.
Sensitivity analyses were: (a) inclusion of the seven women with AMH above 10 ng/mL; (b) log-transformation of AMH in place of the Box–Cox transformation; and (c) flexible modelling of age with restricted cubic splines;
All tests were two-sided with a significance threshold of 0.05. Analyses were performed in R version 4.5.1 (R Foundation for Statistical Computing, Vienna, Austria) using the packages AER (v1.2.15), MASS (v7.3.65), Hmisc (v5.2.4), rms, and ggplot2 (v4.0.3).
4. Discussion
In this retrospective cross-sectional study of women attending a tertiary gynaecology clinic, age and FSH were the only variables that remained independently associated with serum AMH after mutual adjustment within a model that explicitly accommodated results at the analytical reporting floor. LH, estradiol, progesterone and prolactin showed no statistically significant bivariate association with AMH, whether analysed on the raw or Box–Cox-transformed scale, and none reached conventional significance after adjustment for age and FSH, although the estimate for estradiol_bc lay close to the conventional threshold (p = 0.055).
The inverse association between age and AMH, and its persistence after adjustment for FSH, is consistent with the established trajectory of follicular attrition with age [
8,
9]. That age remained independently associated with AMH after adjustment for FSH suggests that the age-related decline in AMH is not fully captured by the gonadotrophin feedback loop and reinforces the case for age-specific interpretation of AMH values rather than reliance on a single universal threshold. A recent large cohort study spanning nearly 23,000 women constructed an age-stratified AMH nomogram and reported that the sharp decline in AMH levels, particularly after age 36, underscores the need for timely fertility evaluation, especially in populations at higher risk of diminished ovarian reserve, a finding that closely parallels the age dependence observed in the present cohort [
10,
13,
30,
31].
FSH showed the most consistent association with AMH across analytical frameworks. On the raw scale, the Pearson coefficient (r = −0.445) was smaller in magnitude than the Spearman coefficient (ρ = −0.503), a pattern consistent with a monotonic but non-linear relationship. Box–Cox transformation moved the Pearson coefficient towards the rank-based estimate (r = −0.454), although a residual difference remained; the corresponding convergence was more complete for age, where the Pearson coefficient shifted from −0.376 to −0.330 against a Spearman coefficient of −0.317. This pattern indicates that linear correlation applied to untransformed, skewed hormone data does not fully capture the FSH–AMH relationship and that rank-based or transformation-based estimates should be reported alongside it. The direction of the association is consistent with the classical model in which declining follicular output reduces inhibin B- and estradiol-mediated negative feedback, accompanied by a compensatory rise in FSH [
18]. It is nonetheless worth noting that basal FSH is widely regarded as a comparatively late and insensitive marker of declining ovarian reserve; as summarised in a recent review, FSH’s limited predictive value is illustrated by NHANES III data showing that most women aged 40–44 years still had FSH concentrations within the conventionally normal range, despite ovarian factors typically being rate-limiting at this age, and AMH is generally considered to outperform FSH as a predictor of ovarian response [
32]. This body of evidence is compatible with, rather than contradictory to, the present findings: the association we observed describes how AMH and FSH co-vary within this cohort, not the relative clinical sensitivity of either marker in detecting diminished reserve. Because the predictors in this analysis were transformed on different scales, the relative magnitude of the FSH and age coefficients cannot be inferred from the unstandardised estimates; standardised comparisons are reported separately in
Supplementary Table S4, where the standardised association was greater in magnitude for FSH_bc (β* = −0.559) than for age (β* = −0.234).
The absence of an independent association for LH, estradiol and progesterone after adjustment admits two explanations that this dataset cannot distinguish. The first is that their crude associations with AMH, where present in other populations, largely reflect variance shared with the age–FSH axis rather than independent biological information [
14,
18]. The second, and equally plausible, explanation is measurement variability: FSH, LH, estradiol and progesterone vary substantially across the menstrual cycle, and samples in this study were obtained during routine clinical care rather than on a standardised cycle day. Non-differential measurement error of this kind attenuates observed associations towards the null, so the absence of significant associations for the cycle-dependent hormones may partly reflect the timing of sampling rather than a true absence of a biological relationship. This interpretation is consistent with the previously reported inconsistency of the AMH–estradiol relationship across studies [
20,
25]. No inference about the clinical value of measuring these hormones can be drawn from this analysis. This caution is consistent with current guidance, which emphasises that ovarian reserve markers quantify the size of the remaining follicle pool rather than reproductive potential and that a diminished AMH concentration is in itself a poor predictor of natural fertility [
12,
33].
Prolactin was not associated with AMH in bivariate analysis and was not independently associated with AMH in the adjusted model. Within the physiological range represented in this cohort, prolactin does not appear to relate meaningfully to AMH concentrations; associations reported previously may be confined to pathological hyperprolactinaemic states [
16], which were largely absent here.
Two methodological points merit emphasis. First, the marked skewness of the raw hormone distributions indicates that correlation analyses based on untransformed endocrine data may not adequately represent the underlying associations. This was most evident for age, where the Pearson coefficient converged closely on the rank-based estimate after transformation, and was present to a lesser degree for FSH [
28,
29]. Second, left-censoring at the assay floor is a structural feature of clinical AMH datasets that include women with severely diminished ovarian reserve and is frequently disregarded in the literature. Ordinary least-squares regression applied to such data yields biassed coefficients; a model for censored outcomes is the appropriate alternative [
23,
24]. It should be noted, however, that the estimated scale parameter of a Tobit model quantifies residual dispersion and does not in itself constitute evidence of model fit, precision, or adequate accommodation of heteroscedasticity; this was instead assessed through the residual diagnostics summarised in
Supplementary Figure S1.
This study has several important limitations. The cohort consists of women attending a tertiary gynaecology clinic who underwent both AMH testing and an extended hormone panel and therefore constitutes a highly selected clinical sample. It is not representative of the general population of women of reproductive age, and the findings cannot be generalised beyond comparable clinical settings. Consequently, the study does not provide normative or population-specific data and does not establish reference intervals, which would require a defined reference population, prespecified health criteria, age stratification and an appropriate reference-interval methodology [
34]. Second, the design is retrospective and cross-sectional, so the observed associations are adjusted associations within a single dataset and cannot establish determinants, biological independence or causal relationships. Third, hormone measurements were not standardised to menstrual cycle day, which limits the interpretation of the associations of the cycle-dependent hormones as discussed above. Fourth, information on indication for testing, infertility status, contraceptive and fertility treatment use, body mass index and smoking was unavailable, raising the possibility of residual confounding [
16]. Fifth, women with PCOS were excluded, which improves internal validity by removing a condition in which the AMH–LH/FSH relationship differs substantially but limits generalisability to this subgroup, which is common in the source population [
35]. Sixth, total testosterone was not available for the analysed cohort, and the hormone panel examined here is therefore not a complete reproductive hormone profile. Seventh, the study was conducted in a single centre with a single laboratory, and AMH results are known to differ between assay generations and platforms, which limits the transferability of the absolute concentrations reported here [
25,
26]. Finally, the study did not evaluate diagnostic performance, treatment outcomes or cost-effectiveness, and no recommendation regarding the composition of hormonal testing panels can be derived from these data.
Author Contributions
M.H.K.: Conceptualization; Data curation; Formal analysis; Investigation; Methodology; Validation; Visualisation; Writing—original draft. B.D.: Conceptualization; Formal analysis; Funding acquisition; Investigation; Methodology; Project administration; Resources; Supervision; Validation; Writing—review and editing. A.P.: Data curation; Formal analysis; Investigation; Validation; Writing—original draft. S.K.S.: Investigation; Validation; Writing—original draft. T.E.: Formal analysis; Investigation; Visualisation; Writing—original draft. A.G.Y.: Funding acquisition; Resources; Supervision; Writing—review and editing. All authors have read and agreed to the published version of the manuscript.
Funding
This research did not receive any specific grant from funding agencies in the public, commercial, or not-for-profit sectors.
Institutional Review Board Statement
This retrospective study was approved by the Istanbul Atlas University Non-Interventional Clinical Research Ethics Committee (Approval No. 06/09, dated 22 June 2026). The study was conducted in accordance with the principles of the Declaration of Helsinki. Given the retrospective design of the study and the use of anonymized patient data obtained from hospital information systems, individual informed consent was not obtained. The requirement for informed consent was waived by the Ethics Committee.
Informed Consent Statement
Informed consent was not obtained from individual participants because of the retrospective design of the study and the use of anonymized patient data. The requirement for informed consent was waived by the Istanbul Atlas University Non-Interventional Clinical Research Ethics Committee (Approval No. 06/09, dated 22 June 2026).
Data Availability Statement
The deidentified individual-level dataset analysed in this study is available from the corresponding author upon reasonable request, subject to approval by the Istanbul Atlas University Ethics Committee. Aggregate and excluded-patient data are provided in
Supplementary Tables S1–S4.
Conflicts of Interest
The authors declare no conflicts of interest.
References
- Dewailly, D.; Andersen, C.Y.; Balen, A.; Broekmans, F.; Dilaver, N.; Fanchin, R.; Griesinger, G.; Kelsey, T.W.; La Marca, A.; Lambalk, C.; et al. The physiology and clinical utility of anti-Müllerian hormone in women. Hum. Reprod. Update 2014, 20, 370–385. [Google Scholar] [CrossRef] [Scilit]
- Moolhuijsen, L.M.E.; Visser, J.A. Anti-Müllerian hormone and ovarian reserve: Update on assessing ovarian function. J. Clin. Endocrinol. Metab. 2020, 105, 3361–3373. [Google Scholar] [CrossRef] [Scilit]
- La Marca, A.; Sunkara, S.K. Individualization of controlled ovarian stimulation in IVF using ovarian reserve markers: From theory to practice. Hum. Reprod. Update 2014, 20, 124–140. [Google Scholar] [CrossRef] [Scilit]
- Cedars, M.I. Evaluation of female fertility—AMH and ovarian reserve testing. J. Clin. Endocrinol. Metab. 2022, 107, 1510–1519. [Google Scholar] [CrossRef] [Scilit]
- Broer, S.L.; Broekmans, F.J.M.; Laven, J.S.E.; Fauser, B.C.J.M. Anti-Müllerian hormone: Ovarian reserve testing and its potential clinical implications. Hum. Reprod. Update 2014, 20, 688–701. [Google Scholar] [CrossRef] [Scilit]
- Iliodromiti, S.; Kelsey, T.W.; Anderson, R.A.; Nelson, S.M. Can anti-Müllerian hormone predict the diagnosis of polycystic ovary syndrome? A systematic review and meta-analysis of extracted data. J. Clin. Endocrinol. Metab. 2013, 98, 3332–3340. [Google Scholar] [CrossRef] [Scilit]
- Durlinger, A.L.; Visser, J.A.; Themmen, A.P. Regulation of ovarian function: The role of anti-Müllerian hormone. Reproduction 2002, 124, 601–609. [Google Scholar] [CrossRef]
- Bentzen, J.G.; Forman, J.L.; Johannsen, T.H.; Pinborg, A.; Larsen, E.C.; Andersen, A.N. Ovarian antral follicle subclasses and anti-Müllerian hormone during normal reproductive aging. J. Clin. Endocrinol. Metab. 2013, 98, 1602–1611. [Google Scholar] [CrossRef] [Scilit]
- Sowers, M.R.; Eyvazzadeh, A.D.; McConnell, D.; Yosef, M.; Jannausch, M.L.; Zhang, D.; Harlow, S.; Randolph, J.F. Anti-mullerian hormone and inhibin B in the definition of ovarian aging and the menopause transition. J. Clin. Endocrinol. Metab. 2008, 93, 3478–3483. [Google Scholar] [CrossRef] [Scilit]
- Iliodromiti, S.; Nelson, S.M. Ovarian response biomarkers: Physiology and performance. Curr. Opin. Obstet. Gynecol. 2015, 27, 182–186. [Google Scholar]
- Decanter, C.; Morschhauser, F.; Pigny, P.; Lefebvre, C.; Gallo, C.; Dewailly, D. Anti-Müllerian hormone follow-up in young women treated by chemotherapy for lymphoma: Preliminary results. Reprod. BioMed. Online 2010, 20, 280–285. [Google Scholar] [CrossRef] [Scilit]
- Practice Committee of the American Society for Reproductive Medicine; Practice Committee of the American Society for Reproductive Medicine. Testing and interpreting measures of ovarian reserve: A committee opinion. Fertil. Steril. 2020, 114, 1151–1157. [Google Scholar] [CrossRef] [Scilit]
- Nelson, S.M.; Davis, S.R.; Kalantaridou, S.; Lumsden, M.A.; Panay, N.; Anderson, R.A. Anti-Müllerian hormone for the diagnosis and prediction of menopause: A systematic review. Hum. Reprod. Update 2023, 29, 327–346. [Google Scholar] [CrossRef] [Scilit]
- Hall, J.E. Endocrinology of the menopause. Endocrinol. Metab. Clin. N. Am. 2015, 44, 485–496. [Google Scholar] [CrossRef] [Scilit]
- Messinis, I.E.; Messini, C.I.; Dafopoulos, K. Novel aspects of the endocrinology of the menstrual cycle. Reprod. BioMed. Online 2014, 28, 714–722. [Google Scholar] [CrossRef] [Scilit]
- Kaiser, U.B. Hyperprolactinemia and infertility: New insights. J. Clin. Investig. 2012, 122, 3467–3468. [Google Scholar] [CrossRef] [Scilit]
- Rosenfield, R.L.; Ehrmann, D.A. The pathogenesis of polycystic ovary syndrome (PCOS): The hypothesis of PCOS as functional ovarian hyperandrogenism revisited. Endocr. Rev. 2016, 37, 467–520. [Google Scholar] [CrossRef] [Scilit]
- Broekmans, F.J.; Kwee, J.; Hendriks, D.J.; Mol, B.W.; Lambalk, C.B. A systematic review of tests predicting ovarian reserve and IVF outcome. Hum. Reprod. Update 2006, 12, 685–718. [Google Scholar] [CrossRef] [Scilit]
- Teede, H.J.; Tay, C.T.; Laven, J.J.E.; Dokras, A.; Moran, L.J.; Piltonen, T.T.; Costello, M.F.; Boivin, J.; Redman, L.M.; Boyle, J.A.; et al. Recommendations from the 2023 international evidence-based guideline for the assessment and management of polycystic ovary syndrome. J. Clin. Endocrinol. Metab. 2023, 108, 2447–2469. [Google Scholar] [CrossRef] [Scilit] [PubMed]
- Sowers, M.R.; Zheng, H.; McConnell, D.; Nan, B.; Harlow, S.D.; Randolph, J.F., Jr. Anti-Müllerian hormone and inhibin B variability during normal menstrual cycles. Fertil. Steril. 2010, 94, 1482–1486. [Google Scholar] [CrossRef] [Scilit]
- Li, Y.; Zhai, Y.; Li, L.; Lu, Y.; Su, S.; Liu, Y.; Xu, Z.; Xin, M.; Zhang, Q.; Cao, Z. Divergent associations between serum androgens and ovarian reserve markers revealed in patients with polycystic ovary syndrome. Front. Endocrinol. 2022, 13, 879789. [Google Scholar] [CrossRef] [Scilit]
- Dólleman, M.; Verschuren, W.M.M.; Eijkemans, M.J.C.; Dollé, M.E.T.; Jansen, E.H.J.M.; Broekmans, F.J.M.; van der Schouw, Y.T. Reproductive and lifestyle determinants of anti-Müllerian hormone in a large population-based study. J. Clin. Endocrinol. Metab. 2013, 98, 2106–2115. [Google Scholar]
- Tobin, J. Estimation of relationships for limited dependent variables. Econometrica 1958, 26, 24–36. [Google Scholar] [CrossRef] [Scilit]
- Helsel, D.R. Statistics for Censored Environmental Data Using Minitab and R, 2nd ed.; John Wiley & Sons: Hoboken, NJ, USA, 2012. [Google Scholar]
- Pigny, P.; Gorisse, E.; Ghulam, A.; Robin, G.; Catteau-Jonard, S.; Duhamel, A.; Dewailly, D. Comparative assessment of five serum antimüllerian hormone assays for the diagnosis of polycystic ovary syndrome. Fertil. Steril. 2016, 105, 1063–1069.e3. [Google Scholar] [CrossRef] [Scilit]
- Punchoo, R.; Bhoora, S. Variation in the Measurement of Anti-Müllerian Hormone—What Are the Laboratory Issues? Front. Endocrinol. 2021, 12, 719029. [Google Scholar] [CrossRef] [Scilit]
- von Elm, E.; Altman, D.G.; Egger, M.; Pocock, S.J.; Gøtzsche, P.C.; Vandenbroucke, J.P.; Initiative, S. The Strengthening the Reporting of Observational Studies in Epidemiology (STROBE) statement: Guidelines for reporting observational studies. Lancet 2007, 370, 1453–1457. [Google Scholar] [CrossRef] [Scilit] [PubMed]
- Box, G.E.P.; Cox, D.R. An analysis of transformations. J. R. Stat. Soc. Ser. B Stat. Methodol. 1964, 26, 211–252. [Google Scholar] [CrossRef] [Scilit]
- Harrell, F.E., Jr. Regression Modeling Strategies: With Applications to Linear Models, Logistic and Ordinal Regression, and Survival Analysis, 2nd ed.; Springer: Berlin/Heidelberg, Germany, 2015. [Google Scholar]
- Nelson, S.M.; Iliodromiti, S.; Fleming, R.; Anderson, R.; McConnachie, A.; Messow, C.M. Reference range for the antimüllerian hormone Generation II assay: A population study of 10,984 women, with comparison to the established Diagnostics Systems Laboratory nomogram. Fertil. Steril. 2014, 101, 523–529. [Google Scholar] [CrossRef] [Scilit]
- Aslan, K.; Kasapoglu, I.; Kosan, B.; Tunali, A.; Tellioglu, I.; Uncu, G. Age-stratified anti-Müllerian hormone (AMH) nomogram: A comprehensive cohort study including 22.920 women. Front. Endocrinol. 2025, 16, 1612194. [Google Scholar] [CrossRef] [Scilit]
- Parry, J.P.; Koch, C.A. Ovarian Reserve Testing. In Endotext; Feingold, K.R., Adler, R.A., Ahmed, S.F., Anawalt, B., Blackman, M.R., Chrousos, G., Corpas, E., de Herder, W.W., Dhatariya, K., Dungan, K., et al., Eds.; MDText.com, Inc.: South Dartmouth, MA, USA, 2025. [Google Scholar]
- Steiner, A.Z.; Pritchard, D.; Stanczyk, F.Z.; Kesner, J.S.; Meadows, J.W.; Herring, A.H.; Baird, D.D. Association Between Biomarkers of Ovarian Reserve and Infertility Among Older Women of Reproductive Age. JAMA 2017, 318, 1367–1376. [Google Scholar] [CrossRef] [Scilit]
- Clinical and Laboratory Standards Institute. Defining, Establishing, and Verifying Reference Intervals in the Clinical Laboratory: Approved Guideline, 3rd ed.; CLSI document EP28-A3c; CLSI: Wayne, PA, USA, 2010. [Google Scholar]
- Yildiz, B.O.; Bozdag, G.; Yapici, Z.; Esinler, I.; Yarali, H. Prevalence, phenotype and cardiometabolic risk of polycystic ovary syndrome under different diagnostic criteria. Hum. Reprod. 2012, 27, 3067–3073. [Google Scholar] [CrossRef] [Scilit] [PubMed]
| Disclaimer/Publisher’s Note: The statements, opinions and data contained in all publications are solely those of the individual author(s) and contributor(s) and not of MDPI and/or the editor(s). MDPI and/or the editor(s) disclaim responsibility for any injury to people or property resulting from any ideas, methods, instructions or products referred to in the content. |




 ,
,