Article

SnRK-PP2C-PYL Gene Families in Citrus sinensis: Genomic Characterization and Regulatory Roles in Carotenoid Metabolism

1
Innovation Center of Chinese Medicinal Crops, Zhejiang Academy of Agricultural Sciences, Hangzhou 310021, China
2
Institute of Horticulture, Zhejiang Academy of Agricultural Sciences, Hangzhou 310021, China
3
Hangzhou Raw Seed Growing Farm, Hangzhou 311115, China
4
International Joint Laboratory for Agricultural Plant Metrology and Equipment Innovation, College of Life Sciences, China Jiliang University, Hangzhou 310018, China
*
Authors to whom correspondence should be addressed.
These authors contributed equally to this work.
Metabolites 2025, 15(9), 610; https://doi.org/10.3390/metabo15090610
Submission received: 14 August 2025 / Revised: 5 September 2025 / Accepted: 10 September 2025 / Published: 12 September 2025
(This article belongs to the Section Plant Metabolism)

Abstract

Background/Objectives: Carotenoids in citrus are vital nutritional compounds and precursors of the stress hormone abscisic acid (ABA). SNF1-related kinases (SnRKs)—key regulators of plant stress signaling that phosphorylate is targeting proteins for post-transcriptional regulation—mediate ABA signaling through its subfamily SnRK2-phosphatase type-2C (PP2C)-PYR1-LIKE (PYL) cascades. This study aims to identify the SnRK-PP2C-PYL family members and decipher their underlying post-transcriptional regulatory mechanisms which control carotenoid metabolism in Citrus sinensis for improved nutrition and stress resilience. Methods: SnRK, PP2C, and PYL were identified by integrated HMMER-blastp-CDD pipeline in the Citrus genome. Using two carotenoid-divergent cultivars, ‘Newhall’ (yellow) and ‘Cara Cara’ (red, hyperaccumulating linear carotenoids), we conducted spatiotemporal expression profiling and integrated transcriptomic and metabolomic data via Weighted Gene Co-expression Network Analysis (WGCNA) to identify modules correlated with accumulation. Results: We identified 26 CsSnRKs (1 SnRK1, 7 SnRK2, 18 SnRK3), 57 CsPP2Cs, and 7 CsPYLs in Citrus sinensis. Despite a >26-fold difference in linear carotenoids, structural gene expression was similar among cultivars, strongly implicating post-transcriptional control. WGCNA identified a key turquoise module highly correlated with linear carotenoid content. This module contained phosphorylation-related genes (CsSnRK1/3.5/3.6/3.16, CsPP2C14/15/33/35/38/40/43/56, and CsPYL6), biosynthetic genes (CsPSY1, CsZISO, and CsZDS), and candidate transcription factors. Network analysis predicted that CsSnRKs, CsPP2Cs, and CsPYLs regulate phytoene-derived carotenoid biosynthesis. Conclusions: We propose a novel phosphorylation-mediated post-transcriptional regulatory network in carotenoid accumulation. This mechanism bridges ABA signaling and metabolic adaptation, providing crucial molecular targets for engineering nutrient-dense and climate-resilient citrus varieties.

1. Introduction

Citrus sinensis (also written as Citrus × sinensis) is a hybrid between the pomelo (Citrus maxima) and mandarin (Citrus reticulata), known as the cultivated sweet orange. Citrus sinensis stands as the most globally significant Citrus species in terms of cultivated area and production [1,2,3]. Its commercial value hinges critically on fruit pigmentation, primarily governed by carotenoids—tetraterpenoid pigments that confer vibrant coloration and serve as precursors for vitamin A, potent antioxidants with demonstrated roles in mitigating carcinogenesis, cardiovascular diseases, and neurodegeneration [4,5,6]. Beyond human health benefits, carotenoids underpin photosynthesis, photoprotection, and phytohormone synthesis [5]. Carotenoids include carotenes, which lack oxygen atoms, and xanthophylls, which contain oxygen. The carotenoid biosynthetic pathway is well-characterized [7] (Figure 1). Enzymes involved in carotenoid biosynthesis are primarily localized in plastids and encoded by nuclear genes. Phytoene synthase (PSY), the rate-limiting enzyme of the carotenoid pathway, catalyzes the condensation of two molecules of geranylgeranyl diphosphate (GGPP) to form the first carotenoid molecule, phytoene. Phytoene is then processed by several enzymes into lycopene [5]. The pathway then splits into α,β- and β,β-branches at lycopene, leading to degradation by carotenoid cleavage dioxygenase (CCD). Carotenoids can be cleaved into volatile compounds that serve as plant signaling molecules and aroma compounds, or they can be degraded into apocarotenoids. 9-cis-epoxycarotenoid dioxygenase (NCED), a member of the CCD family, specifically cleaves 9-cis-violaxanthin and 9-cis-neoxanthin to generate abscisic acid (ABA) [5,7].
Transcriptional regulation of carotenoid metabolism is increasingly understood. Light-responsive TFs (PIF1 repressing PSY/carotenoids in darkness; HY5 activating PSY under light/temperature) critically regulate carotenoid biosynthesis [8,9,10], while MADS-box TFs (e.g., tomato RIN/AGAMOUS-like1/FRUITFULL) directly control PSY/carotenoid levels during ripening [10,11]. However, the regulatory mechanisms, particularly post-transcriptional controls, governing carotenoid flux remain incompletely resolved. As central stress-signaling regulators, SNF1-related kinases (SnRKs) broadly coordinate post-translational responses via phosphorylation [12,13]; however, their specific modes of action in regulating carotenoid biosynthesis and degradation remain unresolved and demand systematic investigation. ABA, a carotenoid-derived sesquiterpenoid hormone, orchestrates plant development and stress responses [13,14]. A major breakthrough in ABA signaling was the identification of the core signaling components: the pyrabactin resistance (PYR)/ PYR1-like (PYL)/RCAR receptor family, phosphatase type 2C (PP2C), and SnRK2 kinases belong to a subfamily of SnRK [15,16,17]. The established model shows that ABA binding to PYR/PYL/RCAR induces conformational changes enabling receptor-PP2C interaction, which disrupts the PP2C-mediated inhibition of SnRK2s (Figure 1). This releases active SnRK2s to phosphorylate downstream targets, including transcription factors [18] (Figure 1). SnRKs comprise three subfamilies—SnRK1 (energy sensing), SnRK2 (ABA/osmotic stress), and SnRK3 (Ca2+ signaling)—all sharing a conserved kinase domain but with subgroup-specific domains (KA1/UBA in SnRK1; NAF in SnRK3) [12,13] (Figure 1). In Arabidopsis, these families are represented by 14 PYR/PYL/RCAR receptors [17], 80 PP2Cs [19], and 38 SnRKs (3 SnRK1, 10 SnRK2, 25 SnRK3) [12]. ABA is a carotenoid-derived metabolite functioning as a phytohormone that regulates diverse physiological processes. It maintains multifaceted equilibrium during plant growth through hormonal crosstalk. As products shaped by extensive evolution, the carotenoid metabolic pathways in plants likely possess intricate feedback regulation mechanisms. A compelling scientific question worthy of exploration is the potential regulatory role of the SnRK, PYL, and PP2C protein families in carotenoid biosynthesis. Our preliminary research on the ‘Cara Cara’ mutant, which hyperaccumulates linear carotenoids in its juice vesicles, revealed that neither transcriptional differences in biosynthetic genes nor chromoplast sink capacity explain its enhanced accumulation. Thus, post-transcriptional regulation, particularly phosphorylation, is strongly implicated as the underlying mechanism [20,21].
Characterizing the temporal and spatial expression patterns of the SnRK, PYL, and PP2C family members during the development of these two sweet orange genotypes with distinct carotenoid accumulation phenotypes will provide crucial insights into this underlying regulatory mechanism. A 2012 Citrus study [22] identified the SnRK2 subfamily, PYL, and clade-A type-2C protein phosphatases (PP2CAs). However, it relied solely on BLASTp alignments with known Arabidopsis sequences. Likely due to limited genome data at the time, the number of identified SnRK2, PYL, and PP2CA genes differs from this study. Here, we comprehensively identify SnRK, PYL, and PP2C gene families in Citrus sinensis using an integrated HMMER-blastp-CDD pipeline, updating previous partial annotations. We further compare spatiotemporal expression of these genes in ‘Newhall’ (yellow pulp) and ‘Cara Cara’ (red pulp) across fruit development, integrating transcriptomic and carotenoid metabolite data. Weighted Gene Co-expression Network Analysis (WGCNA) employs eigengene network methodology to analyze gene expression correlation matrices, facilitating the identification of phenotype-associated gene modules and candidate biomarkers [23].
This study employs integrated transcriptomic and metabolomic co-expression analysis to construct correlation networks, identifying modules of co-expressed genes and highly connected regulatory hubs to explore phosphorylation-mediated post-transcriptional networks regulating carotenoid metabolism in sweet orange. Our objectives are (1) the identification of SnRK, PYL, and PP2C families in sweet orange; (2) expression profiling of these regulators in contrasting carotenoid-accumulating genotypes; and (3) co-expression network analysis to uncover putative regulatory nodes linking post-transcriptional regulation and ABA signaling to carotenoid metabolism. Our analysis sheds light on potential regulatory mechanisms and nominates prioritized candidate genes implicated in post-transcriptional control. These candidates provide a foundation for future experimental validation and represent potential molecular targets for precision citrus breeding aimed at enhancing nutritional carotenoid content.

2. Materials and Methods

2.1. Genome-Wide Identification, Characterization, and Phylogenetic Analysis of CsSnRK, CsPP2C, and CsPYL Genes

The Pfam domains PF00069 (SnRK) and PF00481 (PP2C) were downloaded from the InterPro Scan database (https://www.ebi.ac.uk/interpro/entry/pfam/, accessed on 1 June 2025). Since no established Pfam domain exists for PYL proteins, we constructed a custom hidden Markov model (HMM) profile using 14 Arabidopsis thaliana AtPYL protein sequences. The workflow involved performing multiple sequence alignments of 14 AtPYL peptides, building the HMM profile via hmmbuild, and generating the HMM file: 14AtPYLpep.stockholm. The software HMMER 3.0 [24] was used to perform local hmmbuild and hmmsearch on annotated protein sequences from Citrus sinensis (http://citrus.hzau.edu.cn, accessed on 1 June 2025) with a cut-off E-value of <1 × 10⁻²⁰ for both full length and best domain. Protein sequences of AtSnRKs [12], AtPP2Cs [19], and AtPYLs [17] from Arabidopsis were downloaded from NCBI (https://www.ncbi.nlm.nih.gov/, accessed on 1 June 2025). A local BLASTP search was then performed using the protein AtSnRKs, AtPP2Cs, and AtPYLs sequences as query and annotated protein sequences from Citrus sinensis as the database, with default parameters, and was further filtered with a threshold of identity > 50%. The candidate sequence was further confirmed in the Conserved Domain Database (CDD) (https://www.ncbi.nlm.nih.gov/Structure/cdd/wrpsb.cgi, accessed on 1 June 2025) to remove the false-positive sequences.
The candidate protein sequences of AtSnRKs and CsSnRKs (Figure S1), AtPP2Cs and CsPP2Cs (Figure S2), and AtPYLs and CsPYLs (Figure S3) were separately performed for multiple sequence alignments using the CLUSTAL tool in MEGA 7.0 software [25] with default settings. Any sequences with poor alignment were excluded. The phylogenetic tree was constructed using the neighbor-joining method with 1000 bootstrap replicates in MEGA 7.0 software. To enhance the visual presentation of the tree, Evolview (http://www.evolgenius.info/evolview/, accessed on 1 June 2025) was utilized [26].

2.2. Plant Materials and Carotenoid/Chlorophyll Extraction with HPLC Quantification

‘Newhall’ is a cultivar derived from a mutation of the Washington navel orange. It is characterized by a relatively small, flat-round or round-headed canopy with short, dense branches and dark green leaves. The fruit is elliptical, relatively large, and has a smooth, orange-red to deep-orange rind. In contrast, the origin and pedigree of ‘Cara Cara’ remain unclear, though its main agronomical traits are largely consistent with those of ‘Newhall’. The ‘Newhall’ and ‘Cara Cara’ plant materials used in this study were collected from orchard-grown trees in Zhejiang Province, China. The leaves, flowers, and fruits were immediately frozen in liquid nitrogen and stored at −70 °C for subsequent analysis. All experiments in this study, including HPLC quantification, RNA-seq, and qPCR validation, were performed with three independent biological replicates (n = 3), and for carotenoids/chlorophylls extraction and measurement by HPLC, according to a method previously described [27]. Fresh tissues (0.4 g) were ground in liquid nitrogen and extracted with chloroform/methanol/Tris-HCl (pH 7.5). After centrifugation, the chloroform phases were collected and dried under nitrogen gas. The residue was saponified with 6% KOH in methanol at 60 °C for 0.5 h (this step was omitted for chlorophyll analysis). Water and chloroform were added to saponified mixtures, and after centrifugation, the chloroform phases were recollected and dried under nitrogen gas. HPLC analysis used a Waters Alliance 2695 system (Waters Corporation, Milford, MA, USA) with a YMC reverse-phase C30 column at 25 °C. Mobile phases comprised (A) methanol, (B) 80% methanol with 0.2% ammonium acetate, and (C) tert-butyl methyl ether. The gradient program was 95% A/5% B (0–6 min), linear transition to 80% A/5% B/15% C (7 min), held (7–12 min), transition to 30% A/5% B/65% C (32 min), held (32–48 min), return to 95% A/5% B (50 min), and held to 60 min. Quantification used peak areas at specific wavelengths: 400 nm (chlorophyll a), 470 nm (chlorophyll b), 286 nm (phytoene), 348 nm (phytofluene), and 450 nm (other carotenoids), with concentrations calculated against authentic standards.

2.3. Transmission Electron Microscopy (TEM)

Sample preparation and transmission electron microscopy were conducted as described in our previous study [20]. Plant samples were separated and fixed overnight at 4 °C in 2.5% glutaraldehyde (in 0.1 M phosphate buffer, pH 7.0). After fixation, samples were washed three times (15 min each) with phosphate buffer, then post-fixed in 1% OsO4 (in 0.1 M phosphate buffer, pH 7.0) for 1–2 h. Subsequently, samples were washed three times with phosphate buffer. Dehydration was performed using a graded ethanol series (50%, 70%, 80%, 90%, 95%, and 100%; 15 min per step), followed by infiltration in absolute acetone for 20 min. For resin infiltration, samples were sequentially treated with a 1:1 mixture of absolute acetone and Spurr resin for 1 h, a 1:3 mixture of absolute acetone and Spurr resin for 3 h, and finally, pure Spurr resin overnight. The embedded samples were placed in capsules filled with embedding medium and polymerized at 70 °C for 9 h. Prior to observation, ultrathin sections were stained with uranyl acetate and alkaline lead citrate (15 min each) and examined using a Hitachi JEM-1230 transmission electron microscope (Hitachi, Ltd., Tokyo, Japan).

2.4. RNA Extraction, RNA-Seq Analysis, and Quantitative Real-Time PCR (qPCR) Analysis

Total RNA was extracted by the CTAB method as described in our previous work [21]. High-quality total RNA was extracted, with RNA Integrity Numbers (RIN) consistently exceeding 7.0, as determined by Bioanalyzer analysis (Agilent Technologies, Santa Clara, CA, USA). RNA sequencing was performed by Biomarker Technologies on the Illumina HiSeq PE150 platform (Illumina, San Diego, CA, USA). For quantitative real-time PCR (qPCR) validation, first-strand cDNA was synthesized from 1 µg total RNA using the HiScript II 1st Strand cDNA Synthesis Kit (Vazyme, Nanjing, China). qPCR reactions were performed on a CFX96 Real-Time PCR Detection System (Bio-Rad, Hercules, CA, USA) using SYBR Green qPCR Master Mix (MedChemExpress, Monmouth Junction, NJ, USA), strictly adhering to manufacturer protocols. The thermal cycling profile consisted of (1) initial denaturation: 95 °C for 5 min; (2) 45 amplification cycles: 95 °C for 5 s, 58 °C for 15 s, and 72 °C for 10 s; and (3) melting curve analysis: 65 °C to 95 °C (increment 0.5 °C/5 s). Melting curve analysis confirmed amplification specificity for all reactions. The four carotenoid biosynthetic structural genes—CsPSY1, CsPDS, CsZISO, and CsBCH—were selected for qPCR validation of RNA-seq data accuracy. Transcript levels were normalized against the CsActin reference gene by the value of 2−ΔCT. Primers for RNA-seq validation were designed based on sequences of selected genes (Table S1).

2.5. Weighted Gene Co-Expression Network Analysis (WGCNA) and Establishment of Co-Expression Networks

Weighted Gene Co-expression Network Analysis (WGCNA) was implemented using the WGCNA R package v1.72 [23]. An adjacency matrix was constructed by raising the pairwise Pearson correlation matrix of all expressed genes to a soft-thresholding power (β = X, selected based on the scale-free topology criterion). This adjacency matrix was subsequently transformed into a Topological Overlap Matrix (TOM) to minimize spurious connections and measure network interconnectedness. Module identification was performed using average linkage hierarchical clustering of genes based on TOM dissimilarity (1-TOM). Modules were delineated from the resulting dendrogram using the dynamic tree-cutting algorithm. Branches of the dendrogram were assigned color codes representing distinct co-expression modules. Module-trait association analysis correlated module eigengenes (the first principal component of module expression) with phenotypic traits. Associations were visualized in a heatmap where rows represent modules (color-coded) and columns represent traits. Heatmap color intensity corresponds to the Pearson correlation coefficient (r) between module eigengene and trait (scale bar: red = positive correlation, blue = negative correlation, and white = |r| ≈ 0). Intramodular analysis identified highly connected genes (hub genes) within modules using connectivity measures. Network visualization for selected modules was performed using Cytoscape v3.10.3 [28]. Transcription factor (TF) identification was conducted by cross-referencing module gene lists with the Plant Transcription Factor Database (PlantTFDB; http://planttfdb.gao-lab.org/, accessed on 1 June 2025) [29].

3. Results

3.1. Identification and Classification of CsSnRK, CsPYL, and CsPP2C Gene Families in Citrus sinensis

By integrating the HMMER-blastp-CDD pipeline, CsSnRK, CsPYL, and CsPP2C were identified (Figure 2). We identified 26 CsSnRK genes in Citrus sinensis, fewer than the 38 AtSnRK genes in Arabidopsis (Figure 2A). Based on subfamily classification [12], these comprise 1 CsSnRK1, 7 CsSnRK2, and 18 CsSnRK3 genes, respectively fewer than the corresponding Arabidopsis subfamilies (3 AtSnRK1, 10 AtSnRK2, and 25 AtSnRK3) (Figure 2A). We also identified 7 CsPYL genes in sweet orange, indicating a contraction of this gene family compared to the 14 AtPYL genes in Arabidopsis (Figure 2B). Following established subfamily classification methods [17], the CsPYLs were grouped into three subfamilies (I, II, III): CsPYL5, CsPYL6, and CsPYL7 belong to subfamily I; CsPYL4 belongs to subfamily II; and CsPYL1, CsPYL2, and CsPYL3 belong to subfamily III (Figure 2B). Furthermore, we identified 57 CsPP2C genes in sweet orange, fewer than the 80 AtPP2C genes in Arabidopsis (Figure 2C). Consistent with the established classification for the model plant Arabidopsis [19], these were categorized into 13 subfamilies (A, B, C, D, E, F1, F2, G, H, I, J, K, and L) (Figure 2C). A small number of genes remained unclassified into these subfamilies.

3.2. Comparative Profiling Reveals ‘Cara Cara’ Juice Vesicles Hyperaccumulate Linear Carotenoids (Phytoene, Phytofluene, and Lycopene) over ‘Newhall’, with Parallel Leaf/Flower Phytoene Elevation and Supporting Plastid Ultrastructure

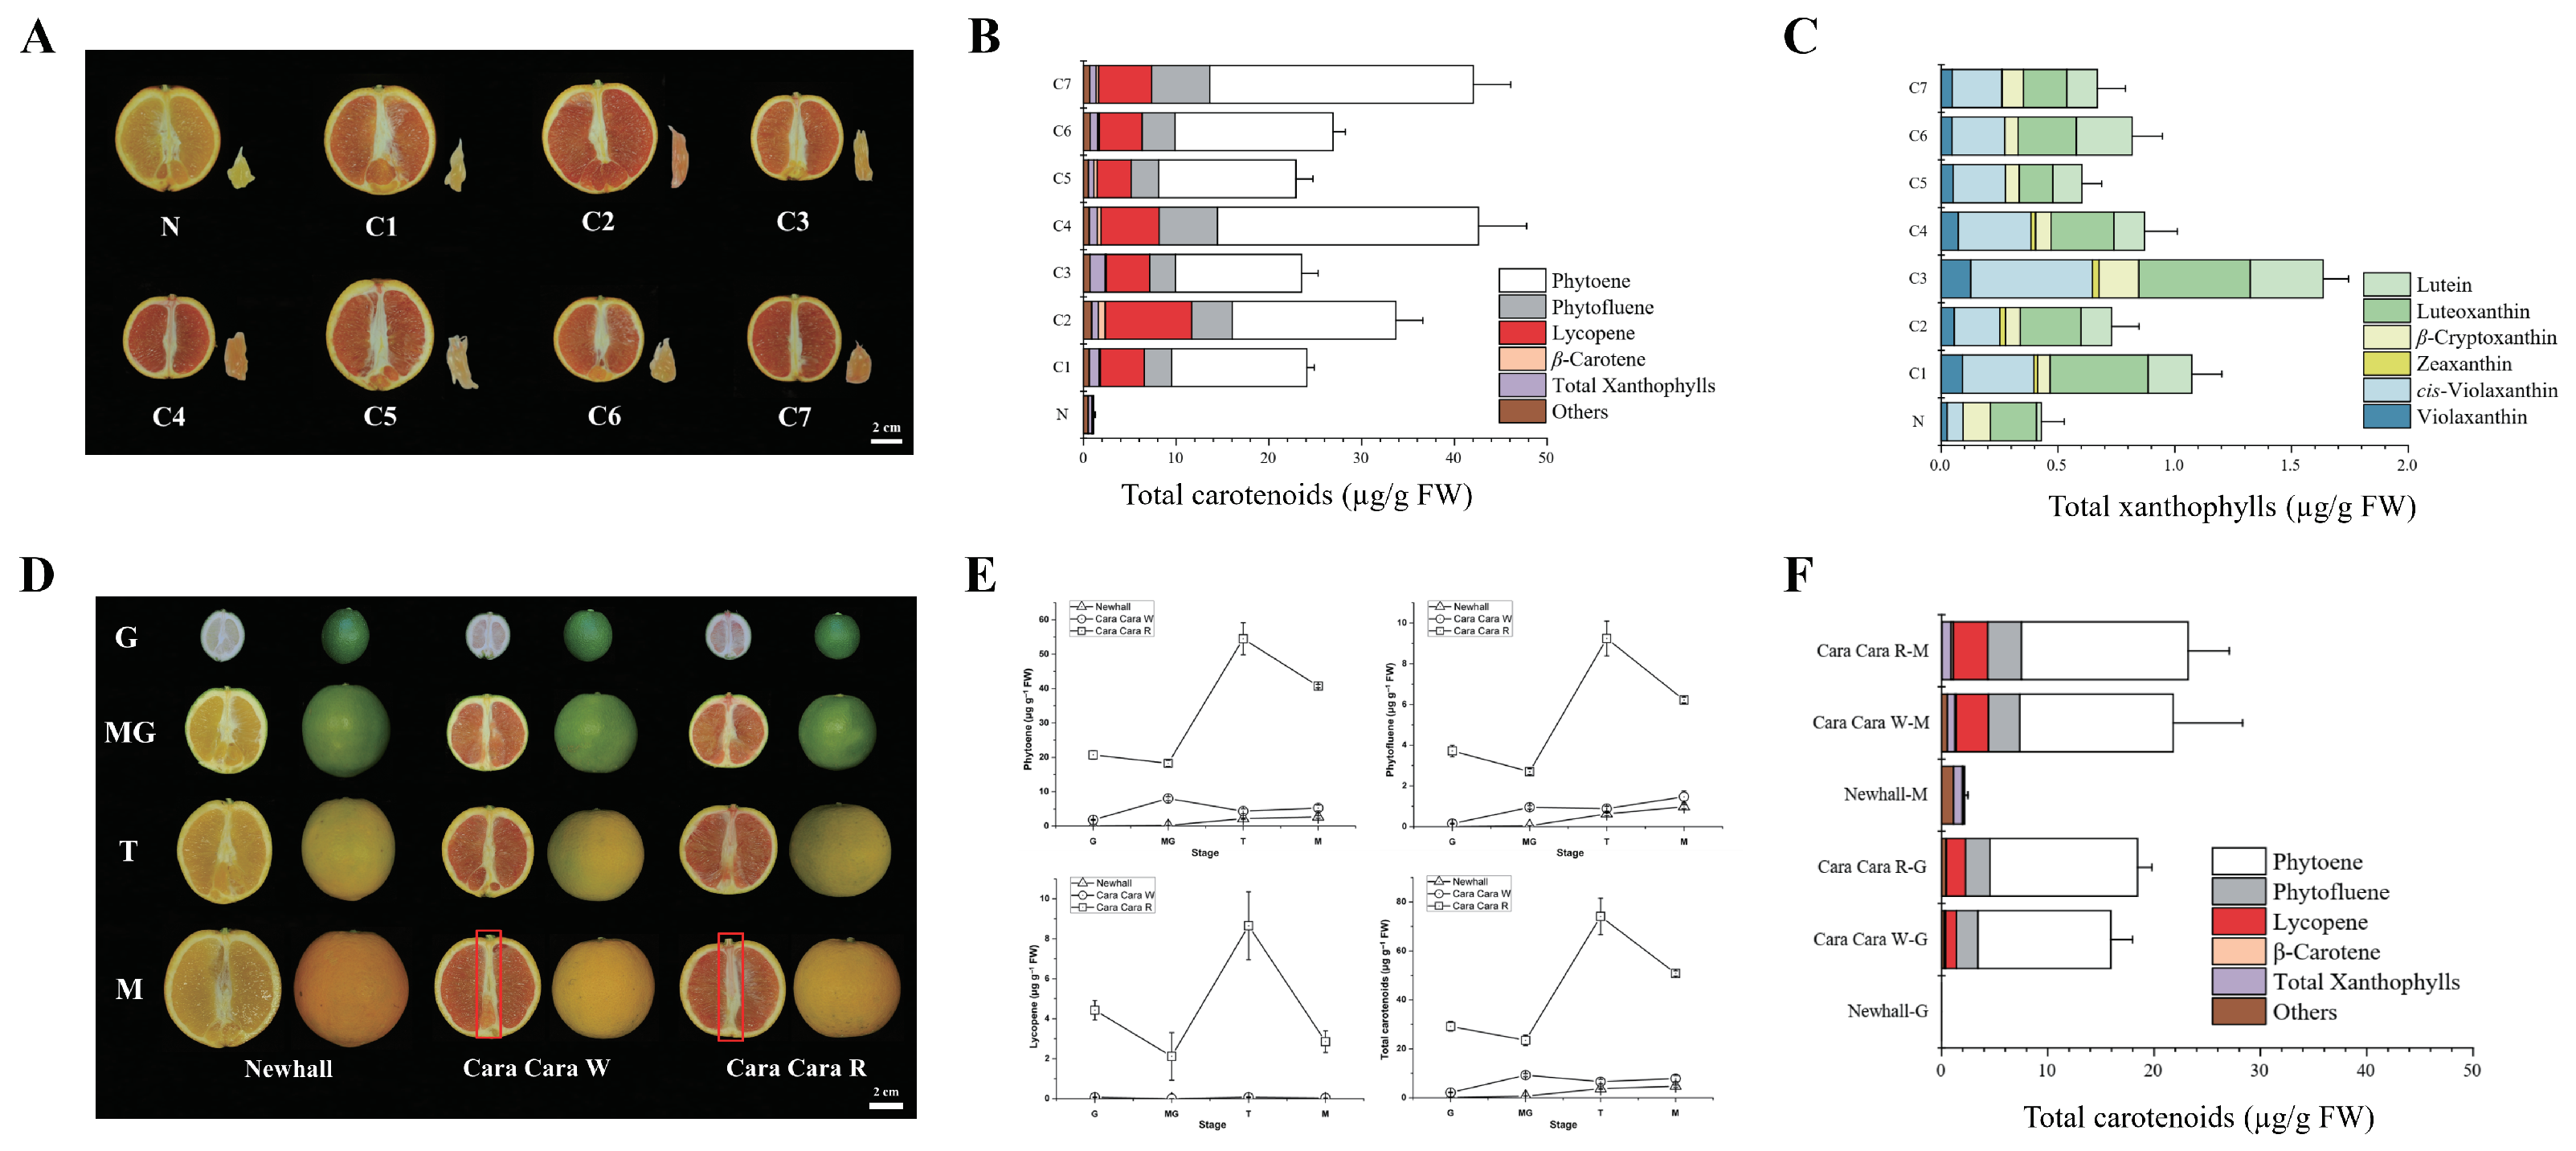
Visual observation revealed uneven pigmentation and significant inter-fruit variability in the juice vesicles of ‘Cara Cara’ oranges. To document this phenomenon during fruit maturation, eight ‘Cara Cara’ fruits and one ‘Newhall’ fruit (as a control) were randomly sampled, as shown in Figure 3A. Carotenoid profiling of ‘Cara Cara’ juice vesicles confirmed high inter-fruit variability and revealed disconnected relationships between the color of the central core and its pigment composition (Figure 3B). The average total carotenoid content in ‘Cara Cara’ juice vesicles ranged from 22.91 to 42.61 µg/g FW, significantly higher than the 1.12 µg/g FW found in ‘Newhall’ (Figure 3B). Linear carotenoids (phytoene, phytofluene, and lycopene) dominated the total carotenoids in ‘Cara Cara’, accounting for 89.58% to 96.12%. Phytoene was the predominant component, constituting 52.42% to 67.60% of the total. In contrast, linear carotenoids represented only 16.07% of the total carotenoids in ‘Newhall’ juice vesicles, with phytoene at 11.31% (Figure 3B). While the average total xanthophylls in ‘Cara Cara’ juice vesicles were higher than in ‘Newhall’, no clear obligatory link existed between total xanthophyll levels and total carotenoid content (Figure 3C). For instance, Sample C3 had lower total carotenoids but higher xanthophylls, Sample C4 had the highest total carotenoids but lower xanthophylls, and Samples C1 and C3 had similar total carotenoid levels, but C3 had significantly more xanthophylls than C1 (Figure 3B,C).
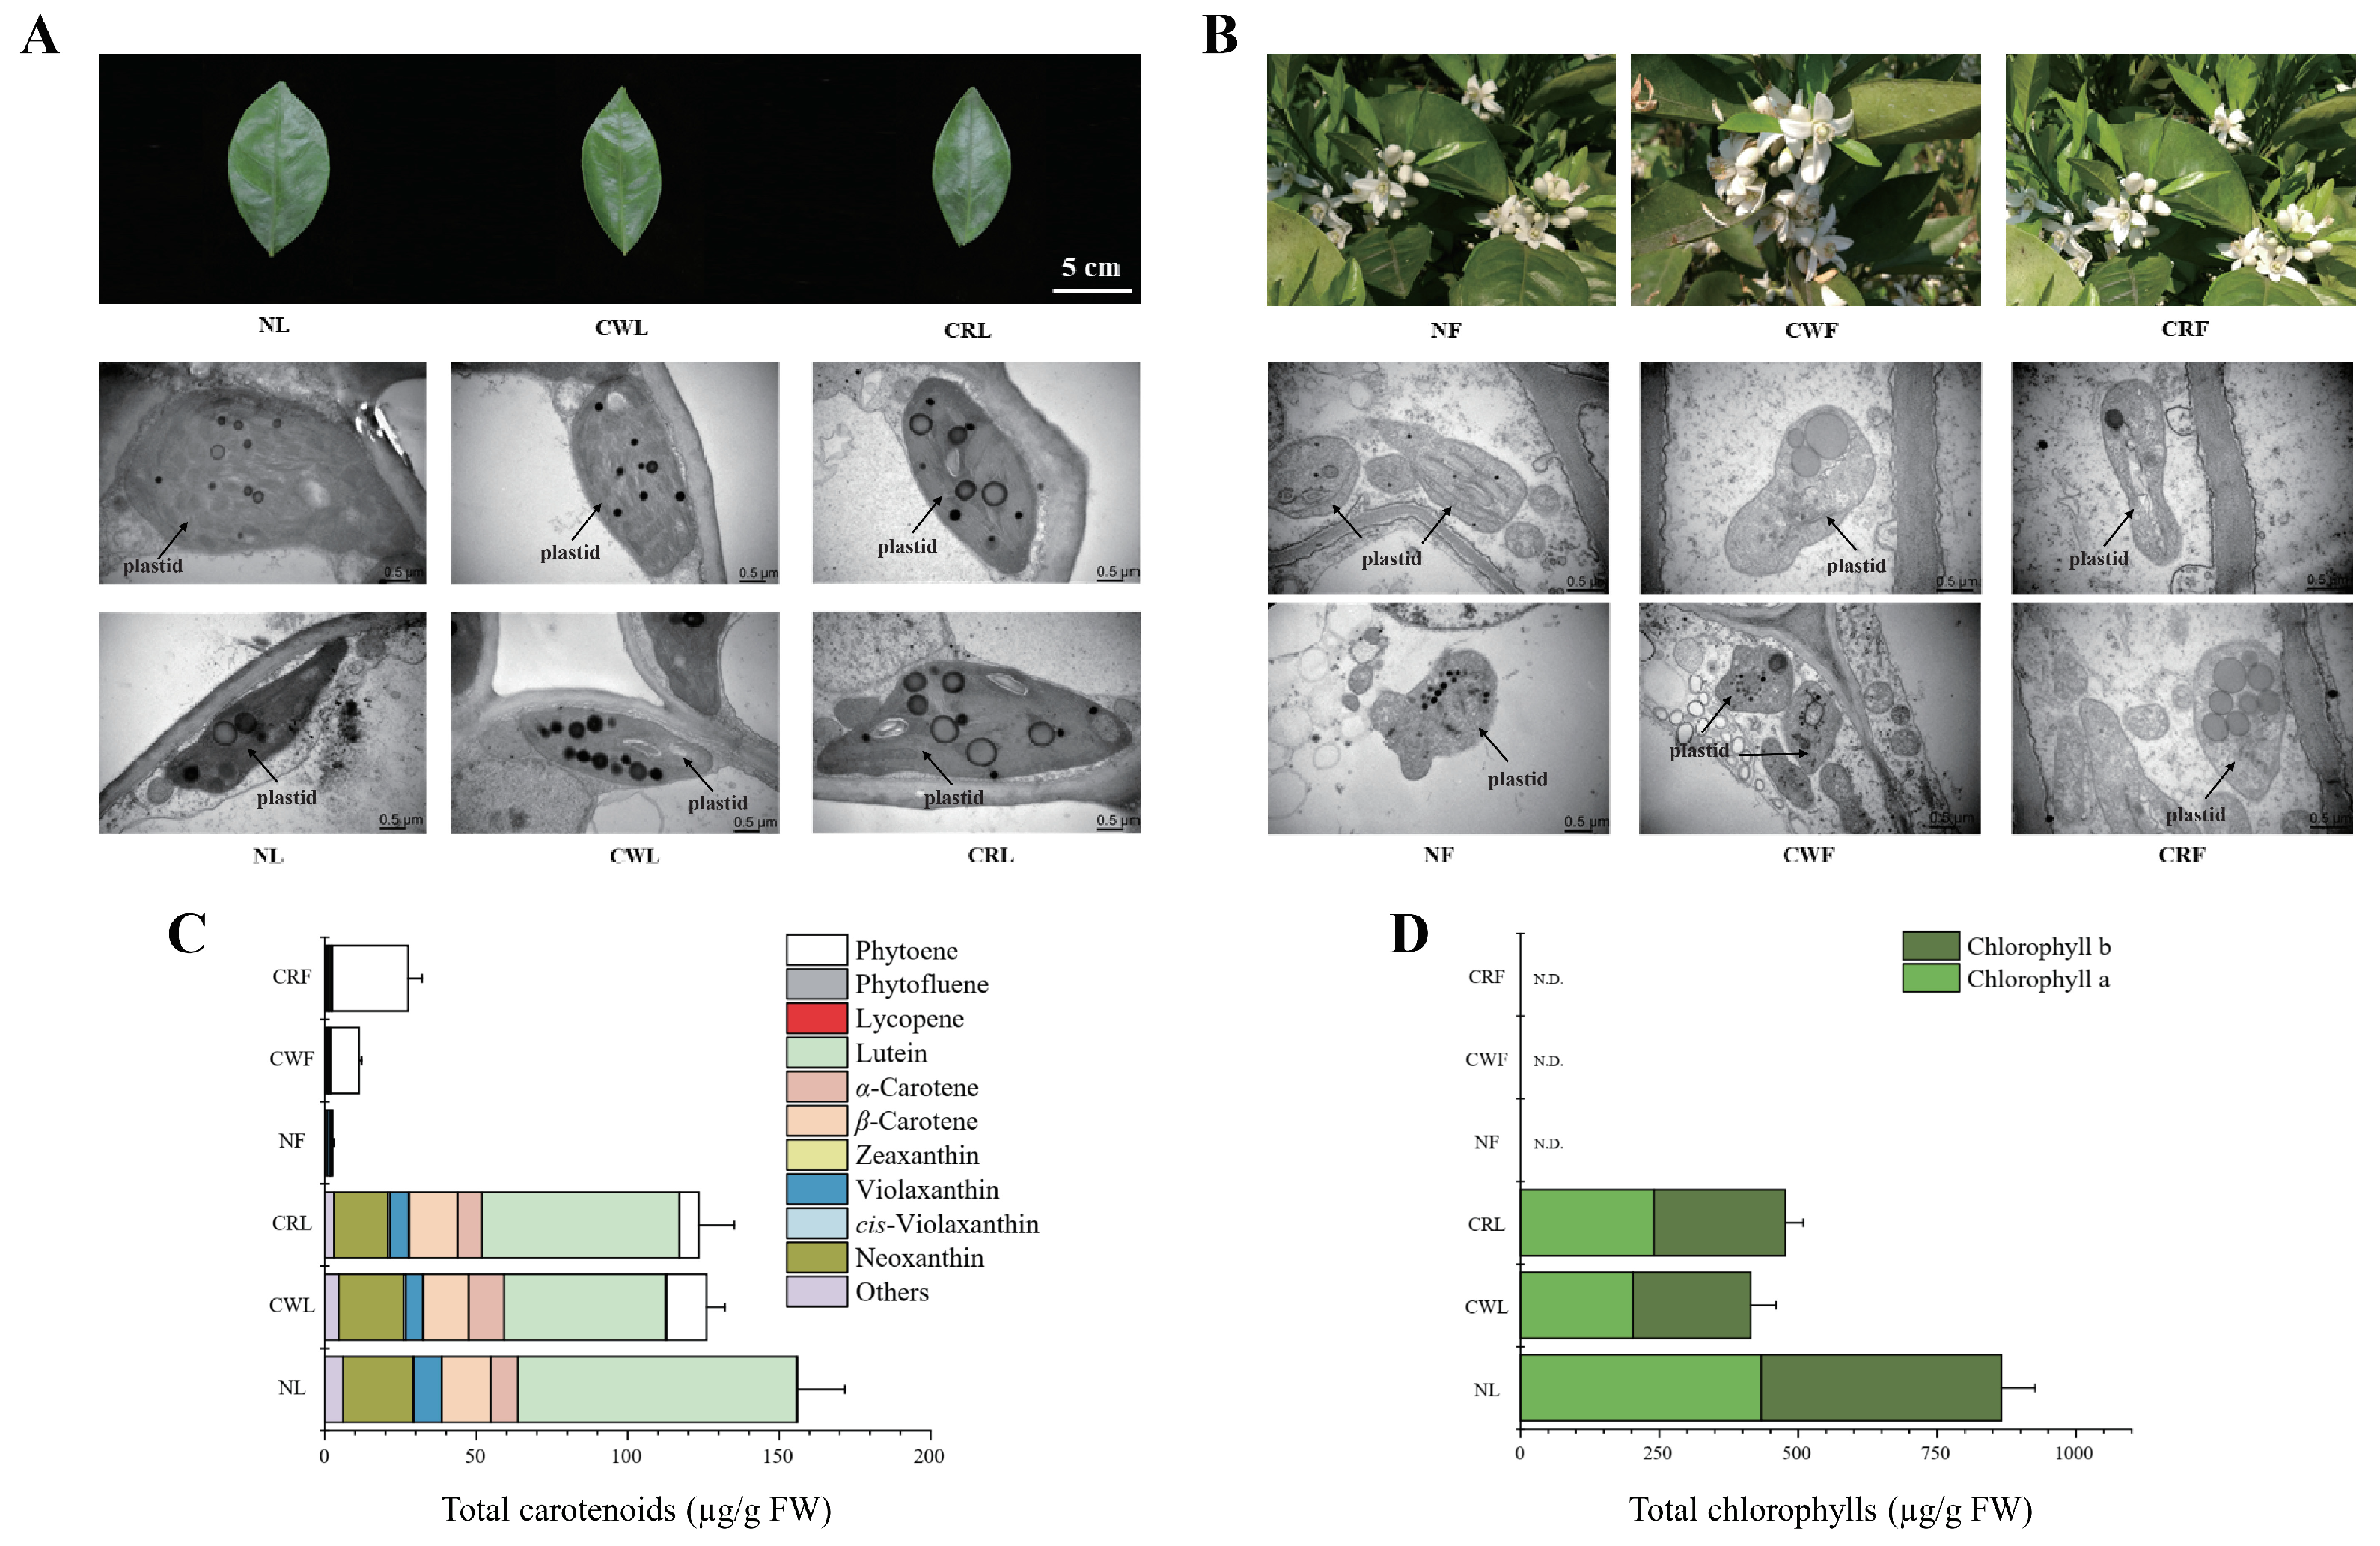
Longitudinal sectioning of individual ‘Cara Cara’ fruits revealed two distinct central core phenotypes: red (C3, C4, and C5) and white (C1, C2, C6, and C7) (Figure 3A). Subsequent developmental stage sampling confirmed that central core coloration is tree-specific; individual trees exclusively produce either red- or white-core fruits, indicating two distinct subpopulations within the ‘Cara Cara’ group (Figure 3D). This phenotypic divergence was observable as early as the immature green stage (Figure 3D). Red central cores accumulated lycopene (red pigment) alongside substantial colorless carotenoids (phytoene and phytofluene), mirroring the pigment profile of ‘Cara Cara’’s red juice vesicles (Figure 3E). However, central core coloration did not directly correlate with significant differences in juice vesicle carotenoid composition (Figure 3F). Comparative analysis of plant morphology showed minimal distinctions in leaf/flower (Figure 4A,B). Plastid ultrastructure among red-core ‘Cara Cara’, white-core ‘Cara Cara’, and ‘Newhall’ controls aligned with their carotenoid accumulation patterns (Figure 4B,C). Notably, both red- and white-core ‘Cara Cara’ leaves accumulated phytoene + phytofluene (6.44–13.54 µg/g FW, predominantly phytoene (>97%)), constituting 5.2–10.75% of total leaf carotenoids with no lycopene detected, while ‘Newhall’ leaves contained only trace phytoene (0.38 µg/g FW; 0.24% of total carotenoids) (Figure 4C); ‘Cara Cara’ flowers (both types) exhibited enlarged plastoglobuli consistent with phytoene hyperaccumulation and contained high phytoene + phytofluene (9.57–25.34 µg/g FW, >98% phytoene; 84.46–92.16% of total carotenoids), whereas ‘Newhall’ flowers showed minimal phytoene (0.28 µg/g FW; 8.21%) (Figure 4A–C). In contrast, ‘Newhall’ leaves had significantly higher chlorophyll content than ‘Cara Cara’ leaves, though chlorophyll levels did not differ between red- and white-core ‘Cara Cara’ (Figure 4D). In conclusion, beyond carotenoid profiles, ‘Newhall’ and ‘Cara Cara’ share highly similar physiological and morphological traits, establishing them as a suitable comparative system for investigating post-transcriptional regulation (e.g., SnRK, PYL, PP2C) of carotenoid biosynthesis.

3.3. Spatiotemporal Expression Dynamics of PP2C, SnRK, and PYL Gene Families Across Tissues and Fruit Developmental Stages Between ‘Newhall’ and ‘Cara Cara’

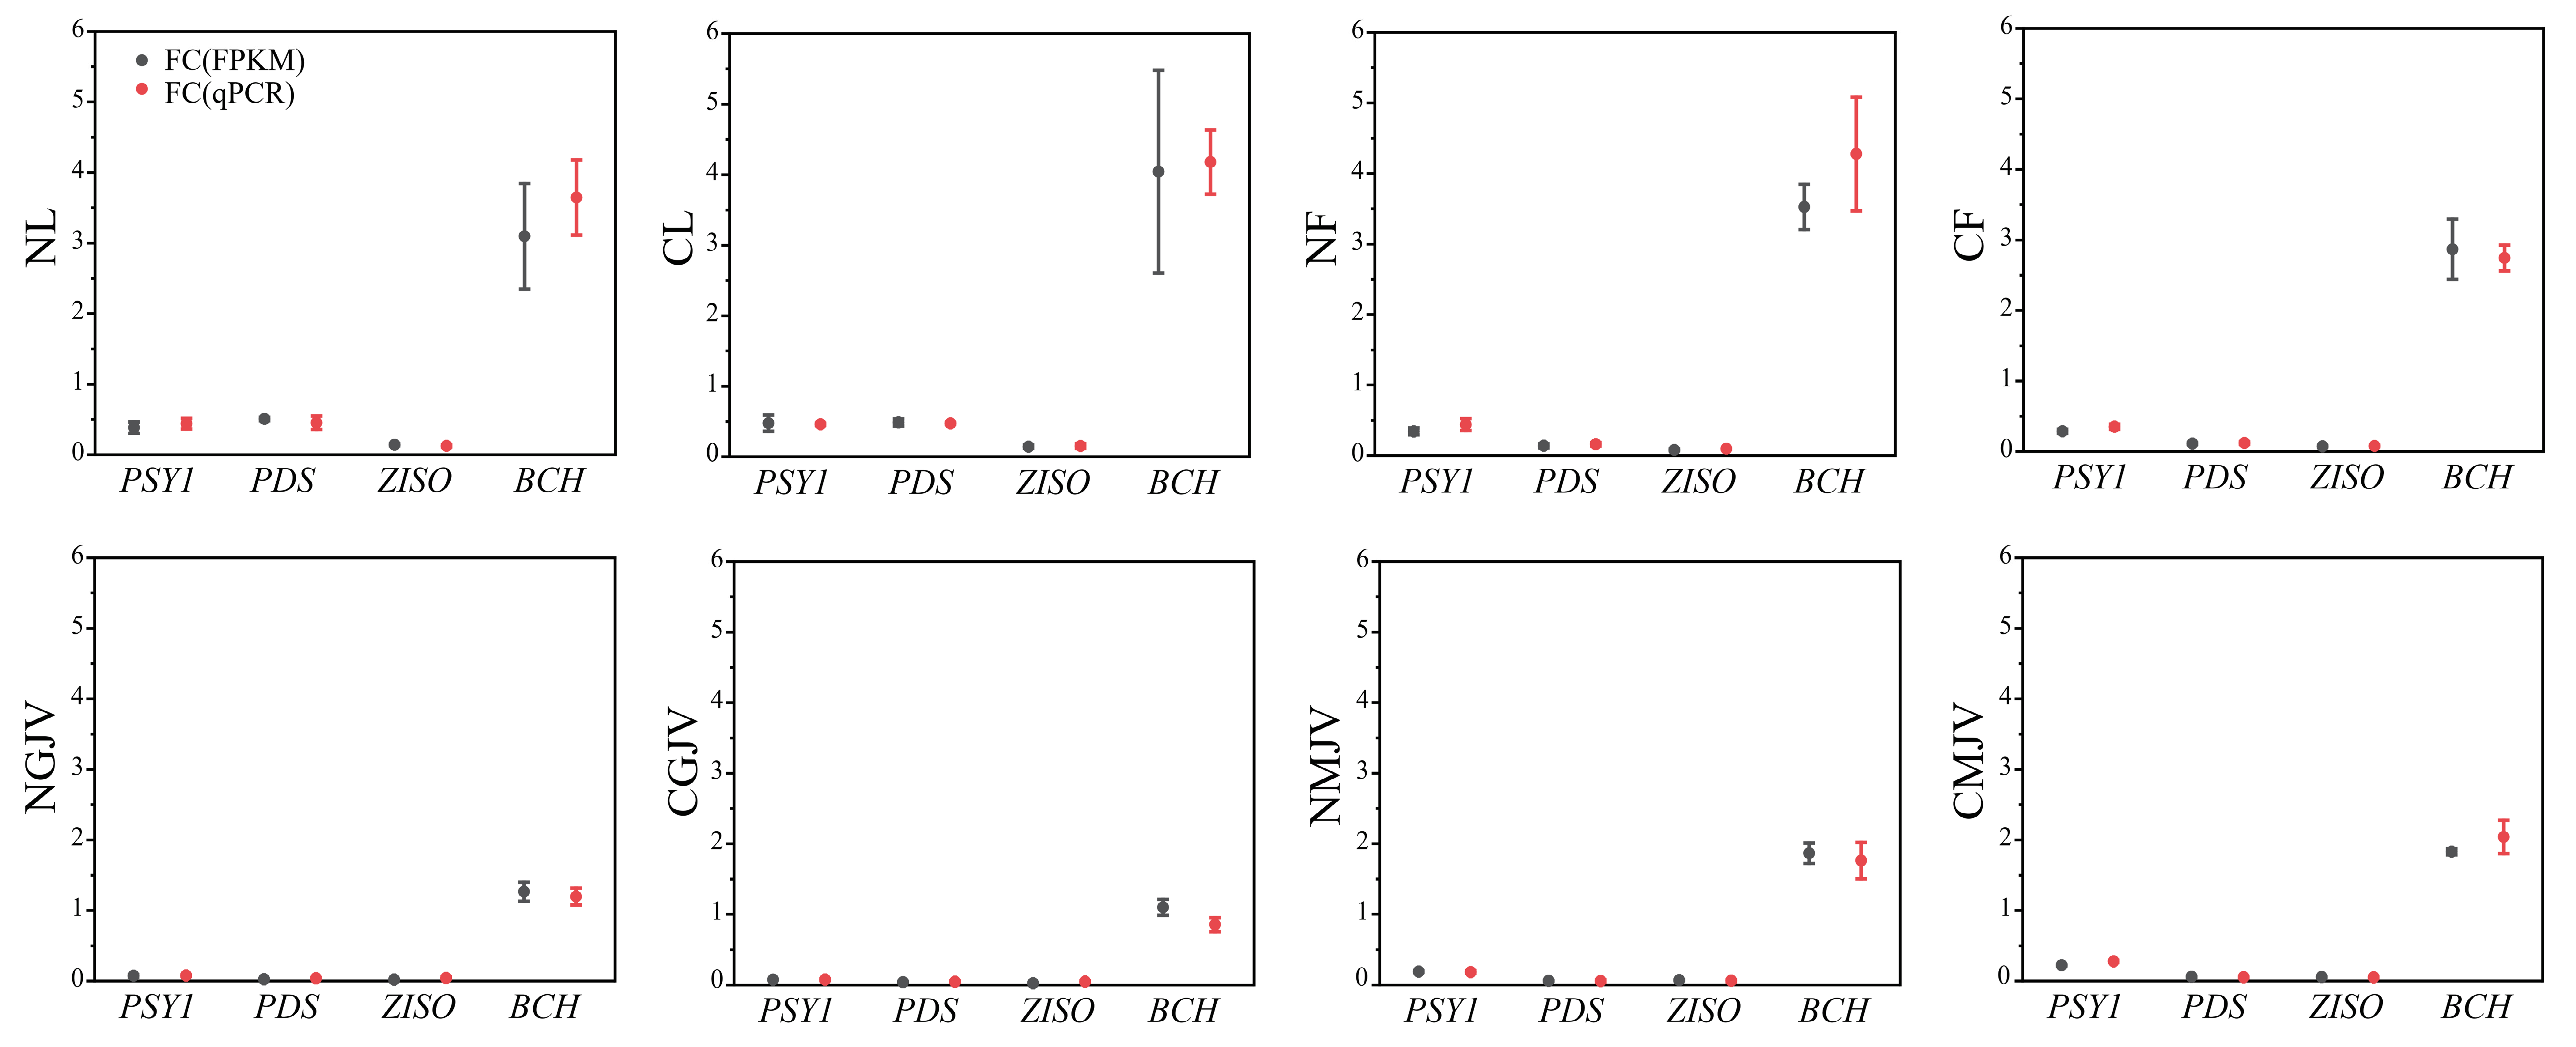
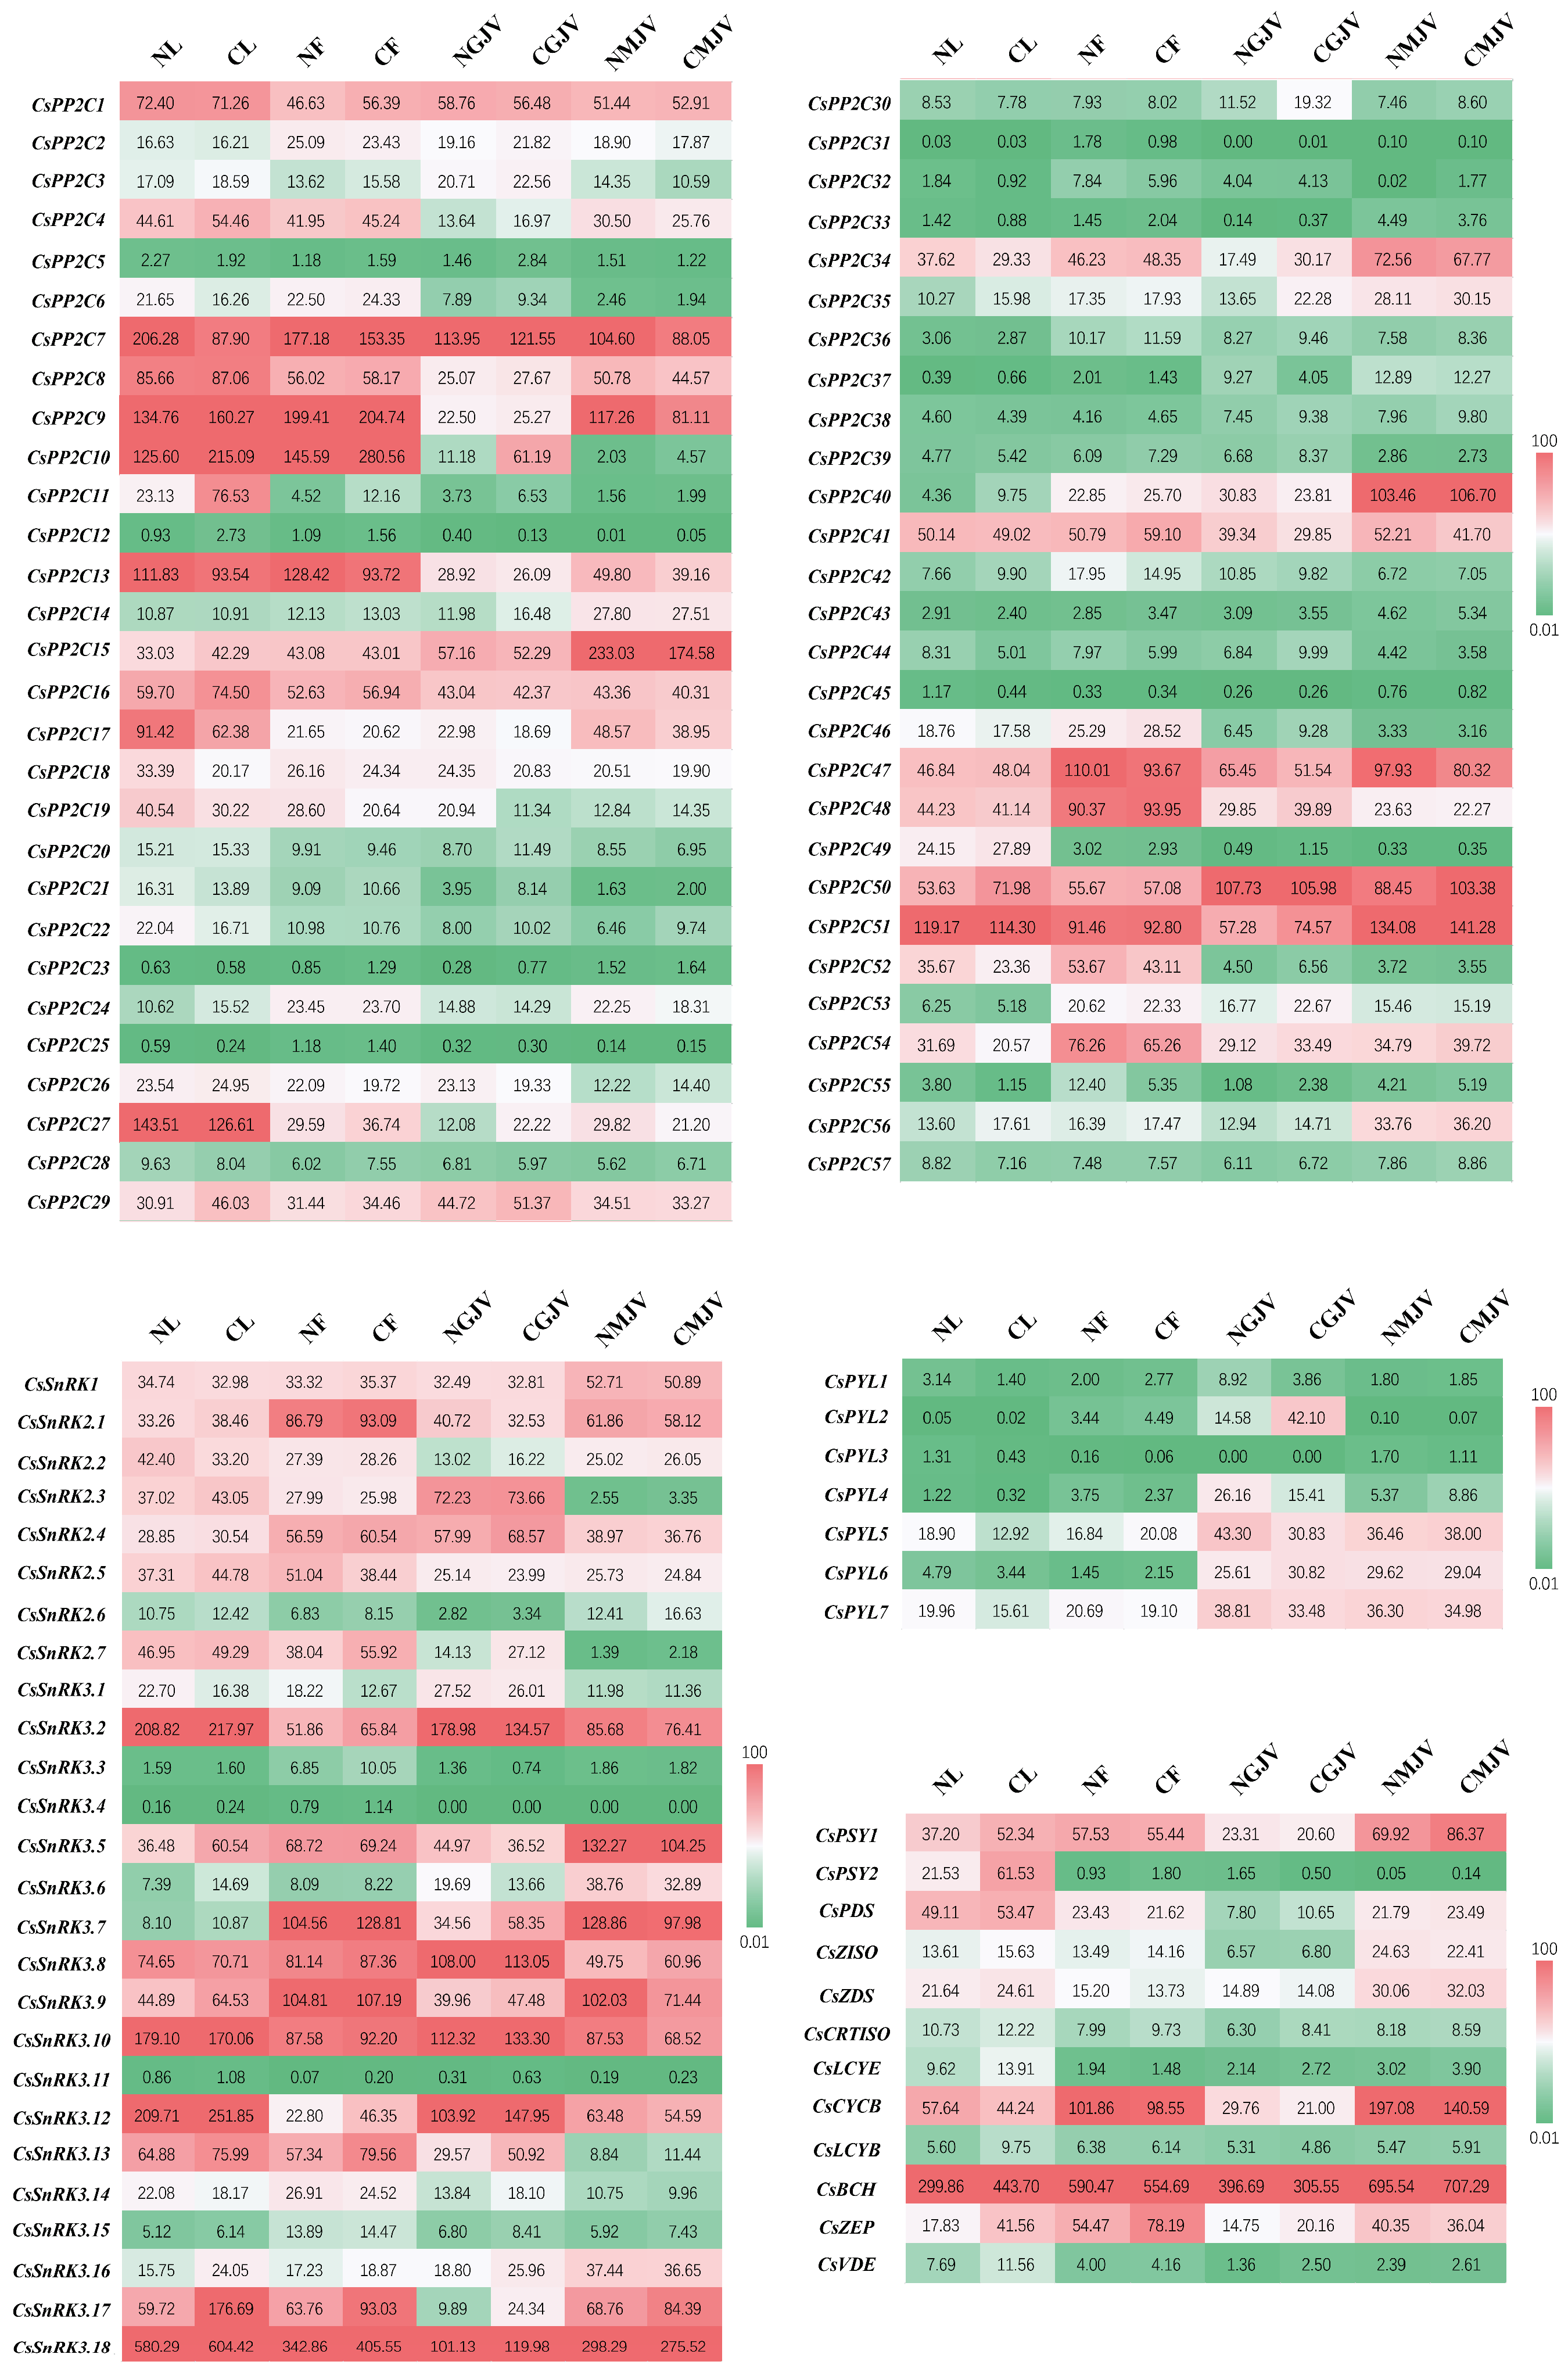
qPCR validation of four carotenoid-biosynthetic structural genes (CsPSY1, CsPDS, CsZISO, and CsBCH) confirmed consistency with RNA-seq data, verifying the reliability of transcriptomic analyses (Figure 5). Given minimal carotenoid differences between red- and white-core ‘Cara Cara’, equal-weight pooled samples from both phenotypes were used to represent ‘Cara Cara’ versus ‘Newhall’. FPKM-based expression heatmaps of PP2C, SnRK, and PYL families across tissues and developmental stages revealed (1) constitutively high expression of CsPP2C1/7/50/51 and CsSnRK1/2.4/3.2/3.8/3.9/3.10/3.18, and (2) consistently low/absent expression of CsPP2C12/23/25/31/45, CsSnRK3.4/3.11, and CsPYL3 (the sole low-expressing PYL member) (Figure 6). Key carotenoid structural genes showed comparable expression in ‘Newhall’ and ‘Cara Cara’ (Figure 6), failing to explain ‘Cara Cara’’s > 26-fold higher phytoene accumulation in leaves, flowers, and juice vesicles (Figure 3B,F and Figure 4C). Tissue-specific genes were filtered using the following thresholds: floral-specific (F: NF/NL ≥ 2 & CF/CL ≥ 2), young fruit juice vesicle-specific (GJV: NGJV/NL ≥ 2 & CGJV/CL ≥ 2), and mature fruit juice vesicle-specific (MJV: NMJV/NL ≥ 2 and CMJV/CL ≥ 2) (Table 1). Venn analysis identified six reproductive organ-specific genes (CsSnRK3.7, CsPP2C36/37/40/53, and CsPYL4) potentially regulating fruit maturation and carotenoid metabolism (Figure 7). Screening for ‘Cara Cara’-specific regulators (‘Cara Cara’/’Newhall’ ≥ 1.5 or ≤0.6) pinpointed a single candidate, CsPP2C10, providing a critical lead for investigating phytoene hyperaccumulation (Figure 7).

3.4. WGCNA Integrates Transcriptome and Carotenoid Profiles Revealing a ‘Cara Cara’-Specific Module for Linear Carotenoid Accumulation; Network Analysis Identifies Candidate SnRK, PYL, PP2C, and TF Regulators of Post-Transcriptional Control

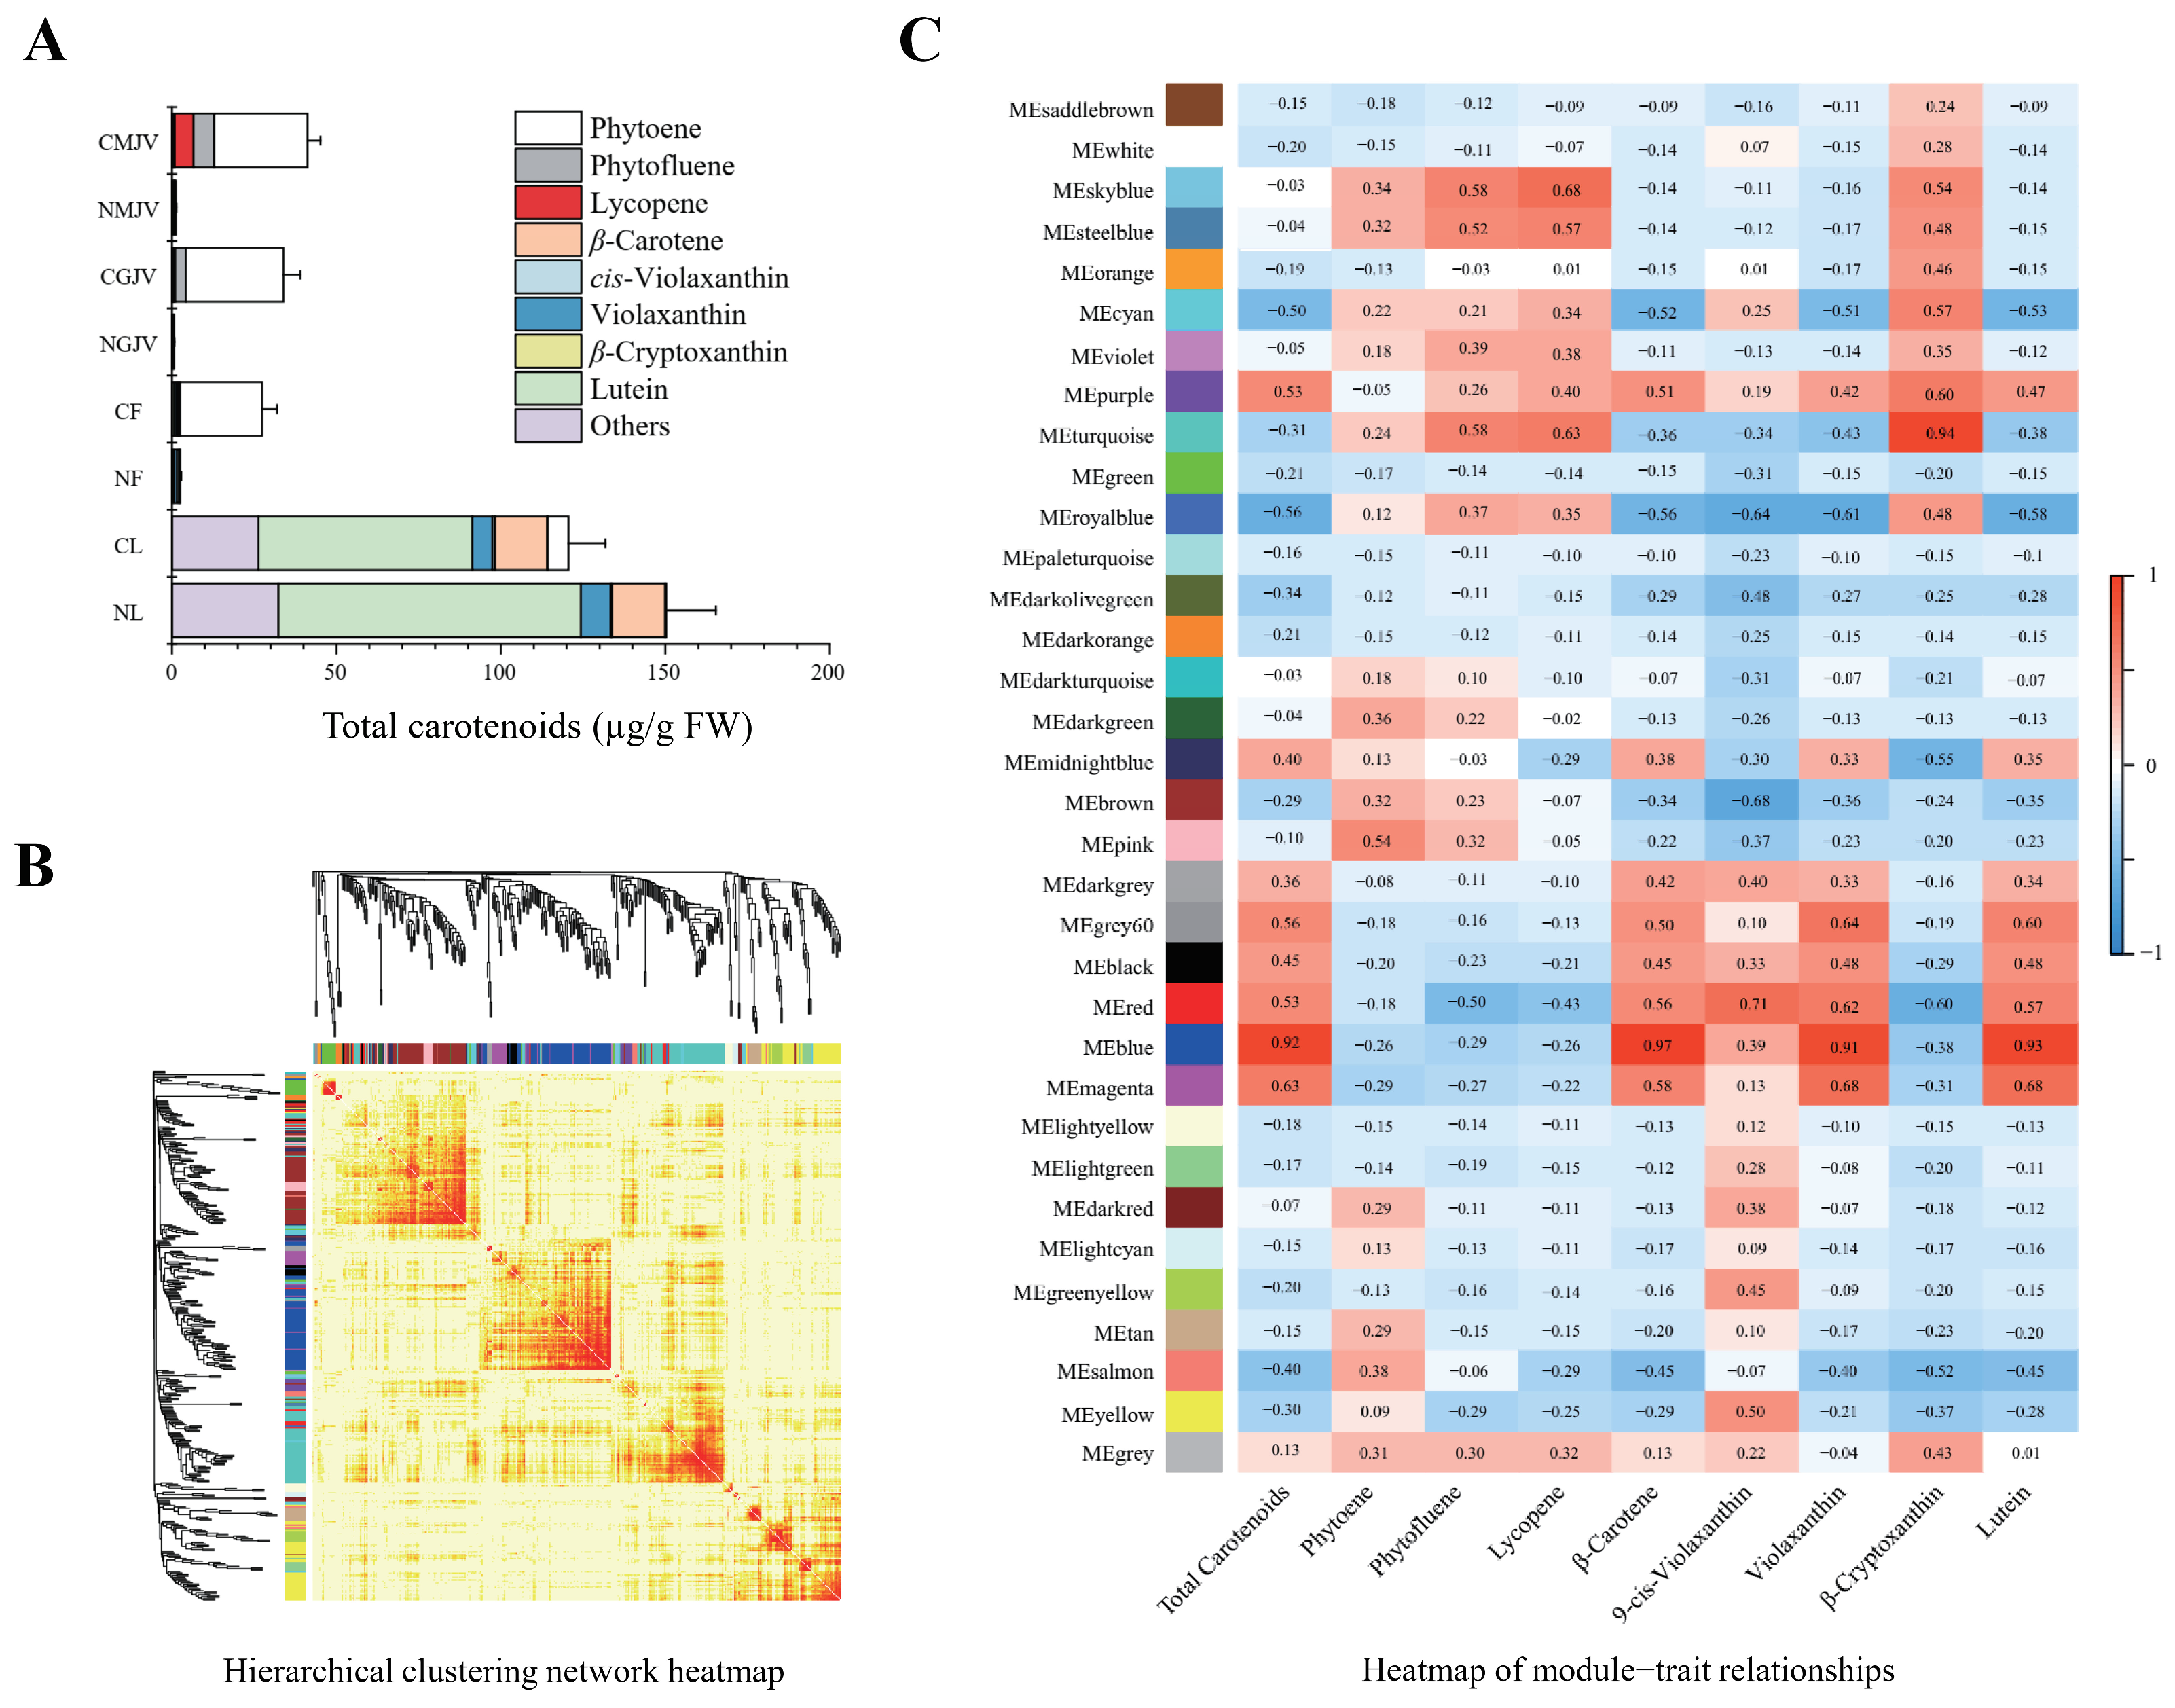
To investigate the potential regulation of CsSnRK, CsPP2C, and CsPYL gene families on carotenoid biosynthesis, specifically phytoene hyperaccumulation in ‘Cara Cara’, we performed WGCNA co-expression analysis integrating transcriptome data from ‘Cara Cara’ and ‘Newhall’ tissues from different organs and fruit developmental stages with carotenoid metabolic profiles (Figure 8A), aiming to identify modules associated with specific carotenoid accumulation (Figure 8).
Hierarchical clustering and module-trait heatmaps defined 34 distinct modules, each characterized by unique carotenoid accumulation patterns (Figure 8B,C). Focusing on modules linked to phytoene, phytofluene, and lycopene accumulation in ‘Cara Cara’ juice vesicles, we ranked modules by summing correlation coefficients for these three traits; the sky-blue, turquoise, and steel-blue modules topped the list (Table 2).
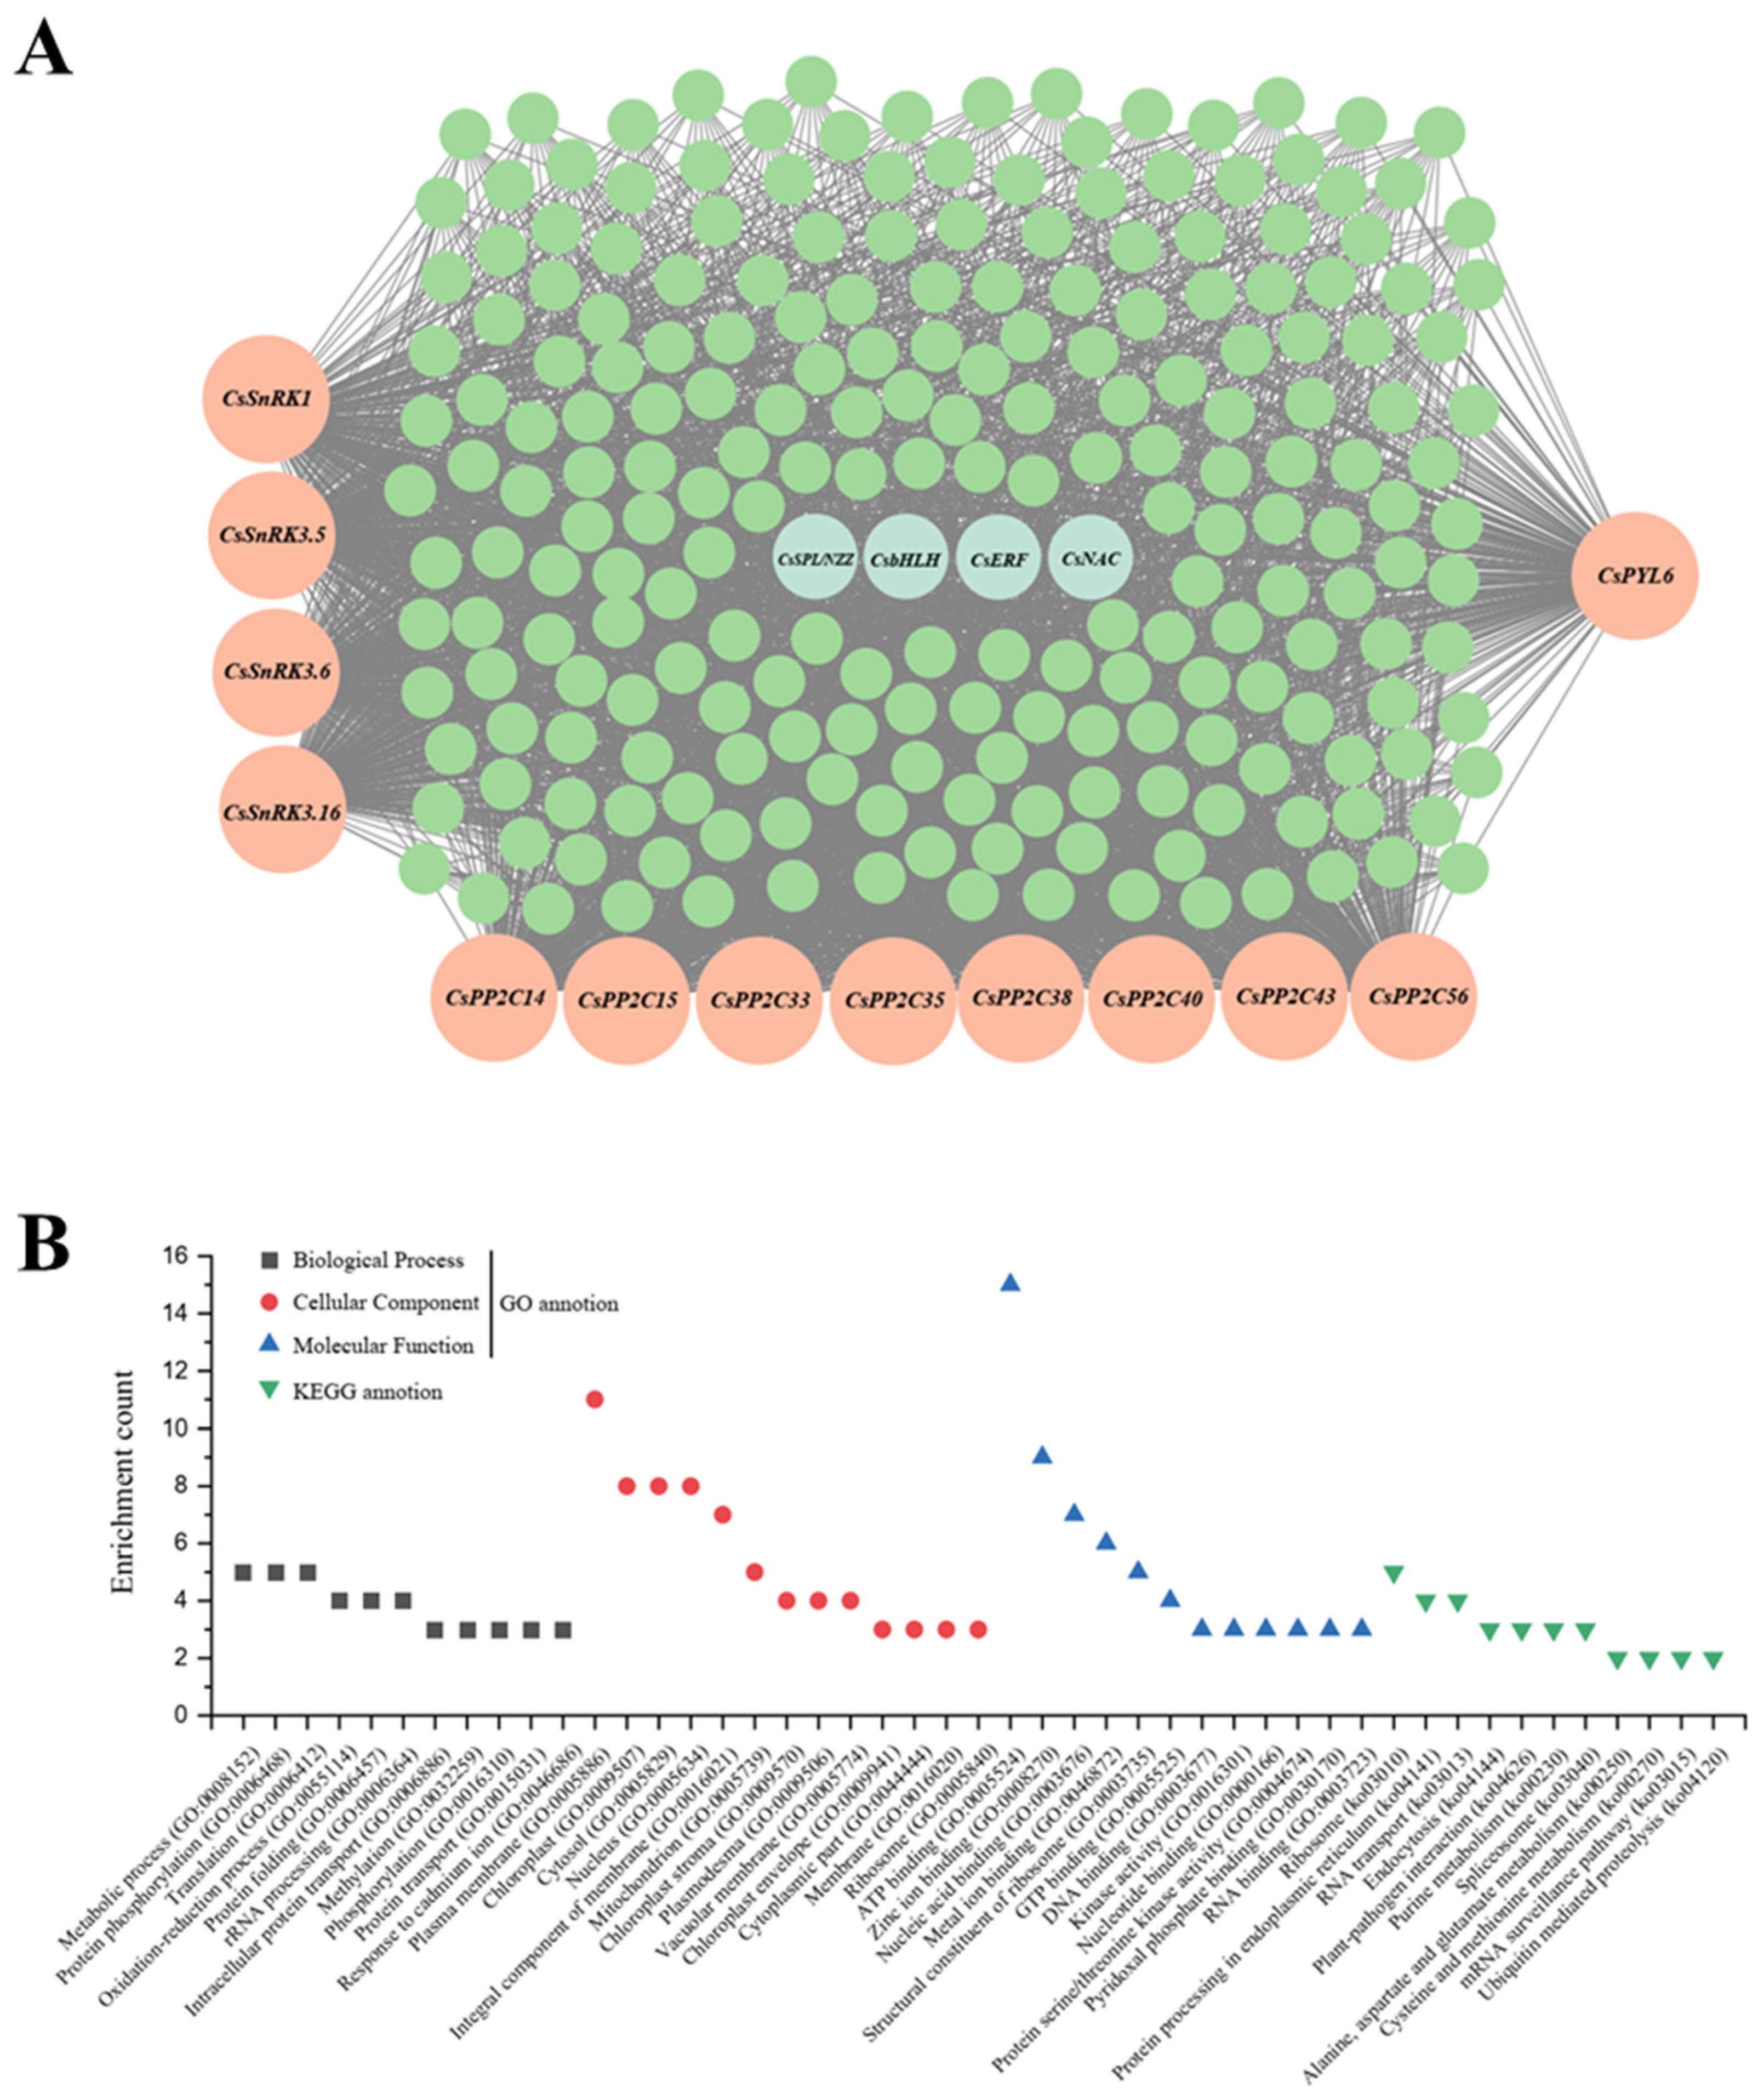
Analysis of CsSnRK/PP2C/PYL family distribution across modules revealed turquoise contained the highest number (13 members: CsSnRK1/3.5/3.6/3.16, CsPP2C14/15/33/35/38/40/43/56, and CsPYL6) (Table 3) alongside key carotenoid structural genes (CsPSY1, CsZISO, and CsZDS), implicating turquoise in regulating phytoene/phytofluene/lycopene synthesis (Table 4, Tables S2 and S3; Figure S4). Within this module, four transcription factors (SPL/NZZ, NAC, bHLH, and ERF) potentially bridge post-transcriptional phosphorylation to transcriptional control of structural genes. Connectivity analysis prioritized regulatory hubs: SPL/NZZ and bHLH ranked highly, while structural genes (CsPSY1/ZISO/ZDS; ranks 2332/2082/1847) showed low connectivity as expected; notably, CsSnRK1 and CsPP2C14/15/40/56 exhibited high connectivity, with CsPP2C40 (rank 67) emerging as a potential hub gene (Table 4). Cytoscape-visualized co-expression networks revealed gene interactions (Figure 9A, Table S4). GO/KEGG enrichment of turquoise highlighted top terms: metabolic process (GO:0008152), protein phosphorylation (GO:0006468), plasma membrane (GO:0005886), chloroplast (GO:0009507), ATP binding (GO:0005524), and pathways including Ribosome (ko03010), Protein processing in endoplasmic reticulum (ko04141), and RNA transport (ko03013)—indicating processes relevant to carotenoid metabolism and post-transcriptional regulation (Figure 9B).

4. Discussion

This study provides a comprehensive genomic identification of the SnRK, PYL, and PP2C families in sweet orange and leverages the natural phenotypic variation between the wild-type ‘Newhall’ and the ‘Cara Cara’ mutant to investigate post-transcriptional regulatory mechanisms controlling carotenoid metabolism. Multi-omics analysis serves as a powerful and indispensable tool in plant research, enabling the systematic discovery of novel regulatory mechanisms, key genes, and signaling metabolites that govern complex plant responses to development and environmental stresses [30,31,32,33,34]. Our multi-omics approach, integrating genomics, transcriptomics, metabolomics, and co-expression network analysis, yields several novel insights with significant implications for both basic plant biology and applied horticulture.

4.1. A Putative Phosphorylation Network Orchestrates Carotenoid Hyperaccumulation

The most salient finding of this study is the pronounced disconnect between transcript levels of carotenoid biosynthetic genes and the massive (26-fold) accumulation of linear carotenoids in ‘Cara Cara’ across tissues (leaves, flowers, and juice vesicles) (Figure 3, Figure 4 and Figure 6). This strongly implicates regulatory mechanisms acting post-transcriptionally. While post-transcriptional regulation is crucial for plant signal transduction, its role in metabolic synthesis is less explored; SnRK kinases emerge as pivotal core factors mediating this level of regulation [35,36,37,38,39]. Our WGCNA analysis identified a key turquoise module highly correlated with phytoene, phytofluene, and lycopene accumulation. The co-localization within this module of genes from the post-transcriptional cascade (CsSnRK1/3.5/3.6/3.16, CsPP2C14/15/33/35/38/40/43/56, and CsPYL6), key biosynthetic enzymes (CsPSY1, CsZISO, and CsZDS), and candidate transcription factors (SPL/NZZ, NAC, bHLH, and ERF) suggests an intricate regulatory network where phosphorylation is a central mechanism (Table 4, Figure 8).
This proposed network aligns with emerging evidence that post-translational modifications are crucial for metabolic regulation. For instance, SnRK2s are well-established kinases in ABA signaling that phosphorylate downstream targets like transcription factors and enzymes [12,13,15]. Our finding that specific CsPP2Cs (e.g., CsPP2C40, a high-connectivity hub) and CsSnRKs are central to this module suggests a mechanism where SnRK-mediated phosphorylation and PP2C-mediated dephosphorylation fine-tune the activity of proteins involved in the carotenogenic pathway. This could occur through direct phosphorylation of biosynthetic enzymes, altering their stability or activity, as demonstrated for other metabolic pathways [40,41], or more likely indirectly through the phosphorylation of transcription factors that regulate structural gene expression [13,42,43,44,45].

4.2. Bridging ABA Signaling and Carotenoid Metabolism: A Potential Feedback Loop

A particularly intriguing aspect of our model is its connection to ABA signaling. ABA is a carotenoid-derived hormone, creating a potential feedback loop where the hormone regulates its own biosynthetic precursors. Our results suggest that components of the core ABA signaling pathway (PYL-PP2C-SnRK) are co-expressed with carotenogenic genes (Table 4, Figure 6 and Figure 8). This implies that the SnRK-PP2C-PYL network in citrus may not only respond to ABA but also directly regulate carotenoid precursor availability.
This finding adds a new layer to the understanding of ABA’s role beyond stress response, positioning it as a direct modulator of core metabolism. It would be highly relevant to explore how environmental stresses known to induce ABA production (e.g., drought) impact carotenoid accumulation in these genotypes via this proposed mechanism, thus bridging the gap between the abstract’s mention of stress resilience and the discussion of metabolic adaptation.

4.3. Scientific Advance and Comparison with Previous Studies

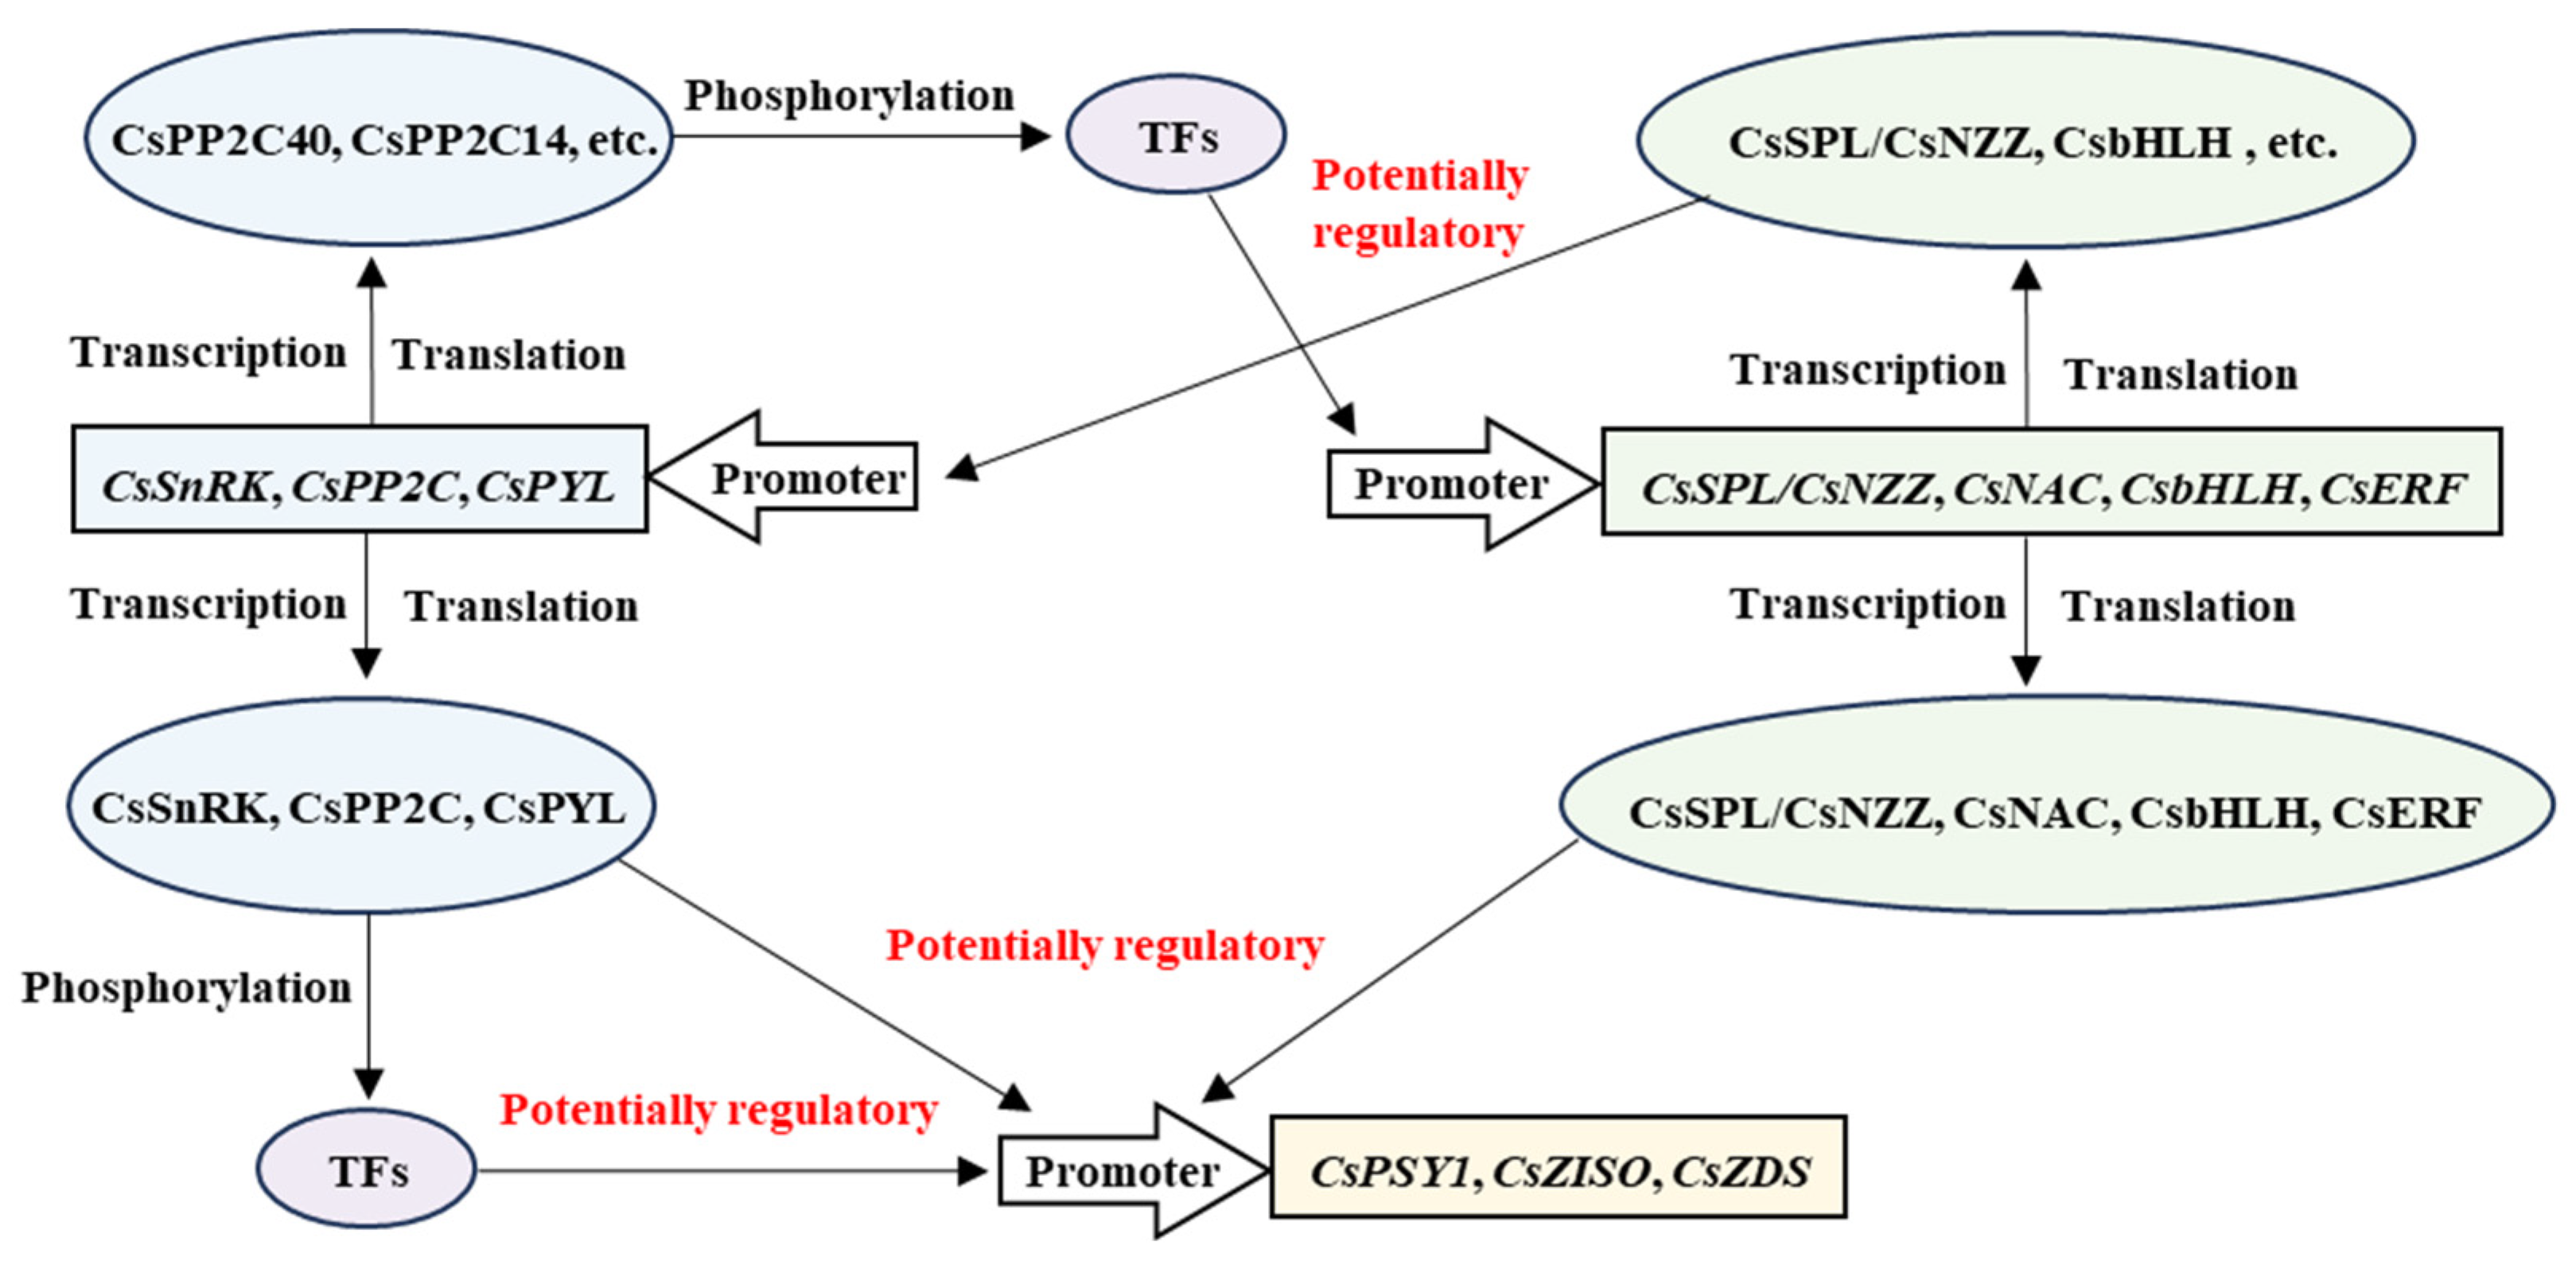
Our work represents a significant advance over previous studies in citrus [22]. While earlier research identified some SnRK2 and PP2C members, our study provides the first comprehensive genome-wide analysis of all three gene families (SnRK, PYL, and PP2C) in sweet orange, revealing a contraction of the CsSnRK, CsPP2C, and CsPYL families compared to Arabidopsis (Figure 2). More importantly, by moving beyond descriptive gene identification and employing WGCNA on multi-tissue, multi-omics data from contrasting genotypes, we predict a functional, post-transcriptional regulatory network (Figure 10). This approach addresses a critical gap in the field, as the regulatory mechanisms controlling carotenoid accumulation in citrus, particularly post-transcriptionally, have remained largely unexplored.

4.4. Limitations and Future Perspectives

It is crucial to highlight that the regulatory model proposed in Figure 10, while informed by robust co-expression analysis, remains speculative and requires direct experimental validation. The arrows labeled “potentially regulatory” denote predicted interactions based on correlation and connectivity, not confirmed mechanistic links. A major limitation of this study is the lack of functional validation experiments. Future studies must include phosphorylation assays (e.g., in vitro kinase assays, phosphoproteomics), protein–protein interaction studies (e.g., Y2H, Co-IP, BiFC) to confirm the interactions between CsSnRKs/CsPP2Cs and their putative targets (e.g., CsPSY1, TFs), and functional characterization through gene overexpression/knockdown in citrus or model systems to assess the impact on carotenoid profiles.
Furthermore, the exploration of the relationship between plant resilience and hormonal regulation, as mentioned in the abstract, is not fully developed here. Future work should explicitly test whether the proposed network confers enhanced stress resilience to the ‘Cara Cara’ mutant by subjecting both genotypes to abiotic stresses and monitoring changes in the network components and carotenoid accumulation.

5. Conclusions

In conclusion, our study moves beyond transcriptional regulation and provides compelling evidence for a novel, phosphorylation-mediated post-transcriptional mechanism that fine-tunes carotenoid accumulation in citrus. We propose a model where an expanded SnRK-PP2C-PYL network, integrated with transcriptional regulators, modulates carotenogenic flux, potentially linking ABA signaling to metabolic homeostasis. This work not only provides a foundational resource of candidate genes but also unveils a new regulatory layer for carotenoid metabolism, offering prioritized molecular targets for breeding nutrient-dense and climate-resilient citrus varieties. The validation of this proposed network constitutes an essential and exciting direction for future research.

Supplementary Materials

The following supporting information can be downloaded at https://www.mdpi.com/article/10.3390/metabo15090610/s1: Figure S1: Protein sequences of CsSnRKs and AtSnRKs for phylogenetic analysis; Figure S2: Protein sequences of CsPP2Cs and AtPP2Cs for phylogenetic analysis; Figure S3: Protein sequences of CsPYLs and AtPYLs for phylogenetic analysis; Figure S4: Amino acid sequences derived from predicted ORFs of 222 genes in the turquoise module; Table S1: Primer for qPCR; Table S2: All genes in turquoise module; Table S3: turquoise 222 genes annotation; Table S4: Network analysis in Cytoscape.

Author Contributions

Conceptualization, P.L. and C.S.; methodology, P.L. and Z.S.; software, P.L. and T.L.; validation, P.L. and Z.S.; formal analysis, P.L. and T.L.; investigation, P.L. and T.L.; resources, P.L. and T.L.; data curation, P.L., Z.S., and J.J.; writing—original draft preparation, P.L.; writing—review and editing, P.L., Z.S., J.L., W.L. and C.S.; supervision, P.L. and C.S.; project administration, C.S.; funding acquisition, C.S. All authors have read and agreed to the published version of the manuscript.

Funding

This work was supported by the Special Funds for Discipline Construction in the Field of Traditional Chinese Medicine of Zhejiang Academy of Agricultural Sciences.

Institutional Review Board Statement

Not applicable.

Informed Consent Statement

Not applicable.

Data Availability Statement

The data presented in this study are available on request from the corresponding author. The data are not publicly available due to privacy.

Conflicts of Interest

The authors declare no conflicts of interest.

Abbreviations

The following abbreviations are used in this manuscript:
SnRKsucrose non-fermenting related kinases
PYR1pyrabactin resistance
PYLPYR1-like
RCARregulatory components of ABA receptors
PP2Cprotein phosphatases type 2C
TFstranscription factors
GGPPgeranylgeranyl pyrophosphate
PSYphytoene synthase
PDSphytoene desaturase
Z-ISOζ-carotene isomerase
ZDSζ-carotene desaturase
CrtISOcarotene isomerase
CYCBchromoplast-specific lycopene β-cyclase
LCYBlycopene β-cyclase
LCYElycopene ε-cyclase
BCHβ-carotene hydroxylase
ZEPzeaxanthin epoxidase
VDEviolaxanthin de-epoxidase
NSYneoxanthin synthase
NCED9-cis-epoxycarotenoid dioxygenase
CCDcarotenoid cleavage dioxygenase
NL‘Newhall’ leaf
CL‘Cara Cara’ leaf
NF‘Newhall’ flower
CF‘Cara Cara’ flower
NGJV‘Newhall’ green stage juice vesicle
CGJV‘Cara Cara’ green stage juice vesicle
NMJV‘Newhall’ mature stage juice vesicle
CMJV‘Cara Cara’ mature stage juice vesicle
WGCNAweighted gene co-expression network analysis
Co-IPco-immunoprecipitation
BiFCbimolecular fluorescence complementation
EMSAelectrophoretic mobility shift assays
qPCRquantitative real-time PCR

References

  1. Luckstead, J.; Devadoss, S. Trends and Issues Facing the US Citrus Industry. Choices 2021, 36, 1–10. [Google Scholar]
  2. Liu, S.; Xu, Y.; Yang, K.; Huang, Y.; Lu, Z.; Chen, S.; Gao, X.; Xiao, G.; Chen, P.; Zeng, X.; et al. Origin and De Novo Domestication of Sweet Orange. Nat. Genet. 2025, 57, 754–762. [Google Scholar] [CrossRef]
  3. Seminara, S.; Bennici, S.; Di Guardo, M.; Caruso, M.; Gentile, A.; La Malfa, S.; Distefano, G. Sweet Orange: Evolution, Characterization, Varieties, and Breeding Perspectives. Agriculture 2023, 13, 264. [Google Scholar] [CrossRef]
  4. Chiu, C.J.; Taylor, A. Nutritional Antioxidants and Age-Related Cataract and Maculopathy. Exp. Eye Res. 2007, 84, 229–245. [Google Scholar]
  5. Walter, M.H.; Strack, D. Carotenoids and Their Cleavage Products: Biosynthesis and Functions. Nat. Prod. Rep. 2011, 28, 663–692. [Google Scholar] [CrossRef]
  6. Fiedor, J.; Burda, K. Potential Role of Carotenoids as Antioxidants in Human Health and Disease. Nutrients 2014, 6, 466–488. [Google Scholar] [CrossRef]
  7. Nisar, N.; Li, L.; Lu, S.; Khin, N.C.; Pogson, B.J. Carotenoid Metabolism in Plants. Mol. Plant 2015, 8, 68–82. [Google Scholar] [CrossRef]
  8. Toledo-Ortiz, G.; Huq, E.; Rodríguez-Concepción, M. Direct Regulation of Phytoene Synthase Gene Expression and Carotenoid Biosynthesis by Phytochrome-Interacting Factors. Proc. Natl. Acad. Sci. USA 2010, 107, 11626–11631. [Google Scholar] [CrossRef] [PubMed]
  9. Llorente, B.; D’Andrea, L.; Ruiz-Sola, M.Á.; Botterweg, E.; Pulido, P.; Andilla, J.; Loza-Alvarez, P.; Rodriguez-Concepcion, M. Tomato Fruit Carotenoid Biosynthesis Is Adjusted to Actual Ripening Progression by a Light-Dependent Mechanism. Plant J. 2016, 85, 107–119. [Google Scholar] [CrossRef] [PubMed]
  10. Vrebalov, J.; Pan, I.L.; Arroyo, A.J.M.; McQuinn, R.; Chung, M.; Poole, M.; Rose, J.; Seymour, G.; Grandillo, S.; Giovannoni, J.; et al. Fleshy Fruit Expansion and Ripening Are Regulated by the Tomato SHATTERPROOF Gene TAGL1. Plant Cell 2009, 21, 3041–3062. [Google Scholar] [CrossRef] [PubMed]
  11. Martel, C.; Vrebalov, J.; Tafelmeyer, P.; Giovannoni, J.J. The Tomato MADS-Box Transcription Factor RIPENING INHIBITOR Interacts with Promoters Involved in Numerous Ripening Processes in a COLORLESS NONRIPENING-Dependent Manner. Plant Physiol. 2011, 157, 1568–1579. [Google Scholar] [CrossRef] [PubMed]
  12. Hrabak, E.M.; Chan, C.W.M.; Gribskov, M.; Harper, J.F.; Choi, J.H.; Halford, N.; Kudla, J.; Luan, S.; Nimmo, H.G.; Sussman, M.R.; et al. The Arabidopsis CDPK-SnRK Superfamily of Protein Kinases. Plant Physiol. 2003, 132, 666–680. [Google Scholar] [CrossRef] [PubMed]
  13. Komatsu, K.; Takezawa, D.; Sakata, Y. Decoding ABA and Osmostress Signalling in Plants from an Evolutionary Point of View. Plant Cell Environ. 2020, 43, 2894–2911. [Google Scholar] [CrossRef] [PubMed]
  14. He, Z.; Zhang, P.; Jia, H.; Zhang, S.; Nishawy, E.; Sun, X.; Dai, M. Regulatory Mechanisms and Breeding Strategies for Crop Drought Resistance. New Crops 2024, 1, 100029. [Google Scholar] [CrossRef]
  15. Ma, Y.; Szostkiewicz, I.; Korte, A.; Moes, D.; Yang, Y.; Christmann, A.; Grill, E. Regulators of PP2C Phosphatase Activity Function as Abscisic Acid Sensors. Science 2009, 324, 1064–1068. [Google Scholar] [CrossRef]
  16. Melcher, K.; Ng, L.M.; Zhou, X.E.; Soon, F.F.; Xu, Y.; Suino-Powell, K.M.; Park, S.Y.; Weiner, J.J.; Fujii, H.; Chinnusamy, V.; et al. A Gate-Latch-Lock Mechanism for Hormone Signalling by Abscisic Acid Receptors. Nature 2009, 462, 602–608. [Google Scholar] [CrossRef]
  17. Gonzalez-Guzman, M.; Pizzio, G.A.; Antoni, R.; Vera-Sirera, F.; Merilo, E.; Bassel, G.W.; Fernández, M.A.; Holdsworth, M.J.; Perez-Amador, M.A.; Kollist, H.; et al. Arabidopsis PYR/PYL/RCAR Receptors Play a Major Role in Quantitative Regulation of Stomatal Aperture and Transcriptional Response to Abscisic Acid. Plant Cell 2012, 24, 2483–2496. [Google Scholar] [CrossRef]
  18. Klingler, J.P.; Batelli, G.; Zhu, J.K. ABA Receptors: The START of a New Paradigm in Phytohormone Signalling. J. Exp. Bot. 2010, 61, 3199–3210. [Google Scholar] [CrossRef]
  19. Xue, T.; Wang, D.; Zhang, S.; Ehlting, J.; Ni, F.; Jakab, S.; Zheng, C.; Zhong, Y. Genome-Wide and Expression Analysis of Protein Phosphatase 2C in Rice and Arabidopsis. BMC Genom. 2008, 9, 550. [Google Scholar] [CrossRef]
  20. Lu, P.; Wang, C.; Yin, T.; Zhong, S.L.; Grierson, D.; Chen, K.S.; Xu, C.J. Cytological and Molecular Characterization of Carotenoid Accumulation in Normal and High-Lycopene Mutant Oranges. Sci. Rep. 2017, 7, 761. [Google Scholar] [CrossRef]
  21. Lu, P.; Wang, S.; Grierson, D.; Xu, C. Transcriptomic Changes Triggered by Carotenoid Biosynthesis Inhibitors and Role of Citrus sinensis Phosphate Transporter 4;2 (CsPHT4;2) in Enhancing Carotenoid Accumulation. Planta 2019, 249, 257–270. [Google Scholar] [CrossRef]
  22. Romero, P.; Lafuente, M.T.; Rodrigo, M.J. The Citrus ABA Signalosome: Identification and Transcriptional Regulation during Sweet Orange Fruit Ripening and Leaf Dehydration. J. Exp. Bot. 2012, 63, 4931–4945. [Google Scholar] [CrossRef] [PubMed]
  23. Langfelder, P.; Horvath, S. WGCNA: An R Package for Weighted Correlation Network Analysis. BMC Bioinform. 2008, 9, 559. [Google Scholar] [CrossRef]
  24. Finn, R.D.; Clements, J.; Eddy, S.R. HMMER Web Server: Interactive Sequence Similarity Searching. Nucleic Acids Res. 2011, 39, W29–W37. [Google Scholar] [CrossRef] [PubMed]
  25. Kumar, S.; Stecher, G.; Tamura, K. MEGA7: Molecular Evolutionary Genetics Analysis Version 7.0 for Bigger Datasets. Mol. Biol. Evol. 2016, 33, 1870–1874. [Google Scholar] [CrossRef]
  26. Subramanian, B.; Gao, S.; Lercher, M.J.; Hu, S.; Chen, W.H. Evolview v3: A Webserver for Visualization, Annotation, and Management of Phylogenetic Trees. Nucleic Acids Res. 2019, 47, W270–W275. [Google Scholar] [CrossRef]
  27. Xu, C.; Fraser, P.D.; Wang, W.; Bramley, P.M. Differences in the Carotenoid Content of Ordinary Citrus and Lycopene-Accumulating Mutants. J. Agric. Food Chem. 2006, 54, 5474–5481. [Google Scholar] [CrossRef] [PubMed]
  28. Shannon, P.; Markiel, A.; Ozier, O.; Baliga, N.S.; Wang, J.T.; Ramage, D.; Amin, N.; Schwikowski, B.; Ideker, T. Cytoscape: A Software Environment for Integrated Models of Biomolecular Interaction Networks. Genome Res. 2003, 13, 2498–2504. [Google Scholar] [CrossRef]
  29. Jin, J.; Tian, F.; Yang, D.; Meng, Y.-Q.; Kong, L.; Luo, J.; Gao, G. PlantTFDB 4.0: Toward a Central Hub for Transcription Factors and Regulatory Interactions in Plants. Nucleic Acids Res. 2017, 45, D1040–D1045. [Google Scholar] [CrossRef]
  30. Luo, F.; Yu, Z.; Zhou, Q.; Huang, A. Multi-omics-based discovery of plant signaling molecules. Metabolites 2022, 12, 76. [Google Scholar] [CrossRef]
  31. Monterisi, S.; Zuluaga, M.Y.A.; Senizza, B.; Cardarelli, M.; Rouphael, Y.; Colla, G.; Lucini, L.; Cesco, S.; Pii, Y. The integrated multi-omics analysis unravels distinct roles of Malvaceae-derived protein hydrolysate and its molecular fraction in modulating tomato resilience under limited nitrogen availability. Plant Stress 2025, 15, 100771. [Google Scholar] [CrossRef]
  32. Pardo-Hernández, M.; García-Pérez, P.; Lucini, L.; Rivero, R.M. Multi-omics exploration of the involvement of ABA in identifying unique molecular markers for single and combined stresses in tomato plants. J. Exp. Bot. 2024, erae372. [Google Scholar] [CrossRef] [PubMed]
  33. Ren, H.; Yang, W.; Jing, W.; Shahid, M.O.; Liu, Y.; Qiu, X.; Choisy, P.; Xu, T.; Ma, N.; Gao, J.; et al. Multi-omics analysis reveals key regulatory defense pathways and genes involved in salt tolerance of rose plants. Hortic. Res. 2024, 11, uhae068. [Google Scholar] [CrossRef] [PubMed]
  34. Wang, S.; Liu, L.; Mi, X.; Zhao, S.; An, Y.; Xia, X.; Guo, R.; Wei, C. Multi-omics analysis to visualize the dynamic roles of defense genes in the response of tea plants to gray blight. Plant J. 2021, 106, 862–875. [Google Scholar] [CrossRef]
  35. Kumar, V.; Srivastava, A.K.; AbdElgawad, H. Transcriptional and Post-Transcriptional Regulation of Plant Growth, Development, and Stress Responses. J. Plant Growth Regul. 2025, 44, 1317–1322. [Google Scholar] [CrossRef]
  36. Mao, X.; Li, Y.; Rehman, S.U.; Zhao, S.; An, Y.; Xia, X.; Guo, R.; Wei, C. The sucrose non-fermenting 1-related protein kinase 2 (SnRK2) genes are multifaceted players in plant growth, development and response to environmental stimuli. Plant Cell Physiol. 2020, 61, 225–242. [Google Scholar] [CrossRef]
  37. Peixoto, B.; Baena-González, E. Management of plant central metabolism by SnRK1 protein kinases. J. Exp. Bot. 2022, 73, 7068–7082. [Google Scholar] [CrossRef]
  38. Radani, Y.; Li, R.; Korboe, H.M.; Ma, H.; Yang, L. Transcriptional and post-translational regulation of plant bHLH transcription factors during the response to environmental stresses. Plants 2023, 12, 2113. [Google Scholar] [CrossRef]
  39. Singh, A.; Roychoudhury, A. Gene regulation at transcriptional and post-transcriptional levels to combat salt stress in plants. Physiol. Plant. 2021, 173, 1556–1572. [Google Scholar] [CrossRef]
  40. Wang, Q.; Qin, G.; Cao, M.; Chen, R.; He, Y.; Yang, L.; Zeng, Z.; Yu, Y.; Gu, Y.; Xing, W.; et al. A phosphorylation-based switch controls TAA1-mediated auxin biosynthesis in plants. Nat. Commun. 2020, 11, 679. [Google Scholar] [CrossRef] [PubMed]
  41. Robert, K.Y.; Bieberich, E. Regulation of glycosyltransferases in ganglioside biosynthesis by phosphorylation and dephosphorylation. Mol. Cell. Endocrinol. 2001, 177, 19–24. [Google Scholar] [CrossRef]
  42. Song, J.; Lin, R.; Tang, M.; Wang, L.; Fan, P.; Xia, X.; Yu, J.; Zhou, Y. SlMPK1- and SlMPK2-mediated SlBBX17 phosphorylation positively regulates CBF-dependent cold tolerance in tomato. New Phytol. 2023, 239, 1887–1902. [Google Scholar] [CrossRef]
  43. Wang, B.X.; Sun, Z.G.; Liu, Y.; Xu, B.; Li, J.; Chi, M.; Xing, Y.; Yang, B.; Li, J.; Liu, J.; et al. A pervasive phosphorylation cascade modulation of plant transcription factors in response to abiotic stress. Planta 2023, 258, 73. [Google Scholar] [CrossRef] [PubMed]
  44. Wu, C.J.; Shan, W.; Liu, X.C.; Zhu, L.S.; Wei, W.; Yang, Y.Y.; Guo, Y.F.; Bouzayen, M.; Chen, J.Y.; Lu, W.J.; et al. Phosphorylation of transcription factor bZIP21 by MAP kinase MPK6-3 enhances banana fruit ripening. Plant Physiol. 2022, 188, 1665–1685. [Google Scholar] [CrossRef] [PubMed]
  45. Zhang, W.J.; Zhou, Y.; Zhang, Y.; Su, Y.H.; Xu, T. Protein phosphorylation: A molecular switch in plant signaling. Cell Rep. 2023, 42, 112856. [Google Scholar] [CrossRef] [PubMed]
Figure 1. Carotenoid biosynthetic pathway in higher plants and ABA signaling via SnRK-PP2C-PYL cascades. Illustration depicts: (1) core carotenoid biosynthesis from geranylgeranyl diphosphate (GGPP) to α/β-branch carotenoids and ABA precursor cleavage by NCED; (2) ABA signal transduction through PYL receptor-PP2C phosphatase-SnRK2 kinase cascades; and (3) structural domains distinguishing SnRK subfamilies. GGPP, geranylgeranyl pyrophosphate; PSY, phytoene synthase; PDS phytoene desaturase; Z-ISO, ζ-carotene isomerase; ZDS, ζ-carotene desaturase; CrtISO, carotene isomerase; CYCB, chromoplast-specific lycopene β-cyclase; LCYB, lycopene β-cyclase; LCYE, lycopene ε-cyclase; BCH, β-carotene hydroxylase; ZEP, zeaxanthin epoxidase; VDE, violaxanthin de-epoxidase; NSY, neoxanthin synthase; NCED, 9-cis-epoxycarotenoid dioxygenase; CCD, carotenoid cleavage dioxygenase.
Metabolites 15 00610 g001
Figure 2. Phylogenetic analysis of SnRK, PYL, and PP2C families in Citrus sinensis. (A) SnRK family tree showing the three subfamilies SnRK1, SnRK2, and SnRK3. (B) PYL family tree showing the three subfamilies (I, II, III). (C) PYL family tree showing the 13 subfamilies (A–L). Trees were constructed using the neighbor-joining method in MEGA 7 with 1000 bootstrap replicates. Arabidopsis SnRKs, PYLs, and PP2Cs were included as references for identification and classification.
Metabolites 15 00610 g002
Figure 3. Morphological and carotenoid composition differences between ‘Newhall’ and ‘Cara Cara’ oranges exhibiting distinct color variation. (A) Longitudinal sections of mature ‘Newhall’ (N) and ‘Cara Cara’ (C1–C7) fruits. (B,C) Total carotenoid (B) and total xanthophyll (C) content in juice vesicles of individual fruits (fresh weight, FW). (D) Morphology of ‘Newhall’ and ‘Cara Cara’ fruits with white (W)- or red (R)-pigmented central cores at key developmental stages: green (G), mature Green (MG), turning (T), and mature (M). (E) Composition of carotenoids accumulated in red central cores (R), predominantly linear carotenoids (phytoene, phytofluene, and lycopene) with phytoene as the major component. (F) Total carotenoid content in juice vesicles (FW) of ‘Cara Cara’ fruits with white (W)- or red (R)-pigmented central cores across developmental stages. All data were derived from three independent biological replicates (n = 3), and error bars represent the standard error (SE).
Metabolites 15 00610 g003
Figure 4. Comparative analysis of morphology, plastid ultrastructure, and pigment content in leaves and flowers of ‘Newhall’ and ‘Cara Cara’ oranges with white- or red-pigmented central cores. (A,B) Morphology and chloroplast ultrastructure in leaves (A: ‘Newhall’ leaf, NL; ‘Cara Cara’ white-core leaf, CWL; and ‘Cara Cara’ red-core leaf, CRL) and flowers (B: ‘Newhall’ flower, NF; ‘Cara Cara’ white-core flower, CWF; and ‘Cara Cara’ red-core flower, CRF). (C,D) Total carotenoid (C) and total chlorophyll (D) content in leaves and flowers of ‘Newhall’ and ‘Cara Cara’ oranges with white- or red-pigmented cores. All data were derived from three independent biological replicates (n = 3), and error bars represent the standard error (SE).
Metabolites 15 00610 g004
Figure 5. Validation of RNA-seq expression data by qPCR for key carotenoid biosynthetic genes. Expression levels of CsPSY1, CsPDS, CsZISO, and CsBCH were measured by both RNA-seq (FPKM) and qPCR (2−ΔCT) across various tissues and developmental stages. The relative fold-change values were normalized to CsActin. The strong concordance between the two methods confirms the reliability of the transcriptomic data. Tissue codes: NL, ‘Newhall’ leaf; CL, ‘Cara Cara’ leaf; NF, ‘Newhall’ flower; CF, ‘Cara Cara’ flower; NGJV, ‘Newhall’ green stage juice vesicle; CGJV, ‘Cara Cara’ green stage juice vesicle; NMJV, ‘Newhall’ mature stage juice vesicle; and CMJV, ‘Cara Cara’ mature stage juice vesicle. All data were derived from three independent biological replicates (n = 3), and error bars represent the standard error (SE).
Metabolites 15 00610 g005
Figure 6. Heatmap of FPKM expression levels for CsPP2Cs, CsSnRKs, CsPYLs, and carotenoid biosynthetic genes across tissues of ‘Newhall’ and ‘Cara Cara’ oranges. NL, ‘Newhall’ leaf; CL, ‘Cara Cara’ leaf; NF, ‘Newhall’ flower; CF, ‘Cara Cara’ flower; NGJV, ‘Newhall’ green stage juice vesicle; CGJV, ‘Cara Cara’ green stage juice vesicle; NMJV, ‘Newhall’ mature stage juice vesicle; and CMJV, ‘Cara Cara’ mature stage juice vesicle. To clearly visualize the expression differences of most genes, the color scale of the heatmap was set to a range of 0.01 to 100 (FPKM). Expression values beyond these limits are represented by the maximum or minimum color.
Metabolites 15 00610 g006
Figure 7. Reproductive organ-specific and ‘Cara Cara’-specific expression features of CsSnRK, CsPP2C, and CsPYL genes. (A) Venn diagram identifying reproductive organ-specific CsSnRK/PP2C/PYL genes. (B) Heatmap of developmental-stage expression profiles for reproductive organ-specific genes. (C) CsPP2C10 as the sole ‘Cara Cara’-specific gene member and its developmental-stage expression heatmap. Expression specificity codes: F (floral-specific), GJV (green juice vesicle-specific), MJV (mature juice vesicle-specific). Tissue codes: NL (‘Newhall’ leaf), CL (‘Cara Cara’ leaf), NF (‘Newhall’ flower), CF (‘Cara Cara’ flower), NGJV (‘Newhall’ green juice vesicle), CGJV (‘Cara Cara’ green juice vesicle), NMJV (‘Newhall’ mature juice vesicle), and CMJV (‘Cara Cara’ mature juice vesicle). To clearly visualize the expression differences of most genes, the color scale of the heatmap was set to a range of 0.5 to 2 (fold change). Expression values beyond these limits are represented by the maximum or minimum color.
Metabolites 15 00610 g007
Figure 8. Integrated WGCNA of transcriptome and carotenoid metabolism across tissues and developmental stages. (A) Carotenoid metabolite profiles in sampled tissues. (B) Hierarchical clustering of co-expression modules. (C) Module-trait relationship heatmap; heatmap values indicate correlation coefficients between modules and specific carotenoids. Tissues: NL (‘Newhall’ leaf), CL (‘Cara Cara’ leaf), NF (‘Newhall’ flower), CF (‘Cara Cara’ flower), NGJV (‘Newhall’ green juice vesicle), CGJV (‘Cara Cara’ green juice vesicle), NMJV (‘Newhall’ mature juice vesicle), and CMJV (‘Cara Cara’ mature juice vesicle).
Metabolites 15 00610 g008
Figure 9. Co-expression network and functional enrichment analysis of the turquoise module. (A) Gene–gene interaction network visualized with Cytoscape. (B) Functional enrichment of GO terms and KEGG pathways.
Metabolites 15 00610 g009
Figure 10. Putative dual-layer regulatory network mediated by SnRK/PP2C/PYL in carotenoid metabolism. Integrates transcript-level (TF-mediated) and post-transcriptional (phosphorylation) control. Diagram elements: arrows = promoters; rectangles = genes; ovals = proteins.
Metabolites 15 00610 g010
Table 1. Stage-specific expression patterns of CsSnRK, CsPP2C, and CsPYL genes during fruit development in ‘Newhall’ and ‘Cara Cara’ oranges. Expression specificity codes: F (floral-specific), GJV (green juice vesicle-specific), and MJV (mature juice vesicle-specific). Tissue codes: NL (‘Newhall’ leaf), CL (‘Cara Cara’ leaf), NF (‘Newhall’ flower), CF (‘Cara Cara’ flower), NGJV (‘Newhall’ green juice vesicle), CGJV (‘Cara Cara’ green juice vesicle), NMJV (‘Newhall’ mature juice vesicle), and CMJV (‘Cara Cara’ mature juice vesicle).
F Expressed GenesGJV Expressed GenesMJV Expressed Genes
CsSnRK2.1; CsSnRK3.3; CsSnRK3.4; CsSnRK3.7; CsSnRK3.15NF/NL≥2
and
CF/CL≥2
CsSnRK2.4; CsSnRK3.7NGJV/NL≥2
and
CGJV/CL≥2
CsSnRK3.6; CsSnRK3.7NMJV/NL≥2
and
CMJV/CL≥2
CsPP2C31; CsPP2C32; CsPP2C36; CsPP2C37; CsPP2C40; CsPP2C48; CsPP2C53; CsPP2C54; CsPP2C55CsPP2C36; CsPP2C37; CsPP2C40; CsPP2C53CsPP2C14; CsPP2C15; CsPP2C23; CsPP2C31; CsPP2C33; CsPP2C36; CsPP2C37; CsPP2C40; CsPP2C53; CsPP2C56
CsPYL2; CsPYL4CsPYL1; CsPYL2; CsPYL5; CsPYL6CsPYL4; CsPYL6
Table 2. Correlation coefficients of WGCNA modules with specific carotenoids (phytoene, phytofluene, and lycopene) and cumulative ranking.
ModulePhytoenePhytoflueneLycopeneSumRank
MEskyblue0.34 0.58 0.68 1.60 1
MEturquoise0.24 0.58 0.63 1.45 2
MEsteelblue0.32 0.52 0.57 1.41 3
MEviolet0.18 0.39 0.38 0.95 4
MEgrey0.31 0.30 0.32 0.93 5
MEroyalblue0.12 0.37 0.35 0.84 6
MEcyan0.22 0.21 0.34 0.77 7
Table 3. Distribution frequency of CsSnRK, CsPP2C, and CsPYL genes across WGCNA co-expression modules. Values indicate gene counts and percentage representation per module (sorted by frequency).
ModuleCountPercentage
turquoise1313.48%
black1011.24%
red1011.24%
blue910.11%
yellow910.11%
brown66.74%
cyan66.74%
purple55.62%
royalblue55.62%
salmon44.49%
grey6033.37%
midnightblue22.25%
darkolivegreen11.12%
darkred11.12%
greenyellow11.12%
lightcyan11.12%
lightgreen11.12%
lightyellow11.12%
magenta11.12%
pink11.12%
Table 4. Intramodular connectivity and ranking of hub genes in the turquoise co-expression module. Genes include members of the CsSnRK, CsPP2C, and CsPYL families, transcription factors, and carotenoid-biosynthetic structural genes. Connectivity represents node connectivity in the scale-free network, where higher values indicate greater potential for regulatory interactions and elevated hierarchical importance (sorted by rank).
ClassificationGene NameGene IDConnectivityRank by Connectivity
SnRKCsSnRK1Cs6g21650750.35 602
CsSnRK3.5Cs4g01450102.98 3788
CsSnRK3.6orange1.1t02758522.88 1331
CsSnRK3.16Cs2g28990582.86 1093
PP2CCsPP2C14Cs3g20540971.09 106
CsPP2C15Cs9g18330796.31 496
CsPP2C33Cs9g03785455.52 1578
CsPP2C35orange1.1t03838337.26 2119
CsPP2C38Cs7g22880303.26 2288
CsPP2C40Cs9g04470998.44 67
CsPP2C43orange1.1t02237230.55 2780
CsPP2C56Cs9g06410824.48 433
PYLCsPYL6Cs9g18410348.99 2060
Transcription factorSPOROCYTELESS/NOZZLE (SPL/NZZ) Cs1g06080705.83 711
NACCs1g0966099.36 3825
bHLHCs1g02580612.51 995
AP2-EREBP (ERF) Cs1g03300164.06 3236
Carotenoid biosynthesis structural genesCsPSY1Cs6g15910295.83 2332
CsZISOCs5g24730343.93 2082
CsZDSCs3g11180396.55 1847
Disclaimer/Publisher’s Note: The statements, opinions and data contained in all publications are solely those of the individual author(s) and contributor(s) and not of MDPI and/or the editor(s). MDPI and/or the editor(s) disclaim responsibility for any injury to people or property resulting from any ideas, methods, instructions or products referred to in the content.