Abstract
Background/Objectives: The prevalence of obesity worldwide has rapidly increased. Numerous studies showed a beneficial effect of probiotics in obese individuals, and changes in hematological parameters are observed in obesity. Therefore, the aim of this study was to investigate the effect of a novel probiotic approach on the red blood cells (RBCs) and platelets. Methods: Twenty-five obese women participated in a randomized, placebo-controlled study and were divided into the experimental group (one capsule daily containing Lactiplantibacillus plantarum 299v (DSM9843), Saccharomyces cerevisiae var. boulardii, and 40 mg octacosanol; n = 13) and the placebo group (n = 12). Blood samples were collected for light microscopic examination, morphometric analysis, and an automated hematology analyzer. A possible relationship between hematological parameters and body mass index (BMI), a common indicator of obesity, was investigated using Spearman correlation. The plasma concentration of soluble P-selectin and fibrinogen were determined using an ELISA assay. All measurements were performed before (T0) and after 12 weeks of supplementation (T1). Results: The three-month supplementation of probiotics improved hemoglobin levels, chromic status, and red blood cell morphology. The mean platelet volume (MPV), a measure of platelet size, was restored to normal levels, platelet morphology was improved, and the number of activated platelets was significantly reduced (p < 0.05). A strong negative correlation (r = −0.5904, p < 0.05) was found between BMI and platelet distribution width (PDW), a measure of variation in platelet size and shape. Conclusions: The results show that the probiotic approach improves morphology and normalizes the values of disturbed hematological parameters of RBCs and platelets in obese women.
1. Introduction
Obesity is a complex, multifactorial disease characterized by excessive fat accumulation in the body. As a state of low-grade inflammation, it increases the risk of numerous comorbidities, such as type 2 diabetes, hypertension, myocardial infarction, and stroke [1]. Excessive fat accumulation, especially visceral obesity, is associated with increased levels of proinflammatory cytokines, markers of oxidative stress, elevated circulating C-reactive protein (CRP), and serum leptin levels [2,3,4]. Under such conditions, cells, especially blood cells, are constantly exposed to an altered microenvironment, and their structural and functional properties can change. Obesity is often associated with an increased total white blood cell (WBC) count [5]. Several articles have described changes in red blood cells (RBCs) and platelet indices, such as changes in RBCs shape, volume, and size [6]; increased RBCs aggregation [7]; changes in hematological parameters indicative of platelet activation; and an increase in fibrinogen- and platelet-derived soluble P-selectin (sP-selectin) [8,9]. Among the platelet indices, the mean platelet volume (MPV) is increased in participants with a higher body mass index (BMI), a common indicator of obesity [10]. These and other studies suggest that hematological parameters may be a useful tool for tracking the progression of obesity and associated comorbidities but also point to the need for new therapeutic strategies.
It is well known that the composition of the gut microbiota in obese populations differs from that of lean, healthy individuals, and its alterations are closely associated with the development of obesity [11]. The beneficial effects of probiotics on energy, glucose, and lipid metabolism are already recognized [12], as is their ability to reduce abdominal obesity [13,14,15]. Our recent studies have investigated the valuable effects of a novel probiotic approach. For example, we have shown that the novel probiotic approach positively influences the expression of certain miRNAs and mRNAs involved in the regulation of inflammation and adipogenesis [16] and decreases concentrations of CRP and interleukin-6 (IL-6) in obese women [17]. However, as far as we are aware, the effect of a probiotic formulation on blood indices in humans has not yet been investigated.
Given the growing need for dietary supplements and nutraceuticals for weight loss, the aim of this study was to investigate erythrocyte and platelet indices and their potential changes in obese women after a novel probiotic approach. Due to their well-characterized anti-inflammatory role and trophic effect in the gastrointestinal tract, Lactiplantibacillus plantarum 299v [18,19,20] and Saccharomyces cerevisiae var. boulardii [21] have been combined with policosanol, a nutraceutical that reduces platelet aggregation [22,23].
2. Materials and Methods
2.1. Study Design, Subjects and Eligibility Requirements
Thirty-two obese (BMI ≥ 30 kg/m2) women of reproductive age (29–50 years) were recruited for this randomized, double blind, placebo-controlled, parallel study. The study was approved by the Ethics Committee of the Clinical Centre of Serbia (number 31/28, dated 21 February 2019) and registered in the Australian New Zealand Clinical Trials Registry (ACTRN12622000696796). The start of recruitment period was 10 June 2020, and the end of recruitment period was 6 July 2022. All participants were recruited from the Belgrade area and within the Clinical Centre of Serbia subject database via advertisements, phone calls, and word of mouth by researchers. Exclusion criteria were patients younger than 18 years; menopausal women; patients with chronic kidney, thyroid, and gastrointestinal disease; patients with anemia; patients with previous oncological disease; patients who had received probiotic, prebiotic, or antibiotic therapy in the last month; patients with hypersensitivity/intolerance to any of the product’s ingredients; and patients undergoing pregnancy or breastfeeding and who had not given birth within the last year. Written informed consent was obtained from participants prior to the start of the study, and the study was conducted in accordance with the Declaration of Helsinki.
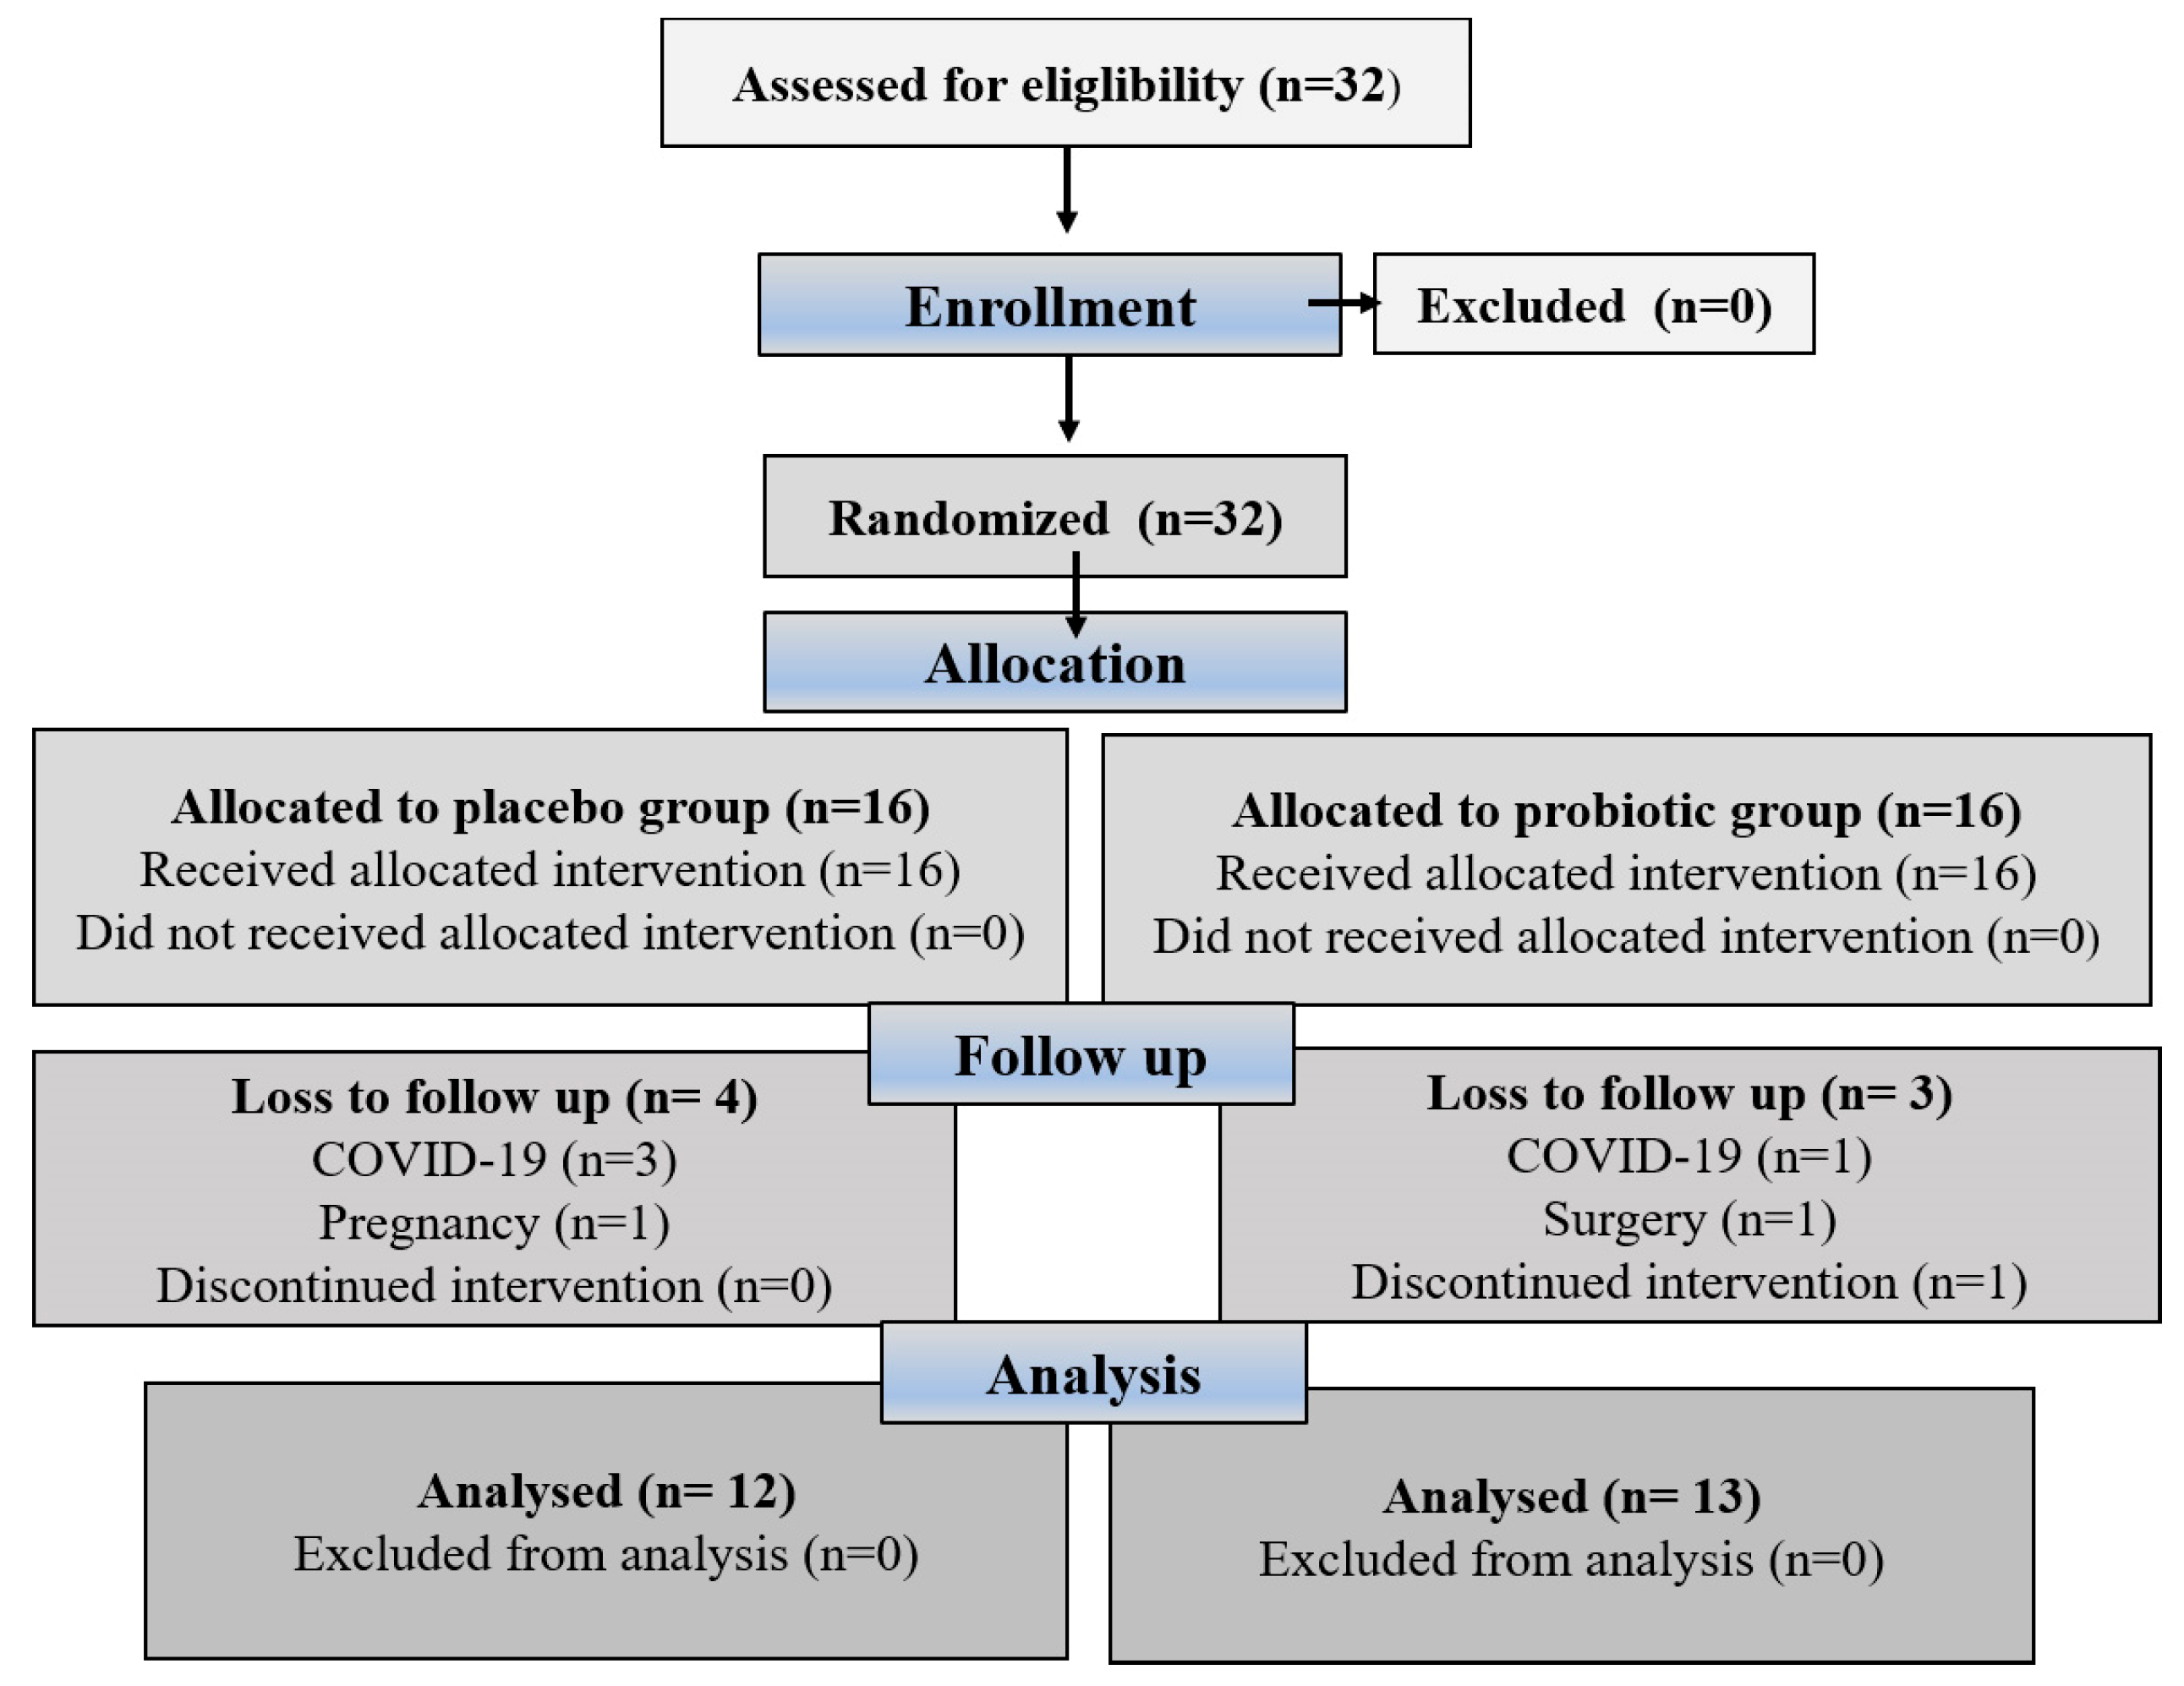
Eligible participants were assigned a unique randomization number by a blinded medical supervisor, who entered the participants and assigned them to the interventions. The method used to create the randomization sequence for assigning subjects to the different groups was simple randomization using a randomization table created with computer software, and the random assignment was masked by sequentially numbered bins. Researchers, participants, outcome assessors, and practitioners were blinded to treatment allocation. Neither the participants nor the investigators knew which treatment they would receive in this study because the manufacturer packaged the supplements and placebos in plain boxes with the study code “1” or “2”; they were the same in terms of color, size, and shape to disguise the order until the intervention was assigned. Compliance with supplementation was verified by counting the pills. Adherence to supplementation was greater than 90% for all participants who completed the study. Figure 1 illustrates the participant recruitment and allocation process. Participants were contacted by telephone once a week and asked about possible side effects. In addition, participants were given advice on healthy eating and lifestyle habits to follow during the intervention phase. We hypothesized that probiotic supplementation would improve hematological indices and fibrinogen and sP-selectin levels (primary outcomes) in obese women. Secondary outcome aimed to show positive correlation between improved hematological indices and lower BMI.
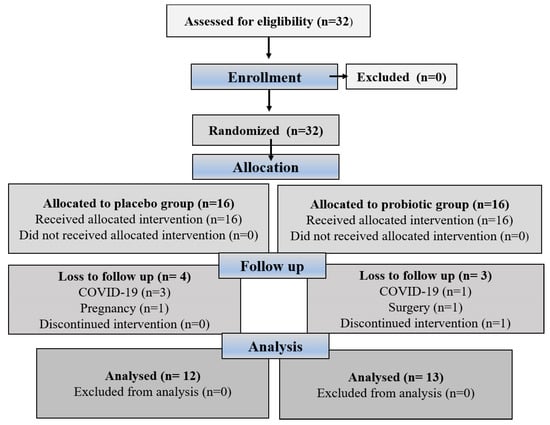
Figure 1.
The CONSORT flowchart shows the process of participant recruitment and allocation.
2.2. Nutritional Supplementation
Sixteen patients received one capsule of placebo (control group—maltodextrin), and sixteen participants received one capsule of probiotics (7 × 10¹⁰ CFU Lactiplantibacillus plantarum 299v (DSM9843), 5 × 10⁹ CFU Saccharomyces cerevisiae var. boulardii, and 40 mg octacosanol) daily for three months and were asked to take one capsule daily after breakfast. Octacosanol originate from sugarcane, and dry extract of sugarcane (Saccharum officinarum) wax used in our study was standardized to 90% octacosanol (40 mg octacosanol, AbelaPharm Ltd., Belgrade, Serbia). Blood samples were taken early in the morning after a 12 h overnight fast at two time points: the day before the start of the intervention, defined as period 0 (T0), and after 90 days of oral supplementation, defined as (T1), for both the placebo and experimental groups. BMI was determined by trained personnel using a Tanita BC-401 electronic scale (Tanita, Amsterdam, the Netherlands) at the Clinical Centre of Serbia.
2.3. Laboratory Tests of the Hematological Parameters
Blood samples were collected in Vacutainer tubes containing EDTA disodium (anticoagulant). The plasma was immediately separated by centrifugation, and the aliquots were frozen at −80 °C for ELISA analysis. Hematological analysis was performed at the Clinical Center of Serbia using the XN-1000 automated blood analyzer (Sysmex, Manchester, UK). Evaluated parameters included red blood cell indices (red blood cell count—RBCs, red blood cell distribution width—RDW, hemoglobin—Hgb, hematocrit—HCT, mean corpuscular volume—MCV, mean corpuscular hemoglobin—MCH, and mean corpuscular hemoglobin concentration—MCHC) and platelet indices (platelet count—PLT, mean platelet volume—MPV, platelet distribution width—PDW, and plateletcrit—PCT) [24].
2.4. The Light Microscopic Examination of RBCs and Platelets Structural Alterations
Two blood smears were taken from each subject to examine the morphology of the RBCs and platelets. For the cytological examination, blood smears were routinely prepared from capillary blood and dried, fixed, and stained with May-Grunwald–Giemsa stains [25]. For each group, 200 stained images were taken at 100× magnification to analyze the color and shape of the RBCs as well as the appearance of the platelet granules and the color and shape of the cytoplasm. Based on these morphological characteristics, platelets were classified into three groups: granular (most of the cytoplasm is deeply stained), hypogranular (with few or no granules), and activated platelets (roundish platelets with droplets and granules in the center of the platelets) [26]. The images were also used to determine the size of platelets, which was measured as the maximum Ferret’s diameter, the longest distance between any two points on the object, commonly used in light microscopy to measure the size of irregularly shaped particles [27]. All measurements were performed with Fiji, an open-source distribution of the ImageJ image analysis software, version 1.54 (NIH, Bethesda, MD, USA).
2.5. Determination of Fibrinogen and sP-Selectin Levels
Peripheral venous blood was collected after overnight fasting in vacutainers with ethylenediaminetetraacetic acid (EDTA) for determination of sP-selectin, and fibrinogen was determined in citrated plasma by the Clauss coagulometric method using the BFT II Analyzer coagulometer. The concentration of sP-selectin (CD62P) was determined using a commercial enzymatic immunoassay (human ELISA, EH3818, FineTest, Wuhan, China) according to the manufacturer’s instructions. In brief, 100 µL of the pre-diluted sample was added per well and incubated at 37 °C for 1.5 h, followed by two washes (Rayto RT-2600C automatic washing machine, Shenzhen, China) in the wash buffer. Then, 100 μL of biotin-labeled antibody was added per well and incubated at 37 °C for 1 h. The plate was washed again, and 100 μL of horseradish peroxidase (HRP)-streptavidin conjugate was added per well and incubated at 37 °C for 30 min. After extensive washing, 90 μL of 3,3′,5,5′-tetramethylbenzidine (TMB) substrate was added per well and incubated at 37 °C for 10 min. The reaction was stopped by adding 50 μL of stop solution per well, and the absorbance of the samples was measured at 450 nm in duplicate using a Rayto RT-6100 automated reader.
2.6. Statistical Analysis
Statistical analysis was performed with GraphPad Prism 10.4.2 software (GraphPad Software, San Diego, CA, USA). D’Agostino and Pearson’s normality test was used to test the data for normality. Student’s t-test was used to compare two time points (T0 and T1) under the same experimental conditions. The results are expressed as mean ± statistical error (SEM). In addition, the changes in the variables in both groups were expressed as a delta value in % (Δ), useful for comparing changes between two sets of numbers. The delta value was calculated using the following formula: ((T1/T0) − 1) × 100), where T0 is the average value of the variables before supplementation for a given group and T1 is the average value of the variables after supplementation for a given group. The correlation of hematological parameters with BMI was evaluated by Spearman correlation. The level of statistical significance between the variables was defined using the p < 0.05 criterion. Interpretation of the strength of the correlation coefficients was accepted according Prion and Haerling’s study [28].
3. Results
3.1. Hematological and Morphological Analysis of RBCs and Platelets
The hematological parameters of the subjects before and after supplementation (placebo or probiotic) are listed in Table 1. Two of the parameters examined were found to be outside the reference range. Namely, the mean MPV value before administration (T0) in the experimental group was above the reference values and returned to normal values at the end of probiotic supplementation. In addition, the mean PDW values were below the reference values in both groups and at both time points (T0 and T1). Probiotic supplementation increased mean PDW levels from T0, bringing them closer to the reference range. Compared to baseline (T0), the mean RDW value was increased significantly (p < 0.05) in T1 in the placebo group.

Table 1.
The effect of 3 months probiotic supplementation on the hematological indices of red blood cells and platelets in obese women. The evaluated parameters included erythrocytes and platelet indices. The day before the start of the intervention was defined as period 0 (T0), and T1 defined the end of the intervention for both the placebo and experimental groups. Data are presented as mean ± SEM. Statistical significance was set at p < 0.05, (*).
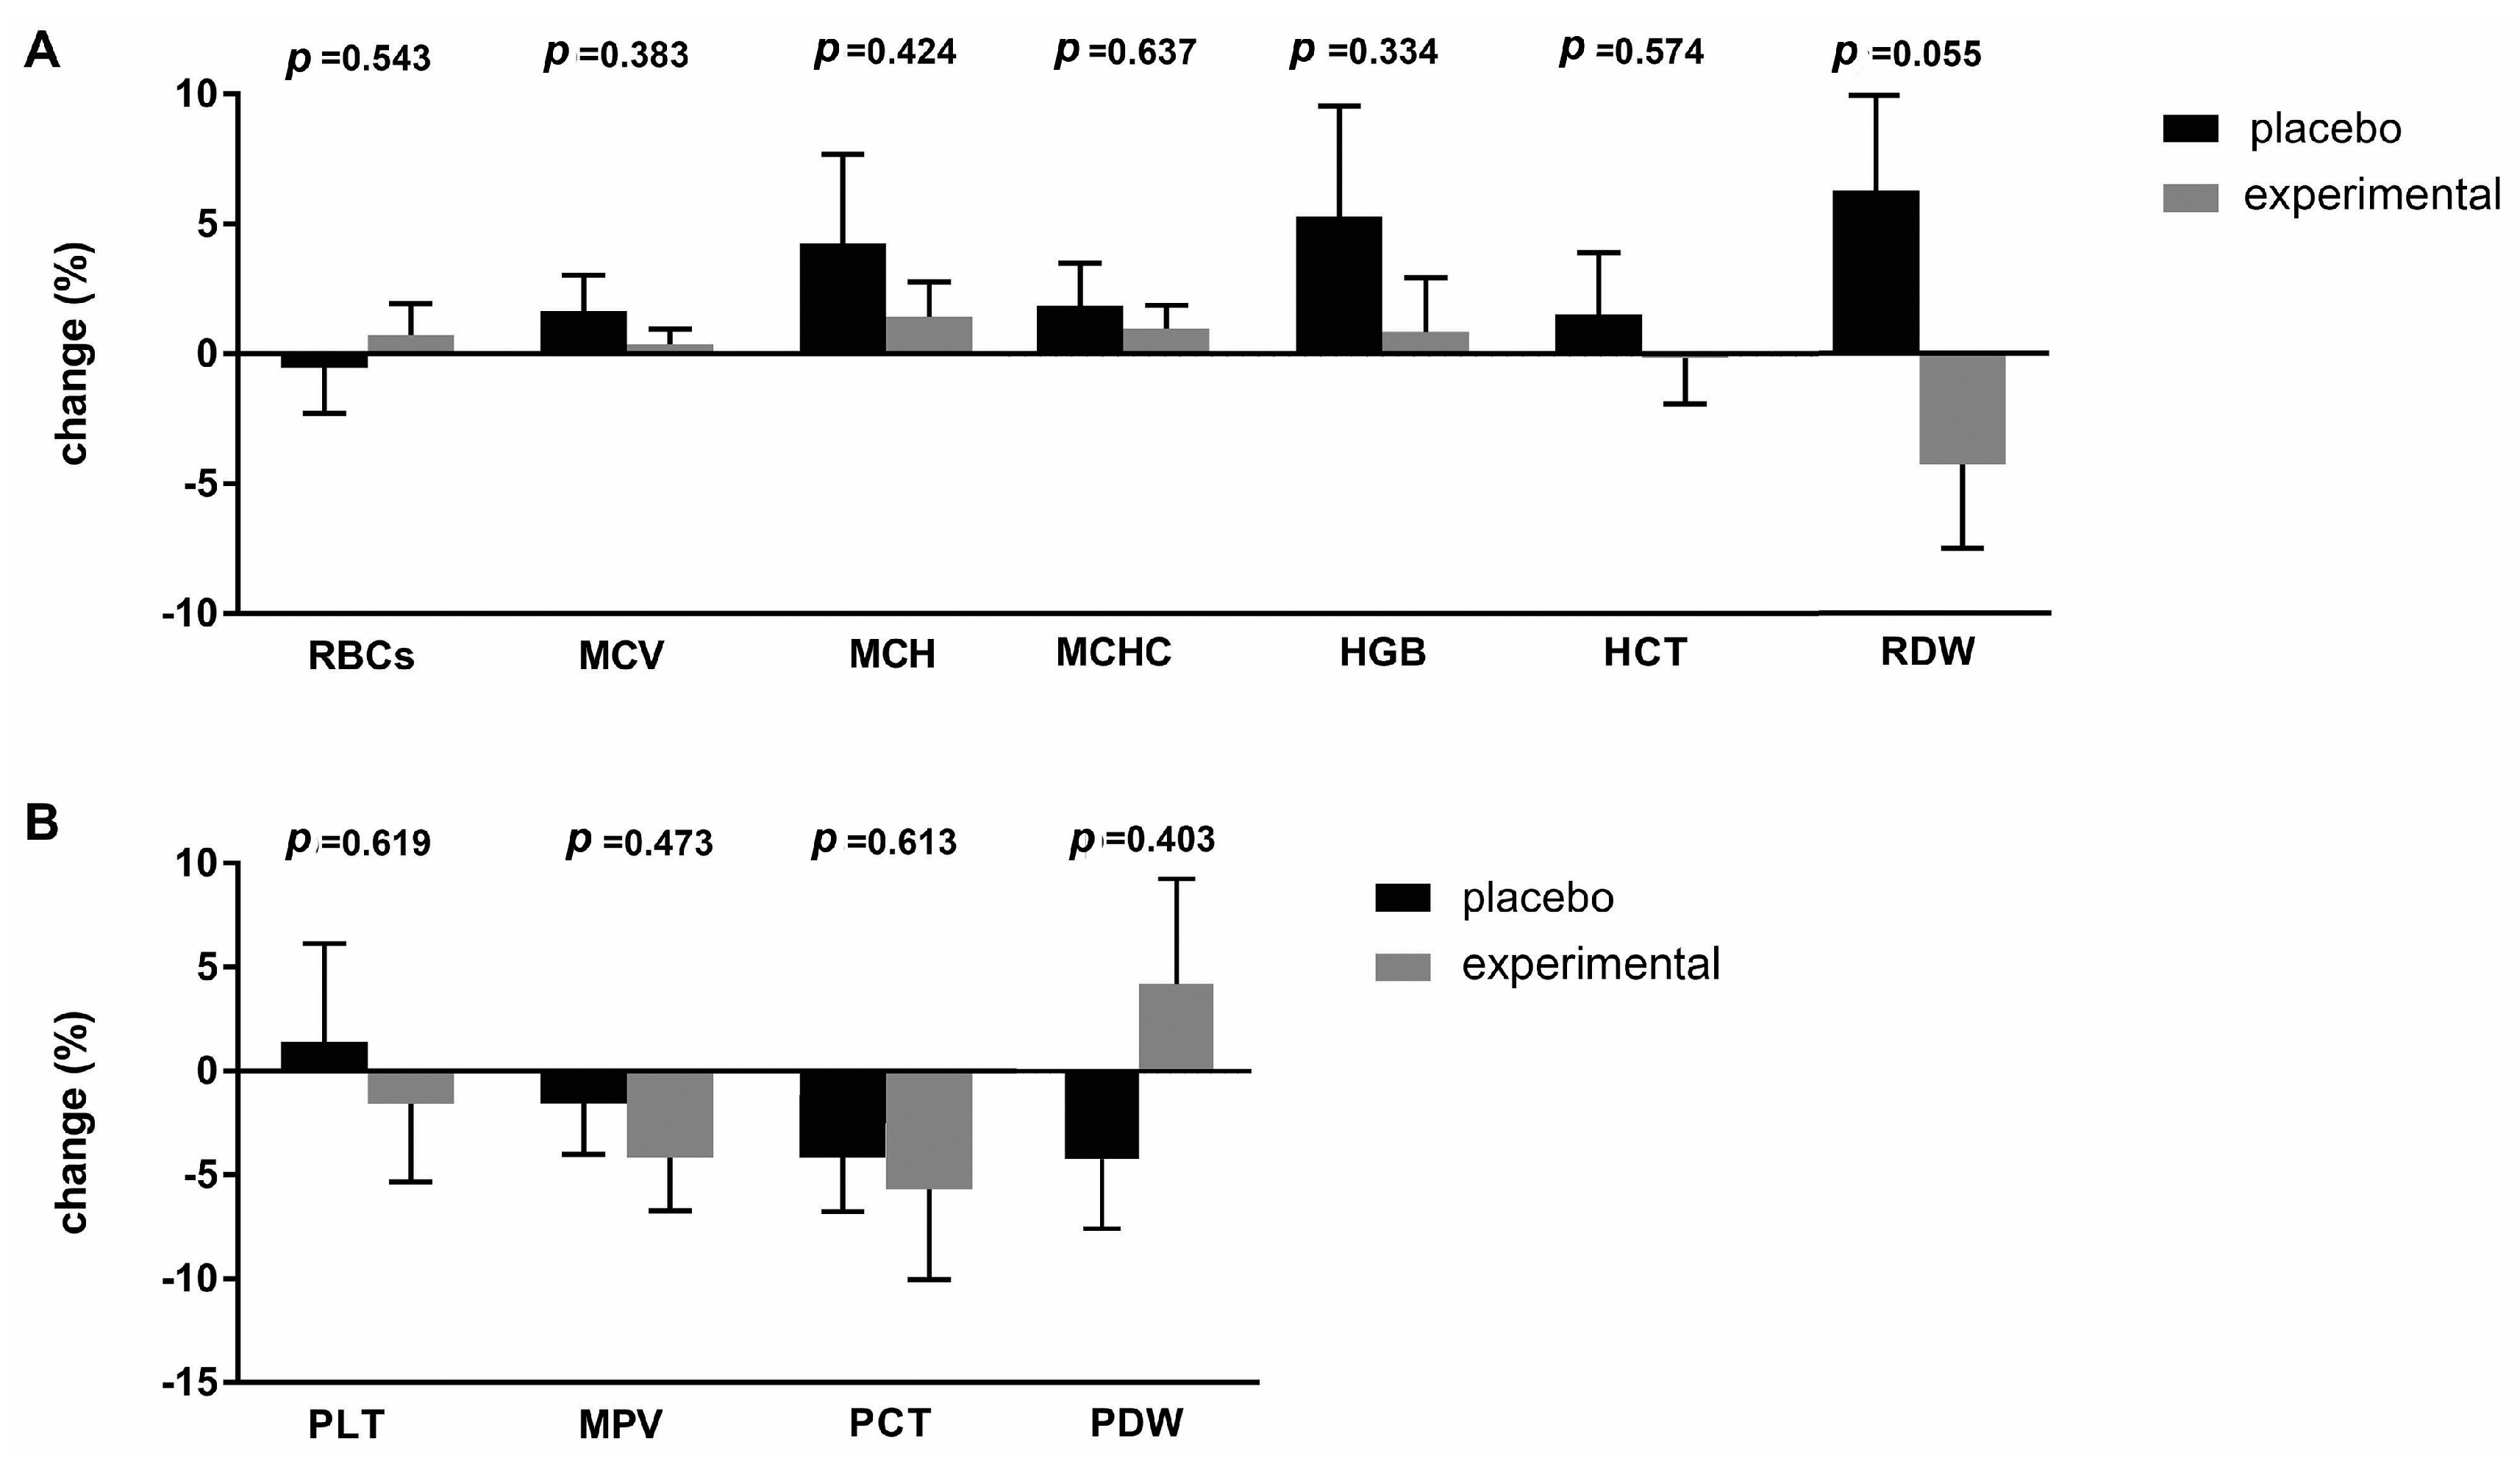
To better understand the differences between the placebo and probiotic groups after supplementation, the delta value (Δ) of the hematological parameters was calculated and expressed as a percentage change (Figure 2). The greatest change was observed in the RDW parameter (−10.56 ± 5.11; p = 0.055), which almost reached statistical differences after three months of probiotic administration (Figure 2A). Figure 2B shows the percentage changes in platelet parameters. The largest difference was observed for the PDW parameter (−5.110 ± 5.98), which, however, did not reach a statistically significant difference.

Figure 2.
Percentage changes (Δ) in the mean values of (A) erythrocyte and (B) platelet parameters in the placebo and probiotic groups. The delta value was calculated using the following formula: ((T1/T0) − 1) × 100. The bars show the mean ± SEM. Statistical significance was set at p < 0.05.
The morphological analysis of the blood smears of both the placebo and the experimental group at T0 showed the presence of erythrocytes of different sizes and hypochromic erythrocytes. In addition, changes in erythrocyte shape were frequently observed at T0. Thus, moderate rouleaux formation was observed at T0 in both groups, and the presence of echinocytes and dacrocytes was frequently observed (Figure 3A). In contrast to the placebo group (T0 and T1, respectively) and the experimental group (T0), a decrease in morphologic abnormalities in size, shape, and staining properties of the RBCs was observed after three months of probiotic administration (probiotic group—T1). These microscopic observations were confirmed by the routine cell counting method (Figure 3B).
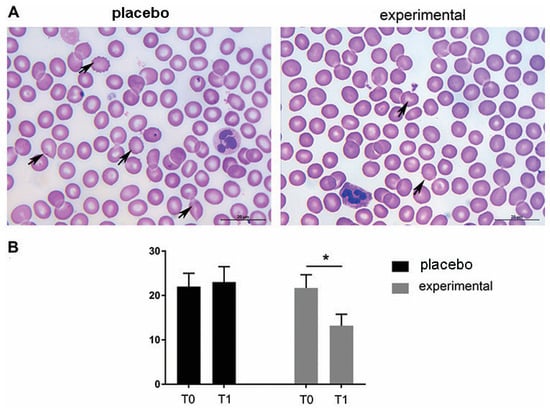
Figure 3.
Representative light micrographs of blood smears show that the morphological abnormalities of erythrocytes decreased after three months of probiotic supplementation. (A) May-Grunwald–Giemsa staining of blood smears. Abnormally shaped RBCs are indicated by arrows. Scale bar: 20 µm. (B) The quantification of echinocytes and dacrocytes as a percentage of all erythrocytes. The bars show the mean ± SEM. Statistical significance was set at p < 0.05, (*).
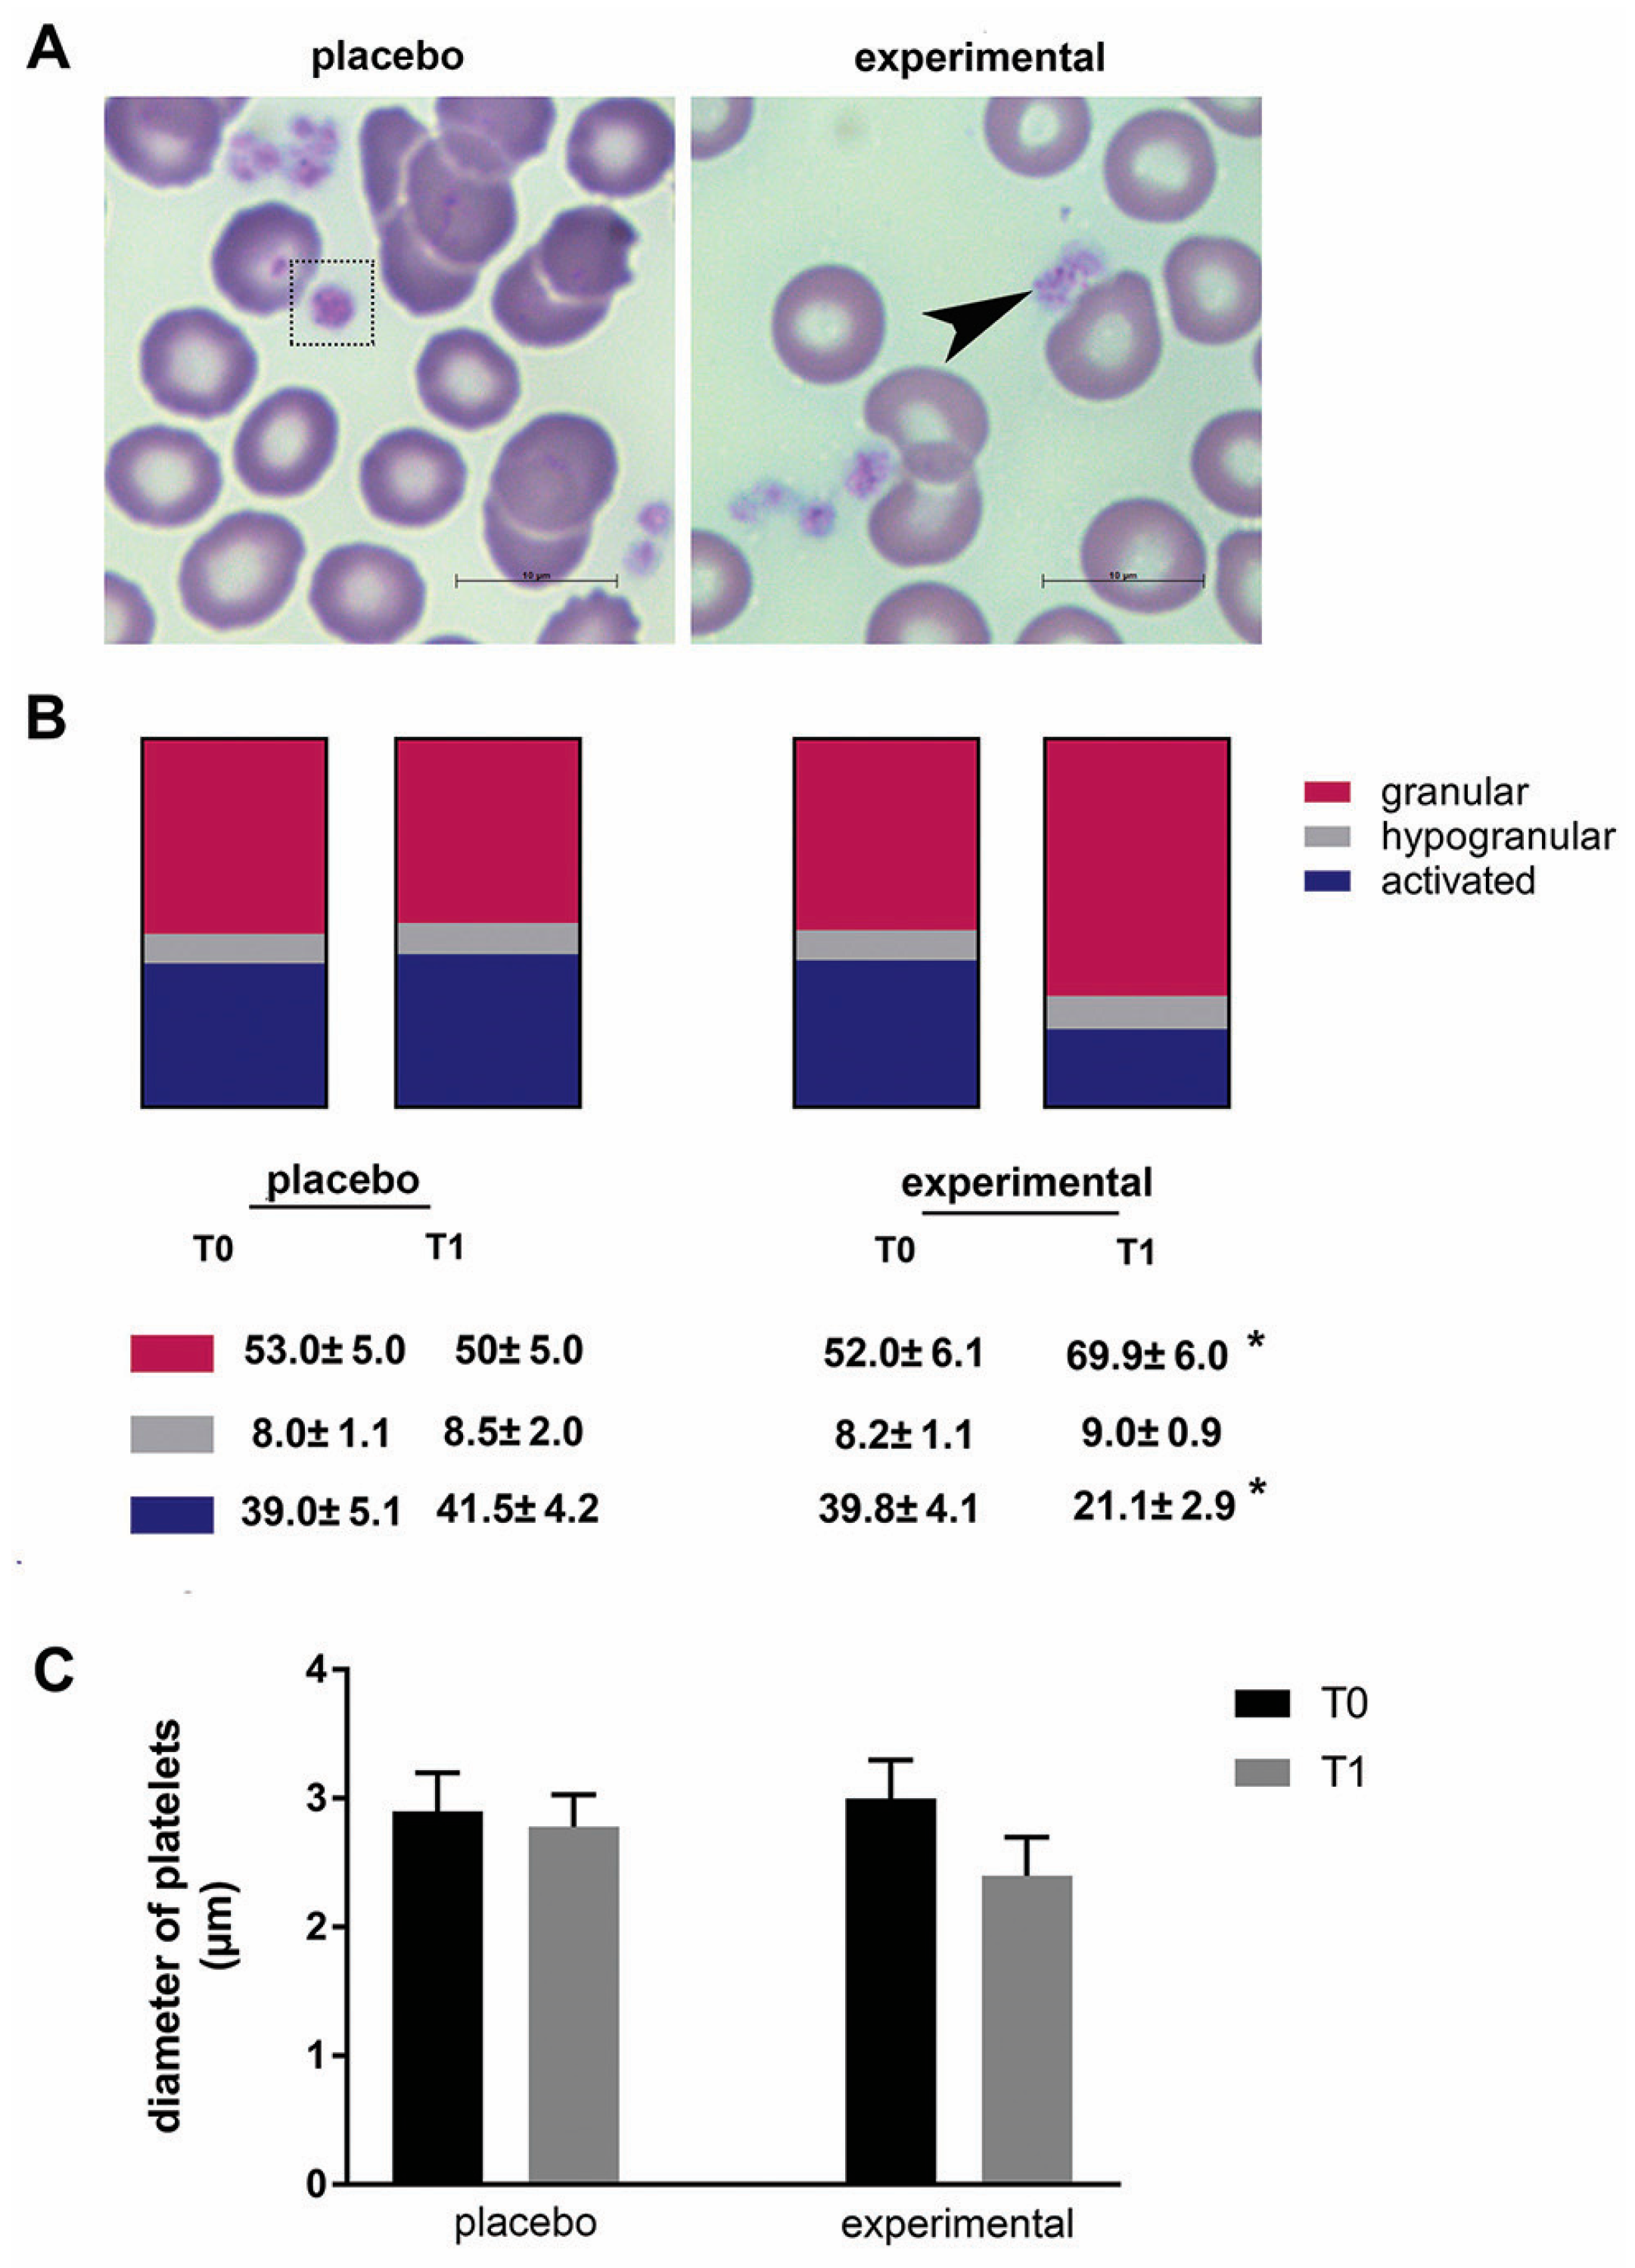
The morphological changes of platelets were then examined (Figure 4A). In general, platelets of all samples differed in size, shape, and granular appearance. Based on their morphological characteristics, granular, hypogranular, and activated platelets were distinguished. These morphological observations were further analyzed using stereology, and a statistically significant change was found in the probiotic group. Compared to baseline (T0), the proportion of granular platelets increased significantly (p < 0.05), while the proportion of activated platelets decreased significantly after three months of probiotics (p < 0.05) (Figure 4B). In addition, there was a decreasing trend in platelet diameter after three months of probiotic administration compared to the corresponding control (T0), but this did not reach a statistical difference (Figure 4C).

Figure 4.
The morphology of platelets and the morphometric analysis. (A) Representative microscopic images of May-Grunwald and Giemsa staining in the placebo and probiotic groups after 3 months of supplementation. Scale bar: 10 µm. The dashed square indicates a large platelet, and the arrow indicates the presence of typical granular platelets. (B) The percentage of granular, hypogranular, and activated platelets. (C) The diameter of the blood platelets. Values are given as mean ± SEM. Statistical significance was set at p < 0.05, (*). Comparison with the corresponding T0 group.
3.2. Analysis of Fibrinogen and sP-Selectin Changes
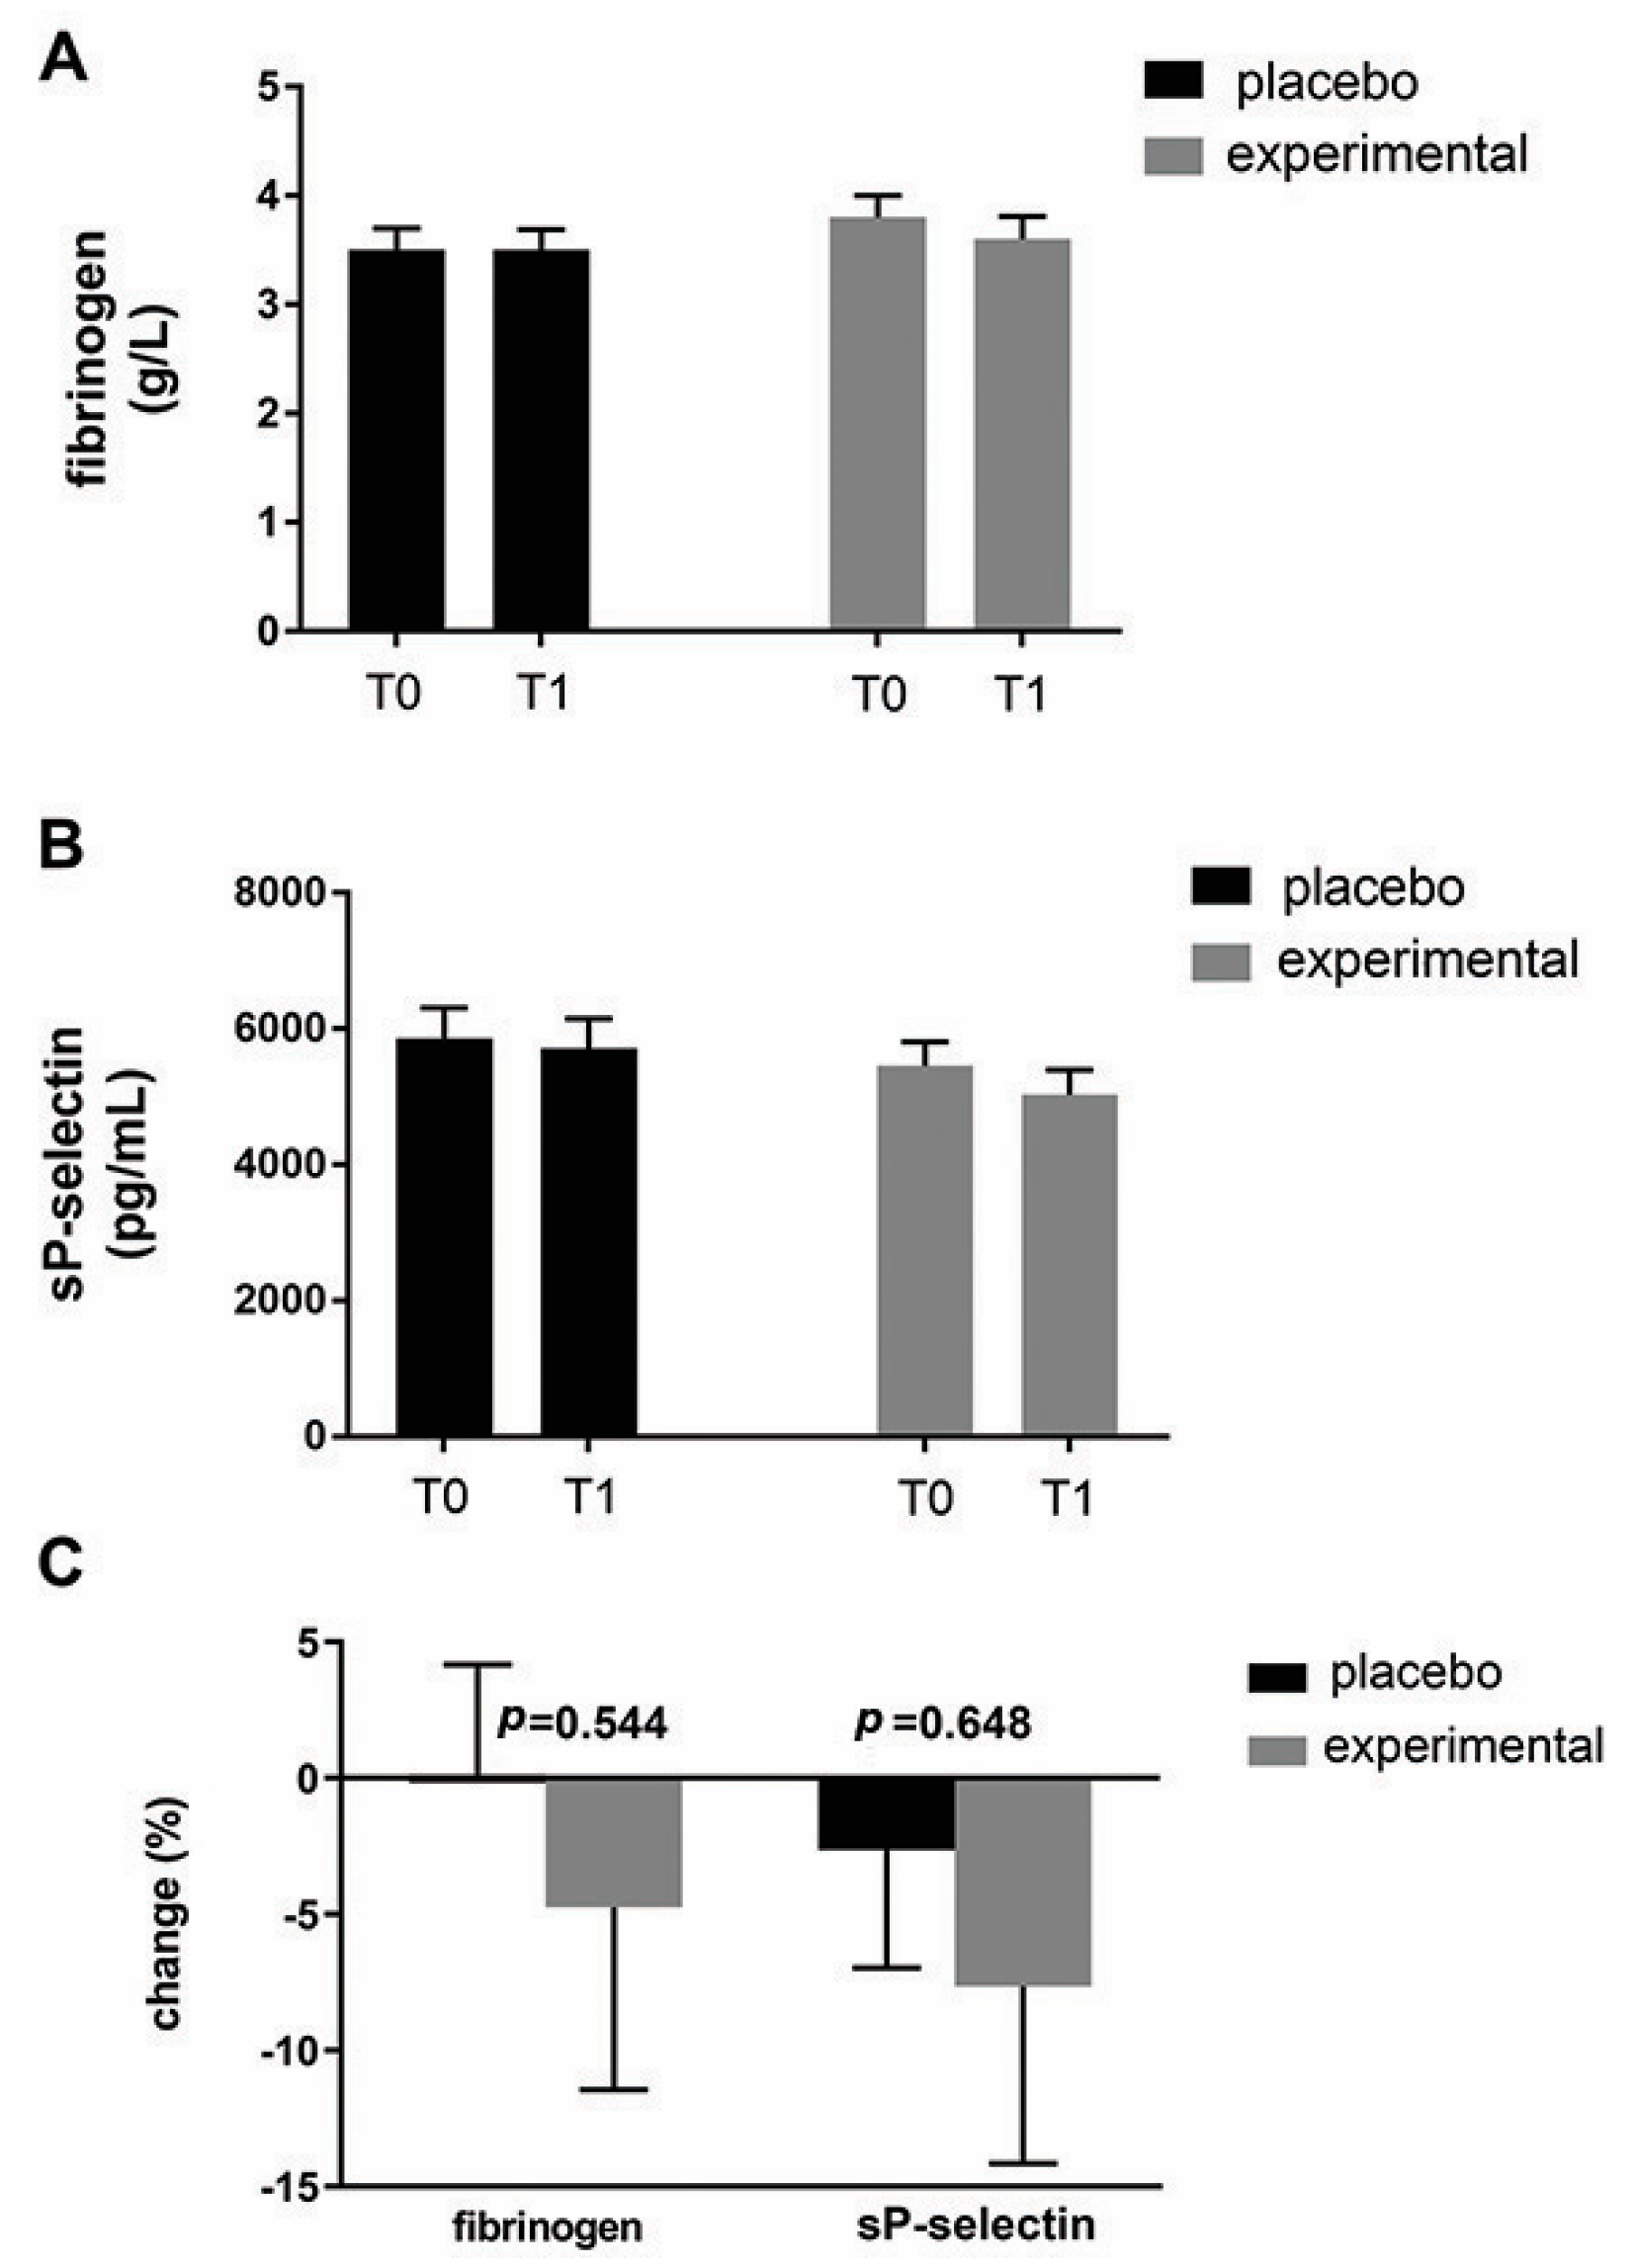
Figure 5 shows the mean fibrinogen level (Figure 5A) and the mean sP-selectin level (Figure 5B) in both groups. As can be seen, probiotic supplementation did not result in significant changes in these parameters within or between groups. Expressed as a percentage change (Figure 5C), there was a decreasing trend for both parameters in the probiotic group compared to the placebo group. Compared to fibrinogen (−4.86 ± 7.81), a greater change was observed for sP-selectin (−5.05 ± 9.98).
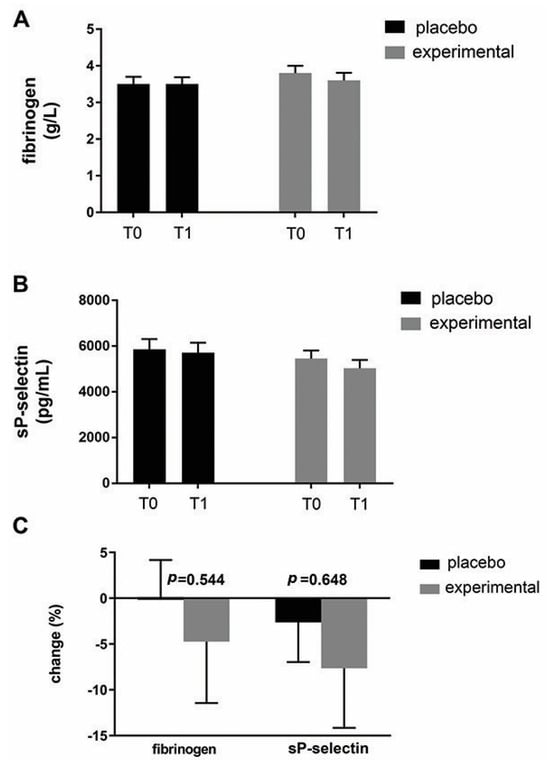
Figure 5.
An analysis of changes in fibrinogen and sP-selectin. (A) Fibrinogen and (B) sP-selectin levels in the blood of the placebo and probiotic groups. (C) Percentage changes in the mean values of fibrinogen and sP-selectin in the placebo and probiotic groups. The delta value (Δ) was calculated according to the following formula: ((T1/T0) − 1) × 100. The bars show the mean ± SEM. Statistical significance was set at p < 0.05.
3.3. Correlation Between BMI and Hematological Parameters
In order to analyze possible correlations, the change in BMI was first determined (Figure 6). As can be seen, the analysis showed a decreasing trend in BMI change after three months of probiotic administration compared to the placebo group but without a statistically significant difference.
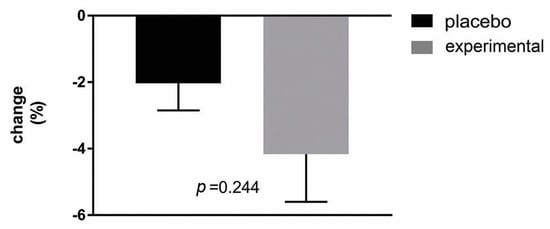
Figure 6.
Percentage changes in BMI in the placebo and probiotic groups. The delta value (Δ) was calculated using the following formula: ((T1/T0) − 1) × 100. The bars show the mean ± SEM. The statistical significance was set at p < 0.05.
The Spearman correlation coefficients of the delta values between BMI and blood parameters were then analyzed (Table 2). A statistically significant negative correlation was observed between ΔBMI and ΔPDW in the probiotic group (r = −0.5904, p = 0.049). In addition, a moderate negative correlation was observed between ΔBMI and ΔMCH (r = −0.452, p = 0.067) and ΔBMI and ΔMCHC (r = −0.522, p = 0.071). Thus, the participants who had a lower BMI after probiotic supplementation had a higher PDW, and the PDW was closer to the normal reference value. Although not statistically significant, a similar trend was observed for the hemoglobin parameters MCH and MCHC.
Table 2.
Spearman correlation coefficients of delta values between BMI and hematological parameters. Erythrocytes indices (number of erythrocytes—RBCs, red blood cell distribution width—RDW, hemoglobin—Hgb, hematocrit—HCT, mean corpuscular volume—MCV, mean corpuscular hemoglobin—MCH, and mean corpuscular hemoglobin concentration—MCHC) and platelet indices (platelet count—PLT, mean platelet volume—MPV, platelet distribution width—PDW, and plateletcrit—PCT). The correlation coefficient (r), the significance level (p), and the number of patients (n) are shown. The strength of correlation coefficients: 0.00 to 0.20, negligible; 0.21 to 0.40, weak; 0.41 to 0.60, moderate; 0.61 to 0.80, strong; 0.81 to 1.00, very strong). Statistical significance was set at p < 0.05, (*).
4. Discussion
Previous studies have shown that an increase in body mass leads to changes in numerous biochemical and blood cell parameters [2,3] and that gut microbiota in obese populations differs from that of lean, healthy individuals [5,6,11]. According to the literature, there are no studies that have targeted the influence of probiotic supplementation on hematological indices in obese individuals. Here, we showed that probiotic supplementation reduces morphological abnormalities and improves hematological parameters disturbed in obese women. Those changes are discussed below.
The results of the present study that show the increased MPV, a general indicator of platelet activity, are consistent with other reports in obese participants who showed that an increased MPV is strongly associated with abdominal obesity and waist circumference [29,30]. Here, we found that probiotic supplementation restored MPV values to normal range in the experimental group. In addition, we found that PDW values, a quantitative measure of platelet anisocytosis (variations in size and shape), were below the normal PDW range in the obese subjects. The mechanism underlying the increased MPV and decreased PDW in obese participants is not well understood. Taking into account that obesity is considered as a state of low-grade inflammation, a possible explanation could be related to the inflammatory state [31,32] and the increased utilization of large, activated platelets [33]. Further, restoration of the MPV parameter is accompanied by the improvement of PDW values, supporting our hypothesis about the effects of probiotics on platelets’ phenotype. Moreover, when the values were expressed as a delta value (Δ), we showed that percentage changes were most pronounced for the RDW parameter, a quantitative measurement of RBCs anisocytosis (variations in size and shape), which almost reached a significant level, followed by the aforementioned platelet parameter—PDW, both in the probiotic group.
A morphological analysis of the blood smears was then carried out to gain a better understanding of the structural changes in the erythrocytes and platelets. The morphological observations were combined with morphometric analysis and stereology, and a decrease in the morphological abnormalities of RBCs and platelets was observed after probiotic administration. Overall, the analysis of the blood smears showed that supplementation with probiotics had beneficial effects on three levels. Thus, (i) the size and shape of the erythrocytes were brought back to a similar general size and shape by the probiotic treatment. These changes were followed by (ii) an increased incidence of normochromic red blood cells. Finally, (iii) probiotic supplementation increased the proportion of discoid-shaped and granular platelets, one of the most important morphological features of unstimulated platelets [34]. Together with the automated hematology data analyzer, all these results undoubtedly confirm the beneficial effects of probiotics on the changes in erythrocyte and platelet size and shape as well as on the chromic status of erythrocytes. A similar trend in most of the examined parameters observed in our preliminary study was presented, which included a smaller group of participants.
In addition to platelet activation, obesity can be considered a prothrombotic state and could be associated with increased fibrinogen and sP-selectin levels [2,35]. Here, we did not observe an increase in fibrinogen and sP-selectin in obese women. Expressed as percentage change, there was only a decreasing trend for both parameters in the probiotic group compared to the placebo group. A possible explanation, at least for sP-selectin, could be the uniform lipid profile in our participants who participate in the same clinical trial since it has been shown that sP-selectin correlates with triglycerides in obese patients [16,35].
Finally, Spearman correlation coefficients of the delta values between BMI and blood parameters were then analyzed to determine the relationship between the variables. Despite the fact that probiotics can cause weight loss, only a tendency to reduce BMI was observed in our study. However, the correlation analysis between the changes in hematological parameters and BMI gave us additional insight into the important effect of probiotics in obese women. The Spearman correlation analysis revealed a significant negative correlation between the changes in BMI and PDW in the probiotic group. This additionally supports our findings that probiotics positively affect platelet morphologic uniformity and suggests that participants with a lower BMI had more uniform platelets. In addition, a moderate, negative correlation between BMI and hemoglobin content and concentration parameters (ΔBMI and ΔMCH and ΔBMI and ΔMCHC, respectively) almost reached significance in the probiotic group. As can be read in the literature, the relationship between hemoglobin levels in overweight/obese individuals remains controversial, depending on conditions such as age and gender [6,36,37]. The positive effect of probiotics on erythrocyte chromic status we observed here may be a consequence of the previously described beneficial effects of L. plantarum 299v products on hemoglobin and iron levels, which are due to increased intestinal iron absorption [38]. It is also worth highlighting that products of Lactiplantibacillus plantarum 299v have a significant antioxidant capacity and the ability to reduce cytokines, thereby reducing systemic inflammation [39]. In line with this are our recently reported data that the same probiotic approach reduced tumor necrosis factor α (TNF-alpha) gene expression and levels of CRP and IL-6 in obese women [16,17]. Also, it has been shown that bioactive compounds of Saccharomyces cerevisiae var. boulardii show antioxidative capacity [40,41], while octacosanol exerts positive effects on platelet aggregation [42]. Considering that this is the first evaluation of the effects of probiotics on hematological indices in obesity, the exact mechanism of their action is unknown. Based on our previous findings and the results of other studies, the improvement in hematological indices shown in this study could be due to an improvement in inflammatory and antioxidant defense status. However, the evaluation of hematological parameters in conjunction with peripheral blood smears contributes to a better understanding of morphological abnormalities of erythrocytes and platelets in obesity and had a significant impact on the interpretation of laboratory results. According to our study, a novel probiotic formulation improves hematological and morphologic indices of erythrocytes and platelets in obese women. However, further studies are needed to better understand the effects of probiotics on hematological parameters in obese women, and the limitations of this study should be noted, particularly the small sample size. Although our intention was to test the physiological effects of the entire multicomponent formulation, reflecting the real-world use of such supplements, studies with mono-intervention arms will be essential to further decipher the individual and synergistic mechanisms of action.
5. Conclusions
Our results are the first study on the effects of probiotic supplementation on hematological parameters in obese women and underline the important role of probiotics in obesity. We showed that the probiotic formulation used here normalized MPV values and improved both PDW and RDW values, hemoglobin-related parameters, and morphologic indices of erythrocytes and platelets in obese women. Our findings provide important information for the potential use of probiotics to ameliorate obesity-related complications and the potential use of hematological parameters as simple and inexpensive indices in clinical practice to assess the risk of obesity-related disease.
However, before probiotics can be used to treat obesity, their role should be investigated in a larger number of patients of both genders. It is also important to determine the effective dose and maximum duration of use of probiotics.
Author Contributions
Conceptualization, K.V. and N.D.I.; methodology, K.V. and N.O.; software, N.M.; validation, K.V. and N.O.; formal analysis, R.M.; investigation, K.V., N.O., S.P., M.S.-D. and N.M.; resources, B.D.; data curation, K.V.; writing—original draft preparation, N.O. and K.V.; writing—review and editing, K.V.; visualization, N.O. and K.V.; supervision, B.D.; project administration, N.D.I. and R.M.; funding acquisition, N.D.I. All authors have read and agreed to the published version of the manuscript.
Funding
This study was funded by the Ministry of Science, Technological Development and Innovation, Republic of Serbia, through two Grant Agreements with University of Belgrade–Faculty of Pharmacy No.: 451-03-136/2025-03/200161 and No.: 451-03-137/2025-03/200161.
Institutional Review Board Statement
The study was approved by the Ethics Committee of the Clinical Centre of Serbia (number 31/28, dated 21 February 2019) and registered in the Australian New Zealand Clinical Trials Registry (ANZCTR). The registration number is ACTRN12622000696796. Study was conducted in accordance with the Declaration of Helsinki.
Informed Consent Statement
Informed consent was obtained from all subjects involved in the study.
Data Availability Statement
Data are unavailable due to ethical restrictions.
Acknowledgments
The authors wish to express their profound appreciation to Abela Pharm (Belgrade, Serbia) and Davor Korcok, for the packing content of the capsules for the experimental need.
Conflicts of Interest
The authors report no declarations of interest, financial or non-financial; the authors declare no conflicts of interest.
Abbreviations
The following abbreviations are used in this manuscript:
| CRP | C-reactive protein |
| BMI | body mass index |
| RBCs | red blood cell count |
| RDW | red blood cell distribution width |
| Hgb | Hemoglobin |
| HCT | Hematocrit |
| MCV | mean corpuscular volume |
| MCH | mean corpuscular hemoglobin |
| MCHC | mean corpuscular hemoglobin concentration |
| PLT | platelet count |
| MPV | mean platelet volume |
| PDW | platelet distribution width |
| PCT | Plateletcrit |
| TNFα | tumor necrosis factor alpha |
| IL-6 | Interleukin 6 |
References
- Lin, X.; Li, H. Obesity: Epidemiology, Pathophysiology, and Therapeutics. Front. Endocrinol. 2021, 12, 706978. [Google Scholar] [CrossRef] [PubMed]
- Fernandez-Sanchez, A.; Madrigal-Santillan, E.; Bautista, M.; Esquivel-Soto, J.; Morales-Gonzalez, A.; Esquivel-Chirino, C.; Durante-Montiel, I.; Sanchez-Rivera, G.; Valadez-Vega, C.; Morales-Gonzalez, J.A. Inflammation, oxidative stress, and obesity. Int. J. Mol. Sci. 2011, 12, 3117–3132. [Google Scholar] [CrossRef]
- Kumar, R.; Mal, K.; Razaq, M.K.; Magsi, M.; Memon, M.K.; Memon, S.; Afroz, M.N.; Siddiqui, H.F.; Rizwan, A. Association of Leptin With Obesity and Insulin Resistance. Cureus 2020, 12, e12178. [Google Scholar] [CrossRef] [PubMed]
- Kumawat, M.; Choudhary, P.; Aggarwal, S. Association of Serum Leptin with Anthropometric Indices of Obesity, Blood Lipids, Steroidal Hormones, and Insulin Resistance in Polycystic Ovarian Syndrome. J. Hum. Reprod. Sci. 2021, 14, 228–233. [Google Scholar] [CrossRef] [PubMed]
- Jeong, H.R.; Lee, H.S.; Shim, Y.S.; Hwang, J.S. Positive Associations between Body Mass Index and Hematological Parameters, Including RBCs, WBCs, and Platelet Counts, in Korean Children and Adolescents. Children 2022, 9, 109. [Google Scholar] [CrossRef]
- Fujita, B.; Strodthoff, D.; Fritzenwanger, M.; Pfeil, A.; Ferrari, M.; Goebel, B.; Figulla, H.R.; Gerdes, N.; Jung, C. Altered red blood cell distribution width in overweight adolescents and its association with markers of inflammation. Pediatr. Obes. 2013, 8, 385–391. [Google Scholar] [CrossRef]
- Davi, G.; Guagnano, M.T.; Ciabattoni, G.; Basili, S.; Falco, A.; Marinopiccoli, M.; Nutini, M.; Sensi, S.; Patrono, C. Platelet activation in obese women: Role of inflammation and oxidant stress. JAMA 2002, 288, 2008–2014. [Google Scholar] [CrossRef]
- Bo, M.; Raspo, S.; Morra, F.; Cassader, M.; Isaia, G.; Poli, L. Body fat is the main predictor of fibrinogen levels in healthy non-obese men. Metabolism 2004, 53, 984–988. [Google Scholar] [CrossRef]
- Santilli, F.; Vazzana, N.; Liani, R.; Guagnano, M.T.; Davi, G. Platelet activation in obesity and metabolic syndrome. Obes. Rev. 2012, 13, 27–42. [Google Scholar] [CrossRef]
- Hou, J.; Liu, C.; Yao, P.; Chen, W.; He, M.; Wang, Y.; Liang, Y.; Miao, X.; Wei, S.; Xu, T.; et al. Association of Adiposity Indices with Platelet Distribution Width and Mean Platelet Volume in Chinese Adults. PLoS ONE 2015, 10, e0129677. [Google Scholar] [CrossRef]
- Davis, C.D. The Gut Microbiome and Its Role in Obesity. Nutr. Today 2016, 51, 167–174. [Google Scholar] [CrossRef] [PubMed]
- Wang, J.; Tang, H.; Zhang, C.; Zhao, Y.; Derrien, M.; Rocher, E.; van-Hylckama Vlieg, J.E.; Strissel, K.; Zhao, L.; Obin, M.; et al. Modulation of gut microbiota during probiotic-mediated attenuation of metabolic syndrome in high fat diet-fed mice. ISME J. 2015, 9, 1–15. [Google Scholar] [CrossRef] [PubMed]
- Koutnikova, H.; Genser, B.; Monteiro-Sepulveda, M.; Faurie, J.M.; Rizkalla, S.; Schrezenmeir, J.; Clement, K. Impact of bacterial probiotics on obesity, diabetes and non-alcoholic fatty liver disease related variables: A systematic review and meta-analysis of randomised controlled trials. BMJ Open 2019, 9, e017995. [Google Scholar] [CrossRef] [PubMed]
- Bernini, L.J.; Simao, A.N.; Alfieri, D.F.; Lozovoy, M.A.; Mari, N.L.; de Souza, C.H.; Dichi, I.; Costa, G.N. Beneficial effects of Bifidobacterium lactis on lipid profile and cytokines in patients with metabolic syndrome: A randomized trial. Effects of probiotics on metabolic syndrome. Nutrition 2016, 32, 716–719. [Google Scholar] [CrossRef]
- Obsen, T.; Faergeman, N.J.; Chung, S.; Martinez, K.; Gobern, S.; Loreau, O.; Wabitsch, M.; Mandrup, S.; McIntosh, M. Trans-10, cis-12 conjugated linoleic acid decreases de novo lipid synthesis in human adipocytes. J. Nutr. Biochem. 2012, 23, 580–590. [Google Scholar] [CrossRef]
- Okuka, N.; Schuh, V.; Krammer, U.; Polovina, S.; Sumarac-Dumanovic, M.; Milinkovic, N.; Velickovic, K.; Djordjevic, B.; Haslberger, A.; Ivanovic, N.D. Epigenetic Aspects of a New Probiotic Concept-A Pilot Study. Life 2023, 13, 1912. [Google Scholar] [CrossRef]
- Okuka, N.; Milinkovic, N.; Velickovic, K.; Polovina, S.; Sumarac-Dumanovic, M.; Minic, R.; Korcok, D.; Djordjevic, B.; Ivanovic, N.D. Beneficial effects of a new probiotic formulation on adipocytokines, appetite-regulating hormones, and metabolic parameters in obese women. Food Funct. 2024, 15, 7658–7668. [Google Scholar] [CrossRef]
- Ducrotté, P.; Sawant, P.; Jayanthi, V. Clinical trial: Lactobacillus plantarum 299v (DSM 9843) improves symptoms of irritable bowel syndrome. World J. Gastroenterol. 2012, 18, 4012–4018. [Google Scholar] [CrossRef]
- Hofeld, B.C.; Puppala, V.K.; Tyagi, S.; Ahn, K.W.; Anger, A.; Jia, S.; Salzman, N.H.; Hessner, M.J.; Widlansky, M.E. Lactobacillus plantarum 299v probiotic supplementation in men with stable coronary artery disease suppresses systemic inflammation. Sci. Rep. 2021, 11, 3972. [Google Scholar] [CrossRef]
- Bouaziz, A.; Dib, A.L.; Lakhdara, N.; Kadja, L.; Espigares, E.; Moreno, E.; Bouaziz, O.; Gagaoua, M. Study of Probiotic Effects of Bifidobacterium animalis subsp. lactis BB-12 and Lactobacillus plantarum 299v Strains on Biochemical and Morphometric Parameters of Rabbits after Obesity Induction. Biology 2021, 10, 131. [Google Scholar] [CrossRef]
- Everard, A.; Matamoros, S.; Geurts, L.; Delzenne, N.M.; Cani, P.D. Saccharomyces boulardii administration changes gut microbiota and reduces hepatic steatosis, low-grade inflammation, and fat mass in obese and type 2 diabetic db/db mice. mBio 2014, 5, e01011–e01014. [Google Scholar] [CrossRef] [PubMed]
- Arruzazabala, M.L.; Molina, V.; Mas, R.; Fernández, L.; Carbajal, D.; Valdés, S.; Castaño, G. Antiplatelet effects of policosanol (20 and 40 mg/day) in healthy volunteers and dyslipidaemic patients. Clin. Exp. Pharmacol. Physiol. 2002, 29, 891–897. [Google Scholar] [CrossRef] [PubMed]
- Zhou, Y.; Cao, F.; Luo, F.; Lin, Q. Octacosanol and health benefits: Biological functions and mechanisms of action. Food Biosci. 2022, 47, 101632. [Google Scholar] [CrossRef]
- Kadja, L.; Dib, A.L.; Lakhdara, N.; Bouaziz, A.; Espigares, E.; Gagaoua, M. Influence of Three Probiotics Strains, Lactobacillus rhamnosus GG, Bifidobacterium animalis subsp. Lactis BB-12 and Saccharomyces boulardii CNCM I-745 on the Biochemical and Haematological Profiles and Body Weight of Healthy Rabbits. Biology 2021, 10, 1194. [Google Scholar] [CrossRef]
- Marshall, P.N.; Bentley, S.A.; Lewis, S.M. Standardization of Romanowsky stains. The relationship between stain composition and performance. Scand. J. Haematol. 1978, 20, 206–212. [Google Scholar] [CrossRef] [PubMed]
- Zeigler, Z.; Murphy, S.; Gardner, F.H. Microscopic platelet size and morphology in various hematologic disorders. Blood 1978, 51, 479–486. [Google Scholar] [CrossRef]
- Rizzatti, V.; Boschi, F.; Pedrotti, M.; Zoico, E.; Sbarbati, A.; Zamboni, M. Lipid droplets characterization in adipocyte differentiated 3T3-L1 cells: Size and optical density distribution. Eur. J. Histochem. 2013, 57, e24. [Google Scholar] [CrossRef]
- Prion, S.; Haerling, K.A. Making sense of methods and measurement: Spearman-rho ranked-order correlation coefficient. Clin. Simul. Nurs. 2014, 10, 535–536. [Google Scholar] [CrossRef]
- Korniluk, A.; Koper-Lenkiewicz, O.M.; Kamińska, J.; Kemona, H.; Dymicka-Piekarska, V. Mean Platelet Volume (MPV): New Perspectives for an Old Marker in the Course and Prognosis of Inflammatory Conditions. Mediat. Inflamm. 2019, 2019, 9213074. [Google Scholar] [CrossRef]
- Furman-Niedziejko, A.; Rostoff, P.; Rychlak, R.; Golinska-Grzybala, K.; Wilczynska-Golonka, M.; Golonka, M.; Nessler, J. Relationship between abdominal obesity, platelet blood count and mean platelet volume in patients with metabolic syndrome. Folia Med. Cracov. 2014, 54, 55–64. [Google Scholar]
- Villarroya, F.; Cereijo, R.; Gavaldà-Navarro, A.; Villarroya, J.; Giralt, M. Inflammation of brown/beige adipose tissues in obesity and metabolic disease. J. Intern. Med. 2018, 284, 492–504. [Google Scholar] [CrossRef] [PubMed]
- Monteiro, R.; Azevedo, I. Chronic Inflammation in Obesity and the Metabolic Syndrome. Mediat. Inflamm. 2010, 2010, 289645. [Google Scholar] [CrossRef]
- Hamad, M.A.; Krauel, K.; Schanze, N.; Gauchel, N.; Stachon, P.; Nuehrenberg, T.; Zurek, M.; Duerschmied, D. Platelet Subtypes in Inflammatory Settings. Front. Cardiovasc. Med. 2022, 9, 823549. [Google Scholar] [CrossRef]
- Blair, P.; Flaumenhaft, R. Platelet alpha-granules: Basic biology and clinical correlates. Blood Rev. 2009, 23, 177–189. [Google Scholar] [CrossRef]
- Bourassa, K.A.; Postolache, T.T.; Dagdag, A.; Fuchs, D.; Okusaga, O.O. Plasma soluble P-selectin correlates with triglycerides and nitrite in overweight/obese patients with schizophrenia. Pteridines 2020, 31, 61–67. [Google Scholar] [CrossRef]
- Vayá, A.; Carmona, P.; Badia, N.; Hernandez-Mijares, A.; Bautista, D. Association between high red blood cell distribution width and metabolic syndrome. Influence of abdominal obesity. Clin. Hemorheol. Microcirc. 2011, 47, 75–77. [Google Scholar] [CrossRef]
- Vuong, J.; Qiu, Y.; La, M.; Clarke, G.; Swinkels, D.W.; Cembrowski, G. Reference intervals of complete blood count constituents are highly correlated to waist circumference: Should obese patients have their own “normal values?”. Am. J. Hematol. 2014, 89, 671–677. [Google Scholar] [CrossRef]
- Axling, U.; Onning, G.; Combs, M.A.; Bogale, A.; Hogstrom, M.; Svensson, M. The Effect of Lactobacillus plantarum 299v on Iron Status and Physical Performance in Female Iron-Deficient Athletes: A Randomized Controlled Trial. Nutrients 2020, 12, 1279. [Google Scholar] [CrossRef]
- Kaźmierczak-Siedlecka, K.; Daca, A.; Folwarski, M.; Witkowski, J.M.; Bryl, E.; Makarewicz, W. The role of Lactobacillus plantarum 299v in supporting treatment of selected diseases. Cent. Eur. J. Immunol. 2020, 45, 488–493. [Google Scholar] [CrossRef] [PubMed]
- Datta, S.; Timson, D.J.; Annapure, U.S. Antioxidant properties and global metabolite screening of the probiotic yeast Saccharomyces cerevisiae var. boulardii. J. Sci. Food Agric. 2017, 97, 3039–3049. [Google Scholar] [CrossRef] [PubMed]
- Bai, J.; Yang, T.; Zhou, Y.; Xu, W.; Han, S.; Guo, T.; Zhu, L.; Qin, D.; Luo, Y.; Hu, Z.; et al. Octacosanol Modifies Obesity, Expression Profile and Inflammation Response of Hepatic Tissues in High-Fat Diet Mice. Foods 2022, 11, 1606. [Google Scholar] [CrossRef]
- Wang, T.; Liu, Y.Y.; Wang, X.; Yang, N.; Zhu, H.B.; Zuo, P.P. Protective effects of octacosanol on 6-hydroxydopamine-induced Parkinsonism in rats via regulation of ProNGF and NGF signaling. Acta Pharmacol. Sin. 2010, 31, 765–774. [Google Scholar] [CrossRef]


Disclaimer/Publisher’s Note: The statements, opinions and data contained in all publications are solely those of the individual author(s) and contributor(s) and not of MDPI and/or the editor(s). MDPI and/or the editor(s) disclaim responsibility for any injury to people or property resulting from any ideas, methods, instructions or products referred to in the content. |
© 2025 by the authors. Licensee MDPI, Basel, Switzerland. This article is an open access article distributed under the terms and conditions of the Creative Commons Attribution (CC BY) license (https://creativecommons.org/licenses/by/4.0/).