
Determination of Multiple Active Components in Mume Fructus by UPLC-MS/MS
Abstract
1. Introduction
2. Materials and Methods
2.1. Chemicals, Reagents, and Materials
2.2. Preparation of Standard Solutions
2.3. Preparation of Sample Solutions
2.4. UPLC–MS/MS Instrumentation and Conditions
2.5. Multivariate Statistical Analyses
3. Results
3.1. MS Condition Optimization
3.2. Verification of Analytical Methods
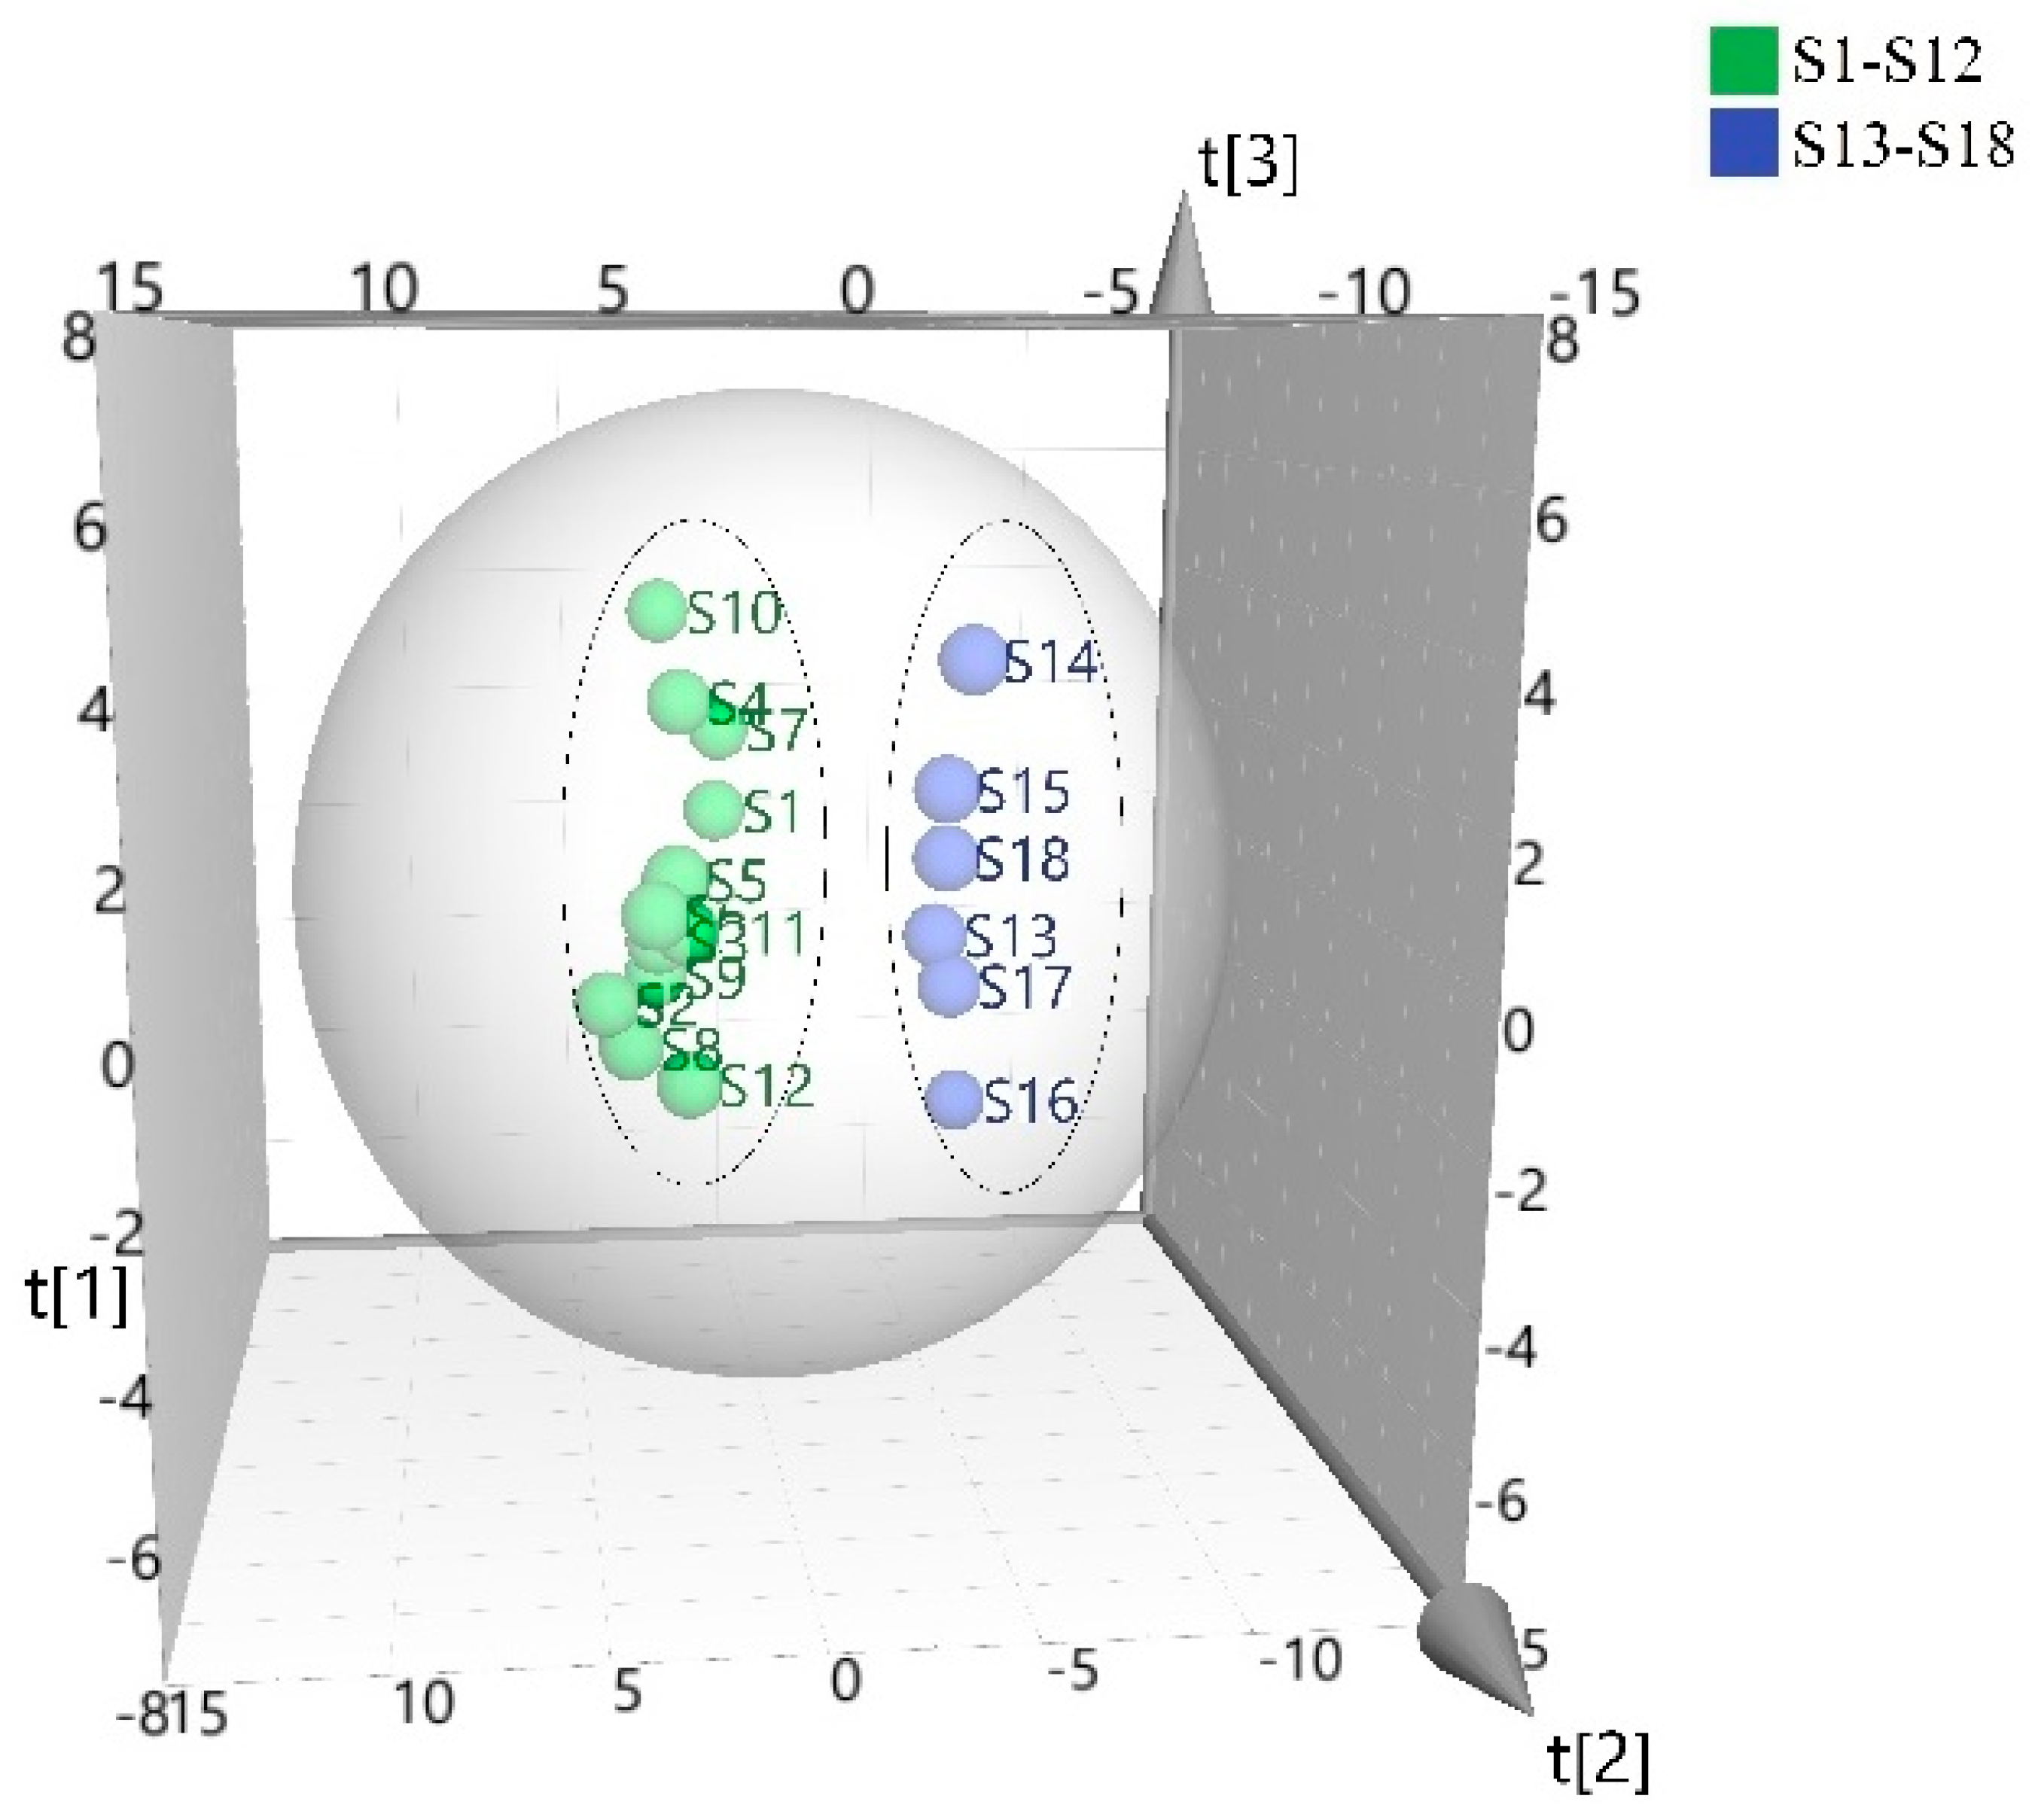
3.3. Principal Component Analysis (PCA)
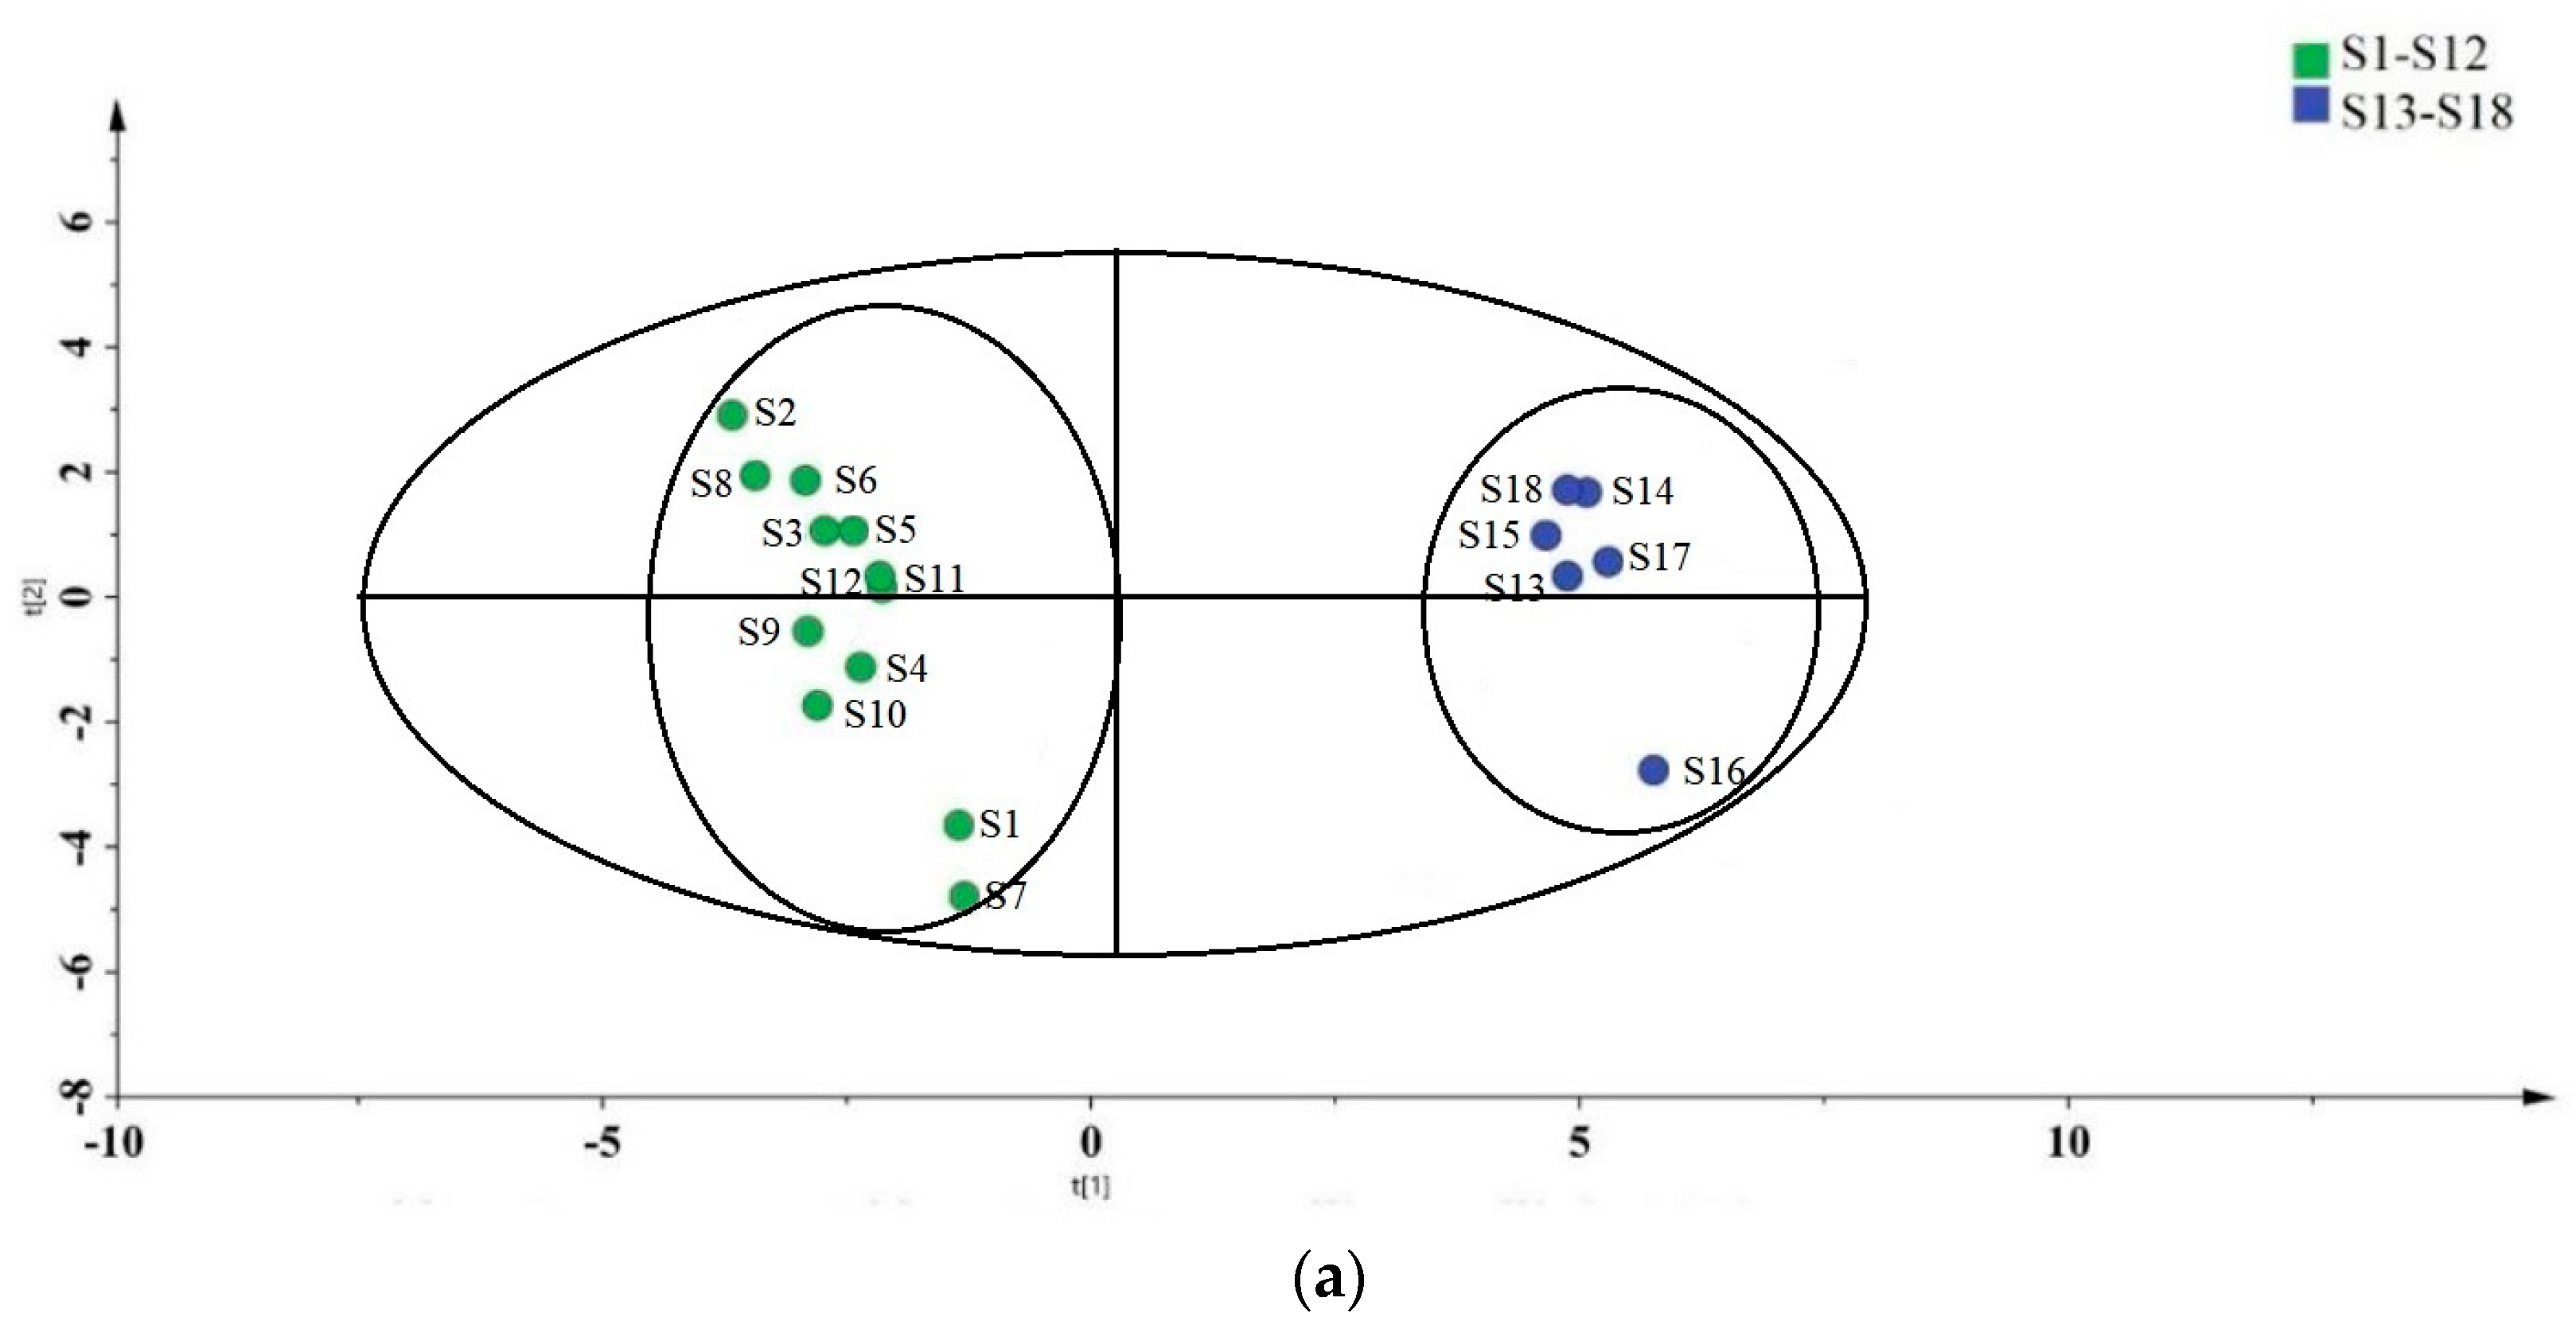
3.4. Partial Least Squares Discriminant Analysis (PLS-DA) of the Samples
4. Discussion
5. Conclusions
Supplementary Materials
Author Contributions
Funding
Institutional Review Board Statement
Informed Consent Statement
Data Availability Statement
Acknowledgments
Conflicts of Interest
References
- Chinese Pharmacopoeia Commission. Chinese Pharmacopoeia Commission Pharmacopoeia of the People’s Republic of China. Part I; China Medical Science Press: Beijing, China, 2015; p. 79. [Google Scholar]
- Ou, J.M.; Wang, R.; Li, X.L.; Huang, L.Q.; Yuan, Q.J.; Fang, C.W.; Wu, D.L. Comparative Analysis of Free Amino Acids and Nucleosides in Different Varieties of Mume Fructus Based on Simultaneous Determination and Multivariate Statistical Analyses. J. Int. Anal. Chem. 2020, 2020, 4767605. [Google Scholar] [CrossRef] [PubMed]
- Zhang, H.Y.; Li, Q.; Fu, X.L. Research progress on chemical constituents and pharmacological effects of Mume Fructus. Shanghai J. Trad. Chin. Med. 2017, 51, 296–300. [Google Scholar]
- Turturica, M.; Stanciuc, N.; Bahrim, G.; Rapeanu, G. Effect of thermal treatment on phenolic compounds from plum (Prunus domestica) extract—A kinetic study. J. Food Eng. 2016, 171, 200–207. [Google Scholar] [CrossRef]
- Khan, A.; Pan, J.H.; Cho, S.; Lee, S.; Kim, Y.J.; Park, Y.H. Investigation of the hepatoprotective effect of Prunus mume Sieb.et Zucc extract in a mouse model of alcoholic liver injury through high-resolution metabolomics. J. Med. Food 2017, 20, 734–743. [Google Scholar] [CrossRef]
- Nirmal, S.A.; Pal, S.C.; Mandal, S.C.; Patil, A.N. Analgesic and antiinflammatory activity of β-sitosterol isolated from nyctanthes arbortristis leaves. J. Inflammopharmacol. 2012, 20, 219–224. [Google Scholar] [CrossRef]
- Takashi, H.; Hitoshi, T.; Atsushi, N.; Eri, K.; Sanae, U.; Naomi, S.; Tomohiro, K.; Ken, S.; Satoru, K. Advanced hepatocellular carcinoma responds to MK615, a compound extract from the Japanese apricot “Prunus mume”. World J. Hepatol. 2013, 5, 596–600. [Google Scholar]
- Sriwilaijaroen, N.; Kadowaki, A.; Onishi, Y.; Gato, N.; Ujike, M.; Odagiri, T.; Tashiro, M.; Suzuki, Y. Mumefural and related HM-F derivatives from Japanese apricot fruit juice concentrate show multiple inhibitory effects on pandemic influenza A (H1) A (H1N1) virus. Food Chem. 2011, 127, 1–9. [Google Scholar] [CrossRef]
- Li, J.L.; Tang, Q.; Chen, G. Study on the bacteriostatic activity, antiinflammation, analgesic and antipyretic effects of extract from Lonicera bud. Sci. Technol. Food. Ind. 2012, 33, 82–87. [Google Scholar]
- Liu, Y.X.; Bai, J.X.; Li, T.; Fu, X.-Q.; Guo, H.; Zhu, P.-L.; Chan, Y.-C.; Chou, J.-Y.; Yin, C.-L.; Li, J.-K.; et al. A TCM formula comprising Sophorae Flos and Lonicerae Japonicae Flos alters compositions of immune cells and molecules of the STAT3pathway in melanoma microenvironment. Pharmacol. Res. 2019, 142, 115–126. [Google Scholar] [CrossRef]
- He, F.; Xu, B.L.; Chen, C.; Jia, H.J.; Wu, I.J.X.; Wu, X.C. Methylophiopogonanone A suppresses ischemia/reperfusion-induced myocardial apoptosis in mice via activating PI3K/Akt/eNOS signaling pathway. J. Acta. Pharmacol. Sin. 2016, 37, 763. [Google Scholar] [CrossRef]
- Wang, Y.; Liu, F.; Liang, Z.; Peng, L.; Wang, B.Q.; Yu, J.; Su, Y.Y. Homoisoflavonoids and the antioxidant activity of Ophiopogon japonicus root. J. Iran. J. Pharm. Res. 2017, 16, 357. [Google Scholar]
- Zhao, R.H.; Duan, J.A.; Gao, Z.J.; Zeng, Y.; Qian, D.W.; Su, S.L.; Zhou, H.Y. Analysis and evaluation of traditional and modern drying technologies and methods of primary processing of traditional Chinese medicinal materials. J. Mod. Chin. Med. 2013, 15, 1026–1035. [Google Scholar]
- Duan, J.A.; Su, S.L.; Lv, J.L.; Yan, H.; Ding, A.W. Traditional experiences and modern cognition on primary processing of traditional Chinese medicinal materials. J. Chin. Mater. Med. 2009, 34, 3151–3157. [Google Scholar]
- Ding, C.; Li, B.S. Variation in Color during Smoking of Green Plum. J. Mod. Food Sci. Technol. 2012, 28, 23–26. [Google Scholar]
- Cao, F.; Kang, Z.P.; Xie, X.M.; Wu, B.L.; Zhang, L. Determination and Analysis of Water Soluble Organic Acid in 5Rosaceae Fruit Medicines with Flavor Acid. J. Beijing Univ. TCM 2017, 40, 578–584. [Google Scholar]
- Chen, Z.G.; En, B.T.; Zhang, Z.Q. RP—HPLC Simultaneous Determination of 8Organic Acids in Mume Fructus. J. Chin. Mater. Med. 2006, 21, 1783–1786. [Google Scholar]
- An, M.; Li, X.; Zhao, Y.; Li, G.; Lu, C.J.; Wu, Q.G. HPLC-PDA Simultaneous Determination of Three Characteristic Components in Mume Fructus. Chin. J. Exp. Tradit. Med. Form. 2017, 23, 52–56. [Google Scholar]
- Wu, Q.S.; Wang, C.M.; Lu, J.J.; Lin, L.G.; Chen, P.; Zhang, Q.W. Simultaneous determination of six saponins in Panax Japonici Rhizoma using quantitative analysis of multi-components with single-marker method. J. Curr. Pharm. Anal. 2017, 13, 289. [Google Scholar] [CrossRef]
- Wang, X.P.; Wang, F.; Bai, J.J.; Wang, J.; Ye, Z.R. HPLC Simultaneous Determination of Four Saponins in Fujizhu Weikang Granules. J. Chin. J. New. Drugs Clin. Rein. 2017, 34, 553. [Google Scholar]
- Tan, M.X.; Chen, J.L.; Zhou, L.S.; Liu, X.H.; Tang, R.M.; Ma, J.M. Effects of different drying methods on multiple bioactive constituents of Ophiopogonis Radix. J. Nat. Prod. Res. Dev. 2019, 31, 100–109. [Google Scholar]
- Wang, R.; Cheng, H.; Yang, Y.T.; Ou, J.M.; Song, Q.Q.; Zhou, H.Y. Ultra-performance liquid chromatography-quadrupole-time of flight tandem-mass spectrometry and liquid chromatograph tandem mass spectrometer combined with chemometric analysis an approach for the quality evaluation of Mume Fructus. J. Sep. Sci. 2022, 2022, 1884–1893. [Google Scholar] [CrossRef] [PubMed]
- Fan, W.G.; Verrier, F.; Queneau, Y.; Popowycz, F. 5-Hydroxymethylfurfural (HMF) in Organic Synthesis: A Review of its Recent Applications Towards Chemicals. J. Curr. Fine Org. Synth. 2019, 16, 583–614. [Google Scholar] [CrossRef] [PubMed]
- Li, M.M.; Wu, L.Y.; Zhao, T.; Wu, K.; Xiong, L.; Zhu, L.L.; Fan, M. The protective role of 5-hydroxymethyl-2-furfural (5-HMF) must exact hyperbaric hypoxia. J. Cell Stress. Chaperones 2011, 16, 529–537. [Google Scholar] [CrossRef]
- Lu, H.Z.; Ding, Y.; Wang, J.Y.; Chen, C.; Yao, X.R.; Yuan, X.M.; Bu, F.; Bao, H.; Dong, Y.W.; Zhou, Q.; et al. Early administration of Wumei Wan inhibit myeloid-derived suppressor cells via PI3K/Akt pathway and amino acids metabolism to prevent Colitis-associated Colorectal Cancer. J. Ethnopharmacol. 2024, 333, 118260. [Google Scholar] [CrossRef]
- Sun, J.; LaMei, X.; Ansi, A.W.; Fan, M.; Li, Y.; Qian, H.; Fan, L.; Wang, L. Metabolic profiling and amino acid evolution in fermented oats: Insights from UPLC-MS/MS and PLS-DA analysis. Food Biosci. 2025, 66, 106172. [Google Scholar] [CrossRef]
- Ren, M.; Wang, Y.; Yuan, Y.; Du, H.; Liang, Q.; Qin, F.; Xiong, Z. Integration of UHPLC-MS and mass spectrometry imaging techniques revealed the protective mechanism of Gushudan in postmenopausal osteoporosis rats via branched-chain amino acid metabolism based on the ‘kidney-bone’ axis. J. Chromatogr. B 2025, 1256, 124540. [Google Scholar] [CrossRef]
- Shinde, B.; Patil, D.; Kadam, N.; Gautam, M.; Banerjee, K.; Gairola, S.; Doshi, P. Ultra-high performance liquid chromatography with tandem mass spectrometry (UPLC-MS/MS) for simultaneous estimation of residual glyphosate and its metabolite (amino methyl phosphonic acid—AMPA) in various vaccines. Biol. J. Int. Assoc. Biol. Stand. 2025, 90, 101822. [Google Scholar] [CrossRef]


| Samples | No. | Origin | Origin |
|---|---|---|---|
| MFf | S1 | Sichuan | fumigation |
| S2 | Sichuan | ||
| S3 | Sichuan | ||
| S4 | Sichuan | ||
| S5 | Sichuan | ||
| S6 | Sichuan | ||
| S7 | Fujian | ||
| S8 | Fujian | ||
| S9 | Fujian | ||
| S10 | Fujian | ||
| S11 | Fujian | ||
| S12 | Fujian | ||
| MFd | S13 | Sichuan | drying |
| S14 | Sichuan | ||
| S15 | Sichuan | ||
| S16 | Sichuan | ||
| S17 | Sichuan | ||
| S18 | Sichuan |
| No. | Name | Formula | (tR) | [M + H]+ | [M − H]− | MRM | DP/V | CE/V |
|---|---|---|---|---|---|---|---|---|
| (min) | m/z | m/z | (Precursor→Product) | |||||
| 1 | Benzoic acid | C6H6O3 | 10.43 | - | 120.92 | 120.5-76.9 | −56 | −16 |
| 2 | Quercitrin | C21H20O11 | 9.70 | - | 447.81 | 447.2-299.8 | −145 | −35 |
| 3 | Caffeic acid | C9H8O4 | 9.74 | - | 178.53 | 178.5-134.6 | −68 | −22 |
| 4 | Fumaric acid | C4H4O4 | 7.22 | - | 115.01 | 114.5-70.9 | −57 | −13 |
| 5 | Chlorogenic acid | C16H18O9 | 6.02 | - | 353.11 | 352.8-190.7 | −79 | −20 |
| 6 | Protocatechuic acid | C7H6O4 | 6.29 | - | 152.95 | 152.6-108.7 | −59 | −22 |
| 7 | Succinic acid | C4H6O4 | 4.21 | - | 116.82 | 116.3-72.8 | −28 | −17 |
| 8 | Quininic acid | C7H12O6 | 5.47 | - | 190.52 | 190.5-85.0 | −60 | −27 |
| 9 | Rutin | C27H30O16 | 8.87 | - | 610.55 | 609.0-300.6 | −162 | −48 |
| 10 | Citric acid | C₆H₈O₇ | 6.82 | - | 190.32 | 190.3-74.8 | −202 | −25.9 |
| 11 | Malic acid | C4H6O5 | 6.03 | - | 132.93 | 132.5-114.0 | −69 | −13 |
| 12 | Kaempferol | C15H10O6 | 13.28 | - | 283.85 | 282.9-246.8 | −120 | −35 |
| 13 | Ursolic acid | C30H48O3 | 10.89 | 457.37 | - | 457.3-411.2 | 116 | 40 |
| 14 | Amygdalin | C20H27NO11 | 6.45 | 458.41 | - | 458.3-163.0 | 50 | 20 |
| 15 | Cyanidin-3-O-glucoside chloride | C21H21O11 | 6.27 | 449.29 | - | 449.2-287.2 | 17 | 27 |
| 16 | Apigenin | C15H10O5 | 12.76 | 274.59 | - | 274.0-87.9 | 79 | 32 |
| 17 | 5-hydroxymethylfurfural | C6H6O3 | 6.66 | 109.0 | - | 109.0-53.0 | 87 | 21 |
| 18 | L-alanine | C3H7NO2 | 4.36 | 91.76 | - | 90.06-44.02 | 79 | 10 |
| 19 | L-serine | C3H7NO3 | 6.18 | 106.11 | - | 106.05-59.99 | 67 | 8 |
| 20 | L-aspartic acid | C4H7NO4 | 1.7 | 134.13 | - | 134.05-87.96 | 59 | 10 |
| 21 | L-asparagine | C4H8N2O3 | 6.22 | 132.97 | - | 132.80-115.70 | 46 | 13 |
| 22 | L-valine | C5H11NO2 | 3.38 | 118.74 | - | 118.09-72.06 | 67 | 8 |
| 23 | L-glutamic acid | C5H9NO4 | 6.53 | 151.64 | - | 147.08-83.92 | 83 | 14 |
| 24 | L-isoleucine | C6H13NO2 | 5.81 | 132.41 | - | 132.00-86.00 | 66 | 15 |
| 25 | L-methionine | C5H11NO2S | 3.41 | 151.13 | - | 150.06-104.03 | 91 | 10 |
| 26 | L-arginine | C6H14N4O2 | 6.46 | 175.78 | - | 175.12-70.02 | 88 | 18 |
| 27 | L-histidine | C6H9N3O2 | 6.52 | 156.74 | - | 156.08-110.03 | 95 | 16 |
| 28 | L-threonine | C4H9NO3 | 5.70 | 120.56 | - | 120.30-76.80 | 54 | 11 |
| 29 | L-phenylalanine | C9H11NO2 | 2.84 | 166.98 | - | 166.10-120.05 | 56 | 14 |
| 30 | L-leucine | C6H13NO2 | 2.81 | 132.87 | - | 132.10-86.05 | 98 | 10 |
| 31 | L-cystine | C6H12N2O4S2 | 7.02 | 241.03 | - | 240.80-151.90 | 71 | 18 |
| 32 | L-hydroxyproline | C5H9NO3 | 2.89 | 134.45 | - | 133.80-71.80 | 52 | 25 |
| 33 | L-tyrosine | C9H11NO3 | 3.56 | 182.95 | - | 182.16-136.08 | 46 | 17 |
| 34 | L-tryptophan | C11H12N2O2 | 2.73 | 205.46 | - | 205.00-188.00 | 202 | 15 |
| 35 | L-proline | C5H9NO2 | 4.13 | 116.43 | - | 116.07-70.02 | 68 | 10 |
| 36 | L-lysine hydrochloride | C6H15CIN2O2 | 6.52 | 147.41 | - | 147.00-84.00 | 52 | 24 |
| 37 | γ-aminobutyric acid | C4H9NO2 | 3.14 | 104.24 | - | 103.70-86.90 | 32 | 14 |
| 38 | Guanine | C5H5N5O | 4.56 | 152.11 | - | 151.80-135.0 | 62 | 24 |
| 39 | Adenine | C5H5N5 | 1.93 | 136.94 | - | 136.06-119.00 | 51 | 24 |
| 40 | Uracil | C4H4N2O2 | 2.44 | 113.73 | - | 113.04-70.00 | 111 | 21 |
| 41 | Hypoxanthine | C10H12N4O5 | 3.96 | 269.78 | - | 269.00-137.05 | 46 | 15 |
| 42 | Thymidine | C10H14N2O5 | 2.39 | 255.17 | - | 243.10-127.07 | 61 | 13 |
| 43 | Guanosine | C10H13N5O5 | 5.23 | 284.78 | - | 284.30-152.00 | 62 | 15 |
| 44 | Inosine | C10H12N4O5 | 3.66 | 269.51 | - | 269.00-137.05 | 46 | 15 |
| 45 | Uridine | C9H12N2O6 | 4.72 | 255.13 | - | 244.90-113.00 | 103 | 13 |
| 46 | Adenosine | C10H13N5O4 | 3.47 | 268.12 | - | 267.9-118.7 | 86 | 23 |
| 47 | Cytidine | C9H13N3O5 | 4.74 | 244.51 | - | 244.09-94.65 | 61 | 10 |
| No. | Regression Equation | Linear Range (μg/mL) | R2 | LoD (ng/mL) | LoQ (ng/mL) | Precision (RSD%) | Stability | Repeatability | Recovery | Matrix Effect | ||
|---|---|---|---|---|---|---|---|---|---|---|---|---|
| Intraday | Interday | (RSD %, n = 6) | (RSD %, n = 6) | Mean | RSD% | |||||||
| (n = 6) | (n = 3) | |||||||||||
| 1 | y = 2.97 × 10⁵x − 1.57 × 10⁵ | 0.12–12.24 | 0.9991 | 0.43 | 1.28 | 2.32 | 2.31 | 2.83 | 2.58 | 104.38 | 3.34 | 1.01 |
| 2 | y = 2 × 10⁶x − 870.64 | 0.0011–1.11 | 0.9993 | 0.33 | 1.11 | 2.32 | 2.26 | 2.81 | 2.45 | 95.54 | 2.37 | 1.03 |
| 3 | y = 7.50 × 10⁵x − 7 × 10⁵ | 1.21–121.75 | 0.9995 | 0.55 | 1.56 | 2.17 | 2.79 | 2.22 | 2.21 | 97.39 | 3.69 | 1.05 |
| 4 | y = 5.32 × 10⁵x − 2 × 10⁶ | 2.64–264.12 | 0.9991 | 0.69 | 2.41 | 1.62 | 2.89 | 2.39 | 2.73 | 104.39 | 2.18 | 1.02 |
| 5 | y = 7.02 × 10⁵x − 2 × 10⁷ | 0.065–130.23 | 0.9993 | 2.14 | 6.18 | 1.96 | 2.38 | 2.87 | 2.57 | 101.54 | 3.55 | 0.96 |
| 6 | y = 8.03 × 10⁵x − 3 × 10⁶ | 0.13–130.47 | 0.9994 | 0.95 | 3.76 | 1.99 | 2.77 | 1.75 | 2.68 | 96.56 | 2.65 | 0.99 |
| 7 | y = 1 × 10⁶x − 4 × 10⁶ | 0.12–240 | 0.9992 | 0.69 | 1.63 | 2.31 | 1.99 | 2.61 | 2.21 | 99.61 | 2.01 | 1.03 |
| 8 | y = 6.94 × 10⁵x − 2 × 10⁶ | 1.34–268.79 | 0.9996 | 2.16 | 6.81 | 3.29 | 2.68 | 2.51 | 2.89 | 97.75 | 2.44 | 0.97 |
| 9 | y = 5.55 × 10⁴x − 6.26 × 10⁴ | 0.071–141.84 | 0.9990 | 0.39 | 1.38 | 2.33 | 2.38 | 2.92 | 2.49 | 98.33 | 3.03 | 0.97 |
| 10 | y = 2.66 × 10⁵x − 2 × 10⁷ | 0.123–12300 | 0.9991 | 0.47 | 1.12 | 2.79 | 1.78 | 1.44 | 2.11 | 98.58 | 2.29 | 0.97 |
| 11 | y = 2.40 × 10⁵x − 2 × 10⁶ | 0.015–600.45 | 0.9995 | 0.41 | 13.77 | 2.35 | 2.41 | 2.27 | 2.23 | 102.31 | 2.59 | 1.01 |
| 12 | y = 3.21 × 10⁴x − 1.23 × 10⁴ | 0.012–40.13 | 0.9996 | 0.91 | 2.87 | 1.28 | 2.31 | 1.86 | 2.68 | 95.02 | 2.18 | 0.95 |
| 13 | y = 1.43 × 10⁴x − 6.26 × 10⁴ | 0.011–200.14 | 0.9994 | 0.37 | 1.23 | 1.56 | 2.01 | 2.46 | 1.74 | 97.35 | 2.56 | 0.98 |
| 14 | y = 1814.8x − 1230.6 | 0.081–50.29 | 0.9995 | 0.57 | 1.75 | 2.05 | 2.89 | 2.34 | 2.74 | 100.57 | 2.67 | 1.02 |
| 15 | y = 9.59 × 10⁵x − 7.12 × 10⁵ | 0.012–121.23 | 0.9996 | 0.89 | 3.16 | 2.38 | 2.12 | 2.79 | 2.95 | 96.52 | 2.82 | 0.99 |
| 16 | y = 3.61 × 10⁴x − 4 × 10⁶ | 0.015–258.47 | 0.9991 | 0.60 | 1.98 | 2.06 | 2.68 | 1.82 | 2.75 | 97.41 | 2.91 | 0.94 |
| 17 | y = 3.38 × 10⁵x − 1 × 10⁶ | 0.097–9.86 | 0.9990 | 0.78 | 2.43 | 1.51 | 2.59 | 2.12 | 2.88 | 102.23 | 2.61 | 0.96 |
| 18 | y = 4.2 × 10⁵x − 6.22 × 10⁴ | 0.097–9.86 | 0.9995 | 0.83 | 3.87 | 2.21 | 2.36 | 1.76 | 2.89 | 98.03 | 3.89 | 0.98 |
| 19 | y = 3242.7 x − 4.51y = 104 | 0.12–126.31 | 0.9995 | 3.83 | 9.87 | 2.73 | 2.56 | 2.09 | 2.88 | 98.35 | 2.61 | 0.96 |
| 20 | y = 2.50 × 10⁴x − 1.89 × 10⁴ | 0.136–280.17 | 0.9998 | 3.26 | 10.9 | 2.28 | 2.36 | 2.59 | 2.66 | 96.73 | 2.67 | 1.01 |
| 21 | y = 4.31 × 10⁴x − 1.45 × 10⁵ | 0.15–156.85 | 0.9992 | 0.93 | 3.42 | 2.06 | 1.99 | 2.16 | 2.01 | 104.94 | 2.09 | 0.98 |
| 22 | y = 2.76 × 10⁵x − 1 × 10⁶ | 0.59–108.27 | 0.9997 | 1.47 | 3.90 | 2.34 | 2.56 | 2.17 | 2.01 | 102.21 | 2.88 | 1.01 |
| 23 | y = 3082.3x − 5105.7 | 0.16–80.17 | 0.9997 | 0.88 | 3.96 | 1.99 | 2.37 | 2.89 | 2.25 | 97.15 | 2.31 | 1.05 |
| 24 | y = 5 × 10⁶x − 4 × 10⁶ | 0.287–28.07 | 0.9996 | 0.15 | 0.49 | 2.14 | 2.78 | 2.03 | 2.01 | 98.45 | 2.51 | 0.97 |
| 25 | y = 4.36 × 10⁵x − 1.14 × 10⁴ | 0.012–10.68 | 0.9995 | 0.65 | 2.08 | 1.75 | 2.88 | 2.33 | 2.07 | 96.64 | 2.44 | 0.98 |
| 26 | y = 2 × 10⁶x − 8.74 × 10⁴ | 0.012–20.43 | 0.9997 | 3.37 | 10.2 | 1.38 | 2.13 | 2.26 | 2.28 | 94.89 | 2.11 | 0.93 |
| 27 | y = 8 × 10⁴x − 8.74 × 10⁴ | 0.17–95.14 | 0.9993 | 0.91 | 4.15 | 2.38 | 2.34 | 2.86 | 2.46 | 103.21 | 2.61 | 1.03 |
| 28 | y = 6.89 × 10⁵x − 3.89 × 10⁴ | 0.21–60.74 | 0.9991 | 0.66 | 2.18 | 1.91 | 3.23 | 1.52 | 2.07 | 99.18 | 2.47 | 0.94 |
| 29 | y = 2 × 10⁶x − 3.39 × 10⁵ | 0.14–14.63 | 0.9995 | 2.11 | 7.04 | 1.85 | 2.13 | 2.76 | 1.94 | 97.26 | 2.06 | 1.03 |
| 30 | y = 3261.4x − 2766.7 | 0.17–34.96 | 0.9991 | 0.42 | 1.23 | 2.06 | 1.97 | 2.23 | 2.06 | 103.24 | 2.36 | 1.02 |
| 31 | y = 2686.5x − 970.63 | 0.95–54.93 | 0.9996 | 0.34 | 1.34 | 2.65 | 2.08 | 2.57 | 2.08 | 105.42 | 2.80 | 1.02 |
| 32 | y = 1 × 10⁶x − 2.78 × 10⁵ | 0.81–40.49 | 0.9995 | 0.36 | 1.46 | 2.51 | 2.04 | 2.44 | 2.04 | 96.50 | 2.78 | 1.04 |
| 33 | y = 4 × 10⁴ − 3.12 × 10⁵ | 0.021–105.71 | 0.9991 | 0.19 | 0.64 | 2.81 | 1.98 | 1.77 | 2.43 | 99.53 | 2.14 | 1.01 |
| 34 | y = 3.28 × 10⁴x − 5.23 × 10⁴ | 0.13–91.84 | 0.9990 | 0.23 | 0.91 | 2.26 | 2.78 | 1.13 | 2.19 | 98.36 | 2.07 | 1.02 |
| 35 | y = 8.21 × 10⁵x − 6.84 × 10⁴ | 0.214–30.69 | 0.9993 | 1.72 | 5.43 | 2.27 | 2.51 | 2.20 | 2.51 | 98.36 | 2.20 | 1.06 |
| 36 | y = 1 × 10⁷x + 4 × 10⁶ | 0.41–160.34 | 0.9994 | 1.74 | 5.73 | 2.80 | 2.60 | 2.72 | 2.60 | 105.43 | 2.37 | 1.03 |
| 37 | y = 4.68 × 10⁴x − 9.48 × 10⁴ | 0.161–66.43 | 0.9997 | 0.43 | 1.35 | 2.64 | 2.14 | 2.56 | 2.14 | 102.56 | 2.84 | 0.97 |
| 38 | y = 2 × 10⁷x − 4 × 10⁶ | 0.056–25.14 | 0.9991 | 0.55 | 1.63 | 2.75 | 2.50 | 2.67 | 2.50 | 97.53 | 1.73 | 1.00 |
| 39 | y = 8 × 10⁶x + 1.23 × 10⁴ | 0.089–3.74 | 0.9994 | 0.47 | 1.49 | 2.27 | 1.79 | 2.20 | 1.79 | 100.61 | 2.58 | 1.04 |
| 40 | y = 3.46 × 10⁵x − 3.54 × 10⁴ | 0.056–1.89 | 0.9995 | 0.76 | 2.34 | 2.97 | 2.41 | 2.88 | 2.41 | 98.73 | 2.49 | 0.98 |
| 41 | y = 1 × 10⁷x − 1 × 10⁶ | 0.13–8.78 | 0.9993 | 0.88 | 2.75 | 2.55 | 2.14 | 2.48 | 2.14 | 99.31 | 2.89 | 0.98 |
| 42 | y = 3 × 10⁶x − 5.97 × 10⁵ | 0.23–46.21 | 0.9992 | 2.61 | 8.47 | 2.16 | 1.60 | 2.10 | 1.60 | 99.57 | 1.43 | 0.98 |
| 43 | y = 1.09 × 10⁵x − 3.63 × 10⁴ | 0.107–20.89 | 0.9996 | 0.28 | 0.96 | 2.29 | 2.17 | 2.22 | 2.17 | 103.33 | 2.25 | 1.02 |
| 44 | y = 2 × 10⁷x − 3.38 × 10⁵ | 0.018–37.42 | 0.9995 | 1.12 | 3.96 | 2.75 | 2.08 | 2.67 | 2.08 | 95.97 | 1.84 | 0.96 |
| 45 | y = 7.59 × 10⁴x − 189.53 | 0.031–6.84 | 0.9994 | 2.31 | 6.72 | 1.78 | 1.81 | 1.73 | 1.81 | 98.32 | 2.44 | 0.99 |
| 46 | y = 3 × 10⁷x + 3.20 × 10⁵ | 0.062–1.954 | 0.9991 | 0.22 | 0.71 | 2.81 | 2.60 | 2.73 | 2.60 | 101.58 | 2.32 | 1.03 |
| 47 | y = 9 × 10⁶x − 4.62 × 10⁵ | 0.074–14.19 | 0.9993 | 1.21 | 3.43 | 2.97 | 1.91 | 2.94 | 1.91 | 97.49 | 2.76 | 1.00 |
| PCs | Eigenvalues | Variance % | Accumulate % |
|---|---|---|---|
| 1 | 12.772 | 27.175 | 27.175 |
| 2 | 5.699 | 12.126 | 39.301 |
| 3 | 4.037 | 8.588 | 47.889 |
| 4 | 3.992 | 8.494 | 56.383 |
| 5 | 3.766 | 8.014 | 64.397 |
| 6 | 2.846 | 6.056 | 70.453 |
| 7 | 2.606 | 5.545 | 75.998 |
| 8 | 2.332 | 4.962 | 80.96 |
Disclaimer/Publisher’s Note: The statements, opinions and data contained in all publications are solely those of the individual author(s) and contributor(s) and not of MDPI and/or the editor(s). MDPI and/or the editor(s) disclaim responsibility for any injury to people or property resulting from any ideas, methods, instructions or products referred to in the content. |
© 2025 by the authors. Licensee MDPI, Basel, Switzerland. This article is an open access article distributed under the terms and conditions of the Creative Commons Attribution (CC BY) license (https://creativecommons.org/licenses/by/4.0/).
Share and Cite
Li, N.; Yue, J.; Wang, R. Determination of Multiple Active Components in Mume Fructus by UPLC-MS/MS. Metabolites 2025, 15, 312. https://doi.org/10.3390/metabo15050312
Li N, Yue J, Wang R. Determination of Multiple Active Components in Mume Fructus by UPLC-MS/MS. Metabolites. 2025; 15(5):312. https://doi.org/10.3390/metabo15050312
Chicago/Turabian StyleLi, Nannan, Jingyi Yue, and Rui Wang. 2025. "Determination of Multiple Active Components in Mume Fructus by UPLC-MS/MS" Metabolites 15, no. 5: 312. https://doi.org/10.3390/metabo15050312
APA StyleLi, N., Yue, J., & Wang, R. (2025). Determination of Multiple Active Components in Mume Fructus by UPLC-MS/MS. Metabolites, 15(5), 312. https://doi.org/10.3390/metabo15050312