
An Exploratory Study of Serum Vasorin Levels in Polycystic Ovary Syndrome: A Novel Potential Biomarker for Diagnosis and Pathogenesis


Abstract
1. Introduction
2. Materials and Methods
2.1. Study Design and Participants
2.2. Inclusion and Exclusion Criteria
2.3. Data Collection and Anthropometric Measurements
2.4. Metabolic and Hormonal Assessments
2.5. Analytical Process and Quality-Control Measures
2.6. Vasorin Measurement Procedure
2.7. Statistical Analysis
3. Results
4. Discussion
5. Conclusions
Author Contributions
Funding
Institutional Review Board Statement
Informed Consent Statement
Data Availability Statement
Conflicts of Interest
Abbreviations
| PCOS | Polycystic Ovary Syndrome |
| BMI | Body Mass Index |
| AMH | Anti-Müllerian Hormone |
| FSH | Follicle-Stimulating Hormone |
| LH | Luteinizing Hormone |
| E2 | Estradiol |
| HOMA-IR | Homeostatic Model Assessment for Insulin Resistance |
| FGS | Ferriman–Gallwey Score |
References
- Singh, S.; Pal, N.; Shubham, S.; Sarma, D.K. Polycystic Ovary Syndrome: Etiology, Current Management, and Future Therapeutics. J. Clin. Med. 2023, 12, 1454. [Google Scholar] [CrossRef]
- Brand, K.M.; Gottwald-Hostalek, U.; Andag-Silva, A. Update on the therapeutic role of metformin in the management of polycystic ovary syndrome: Effects on pathophysiologic process and fertility outcomes. Women’s Health 2025, 21, 17455057241311759. [Google Scholar] [CrossRef]
- Chang, K.J.; Chen, J.H.; Chen, K.H. The Pathophysiological Mechanism and Clinical Treatment of Polycystic Ovary Syndrome: A Molecular and Cellular Review of the Literature. Int. J. Mol. Sci. 2024, 25, 9037. [Google Scholar] [CrossRef]
- Meng, L.; Yang, H.; Hu, Y.; Jiang, Y.; Yang, Z. Evaluation of ultrasound derived fat fraction for metabolic associated fatty liver disease in obese patients with polycystic ovary syndrome. J. Ultrasound 2025, 1–9. [Google Scholar] [CrossRef]
- The Rotterdam ESHRE/ASRM-Sponsored PCOS Consensus Workshop Group. Revised 2003 consensus on diagnostic criteria and long-term health risks related to polycystic ovary syndrome (PCOS). Hum. Reprod. 2004, 19, 41–47. [Google Scholar] [CrossRef] [PubMed]
- Chang, S.; Dunaif, A. Diagnosis of Polycystic Ovary Syndrome: Which Criteria to Use and When? Endocrinol. Metab. Clin. N. Am. 2021, 50, 11–23. [Google Scholar] [CrossRef] [PubMed]
- Fahs, D.; Salloum, D.; Nasrallah, M. Polycystic Ovary Syndrome: Pathophysiology and Controversies in Diagnosis. Diagnostics 2023, 13, 1559. [Google Scholar] [CrossRef]
- Halder, A.; Kumar, H.; Sharma, M.; Jain, M.; Kalsi, A.K.; Pandey, S. Serum anti-Müllerian hormone: A potential biomarker for polycystic ovary syndrome. Indian J. Med. Res. 2023, 158, 397–406. [Google Scholar] [CrossRef] [PubMed]
- Mancini, A.; Bruno, C.; Vergani, E.; d’Abate, C.; Giacchi, E.; Silvestrini, A. Oxidative Stress and Low-Grade Inflammation in Polycystic Ovary Syndrome: Controversies and New Insights. Int. J. Mol. Sci. 2021, 22, 1667. [Google Scholar] [CrossRef]
- Rudnicka, E.; Suchta, K.; Grymowicz, M.; Calik-Ksepka, A.; Smolarczyk, K. Chronic Low Grade Inflammation in Pathogenesis of PCOS. Int. J. Mol. Sci. 2021, 22, 3789. [Google Scholar] [CrossRef]
- Ikeda, Y.; Imai, Y.; Kumagai, H.; Nosaka, T.; Morikawa, Y.; Hisaoka, T.; Manabe, I.; Maemura, K.; Nakaoka, T.; Imamura, T.; et al. Vasorin, a transforming growth factor beta-binding protein expressed in vascular smooth muscle cells, modulates the arterial response to injury in vivo. Proc. Natl. Acad. Sci. USA 2004, 101, 10732–10737. [Google Scholar] [CrossRef]
- Zheng, Q.; Zhou, F.; Cui, X.; Liu, M.; Li, Y.; Liu, S.; Tan, J.; Yan, Q. Novel Serum Biomarkers Detected by Protein Array in Polycystic Ovary Syndrome with Low Progesterone Level. Cell. Physiol. Biochem. 2018, 46, 2297–2310. [Google Scholar] [CrossRef]
- Chen, J.; Zhou, Q.; Zhang, Y.; Tan, W.; Gao, H.; Zhou, L.; Xiao, S.; Gao, J.; Li, J.; Zhu, Z. Discovery of novel serum metabolic biomarkers in patients with polycystic ovarian syndrome and premature ovarian failure. Bioengineered 2021, 12, 8778–8792. [Google Scholar] [CrossRef] [PubMed]
- Rimon-Dahari, N.; Heinemann-Yerushalmi, L.; Hadas, R.; Kalich-Philosoph, L.; Ketter, D.; Nevo, N.; Galiani, D.; Dekel, N. Vasorin: A newly identified regulator of ovarian folliculogenesis. FASEB J. 2018, 32, 2124–2136. [Google Scholar] [CrossRef]
- Mansoori, M.; Solhjoo, S.; Palmerini, M.G.; Nematollahi-Mahani, S.N.; Ezzatabadipour, M. Granulosa cell insight: Unraveling the potential of menstrual blood-derived stem cells and their exosomes on mitochondrial mechanisms in polycystic ovary syndrome (PCOS). J. Ovarian Res. 2024, 17, 167. [Google Scholar] [CrossRef] [PubMed]
- Bongrani, A.; Mellouk, N.; Ramé, C.; Cornuau, M.; Guerif, F.; Froment, P.; Dupont, J. Vaspin, a novel adipokine in woman granulosa cells physiology and PCOS pathogenesis? J. Endocrinol. 2021, 249, 57–70. [Google Scholar] [CrossRef]
- Rosenfield, R.L.; Ehrmann, D.A. The Pathogenesis of Polycystic Ovary Syndrome (PCOS): The Hypothesis of PCOS as Functional Ovarian Hyperandrogenism Revisited. Endocr. Rev. 2016, 37, 467–520. [Google Scholar] [CrossRef]
- Lujan, M.E.; Chizen, D.R.; Pierson, R.A. Diagnostic criteria for polycystic ovary syndrome: Pitfalls and controversies. J. Obstet. Gynaecol. Can. 2008, 30, 671–679. [Google Scholar] [CrossRef] [PubMed]
- Kahraman, F.C.; Erdoğan, S.S. Grading of hirsutism: A practical approach to the modified Ferriman-Gallwey scoring system. Postep. Dermatol. Alergol. 2022, 39, 744–748. [Google Scholar] [CrossRef]
- Tresaco, B.; Bueno, G.; Pineda, I.; Moreno, L.A.; Garagorri, J.M.; Bueno, M. Homeostatic model assessment (HOMA) index cut-off values to identify the metabolic syndrome in children. J. Physiol. Biochem. 2005, 61, 381–388. [Google Scholar] [CrossRef]
- Aydin, M.; Kızıltan, R.; Algul, S.; Kemik, O. The Utility of Serum Vasorin Levels as a Novel Potential Biomarker for Early Detection of Colon Cancer. Cureus 2022, 14, e21653. [Google Scholar] [CrossRef] [PubMed]
- Witchel, S.F.; Oberfield, S.E.; Peña, A.S. Polycystic Ovary Syndrome: Pathophysiology, Presentation, and Treatment with Emphasis on Adolescent Girls. J. Endocr. Soc. 2019, 3, 1545–1573. [Google Scholar] [CrossRef] [PubMed]
- Wang, M.; McGraw, K.R.; Monticone, R.E.; Giordo, R.; Eid, A.H.; Pintus, G. Enhanced vasorin signaling mitigates adverse cardiovascular remodeling. Aging Med. 2024, 7, 414–423. [Google Scholar] [CrossRef] [PubMed]
- Sun, J.; Guo, X.; Yu, P.; Liang, J.; Mo, Z.; Zhang, M.; Yang, L.; Huang, X.; Hu, B.; Liu, J.; et al. Vasorin deficiency leads to cardiac hypertrophy by targeting MYL7 in young mice. J. Cell. Mol. Med. 2022, 26, 88–98. [Google Scholar] [CrossRef]
- Raja-Khan, N.; Urbanek, M.; Rodgers, R.J.; Legro, R.S. The role of TGF-β in polycystic ovary syndrome. Reprod. Sci. 2014, 21, 20–31. [Google Scholar] [CrossRef]
- Wang, D.; Wang, W.; Liang, Q.; He, X.; Xia, Y.; Shen, S.; Wang, H.; Gao, Q.; Wang, Y. DHEA-induced ovarian hyperfibrosis is mediated by TGF-β signaling pathway. J. Ovarian Res. 2018, 11, 6. [Google Scholar] [CrossRef]
- González, F.; Rote, N.S.; Minium, J.; Kirwan, J.P. Reactive oxygen species-induced oxidative stress in the development of insulin resistance and hyperandrogenism in polycystic ovary syndrome. J. Clin. Endocrinol. Metab. 2006, 91, 336–340. [Google Scholar] [CrossRef]
- Eijken, M.; Krautzberger, A.M.; Scholze-Wittler, M.; Boers-Sijmons, B.; Koedam, M.; Kosiol, B.; Schrewe, H.; van Leeuwen, J.P.; van der Eerden, B.C. Vasorin-deficient mice display disturbed vitamin D and mineral homeostasis in combination with a low bone mass phenotype. Bone Rep. 2024, 22, 101792. [Google Scholar] [CrossRef]
- Zhang, Y.; Kang, T.; Wang, Y.; Song, C.; Li, H.; Mi, H.; Li, Y.; Dong, M.; Ma, X.; Zhu, H.; et al. A low level of tumor necrosis factor α in tumor microenvironment maintains the self-renewal of glioma stem cells by Vasorin-mediated glycolysis. Neuro-Oncology 2024, 26, 2256–2271. [Google Scholar] [CrossRef]
- Zheng, Y.; Yin, G.; Chen, F.; Lin, L. Evaluation of Triglyceride Glucose Index and Homeostasis Model of Insulin Resistance in Patients with Polycystic Ovary Syndrome. Women’s Health 2022, 14, 1821–1829. [Google Scholar] [CrossRef]
- Guvenc, Y.; Var, A.; Goker, A.; Kuscu, N.K. Assessment of serum chemerin, vaspin and omentin-1 levels in patients with polycystic ovary syndrome. J. Int. Med. Res. 2016, 44, 796–805. [Google Scholar] [CrossRef] [PubMed]
- Delcour, C.; Robin, G.; Young, J.; Dewailly, D. PCOS and Hyperprolactinemia: What do we know in 2019? Clin. Med. Insights Reprod. Health 2019, 13, 1179558119871921. [Google Scholar] [CrossRef] [PubMed]


| Variables | PCOS (n = 92) Median (Lower-Upper) | Control (n = 68) Median (Lower-Upper) | p * |
|---|---|---|---|
| Age (year) | 22.0 (18–40) | 29.0 (20–48) | <0.001 |
| BMI (kg/m2) | 23.7 (17.3–48.6) | 22.8 (17.1–33.2) | 0.135 |
| BMI categories | |||
| Underweight (<18.5) | 3 (3.3%) | 1 (1.5%) | 0.441 ** |
| Normal Weight (18.5–24.9) | 44 (47.8%) | 41 (60.3%) | |
| Overweight (25–29.9) | 23 (25.0%) | 16 (23.5%) | |
| Obese (30–39.9) | 21 (22.8%) | 10 (14.7%) | |
| Morbid Obese (>40) | 1 (1.1%) | 0 (0%) | |
| Waist circumference | 84.5 (60.0–130.0) | 77.5 (57.0–114.0) | 0.053 |
| Hip circumference | 103.0 (80.0–138.0) | 100.0 (86.0–127.0) | 0.156 |
| Waist/hip ratio | 0.79 (0.66–0.98) | 0.77 (0.65–0.94) | 0.071 |
| Waist/hip ratio risk | |||
| Low (<0.80) | 47 (51.1%) | 41 (60.3%) | 0.396 ** |
| Medium (0.80–0.85) | 21 (22.8%) | 15 (22.1%) | |
| High (>0.85) | 24 (26.1%) | 12 (17.6%) | |
| FGS | 12.5 (0–24) | 3 (0–7) | <0.001 |
| Hirsutizm type | |||
| No hirsutism (<8) | 19 (20.7%) | 68 (100%) | <0.001 ** |
| Mild hirsutism (8–15) | 38 (41.3%) | 0 (0%) | |
| Moderate hirsutism (16–25) | 35 (38.0%) | 0 (0%) | |
| Severe hirsutism (>25) | 0 (0%) | 0 (0%) | |
| Gravidity | 0 (0–5) | 0 (0–7) | <0.001 |
| Parity | 0 (0–3) | 0 (0–7) | <0.001 |
| HOMA-IR | 2.45 (0.09–15.23) | 1.70 (0.40–11.80) | 0.001 |
| Insulin Resistance (Yes) | 43 (46.7%) | 19 (27.9%) | 0.016 ** |
| PCOS Phenotype | |||
| Phenotype A (Ovulation Dysfunction + Hirsutism + Polycystic Ovary Morphology) | 36 (39.1%) | - | |
| Phenotype B (Ovulation Dysfunction + Hirsutism) | 11 (12.0%) | - | |
| Phenotype C (Hirsutism + Polycystic Ovary Morphology) | 21 (22.8%) | - | |
| Phenotype D (Ovulation Dysfunction + Polycystic Ovary Morphology) | 24 (26.1%) | - |
| Variables | PCOS (n = 92) Median (Lower–Upper) | Control (n = 68) Median (Lower–Upper) | p * |
|---|---|---|---|
| FSH | 5.59 (0.54–49.35) | 6.78 (3.12–18.63) | <0.001 |
| LH | 7.77 (0.43–57.00) | 6.15 (2.76–16.13) | 0.013 |
| E2 | 38.38 (5–341) | 48.99 (5–292) | 0.037 |
| Total Testosterone | 0.34 (0.05–0.89) | 0.25 (0.03–0.65) | <0.001 |
| Prolactin | 19.19 (0.65–68.38) | 16.94 (8.22–42.76) | 0.106 |
| TSH | 1.87 (0.32–6.90) | 1.91 (0.02–7.02) | 0.912 |
| HBA1C | 5.05 (4.50–6.00) | 5.10 (4.5–8.00) | 0.499 |
| Insulin | 11.08 (0.44–73.45) | 7.72 (1.72-51.33) | <0.001 |
| Fasting Glucose | 90.60 (69.80–123.0) | 91.15 (56.80–129.40) | 0.556 |
| Total Cholesterol | 161.15 (0.25–284.40) | 160.25 (105.00–237.0) | 0.875 |
| LDL | 85.05 (7.46–163.00) | 89.18 (39.38–151.06) | 0.540 |
| HDL | 51.45 (26.90–97.80) | 53.60 (28.60–90.40) | 0.228 |
| Triglyceride | 91.40 (39.70–329.20) | 70.65 (30.50–224.60) | 0.001 |
| TyG Index | 4.50 (3.02–5.20) | 4.36 (3.98–5.0) | 0.003 |
| CRP | 0.16 (0.06–3.38) | 0.14 (0.06–4.16) | 0.176 |
| FSH/LH | 1.38 (0.19–5.70) | 0.88 (0.34–3.40) | <0.001 |
| Vasorin pg/mL | 0.70 (0.35–4.36) | 2.36 (0.90–4.78) | <0.001 |
| Vasorin values for PCOS Phenotype | |||
| Phenotype A | 0.68 (0.35–1.80) | ||
| Phenotype B | 0.62 (0.40–2.13) | ||
| Phenotype C | 0.86 (0.39–2.64) | ||
| Phenotype D | 0.73 (0.41–4.01) | ||
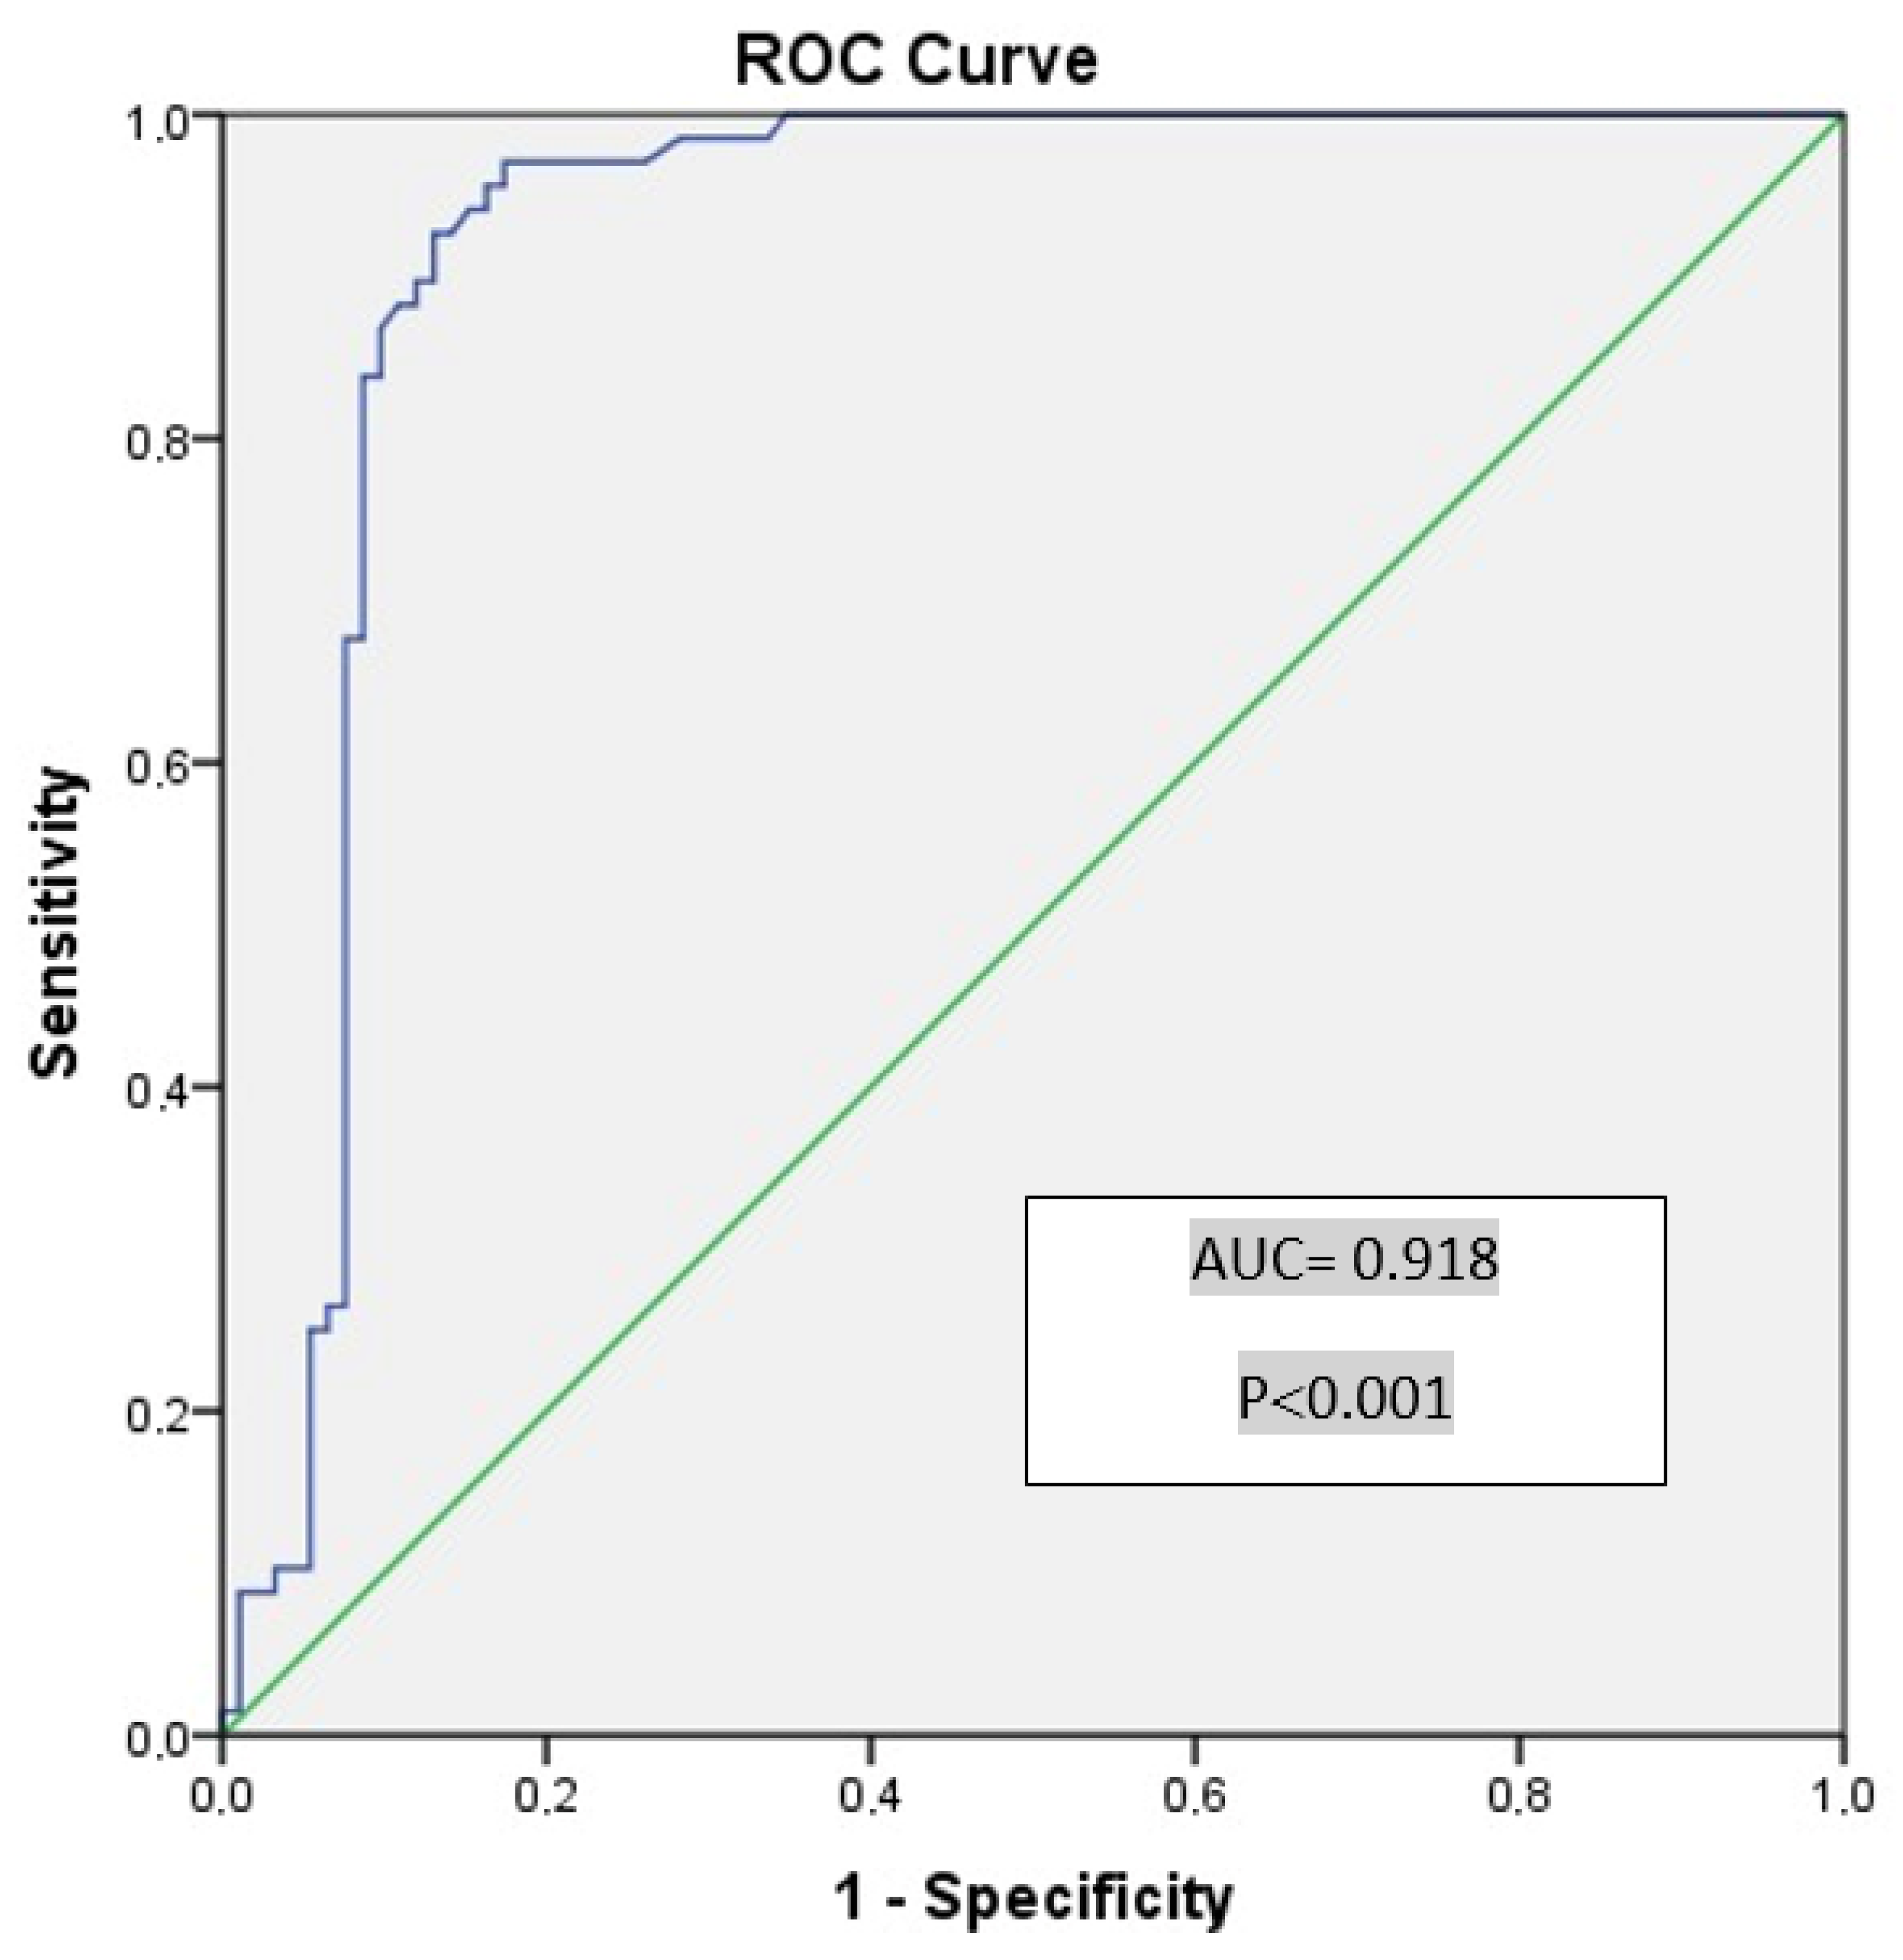
| Cutoff Value for Vasorin | Sensitivity (%) | Specificity (%) | AUC | SE | p | %95 CI (Min–Max) |
|---|---|---|---|---|---|---|
| 0.98 | 97.1 | 73.9 | 0.918 | 0.025 | <0.001 | 0.869–0.967 |
| 1.09 | 97.1 | 82.6 | ||||
| 1.225 | 94.1 | 84.8 | ||||
| 1.285 | 92.6 | 87.0 | ||||
| 1.365 | 86.7 | 87.0 |
Disclaimer/Publisher’s Note: The statements, opinions and data contained in all publications are solely those of the individual author(s) and contributor(s) and not of MDPI and/or the editor(s). MDPI and/or the editor(s) disclaim responsibility for any injury to people or property resulting from any ideas, methods, instructions or products referred to in the content. |
© 2025 by the authors. Licensee MDPI, Basel, Switzerland. This article is an open access article distributed under the terms and conditions of the Creative Commons Attribution (CC BY) license (https://creativecommons.org/licenses/by/4.0/).
Share and Cite
Keyif, B.; Yurtçu, E.; Başbuğ, A.; Yavuzcan, A.; Goynumer, F.G. An Exploratory Study of Serum Vasorin Levels in Polycystic Ovary Syndrome: A Novel Potential Biomarker for Diagnosis and Pathogenesis. Metabolites 2025, 15, 182. https://doi.org/10.3390/metabo15030182
Keyif B, Yurtçu E, Başbuğ A, Yavuzcan A, Goynumer FG. An Exploratory Study of Serum Vasorin Levels in Polycystic Ovary Syndrome: A Novel Potential Biomarker for Diagnosis and Pathogenesis. Metabolites. 2025; 15(3):182. https://doi.org/10.3390/metabo15030182
Chicago/Turabian StyleKeyif, Betül, Engin Yurtçu, Alper Başbuğ, Ali Yavuzcan, and Fikret Gokhan Goynumer. 2025. "An Exploratory Study of Serum Vasorin Levels in Polycystic Ovary Syndrome: A Novel Potential Biomarker for Diagnosis and Pathogenesis" Metabolites 15, no. 3: 182. https://doi.org/10.3390/metabo15030182
APA StyleKeyif, B., Yurtçu, E., Başbuğ, A., Yavuzcan, A., & Goynumer, F. G. (2025). An Exploratory Study of Serum Vasorin Levels in Polycystic Ovary Syndrome: A Novel Potential Biomarker for Diagnosis and Pathogenesis. Metabolites, 15(3), 182. https://doi.org/10.3390/metabo15030182