Characterization and Discrimination of Marigold Oleoresin from Different Origins Based on UPLC-QTOF-MS Combined Molecular Networking and Multivariate Statistical Analysis
Abstract
1. Introduction
2. Materials and Methods
2.1. Samples and Chemical Reagents
2.2. The Preparation of Marigold Oleoresin
2.3. The Conditions of Chromatographic and Mass Spectrometry
2.4. Molecular Networking
2.5. Multivariate Statistical Analysis
3. Results and Discussion
3.1. Identifying Chemical Constituents in Marigold Oleoresins of Diverse Origins
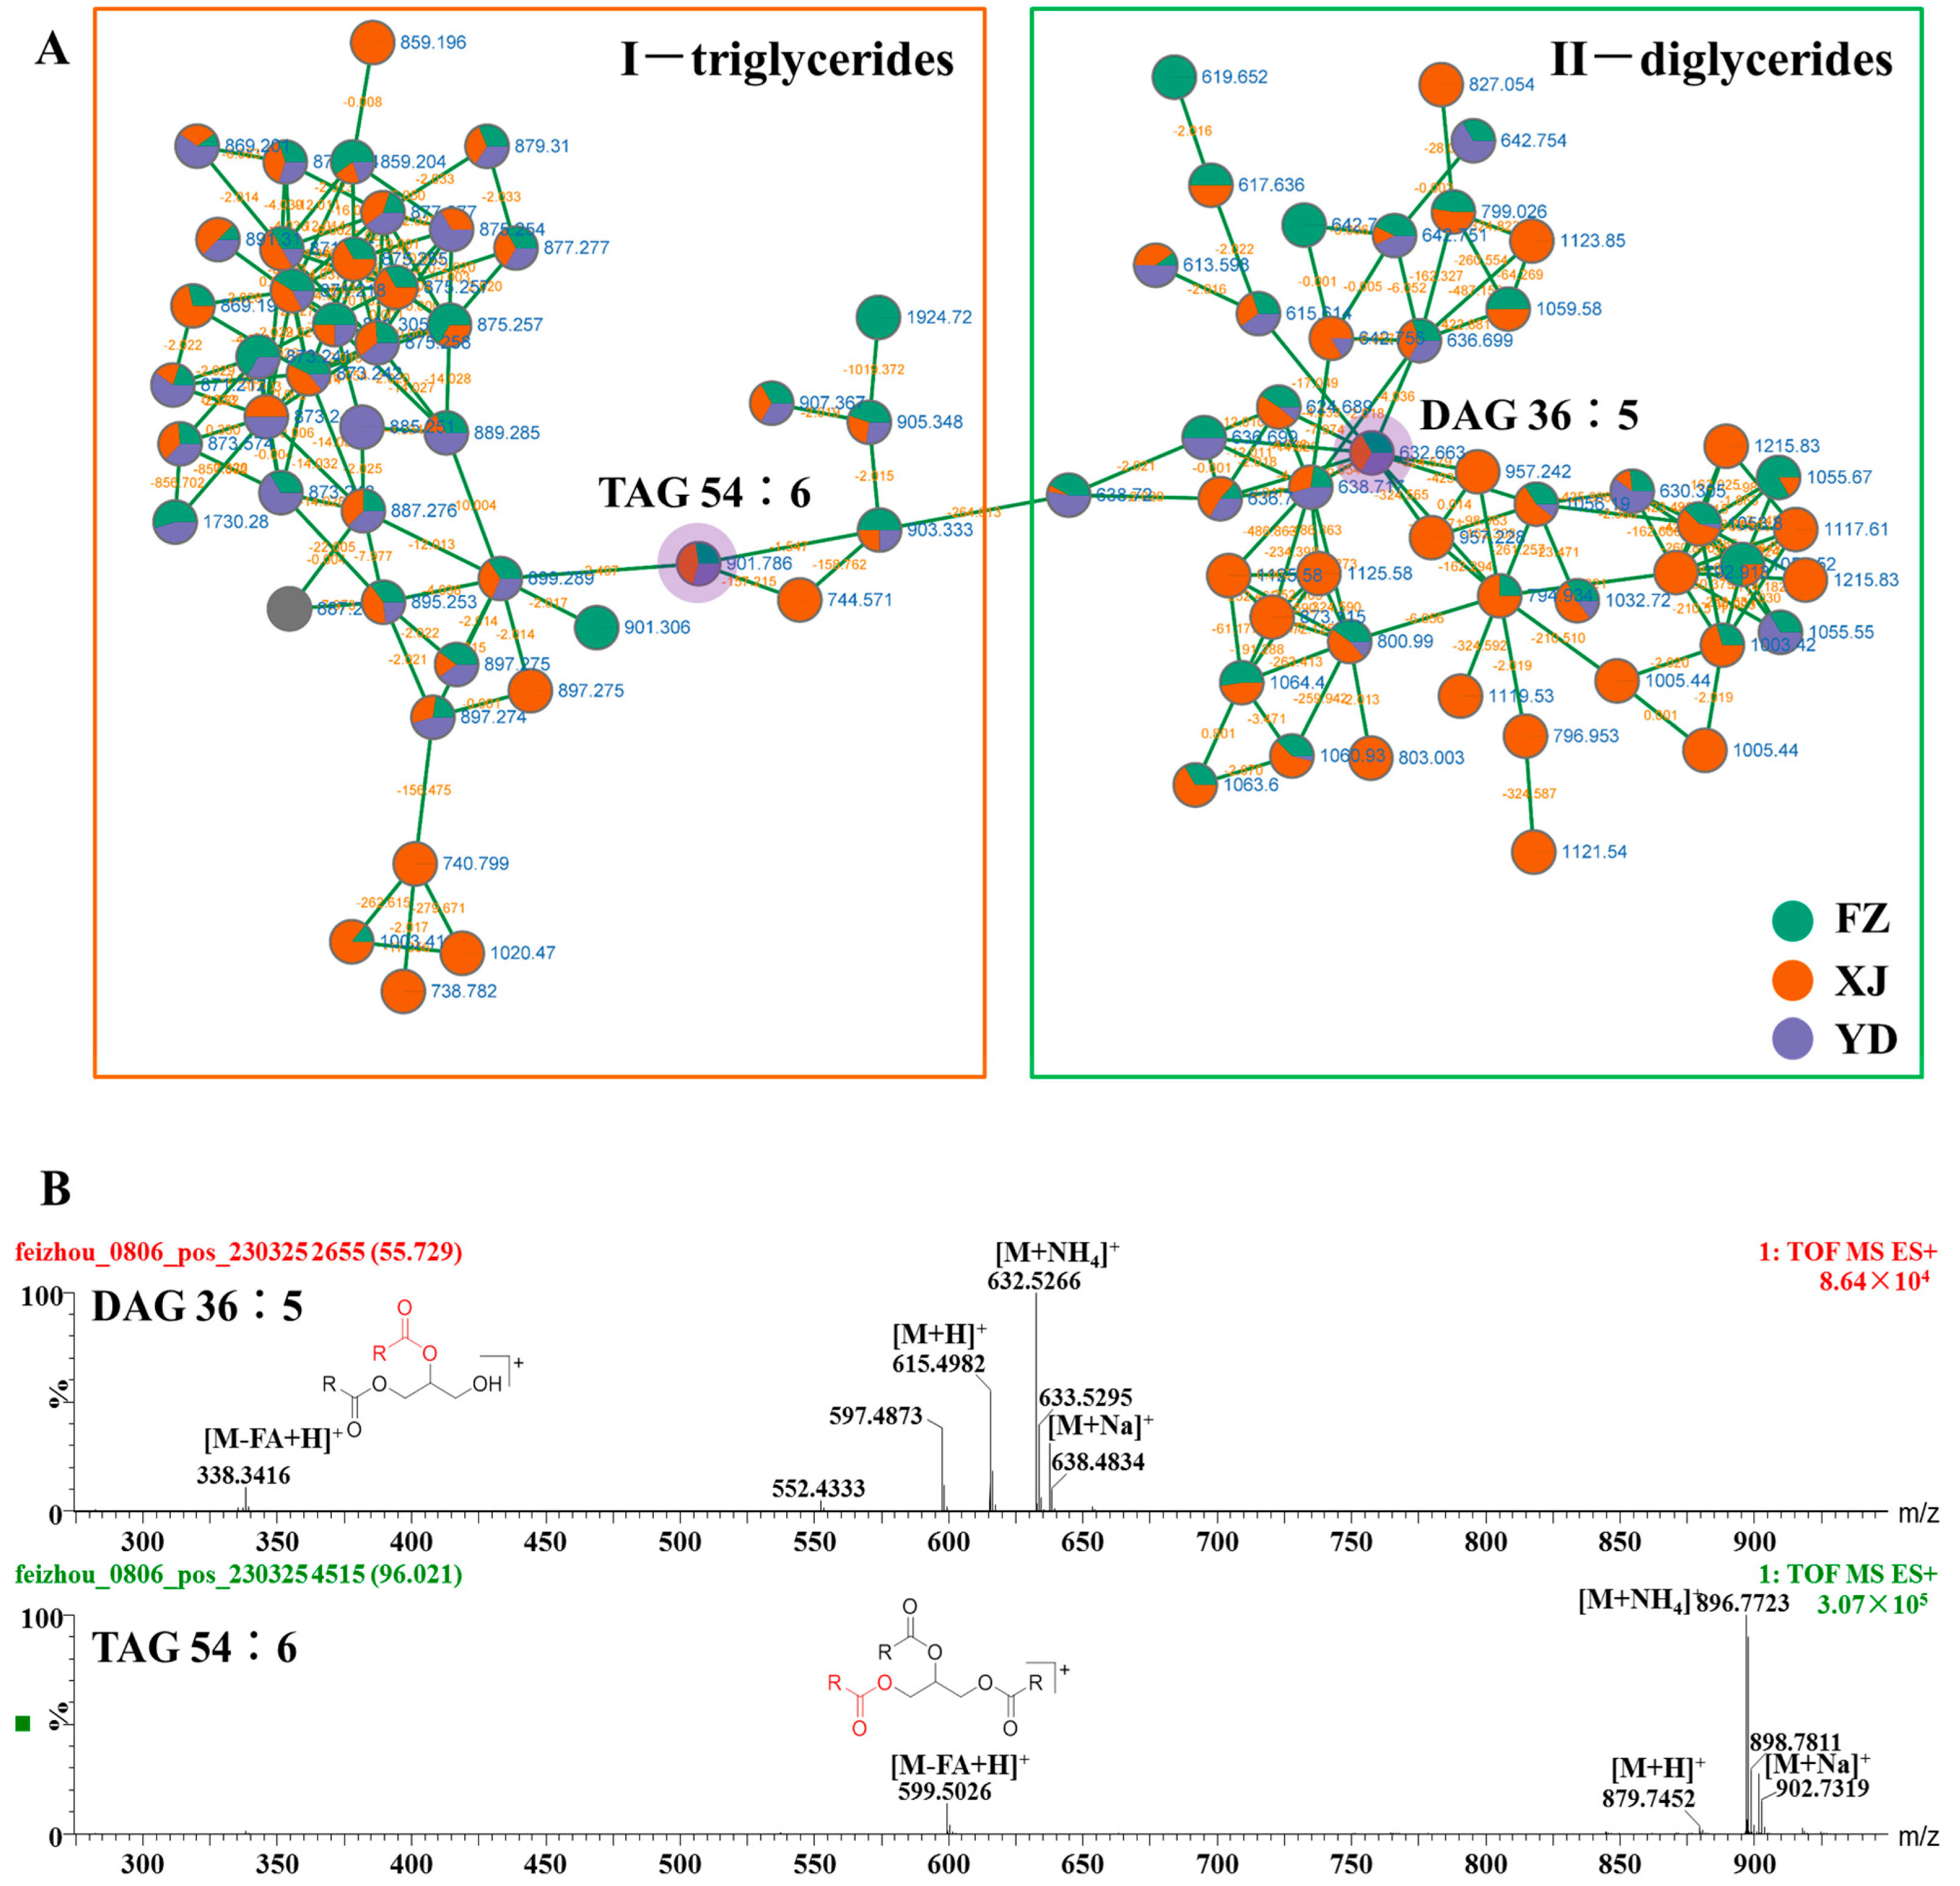
3.2. Identify Elucidation of Triglycerides and Diglycerides
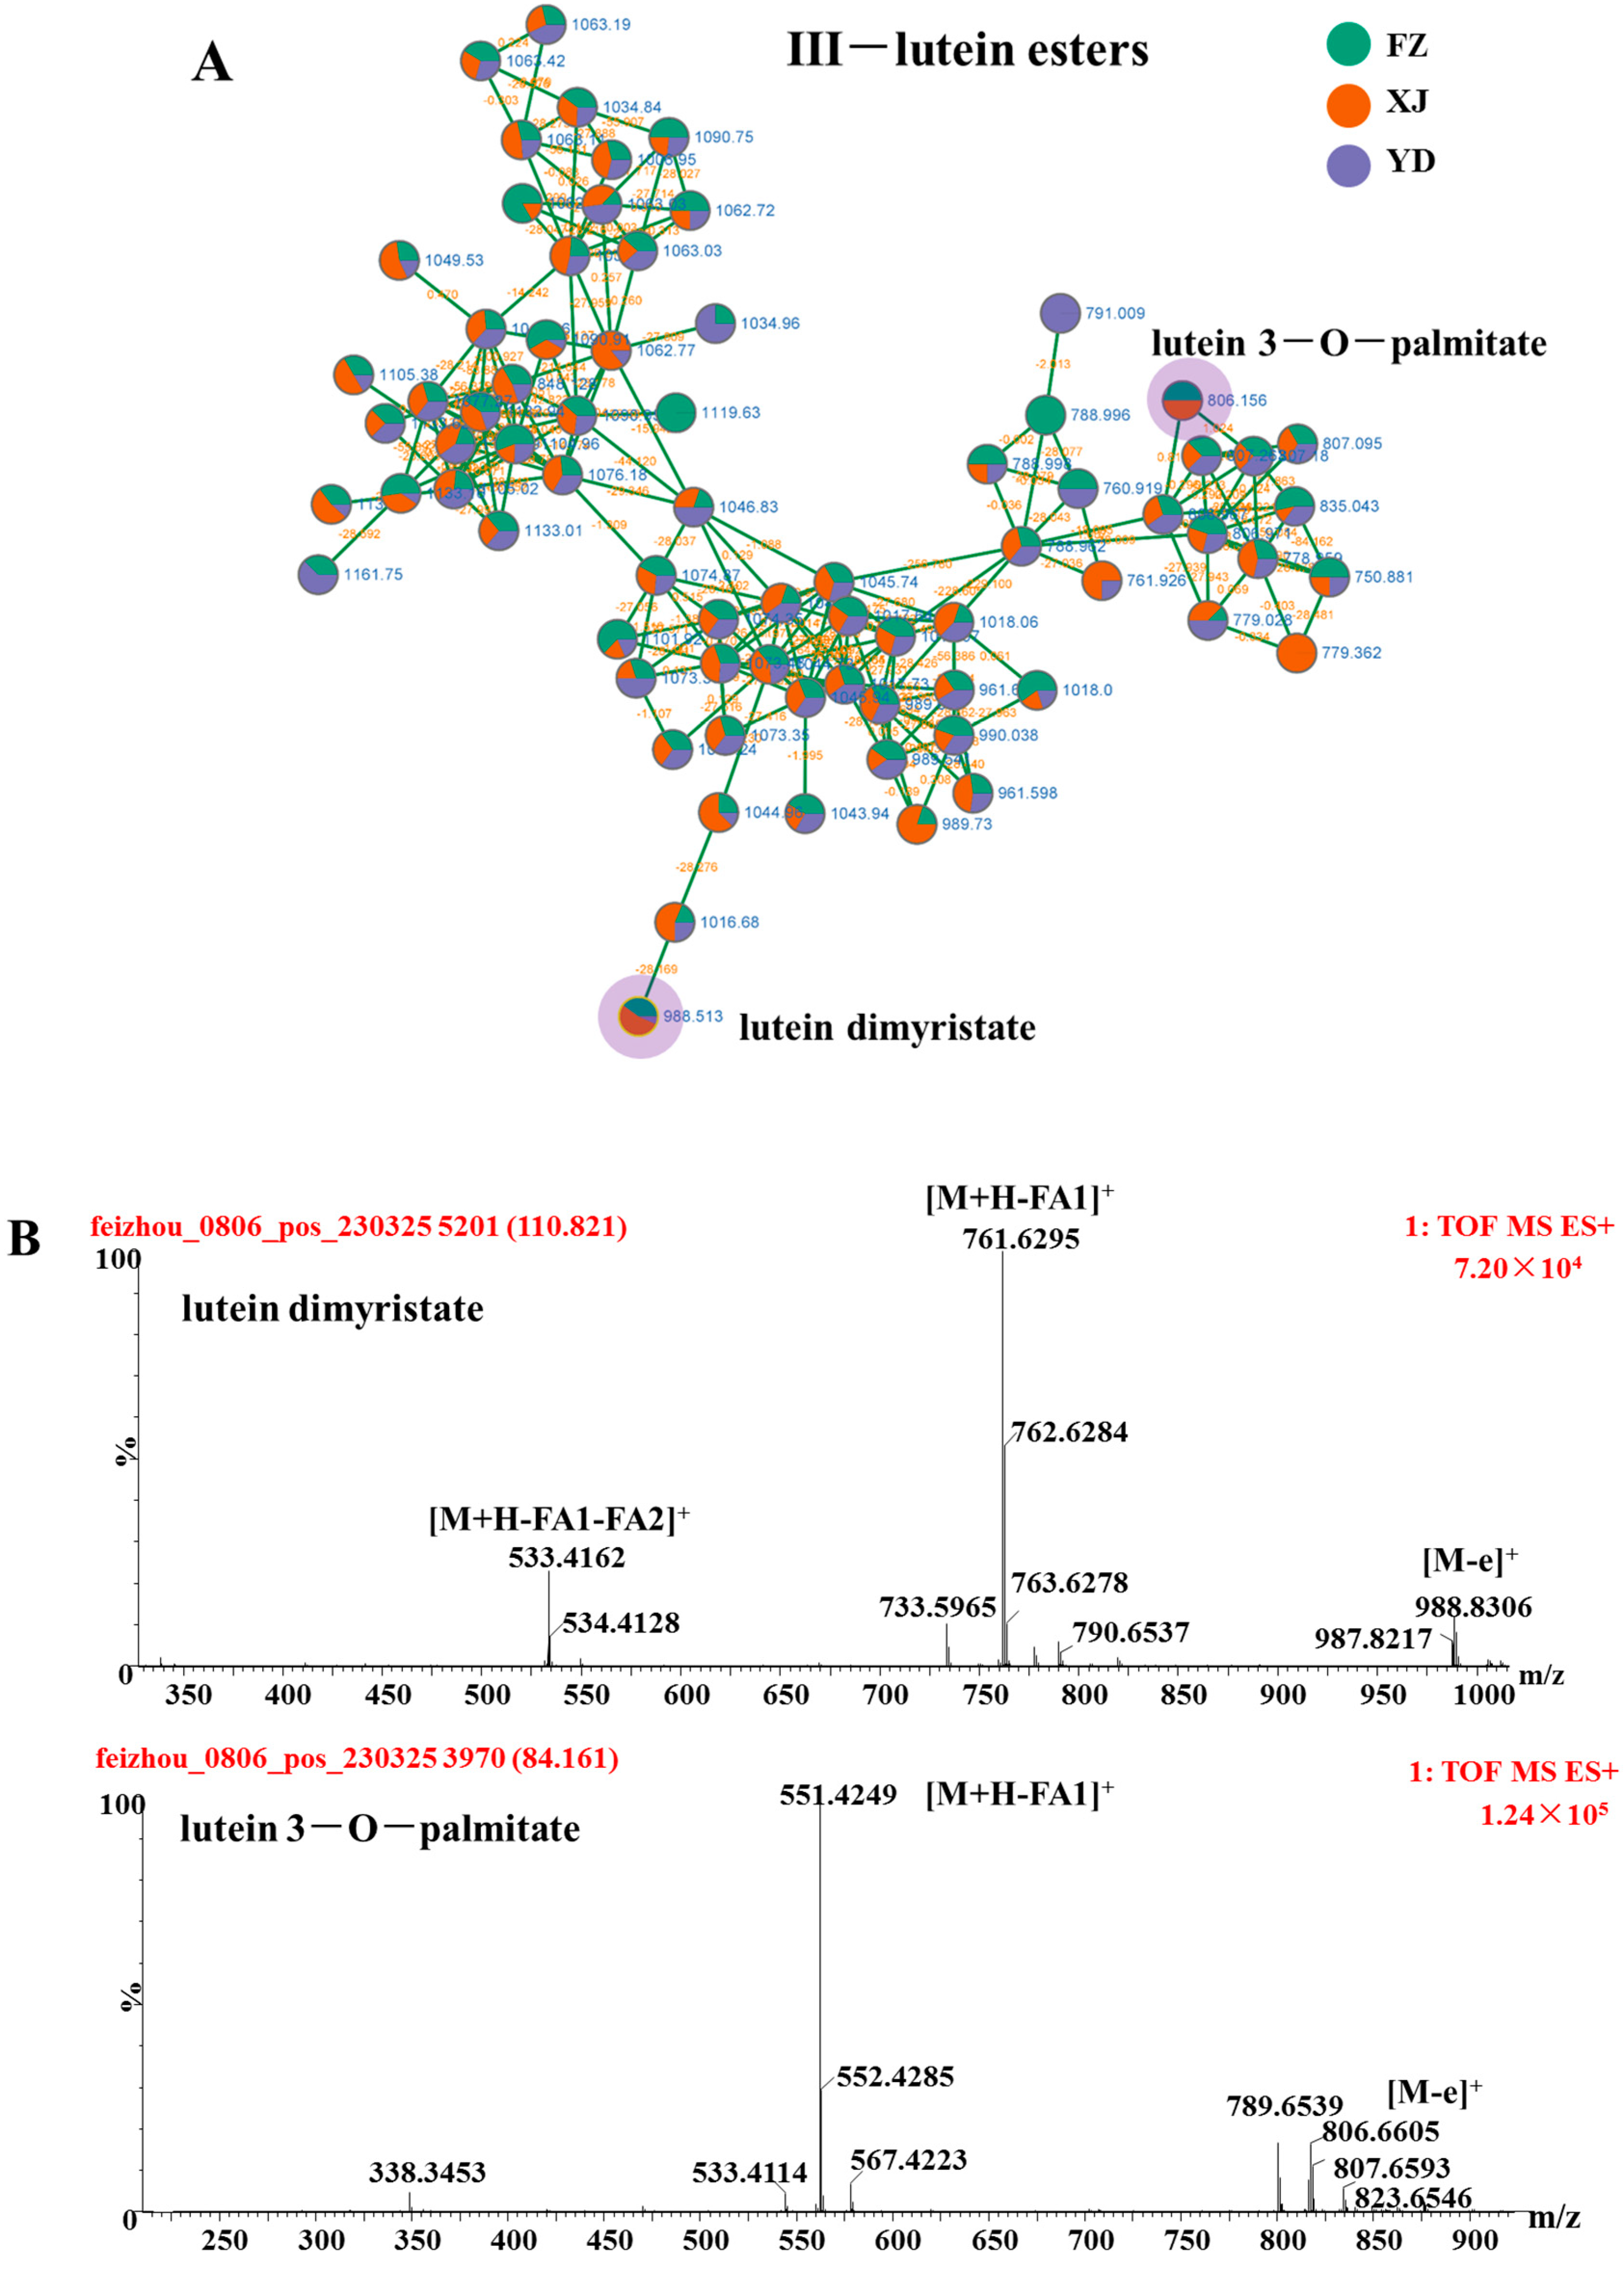
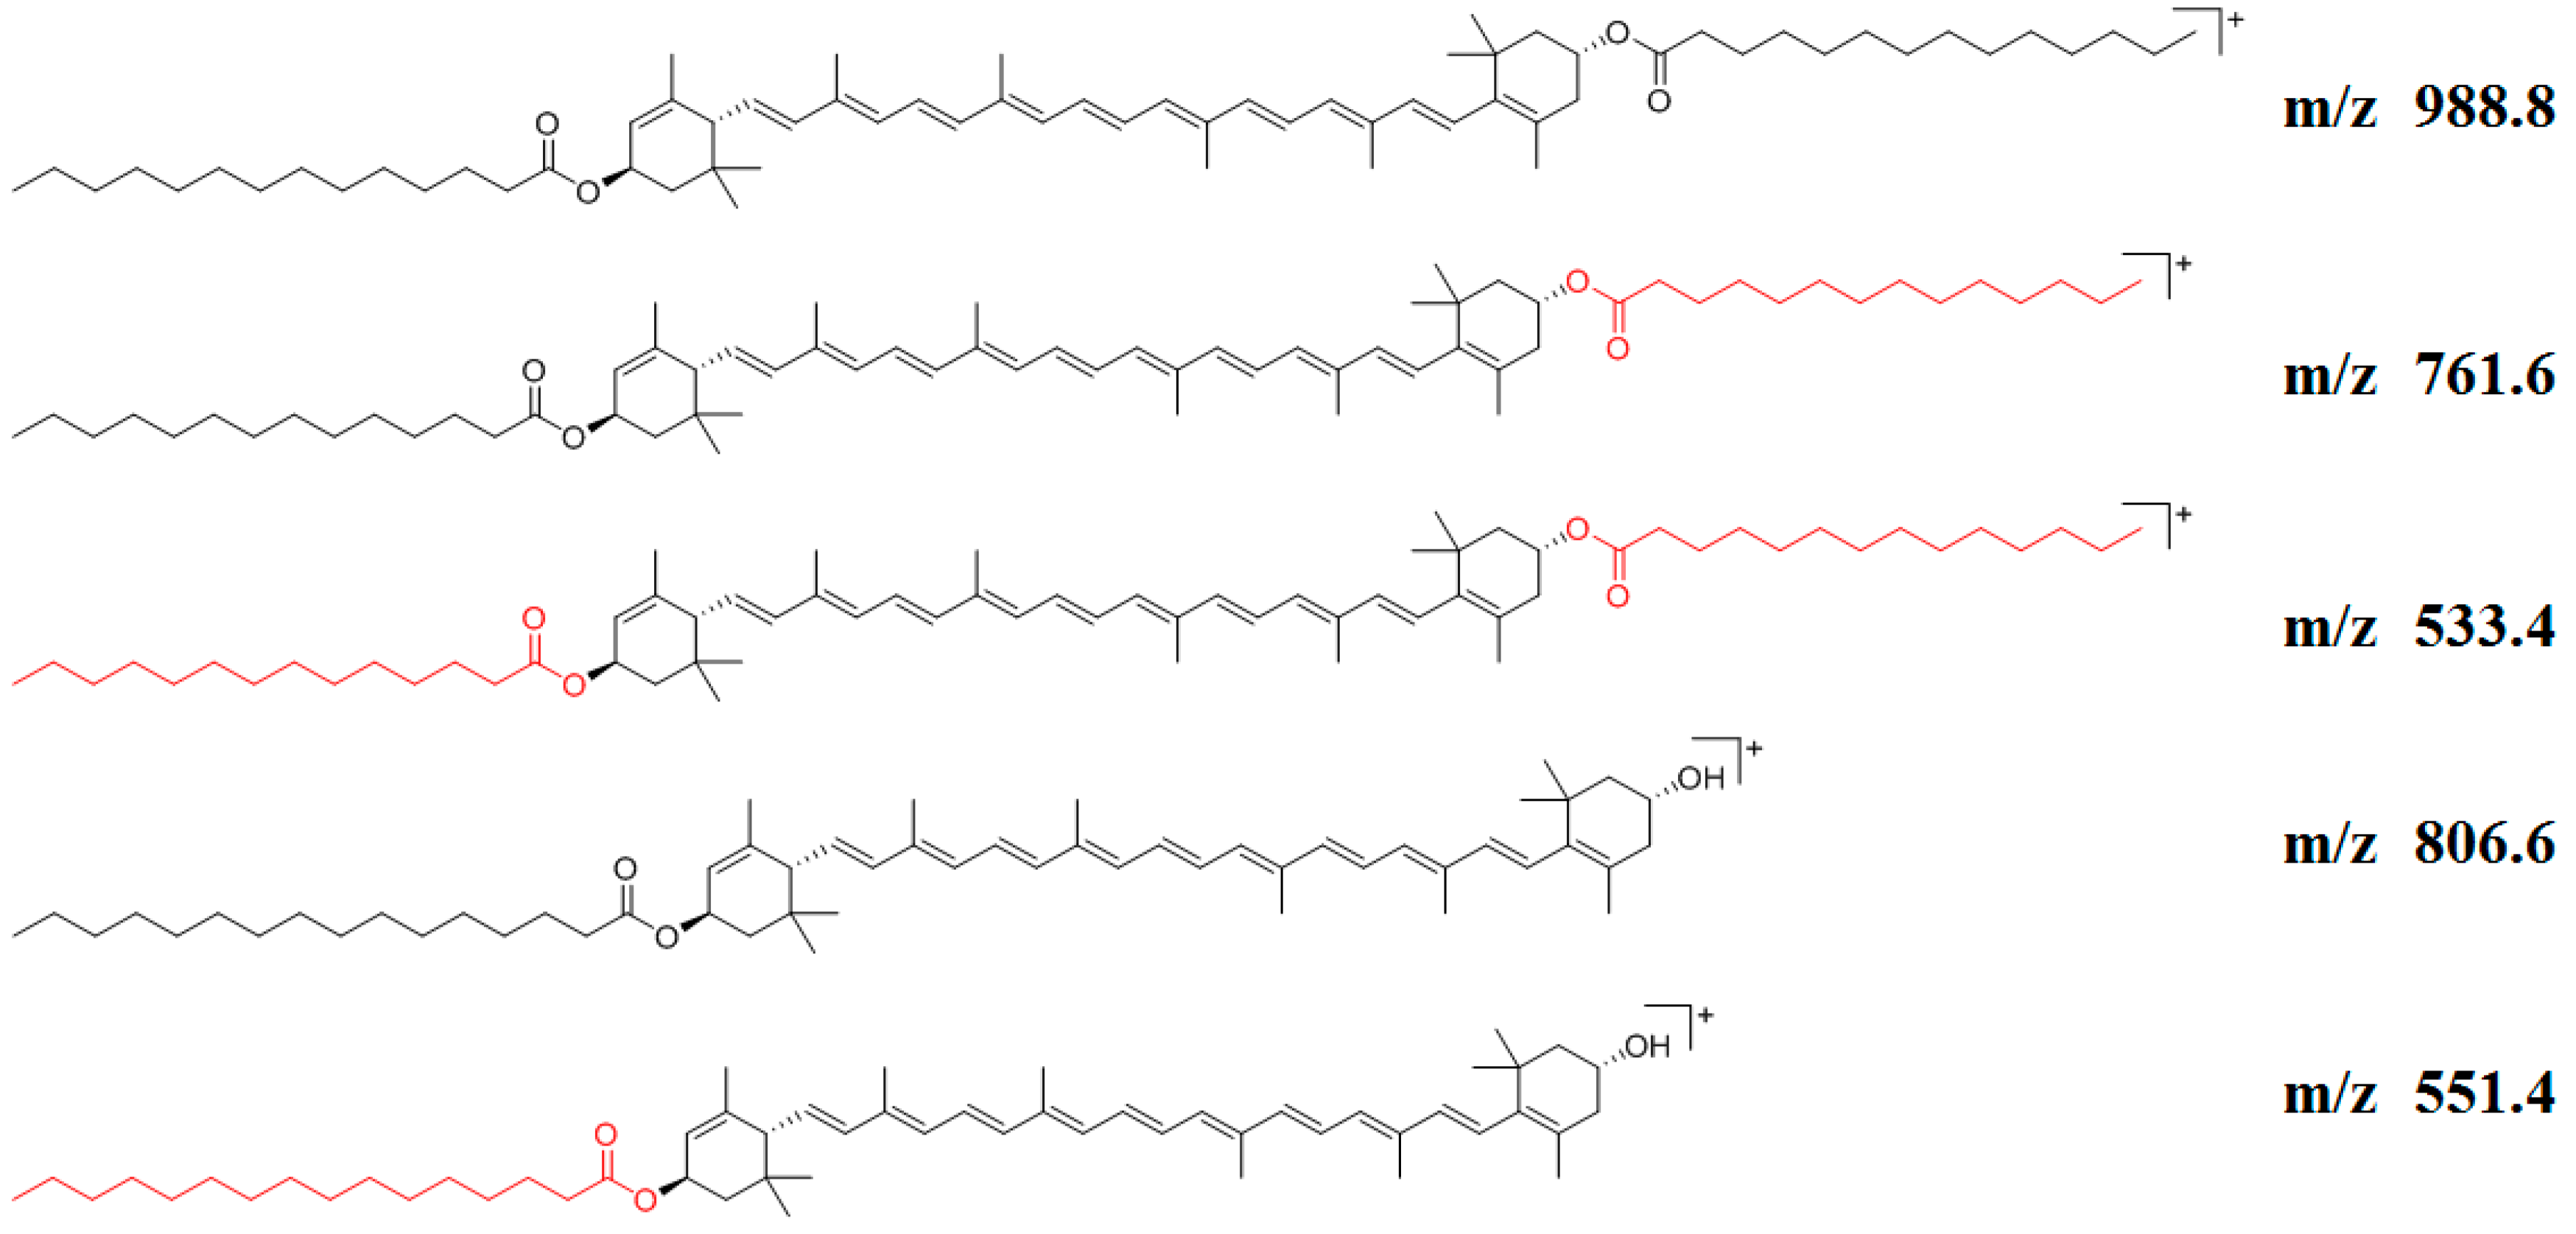
3.3. Identify Elucidation of Lutein Esters
3.4. Identify Elucidation of Other Compounds
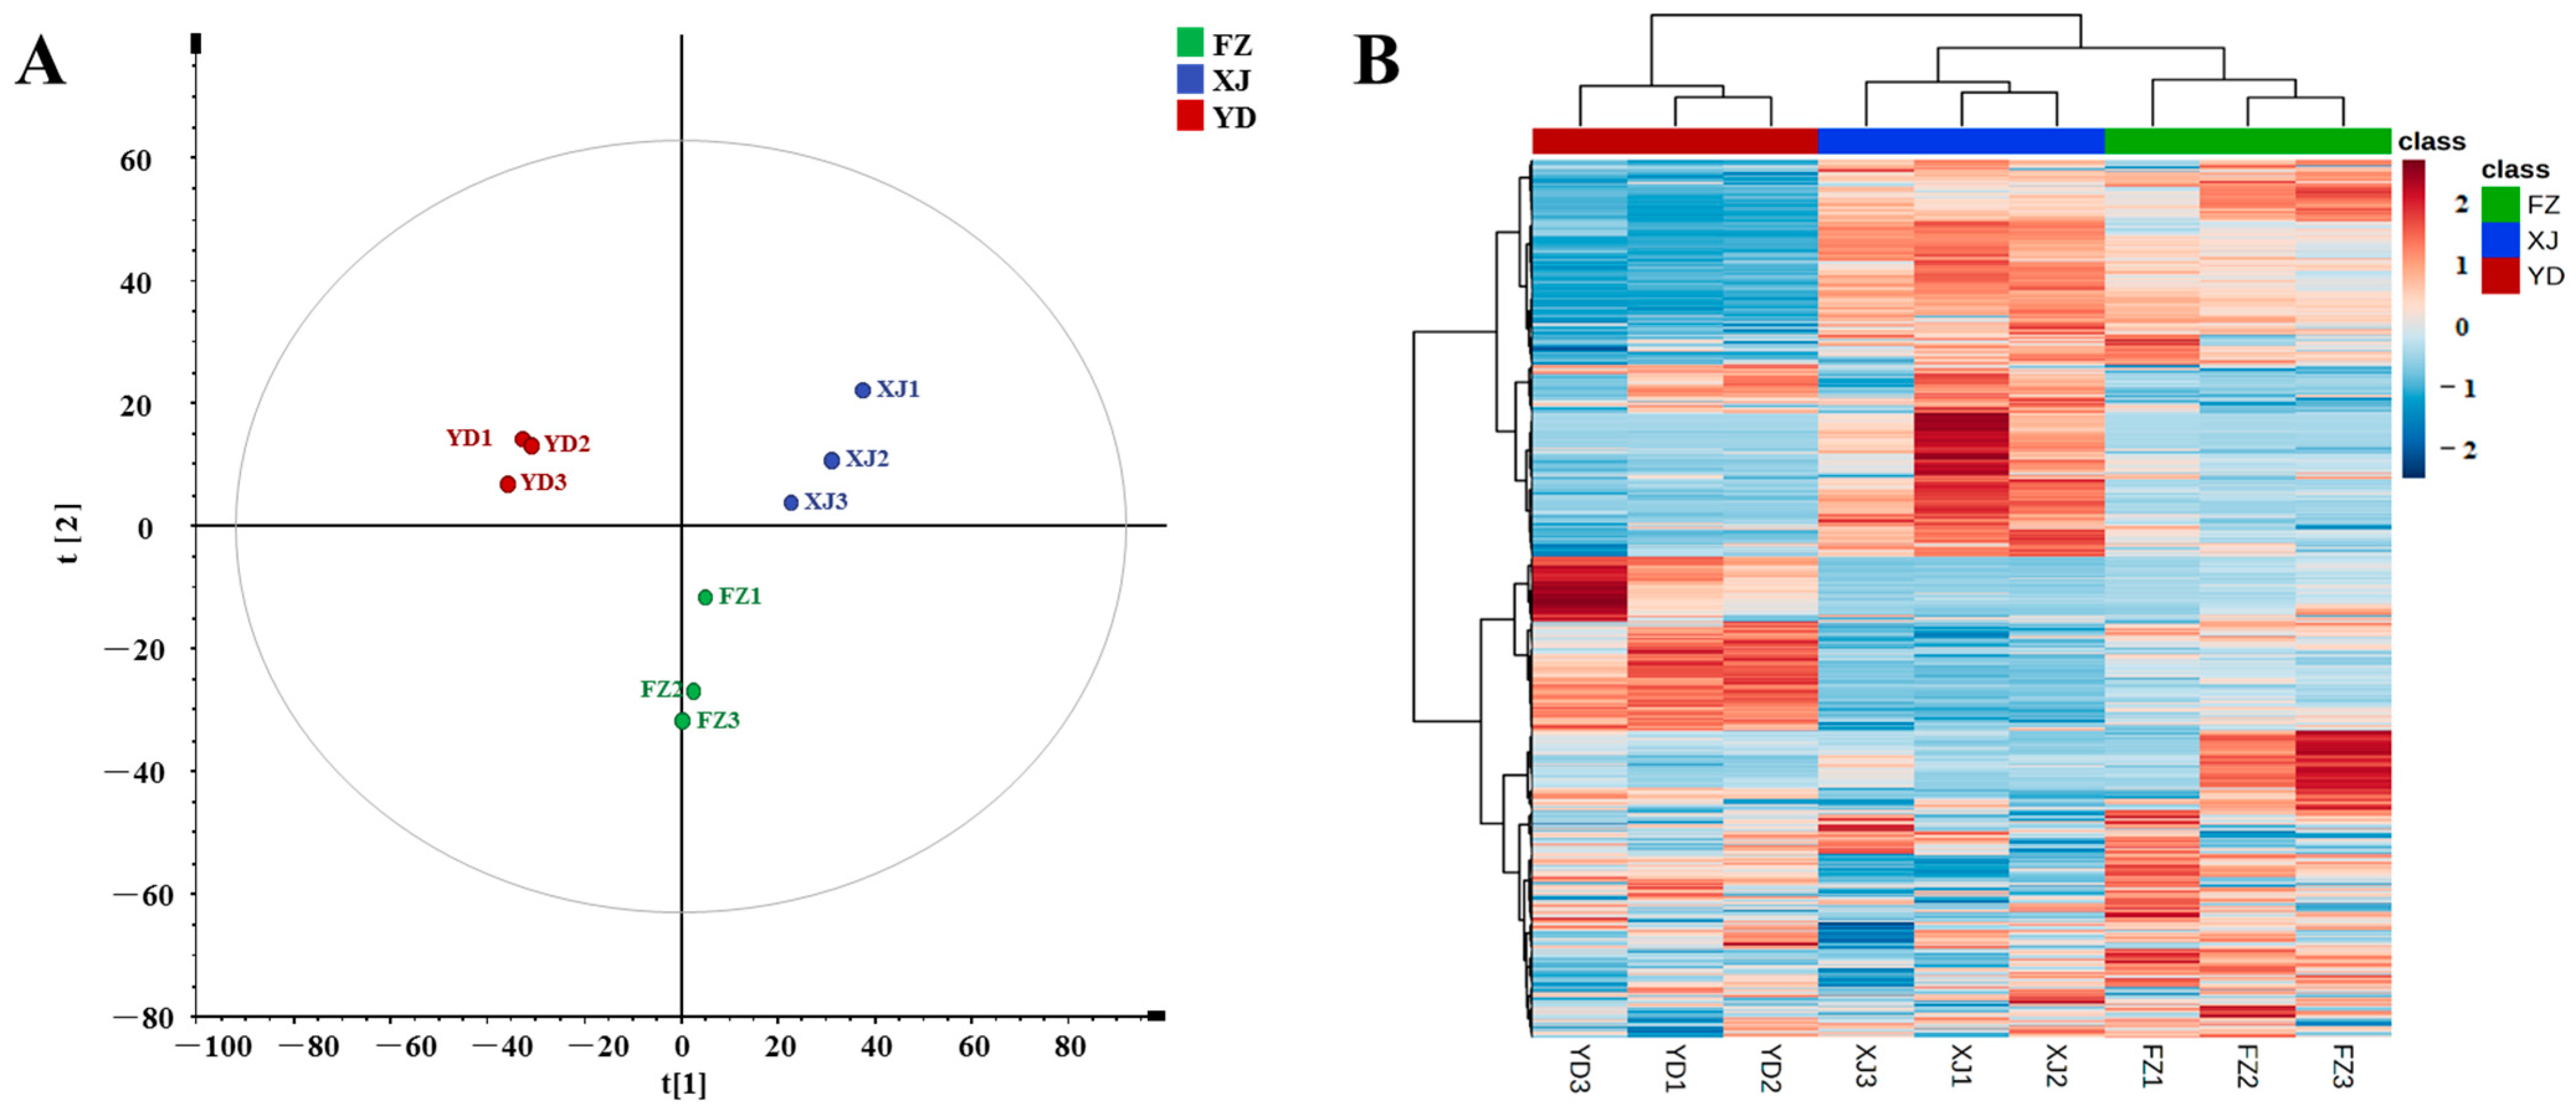
3.5. Differential Metabolomic Analysis of Marigold Oleoresin from Different Origins
PCA Analysis and Cluster Analysis
4. Conclusions
Author Contributions
Funding
Institutional Review Board Statement
Informed Consent Statement
Data Availability Statement
Conflicts of Interest
References
- Li, D.; Liu, C. Advances on extraction and analysis methods of lutein from marigold (Tagets erecta). Food Sci. 2005, 26, 582–586. [Google Scholar]
- Li, L.H.; Lee, J.C.-Y.; Leung, H.H.; Lam, W.C.; Fu, Z.; Lo, A.C.Y. Lutein supplementation for eye diseases. Nutrients 2020, 12, 1721. [Google Scholar] [CrossRef]
- Grčević, M.; Kralik, Z.; Kralik, G.; Galović, O. Effects of dietary marigold extract on lutein content, yolk color and fatty acid profile of omega-3 eggs. J. Sci. Food Agric. 2018, 99, 2292–2299. [Google Scholar] [CrossRef] [PubMed]
- Zhang, L.; Shen, H.; Xu, J.; Xu, J.; Li, Z.-L.; Wu, J.; Zou, Y.-T.; Liu, L.; Li, S.-L. UPLC-QTOF-MS/MS-guided isolation and purification of sulfur-containing derivatives from sulfur-fumigated edible herbs, a case study on ginseng. Food Chem. 2018, 246, 202–210. [Google Scholar] [CrossRef]
- Kim, M.-S.; Nam, M.; Hwang, G.-S. Metabolic alterations in two cirsium species identified at distinct phenological stages using UPLC-QTOF/MS. Phytochem. Anal. 2017, 29, 77–86. [Google Scholar] [CrossRef]
- Elshamy, A.I.; Farrag, A.R.H.; Ayoub, I.M.; Mahdy, K.A.; Taher, R.F.; Gendy, A.E.-N.G.E.; Mohamed, T.A.; Al-Rejaie, S.S.; EI-Amier, Y.A.; Abd-EIGawad, A.M.; et al. UPLC-qTOF-MS phytochemical profile and antiulcer potential of Cyperus conglomeratus rottb. alcoholic extract. Molecules 2020, 25, 4234. [Google Scholar] [CrossRef]
- Lyu, Q.; Kuo, T.-H.; Sun, C.; Chen, K.; Hsu, C.-C.; Li, X. Comprehensive structural characterization of phenolics in litchi pulp using tandem mass spectral molecular networking. Food Chem. 2019, 282, 9–17. [Google Scholar] [CrossRef] [PubMed]
- Kang, K.B.; Park, E.C.; Henrique, R.; Kim, H.J.; Dorrestein, P.C.; Sung, S.H. Targeted isolation of neuroprotective dicoumaroyl neolignans and lignans from Sageretia theezans using in silico molecular network annotation propagation-based dereplication. J. Nat. Prod. 2018, 81, 1819–1828. [Google Scholar] [CrossRef] [PubMed]
- Song, K.; Lee, S.-C.; Lee, M.G.; Lee, S.-G.; Ha, I.H. Molecular network-guided alkaloid profiling of aerial parts of Papaver nudicaule L. using LC-HRMS. Molecules 2020, 25, 2636. [Google Scholar] [CrossRef]
- Zhang, S.; Li, C.; Gu, W.; Qiu, R.; Chao, J.; Pei, L.; Ma, L.; Guo, Y.; Tian, R. Metabolomics analysis of dandelions from different geographical regions in China. Phytochem. Anal. 2021, 32, 899–906. [Google Scholar] [CrossRef]
- Yan, Y.; Zhang, Q.; Feng, F. HPLC-TOF-MS and HPLC-MS/MS combined with multivariate analysis for the characterization and discrimination of phenolic profiles in nonfumigated and sulfur-fumigated rhubarb. J. Sep. Sci. 2016, 39, 2667–2677. [Google Scholar] [CrossRef]
- Li, S.-L.; Song, J.-Z.; Qiao, C.-F.; Zhou, Y.; Qian, K.; Lee, K.H.; Xu, H.-X. A novel strategy to rapidly explore potential chemical markers for the discrimination between raw and processed Radix Rehmanniae by UHPLC-TOFMS with multivariate statistical analysis. J. Pharm. Biomed. Anal. 2010, 51, 812–823. [Google Scholar] [CrossRef]
- Jiao, Y.; Si, Y.; Li, L.; Wang, C.; Lin, H.; Liu, J.-L.; Liu, Y.; Liu, J.; Li, P.; Li, Z. Comprehensive phytochemical profiling of American ginseng in Jilin province of China based on ultrahigh-performance liquid chromatography quadrupole time-of-flight mass spectrometry. J. Mass Spectrom. 2021, 56, e4787. [Google Scholar] [CrossRef]
- Zhang, Y.; Lei, H.; Tao, J.; Yuan, W.; Zhang, W.; Ye, J. An integrated approach for structural characterization of Gui Ling Ji by traveling wave ion mobility mass spectrometry and molecular network. RSC Adv. 2021, 11, 15546–15556. [Google Scholar] [CrossRef]
- Carriot, N.; Paix, B.; Greff, S.; Viguier, B.; Briand, J.-F.; Culioli, G. Integration of LC/MS-based molecular networking and classical phytochemical approach allows in-depth annotation of the metabolome of non-model organisms—The case study of the brown seaweed Taonia atomaria. Talanta 2021, 225, 121925. [Google Scholar] [CrossRef]
- Zhan, Z.-L.; Deng, A.; Kang, L.-P.; Tang, J.; Nan, T.-G.; Chen, T.; He, Y.; Guo, L.-P.; Huang, L. Chemical profiling in Moutan Cortex after sulfuring and desulfuring processes reveals further insights into the quality control of TCMs by nontargeted metabolomic analysis. J. Pharm. Biomed. Anal. 2018, 156, 340–348. [Google Scholar] [CrossRef]
- Zhang, Y.; Wang, B.; Zhao, P.; He, F.; Xiao, W.; Zhu, J.; Ding, Y. A comprehensive evaluation protocol for sulfur fumigation of ginseng using UPLC-Q-TOF-MS/MS and multivariate statistical analysis. LWT 2021, 145, 111293. [Google Scholar] [CrossRef]
- Lei, H.; Zhang, Y.; Ye, J.; Cheng, T.; Liang, Y.; Zu, X.; Zhang, W. A comprehensive quality evaluation of Fuzi and its processed product through integration of UPLC-QTOF/MS combined MS/MS-based mass spectral molecular networking with multivariate statistical analysis and HPLC-MS/MS. J. Ethnopharmacol. 2021, 266, 113455. [Google Scholar] [CrossRef]
- Hu, Q.; Zhang, J.; Han, J.; Xing, R.; Liu, H.; Chen, Y. Comparative analysis of the glyceride compositions of pressed and extracted camellia seed oil using ultra-high performance liquid chromatography coupled with quadrupole time-of-flight mass spectrometry. Food Sci. 2021, 42, 235. [Google Scholar] [CrossRef]
- Gómez-Ariza, J.L.; Arias-Borrego, A.; García-Barrera, T. Use of flow injection atmospheric pressure photoionization quadrupole time-of-flight mass spectrometry for fast olive oil fingerprinting. Rapid Commun. Mass Spectrom. 2006, 20, 1181–1186. [Google Scholar] [CrossRef] [PubMed]
- Ramel, F.; Birtic, S.; Cuiné, S.; Triantaphylidès, C.; Ravanat, J.-L.; Havaux, M. Chemical quenching of singlet oxygen by carotenoids in plants. Plant Physiol. 2012, 158, 1267–1278. [Google Scholar] [CrossRef] [PubMed]
- Breithaupt, D.E.; Wirt, U.; Bamedi, A. Differentiation between lutein monoester regioisomers and detection of lutein diesters from marigold flowers (Tagetes erecta L.) and several fruits by liquid chromatography-mass spectrometry. J. Agric. Food Chem. 2002, 50, 66–70. [Google Scholar] [CrossRef] [PubMed]
- Mellado-Ortega, E.; Hornero-Méndez, D. Isolation and identification of lutein esters, including their regioisomers, in tritordeum (×Tritordeum Ascherson et Graebner) grains: Evidence for a preferential xanthophyll acyltransferase activity. Food Chem. 2012, 135, 1344–1352. [Google Scholar] [CrossRef]
- Li, W.; Gao, Y.; Zhao, J.; Wang, Q. Phenolic, flavonoid, and lutein ester content and antioxidant activity of 11 cultivars of chinese marigold. J. Agric. Food Chem. 2007, 55, 8478–8484. [Google Scholar] [CrossRef]
- Tsao, R.; Yang, R.; Young, J.C.; Zhu, H.; Manolis, T. Separation of geometric isomers of native lutein diesters in marigold (Tagetes erecta L.) by high-performance liquid chromatography–mass spectrometry. J. Chromatogr. A 2004, 1045, 65–70. [Google Scholar] [CrossRef]
- Soares, D.; Radler, F.A.; Sarsfield, A.; Ferreira, C.; Simoneit, B.R.T.; Elias, V.O. Determinação de compostos de massa molecular alta em folhas de plantas da Amazônia. Artig. Quím 2003, 26, 633–640. [Google Scholar] [CrossRef][Green Version]
- Nagy, K.; Courtet-Compondu, M.-C.; Holst, B.; Kussmann, M. Comprehensive analysis of vitamin E constituents in human plasma by liquid chromatography-mass spectrometry. Anal. Chem. 2007, 79, 7087–7096. [Google Scholar] [CrossRef]
- Kosyakov, D.S.; Ul’yanovskii, N.V.; Falev, D.I. Determination of triterpenoids from birch bark by liquid chromatography-tandem mass spectrometry. J. Anal. Chem. 2014, 69, 1264–1269. [Google Scholar] [CrossRef]
- Elias, V.O.; Simoneit, B.R.T.; Pereira, A.S.; Cabral, J.A.; Cardoso, J.N. Detection of high molecular weight organic tracers in vegetation smoke samples by high-temperature gas chromatography-mass spectrometry. Environ. Sci. Technol. 1999, 33, 2369–2376. [Google Scholar] [CrossRef]
- Frankenberger, L.; Mora, T.D.; de Siqueira, C.D.; Filippin-Monteiro, F.B.; de Moraes, M.H.; Biavatti, M.W.; Steindel, M.; Sandjo, L.P. UPLC-ESI-QTOF-MS2 characterisation of Cola nitida resin fractions with inhibitory effects on NO and TNF-α released by LPS-activated J774 macrophage and on Trypanosoma cruzi and Leishmania amazonensis. Phytochem. Anal. 2018, 29, 577–589. [Google Scholar] [CrossRef]
- Morales, G.; McLaughlin, J.L. 3β3-o-palmityl longispinogenin from trichocereus chilensis. J. Nat. Prod. 1989, 52, 381–384. [Google Scholar] [CrossRef]
- Li, J.; Hua, J.; Zhou, Q.; Dong, C.; Wang, J.; Deng, Y.; Jiang, Y. Comprehensive lipidome-wide profiling reveals dynamic changes of tea lipids during manufacturing process of black tea. J. Agric. Food Chem. 2017, 65, 10131–10140. [Google Scholar] [CrossRef]
- Eerdunbayaer; Yun, X.; Tungalag, D. Separation of chemical constituents in marigold extract based on UPLC-Q-TOF-MS. Food Sci. Technol. 2019, 44, 266–271. [Google Scholar] [CrossRef]




| No. | Rt | Adduct Mode | Identification | Formula | MS | Error | MS/MS | Classification |
|---|---|---|---|---|---|---|---|---|
| 1 | 1.89 | [M+H]+ | Unknown 1 | 469.4150 | ||||
| 2 | 3.21 | [M+H]+ | Unknown 2 | 219.1035 | ||||
| 3 | 3.72 | [M+H]+ | Unknown 3 | 277.2181 | ||||
| 4 | 3.72 | [M+H]+ | Dehydrophytosphingosine | C18H37NO3 | 316.2857 | 1.6 | 298.2753; 280.2383; 262.2272 | Sphingoids |
| 5 | 3.74 | [M+H]+ | Phytosphingosine | C18H39NO3 | 318.2992 | −5.0 | 300.291; 256.2637 | Sphingoids |
| 6 | 11.26 | [M+H]+ | Unknown 4 | 384.3506 | ||||
| 7 | 13.88 | [M+Na]+ | Unknown 5 | 361.2690 | 321.2783; 261.2186 | |||
| 8 | 14.20 | [M+H]+ | Erythrodiol/Uvaol | C30H50O3 | 443.3912 | 5.2 | 425.3768; 407.3655; 235.2063; 217.1955; 203.1786; 191.1808 | Triterpenes |
| 9 | 15.18 | [M+H]+ | Unknown 6 | 593.2728 | ||||
| 10 | 17.17 | [M+H]+ | Unknown 7 | 323.2970 | ||||
| 11 | 18.17 | [M+H]+ | Unknown 8 | 379.2860 | ||||
| 12 | 18.48 | [M+H]+ | α-Amyrin/β-Amyrin | C30H50O | 427.3934 | −1.4 | 409.3831; 271.2409; 217.1966; 191.1809; 149.1318; 135.1171 | Triterpenes |
| 13 | 26.70 | [M+H]+ | 1α,25-dihydroxy-19-nor-22-oxacholecalciferol | C25H42O4 | 407.3151 | −2.5 | 179.1062 | Steroid |
| 14 | 27.80 | [M+H]+ | Unknown 9 | 351.2918 | ||||
| 15 | 30.42 | [M+H]+ | Unknown 10 | 321.2783 | ||||
| 16 | 35.50 | [M+H]+ | 1α,25-dihydroxy-2β-hydroxymethyl-19-norvitamin D3 | C25H46O4 | 435.3490 | 4.1 | 179.1062 | Steroid |
| 17 | 36.38 | [M+H]+ | Unknown 11 | 323.2928 | ||||
| 18 | 43.68 | [M+H]+ | 19-nor-2-(3-hydroxypropyl)-1,25-dihydroxyvitamin D3 | C29H50O4 | 463.3810 | 3.9 | 179.1062 | Steroid |
| 19 | 46.42 | [M+Na]+ | MGDG 36:6 | C45H74O10 | 797.5176 | −0.5 | 613.4835; 519.2935; 335.2567 | Monogalactosyldiacylgylcerols |
| 20 | 49.27 | [M+Na]+ | MGDG 36:5 | C45H76O10 | 799.5338 | 0.3 | 615.5005; 597.4919; 337.2736 | Monogalactosyldiacylgylcerols |
| 21 | 49.30 | [M-e]+ | β-Tocopherol/ϒ-Tocopherol | C28H48O2 | 416.3636 | −2.6 | 205.1214; 165.0912 | Vitamin E |
| 22 | 51.62 | [M+Na]+ | DAG 36:6 | C39H64O5 | 635.4658 | 1.1 | 630.5075 | Diglycerides |
| 23 | 51.98 | [M-e]+ | α-Tocopherol | C29H50O2 | 430.3791 | 5.3 | 205.1243; 165.0912 | Vitamin E |
| 24 | 55.10 | [M+Na]+ | MGDG 36:4 | C45H78O10 | 801.5525 | −3.2 | 617.5208; 599.5074; 337.2774 | Monogalactosyldiacylgylcerols |
| 25 | 55.76 | [M+Na]+ | DAG 36:5 | C39H66O5 | 637.4824 | 2.5 | 632.5266 | Diglycerides |
| 26 | 60.18 | [M+Na]+ | MGDG 34:2 | C43H78O10 | 777.5471 | −2.8 | 575.5054; 521.3080; 337.2736 | Monogalactosyldiacylgylcerols |
| 27 | 60.31 | [M+Na]+ | DAG 36:4 | C39H68O5 | 639.4971 | 1.1 | 634.5436 | Diglycerides |
| 28 | 60.75 | [M+Na]+ | DAG 36:4 | C39H68O5 | 639.4971 | 1.1 | 634.5436 | Diglycerides |
| 29 | 60.82 | [M+Na]+ | DAG 34:3 | C37H66O5 | 613.4835 | 4.4 | 608.5262 | Diglycerides |
| 30 | 61.31 | [M+Na]+ | DAG 34:3 | C37H66O5 | 613.4835 | 4.4 | 608.526 | Diglycerides |
| 31 | 61.52 | [M+Na]+ | Primulagenin A-3-O-myristate | C44H76O4 | 691.5630 | −1.6 | 651.5735; 423.3634; 405.3535 | Triterpenes |
| 32 | 62.03 | [M+Na]+ | MGDG 36:3 | C45H80O10 | 803.5680 | 3.9 | 601.5214; 519.2935; 341.3067 | Monogalactosyldiacylgylcerols |
| 33 | 65.84 | [M+Na]+ | DAG 34:2 | C37H68O5 | 615.4954 | −1.6 | 610.54 | Diglycerides |
| 34 | 66.02 | [M+Na]+ | DAG 34:2 | C37H68O5 | 615.4954 | −1.6 | 610.54 | Diglycerides |
| 35 | 66.46 | [M+Na]+ | DAG 34:2 | C37H68O5 | 615.4954 | −1.6 | 610.54 | Diglycerides |
| 36 | 67.12 | [M+Na]+ | MGDG 36:2 | C45H82O10 | 805.5860 | −0.5 | 603.5387; 521.3127; 341.3067 | Monogalactosyldiacylgylcerols |
| 37 | 68.20 | [M+Na]+ | DAG 36:3 | C39H70O5 | 641.5149 | 2.8 | 636.5588 | Diglycerides |
| 38 | 68.80 | [M+Na]+ | Primulagenin A-3-O-palmitate | C46H80O4 | 719.5989 | 4.9 | 679.6047; 423.3634; 405.3535 | Triterpenes |
| 39 | 72.02 | [M+H]+ | Erythrodiol-3-O-myristate | C44H76O3 | 653.5862 | −1.7 | 425.3764; 407.3687 | Triterpenes |
| 40 | 72.17 | [M-e]+ | Lutein 3-O-laurate | C52H78O3 | 750.5967 | 4.4 | 733.6458; 551.5039 | Lutein esters |
| 41 | 72.79 | [M+Na]+ | DAG 36:2 | C39H72O5 | 643.5256 | −3.3 | 638.572 | Diglycerides |
| 42 | 73.11 | [M+H]+ | Unknown12 | 871.5735 | ||||
| 43 | 73.48 | [M+Na]+ | Cer(t18:1(8E)/22:0(2OH)) | C40H79NO5 | 676.5863 | 1 | 654.6037; 636.5949; 298.2756; 280.2632 | Ceramide |
| 44 | 73.50 | [M+Na]+ | DAG 36:2 | C39H72O5 | 643.5256 | −3.3 | 638.572 | Diglycerides |
| 45 | 74.41 | [M+NH4]+ | Unknown 13 | 1052.7786 | ||||
| 46 | 76.12 | [M+Na]+ | Primulagenin A-3-O-stearate | C48H84O4 | 747.6255 | −1.6 | 707.6334; 423.3634; 405.3535 | Triterpenes |
| 47 | 77.15 | [M+Na]+ | Cer(t18:1(8E)/23:0(2OH)) | C41H81NO5 | 690.6064 | −0.1 | 668.6174; 650.6085; 298.2756; 280.2632 | Ceramide |
| 48 | 77.71 | [M+H]+ | α-Amyrin-3-O-myristate/β-Amyrin-3-O-myristate | C44H76O2 | 637.5908 | −2.5 | 409.3849 | Triterpenes |
| 49 | 77.76 | [M+Na]+ | Cer(t18:1/22:0(2OH)) | C40H81NO5 | 678.6031 | 2.8 | 656.6243; 638.6133; 300.2916; 282.2792 | Ceramide |
| 50 | 78.35 | [M-e]+ | Lutein 3-O-myristate | C54H82O3 | 778.6249 | −1.9 | 761.6295; 551.4249 | Lutein esters |
| 51 | 78.62 | [M+Na]+ | DAG 36:1 | C39H74O5 | 645.5446 | 1.9 | 640.5873 | Diglycerides |
| 52 | 78.96 | [M+NH4]+ | Unknown 14 | 1054.7958 | ||||
| 53 | 79.37 | [M+H]+ | Erythrodiol-3-O-palmitate | C46H80O3 | 681.6185 | −0.1 | 425.3764; 407.3687 | Triterpenes |
| 54 | 80.66 | [M+Na]+ | Cer(t18:1(8E)/24:0(2OH)) | C42H83NO5 | 704.6184 | 2.1 | 682.6353; 664.6270; 298.2756; 280.2632 | Ceramide |
| 55 | 81.07 | [M+Na]+ | Cer(t18:1/23:0(2OH)) | C41H83NO5 | 692.6172 | 0.4 | 670.6330; 652.6281; 300.2916; 282.2792 | Ceramide |
| 56 | 83.54 | [M+Na]+ | TG 54:9 | C57H92O6 | 895.6830 | 4.2 | 890.7225 | Triglycerides |
| 57 | 83.96 | [M+Na]+ | Cer(t18:1(8E)/25:0(2OH)) | C43H84NO5 | 718.6340 | −5.4 | 696.6529; 678.6404; 298.2756; 280.2632 | Ceramide |
| 58 | 84.14 | [M-e]+ | Lutein 3-O-palmitate | C56H86O3 | 806.6540 | −4.6 | 789.6539; 551.4249 | Lutein esters |
| 59 | 84.58 | [M+Na]+ | Cer(t18:1/24:0(2OH)) | C42H85NO5 | 706.6385 | 0.8 | 684.6558; 666.6418; 300.2916; 282.2792 | Ceramide |
| 60 | 84.76 | [M+H]+ | α-Amyrin-3-O-palmitate/β-Amyrin-3-O-palmitate | C46H80O2 | 665.6235 | −0.3 | 409.3849 | Triterpenes |
| 61 | 85.43 | [M+NH4]+ | Unknown 15 | 856.7020 | ||||
| 62 | 86.28 | [M+H]+ | Erythrodiol-3-O-stearate | C48H84O3 | 709.6470 | 1.8 | 425.3764; 407.3687 | Triterpenes |
| 63 | 87.12 | [M+Na]+ | Cer(t18:1/25:0(2OH)) | C43H87NO5 | 720.6468 | −1.9 | 698.6671; 680.6604; 300.2916; 282.2792 | Ceramide |
| 64 | 87.32 | [M+Na]+ | Cer(t18:1(8E)/26:0(2OH)) | C44H87NO5 | 732.6494 | 1.6 | 710.6713; 692.6602; 298.2756; 280.2632 | Ceramide |
| 65 | 87.87 | [M+Na]+ | TG 54:8 | C57H94O6 | 897.6968 | 2.2 | 892.7369 | Triglycerides |
| 66 | 88.23 | [M+H]+ | β-Tocopherol dodecanoate | C40H70O3 | 599.5376 | −0.5 | 417.3743 | Vitamin E esters |
| 67 | 89.56 | [M-e]+ | Lutein 3-O-stearate | C58H90O3 | 834.6907 | 2 | 817.6877; 551.4249 | Lutein esters |
| 68 | 91.18 | [M+H]+ | α-Amyrin-3-O-stearate/β-Amyrin-3-O-stearate | C48H84O2 | 693.6560 | 1.4 | 409.3849 | Triterpenes |
| 69 | 92.09 | [M+Na]+ | TG 54:7 | C57H96O6 | 899.7128 | 2.6 | 894.7534 | Triglycerides |
| 70 | 92.92 | [M+Na]+ | TG 52:6 | C55H94O6 | 873.6989 | −2.2 | 868.7396 | Triglycerides |
| 71 | 94.03 | [M+Na]+ | Cer(t18:1/26:0(2OH)) | C44H89NO5 | 734.6650 | −5.9 | 712.6837; 694.6740; 300.2916; 282.2792 | Ceramide |
| 72 | 94.26 | [M+H]+ | β-Tocopherol myristate | C42H74O3 | 627.5754 | 6.1 | 417.3743 | Vitamin E esters |
| 73 | 96.10 | [M+Na]+ | TG 54:6 | C57H98O6 | 901.7271 | 1.1 | 896.7736 | Triglycerides |
| 74 | 96.99 | [M+Na]+ | TG 52:5 | C55H96O6 | 875.7120 | 1.7 | 870.7529 | Triglycerides |
| 75 | 97.76 | [M+Na]+ | TG 54:6 | C57H98O6 | 901.7271 | 1.1 | 896.7736 | Triglycerides |
| 76 | 99.78 | [M+H]+ | β-Tocopherol palmitate | C44H76O3 | 655.5997 | −4.9 | 417.3701 | Vitamin E esters |
| 77 | 100.43 | [M+Na]+ | TG 54:5 | C57H100O6 | 903.7418 | 0 | 898.7889 | Triglycerides |
| 78 | 100.77 | [M+Na]+ | TG 52:4 | C55H98O6 | 877.7259 | −0.2 | 872.7724 | Triglycerides |
| 79 | 101.50 | [M+Na]+ | TG 54:5 | C57H100O6 | 903.7418 | 0 | 898.7889 | Triglycerides |
| 80 | 101.71 | [M+Na]+ | TG 50:3 | C53H96O6 | 851.7140 | −2.9 | 846.7572 | Triglycerides |
| 81 | 103.95 | [M+Na]+ | Lutein dilaurate | C64H100O4 | 955.7567 | 5 | 932.7582; 733.5905; 533.4156 | Lutein esters |
| 82 | 104.66 | [M+H]+ | β-Tocopherol stearate | C46H78O3 | 683.6373 | 4.5 | 417.3659 | Vitamin E esters |
| 83 | 104.88 | [M+Na]+ | TG 52:3 | C55H100O6 | 879.7440 | 2.5 | 874.7908 | Triglycerides |
| 84 | 105.08 | [M+Na]+ | TG 54:4 | C57H102O6 | 905.7588 | 1.5 | 900.8004 | Triglycerides |
| 85 | 105.36 | [M+Na]+ | TG 50:2 | C53H98O6 | 853.7318 | 6.7 | 848.7751 | Triglycerides |
| 86 | 107.60 | [M+Na]+ | Lutein laurate-myristate | C66H104O4 | 983.7872 | 4.1 | 960.7942; 761.6221; 733.5905; 533.4156 | Lutein esters |
| 87 | 108.90 | [M+Na]+ | TG 54:3 | C57H104O6 | 907.7719 | −1.3 | 902.8202 | Triglycerides |
| 88 | 109.32 | [M+Na]+ | TG 52:2 | C55H102O6 | 881.7582 | 0.9 | 876.7994 | Triglycerides |
| 89 | 109.34 | [M+Na]+ | TG 50:1 | C53H100O6 | 855.7460 | 4.9 | 850.7894 | Triglycerides |
| 90 | 111.33 | [M+Na]+ | Lutein dimyristate | C68H108O4 | 1011.8197 | 5.1 | 988.8144; 761.6277; 533.4156 | Lutein esters |
| 91 | 112.60 | [M+Na]+ | Lutein myristate-palmitate | C70H112O4 | 1039.8439 | −1.8 | 1016.8593; 789.6564; 761.6221; 533.4156 | Lutein esters |
| 92 | 112.91 | [M+Na]+ | TG 54:2 | C57H106O6 | 909.7933 | −1.8 | 904.8361 | Triglycerides |
| 93 | 112.99 | [M+Na]+ | TG 52:1 | C55H104O6 | 883.7748 | 1.9 | 878.8225 | Triglycerides |
| 94 | 116.31 | [M+Na]+ | TG 54:1 | C57H108O6 | 911.8047 | 7.1 | 906.8543 | Triglycerides |
| 95 | 116.62 | [M+Na]+ | TG 56:2 | C59H110O6 | 937.8226 | 2.8 | 932.8644 | Triglycerides |
| 96 | 117.14 | [M+Na]+ | Lutein dipalmitate | C72H116O4 | 1067.8833 | 5.8 | 1044.8865; 789.6564; 533.4156 | Lutein esters |
| 97 | 118.53 | [M+Na]+ | Lutein palmitate-stearate | C74H120O4 | 1095.9099 | 1.4 | 1072.9198; 817.6887; 789.6505; 533.4156 | Lutein esters |
| 98 | 121.17 | [M+Na]+ | Lutein distearate | C76H124O4 | 1123.9432 | 3.1 | 1100.9509; 817.6829; 533.4109 | Lutein esters |
| No. | Compound Name | VIP Value | Fold Change | p-Value |
|---|---|---|---|---|
| 1 | Dehydrophytosphingosine (4) | 6.93 | 0.09 | 0.0083 |
| 2 | Phytosphingosine (5) | 4.34 | 0.09 | 0.0166 |
| 3 | 1α,25-dihydroxy-2β-hydroxymethyl-19-norvitamin D3 (16) | 4.22 | 2.06 | 0.0089 |
| 4 | Unknown 10 (15) | 4.13 | 2.63 | 0.0136 |
| 5 | Unknown 13 (45) | 2.98 | 0.48 | 0.0252 |
| 6 | DAG 34:3 (29) | 2.91 | 0.49 | 0.0032 |
| 7 | 19-nor-2-(3-hydroxypropyl)-1,25-dihydroxyvitamin D3 (18) | 2.89 | 2.56 | 0.0105 |
| 8 | Unknown 11 (17) | 2.73 | 3.06 | 0.0252 |
| 9 | Unknown 15 (61) | 2.65 | 0.15 | 0.0157 |
| 10 | Unknown 7 (10) | 2.42 | 6.55 | 0.0117 |
| 11 | Unknown 4 (6) | 2.30 | 0.07 | 0.0120 |
| 12 | MGDG 36:6 (19) | 2.12 | 0.09 | 0.0121 |
| No. | Compound Name | VIP Value | Fold Change | p-Value |
|---|---|---|---|---|
| 1 | Dehydrophytosphingosine (4) | 4.65 | 0.28 | 0.0171 |
| 2 | Unknown 5 (7) | 2.04 | 4.48 | 0.0166 |
| 3 | Unknown 8 (11) | 2.42 | 0.23 | 0.0021 |
| 4 | 1α,25-dihydroxy-19-nor-22-oxacholecalciferol (13) | 5.90 | 0.33 | 0.0012 |
| 5 | Unknown 9 (14) | 4.06 | 2.26 | 0.0204 |
| 6 | 1α,25-dihydroxy-2β-hydroxymethyl-19-norvitamin D3 (16) | 6.54 | 0.36 | 0.0007 |
| 7 | 19-nor-2-(3-hydroxypropyl)-1,25-dihydroxyvitamin D3 (18) | 4.19 | 0.35 | 0.0023 |
| 8 | DG 36:4 (28) | 4.09 | 2.34 | 0.0168 |
| 9 | DG 34:2 (26) | 2.31 | 2.05 | 0.0022 |
| 10 | Unknown 12 (42) | 2.49 | 10.32 | 0.0001 |
| 11 | Unknown 13 (45) | 2.39 | 10.57 | 0.0010 |
| 12 | Cer (t18:1(8E)/24:0(2OH)) (54) | 2.53 | 2.71 | 0.0235 |
| 13 | TG 54:9 (56) | 6.04 | 3.50 | 0.0000 |
| 14 | Lutein 3-O-palmitate (58) | 2.46 | 0.37 | 0.0282 |
| 15 | TG 54:8 (65) | 6.51 | 2.36 | 0.0017 |
| 16 | α-amyryl octadecanoate/β-octadecanoate (68) | 2.77 | 8.37 | 0.0003 |
| 17 | TG 54:7 (69) | 5.51 | 2.15 | 0.0003 |
| 18 | TG 54:6 (73) | 6.75 | 2.04 | 0.0011 |
| 19 | TG 54:5 (77) | 5.74 | 2.51 | 0.0418 |
| 20 | TG 54:4 (78) | 2.45 | 2.57 | 0.0065 |
| 21 | TG 54:5 (79) | 3.81 | 2.03 | 0.0016 |
| 22 | TG 54:4 (84) | 5.85 | 3.02 | 0.0131 |
| 23 | TG 54:3 (87) | 2.80 | 4.81 | 0.0445 |
| No. | Compound Name | VIP Value | Fold Change | p-Value |
|---|---|---|---|---|
| 1 | Unknown 2 (2) | 2.15 | 0.12 | 0.0006 |
| 2 | Dehydrophytosphingosine (4) | 5.15 | 51.10 | 0.0062 |
| 3 | Phytosphingosine (5) | 3.21 | 37.38 | 0.0133 |
| 4 | Unknown 10 (15) | 2.58 | 0.45 | 0.0063 |
| 5 | Unknown 11 (17) | 2.03 | 0.33 | 0.0012 |
| 6 | Unknown 9 (14) | 3.32 | 2.13 | 0.0371 |
| 7 | Unknown 8 (11) | 2.26 | 0.15 | 0.0012 |
| 8 | 1α,25-dihydroxy-19-nor-22-oxacholecalciferol (13) | 5.75 | 0.18 | 0.0003 |
| 9 | 1α,25-dihydroxy-2β-hydroxymethyl-19-norvitamin D3 (16) | 6.55 | 0.18 | 0.0002 |
| 10 | 19-nor-2-(3-hydroxypropyl)-1,25-dihydroxyvitamin D3 (18) | 4.29 | 0.14 | 0.0005 |
| 11 | Unknown 1 (1) | 2.35 | 57.87 | 0.0270 |
| 12 | Lutein 3-O-stearate (67) | 2.18 | 0.47 | 0.0152 |
| 13 | DG 34:4(29) | 2.05 | 2.07 | 0.0059 |
| 14 | Unknown 6 (9) | 2.05 | 11.51 | 0.0268 |
| 15 | DG 34:3 (30) | 2.04 | 2.55 | 0.0012 |
| 16 | DG 34:2 (33) | 4.12 | 2.44 | 0.0006 |
| 17 | DG 34:2 (33) | 3.57 | 3.20 | 0.0001 |
| 18 | DG 34:2 (33) | 2.59 | 3.63 | 0.0011 |
| 19 | DG 36:6 (22) | 2.45 | 2.07 | 0.0001 |
| 20 | DG 36:2 (41) | 2.56 | 2.32 | 0.0011 |
| 21 | DG 36:2 (41) | 2.02 | 2.27 | 0.0019 |
| 22 | Cer(t18:1(8E)/24:0(2OH)) (54) | 3.95 | 6.48 | 0.0266 |
| 23 | α-amyryl octadecanoate/β-octadecanoate (68) | 3.07 | 12.77 | 0.0004 |
| 24 | Lutein 3-O-palmitate (58) | 2.40 | 0.32 | 0.0068 |
| 25 | MGDG 36:6 (19) | 2.04 | 101.92 | 0.0469 |
| 26 | TG 52:6 (70) | 4.08 | 2.22 | 0.0020 |
| 27 | Unknown 12 (42) | 2.39 | 12.67 | 0.0040 |
| 28 | TG 52:5 (74) | 4.78 | 2.04 | 0.0002 |
| 29 | TG 54:9 (56) | 5.98 | 4.18 | 0.0000 |
| 30 | TG 54:8 (65) | 6.43 | 2.72 | 0.0011 |
| 31 | TG 54:7 (69) | 5.57 | 2.52 | 0.0001 |
| 32 | TG 54:6 (75) | 2.17 | 2.39 | 0.0004 |
| 33 | TG 54:6 (73) | 5.37 | 2.41 | 0.0001 |
| 34 | TG 54:5 (79) | 4.38 | 2.72 | 0.0000 |
| 35 | TG 54:4 (84) | 5.24 | 2.91 | 0.0001 |
| 36 | TG 54:3 (87) | 2.18 | 0.45 | 0.0092 |
| 37 | Unknown 13 (45) | 3.07 | 21.85 | 0.0024 |
| 38 | Unknown 14 (52) | 2.15 | 23.50 | 0.0088 |
Disclaimer/Publisher’s Note: The statements, opinions and data contained in all publications are solely those of the individual author(s) and contributor(s) and not of MDPI and/or the editor(s). MDPI and/or the editor(s) disclaim responsibility for any injury to people or property resulting from any ideas, methods, instructions or products referred to in the content. |
© 2024 by the authors. Licensee MDPI, Basel, Switzerland. This article is an open access article distributed under the terms and conditions of the Creative Commons Attribution (CC BY) license (https://creativecommons.org/licenses/by/4.0/).
Share and Cite
Cai, X.; Wu, J.; Lian, Y.; Yang, S.; Xue, Q.; Li, D.; Wu, D. Characterization and Discrimination of Marigold Oleoresin from Different Origins Based on UPLC-QTOF-MS Combined Molecular Networking and Multivariate Statistical Analysis. Metabolites 2024, 14, 225. https://doi.org/10.3390/metabo14040225
Cai X, Wu J, Lian Y, Yang S, Xue Q, Li D, Wu D. Characterization and Discrimination of Marigold Oleoresin from Different Origins Based on UPLC-QTOF-MS Combined Molecular Networking and Multivariate Statistical Analysis. Metabolites. 2024; 14(4):225. https://doi.org/10.3390/metabo14040225
Chicago/Turabian StyleCai, Xingfu, Juanjuan Wu, Yunhe Lian, Shuaiyao Yang, Qiang Xue, Dewang Li, and Di Wu. 2024. "Characterization and Discrimination of Marigold Oleoresin from Different Origins Based on UPLC-QTOF-MS Combined Molecular Networking and Multivariate Statistical Analysis" Metabolites 14, no. 4: 225. https://doi.org/10.3390/metabo14040225
APA StyleCai, X., Wu, J., Lian, Y., Yang, S., Xue, Q., Li, D., & Wu, D. (2024). Characterization and Discrimination of Marigold Oleoresin from Different Origins Based on UPLC-QTOF-MS Combined Molecular Networking and Multivariate Statistical Analysis. Metabolites, 14(4), 225. https://doi.org/10.3390/metabo14040225


