Review

Hepatic Positron Emission Tomography: Applications in Metabolism, Haemodynamics and Cancer

by
Miikka-Juhani Honka
1,2,*,
Eleni Rebelos
2,3,
Simona Malaspina
1,2 and
Pirjo Nuutila
1,2,4
1
Turku PET Centre, Turku University Hospital, 20520 Turku, Finland
2
Turku PET Centre, University of Turku, 20520 Turku, Finland
3
Institute of Clinical Physiology, National Research Council (CNR), 56124 Pisa, Italy
4
Department of Endocrinology, Turku University Hospital, 20520 Turku, Finland
*
Author to whom correspondence should be addressed.
Metabolites 2022, 12(4), 321; https://doi.org/10.3390/metabo12040321
Submission received: 1 March 2022 / Revised: 29 March 2022 / Accepted: 31 March 2022 / Published: 2 April 2022
(This article belongs to the Special Issue The Application of Imaging Technology in Studying Liver Metabolism)

Abstract

:
Evaluating in vivo the metabolic rates of the human liver has been a challenge due to its unique perfusion system. Positron emission tomography (PET) represents the current gold standard for assessing non-invasively tissue metabolic rates in vivo. Here, we review the existing literature on the assessment of hepatic metabolism, haemodynamics and cancer with PET. The tracer mainly used in metabolic studies has been [18F]2-fluoro-2-deoxy-D-glucose (18F-FDG). Its application not only enables the evaluation of hepatic glucose uptake in a variety of metabolic conditions and interventions, but based on the kinetics of 18F-FDG, endogenous glucose production can also be assessed. 14(R,S)-[18F]fluoro-6-thia-Heptadecanoic acid (18F-FTHA), 11C-Palmitate and 11C-Acetate have also been applied for the assessment of hepatic fatty acid uptake rates (18F-FTHA and 11C-Palmitate) and blood flow and oxidation (11C-Acetate). Oxygen-15 labelled water (15O-H2O) has been used for the quantification of hepatic perfusion. 18F-FDG is also the most common tracer used for hepatic cancer diagnostics, whereas 11C-Acetate has also shown some promising applications in imaging liver malignancies. The modelling approaches used to analyse PET data and also the challenges in utilizing PET in the assessment of hepatic metabolism are presented.

1. Introduction

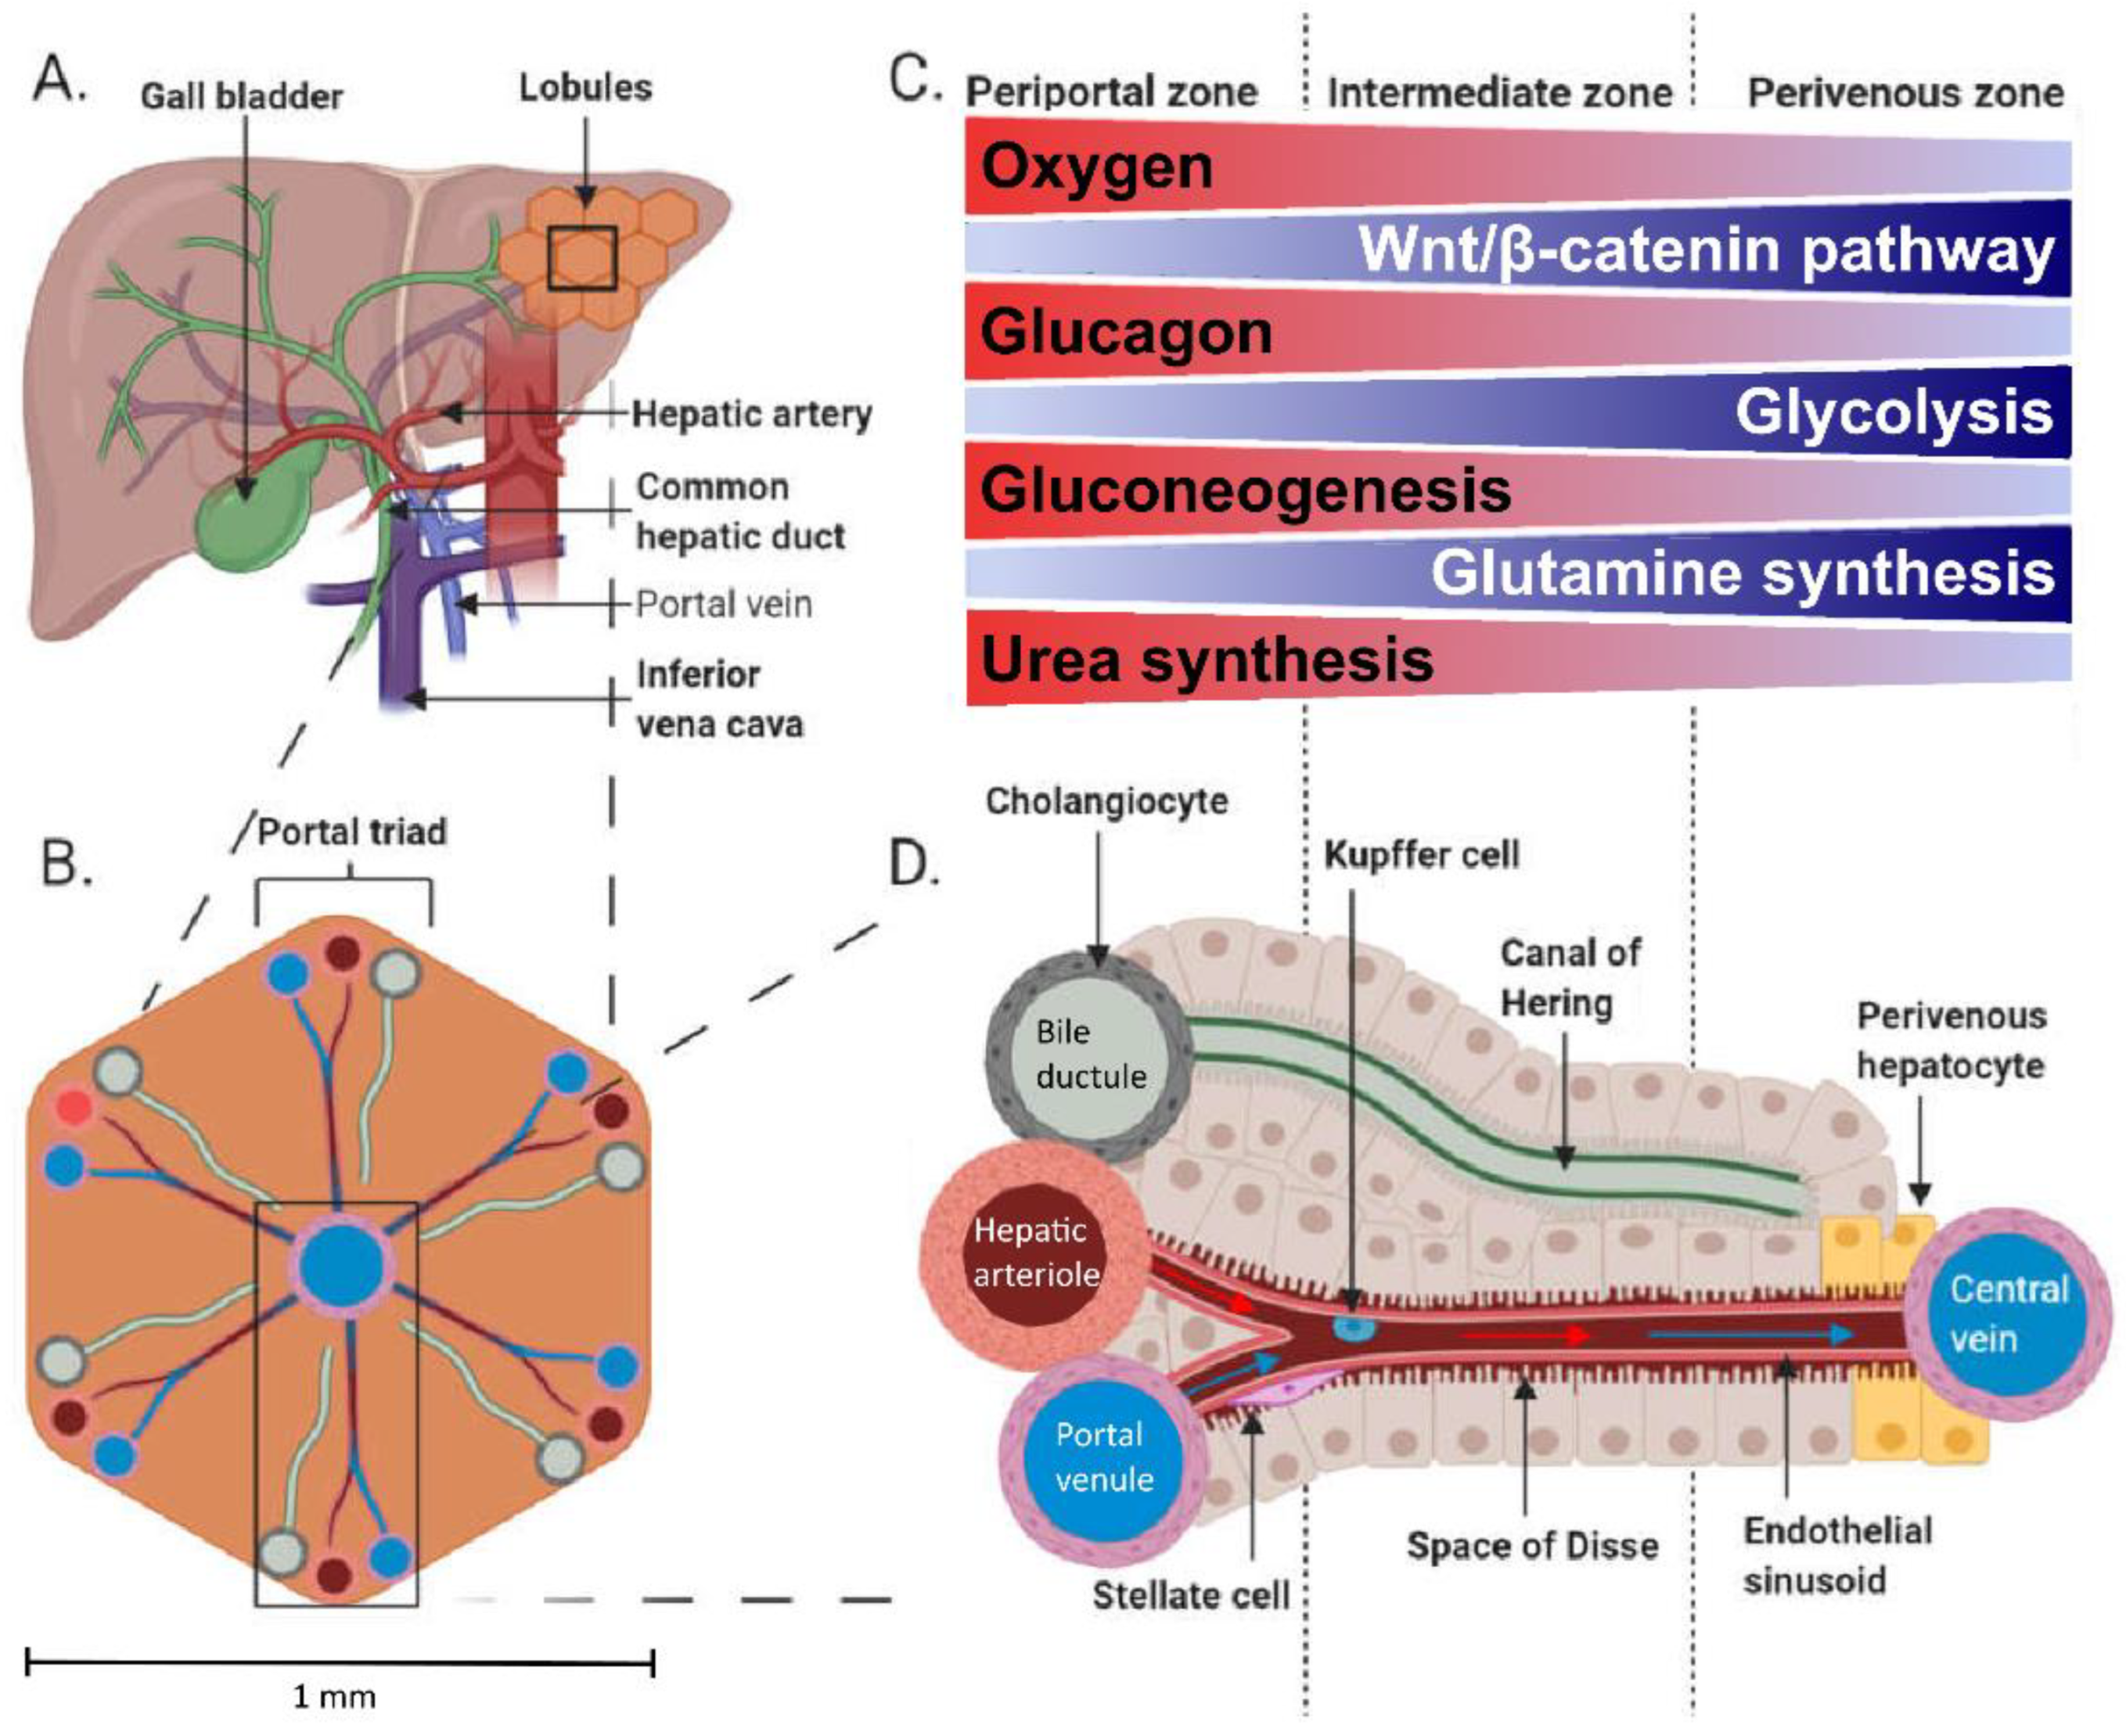
1.1. Hepatic Physiology

The liver receives ~29% of cardiac output, and it has a unique perfusion system receiving blood from the portal vein and the hepatic artery. The portal vein provides approximately 75% of the liver’s blood supply, whereas the hepatic artery contributes the remaining 25% [1]. The hepatic artery branches off the celiac trunk, which is the first major branch of the abdominal aorta [2] and provides highly oxygenated blood to the liver. The portal vein provides partially oxygenated blood to the liver [3], and nutrients absorbed from the gut pass first through the portal vein before being released to systemic circulation from the hepatic vein (Figure 1). The portal vein drains through the gastrointestinal tract, spleen and pancreas and is formed through a confluence of the superior and inferior mesenteric veins, splenic veins, pancreatic vein, and left and right gastric veins.
Blood flow through the splanchnic area increases after a meal to distribute the ingested nutrients [6,7] and to compensate for meal-induced increased oxygen use by the splanchnic organs [8]. Portal venules and hepatic arterioles provide blood supply throughout the liver parenchyma and are interconnected into liver sinusoids by anastomoses where arterial and portal blood mix [9]. The microstructure of the liver consists of small, generally hexagonal lobules of ~1 mm diameter in humans (Figure 1B). These lobules are perfused by a portal triad at each corner and a hepatic vein at the centre of the lobule, which are connected by the highly fenestrated sinusoids. The portal triad consists of a portal venule, hepatic arteriole, and bile ductule (Figure 1D). This anatomical architecture is accompanied by functional zonation (Figure 1C). The periportal hepatocytes close to a portal triad are active in gluconeogenesis, amino acid catabolism and urea synthesis, whilst the pericentral hepatocytes with lower oxygen supply have active glycolysis, branched-chain amino acid catabolism and glutamine synthesis [10,11,12]. Some functions such as glycogenesis are more uniformly performed across the lobules [11,13]. Fatty acid oxidation has been generally thought to occur mainly in periportal hepatocytes and fatty acid synthesis in pericentral cells; however, the zonation of these processes seems to be flexible depending on the metabolic state [11,14]. Detailed inspection of fatty acid oxidation in murines has revealed the periportal zone to be the main site for mitochondrial β-oxidation and pericentral zone for peroxisomal β-oxidation [12,15]. Change in hepatocyte oxygen supply is a likely driver of the functional zonation across the liver acinus [16]: The hepatic artery partial oxygen pressure (PaO2) is ~95 mmHg, whilst PaO2 in the portal vein is ~50–55 mmHg, and the hepatic vein is 30–40 mmHg [3,17], whereas in vivo measured liver tissue PaO2 is ~30–55 mmHg [18,19,20]. In addition, the Wnt/catenin, Hedgehog [21], and glucagon signalling [22] have been shown to contribute to the liver’s functional zonation.
The liver represents the major metabolic hub of the human body. In the postprandial state, when there is no need for additional carbohydrates, the liver stores glucose as glycogen or converts it to lipids, whereas in the postabsorptive state, the liver contributes to endogenous glucose production through glycogenolysis and gluconeogenesis and oxidises fatty acids to produce ketone bodies that are used as metabolic fuels in extrahepatic tissues comprising the brain [23]. Liver fatty acid oxidation is high in the fasted state [24,25], whereas fatty acid oxidation declines considerably after a mixed meal/presence of hyperglycaemia [26,27,28]. This, together with knowledge that splanchnic area oxygen consumption increases after a mixed meal [29], means that the oxidations of lactate, amino acids and glucose are preferred in the postprandial state [30]. The liver takes up approximately 25–40% of an oral glucose load [31]. Seventeen to nineteen percent (17–19%) of an oral glucose load has been found to be incorporated to liver glycogen, of which 50–70% is formed via the direct pathway and the rest from cycling through 3-carbon precursors [32,33,34,35]. At the postabsorptive state, the liver produces about 80% of the glucose that appears in the circulation [36]. When the liver’s glycogen stores are full, glycogenolysis is the main contributor to the liver’s glucose production, whereas the relative contribution of gluconeogenesis increases when glycogen stores are used during fasting until glycogen stores are depleted, and about 100% of glucose production comes from gluconeogenesis [37,38,39,40].

1.2. Traditional Nodes of Assessing Tissue Metabolism vs. PET

With the arteriovenous (AV) difference technique, the net balance across an organ can be determined. The method is based on measuring blood flow and the concentration difference of the metabolite of interest between an artery delivering the organ and a vena draining from the organ [41]. In the case of glucose-producing organs, the liver and the kidney, the use of glucose isotopes is needed to quantify glucose uptake and glucose production rates. In principle, sampling from an artery and a vein draining the organ of interest is required. As already mentioned, the liver receives blood both from the portal vein and the hepatic artery; the portal vein is virtually inaccessible in human studies; therefore, human studies employing the AV difference technique cannot yield estimates of solely liver metabolism but rather of the splanchnic region [42]. Moreover, the AV determination across organs with very high blood flow (such as the liver and the kidney) represent an analytical challenge. These limitations of the AV difference technique can be overcome with the application of non-invasive imaging techniques such as positron emission tomography (PET) or magnetic resonance imaging (MRI) and spectroscopy (MRS)—which of course have their own limitations. In this article, we will focus on the use of PET in the assessment of liver metabolism, haemodynamics and cancer.

2. Studying Liver Metabolism with PET

2.1. Principle of PET

PET is a highly sensitive medical imaging technique that is based on measuring the radioactive decay of labelled positron emitting compounds injected into humans or animals. A portion of gamma rays resulting from the annihilation of the emitted positrons proceeds through the body tissues and is measured with the detector ring of a tomograph and computationally constructed to form three-dimensional images of tracer activity. Labelling energy substrates such as glucose or fatty acids with a positron emitting isotope allows the measurement of the localization of positron decay and, thus, the uptake of the tracer compound.

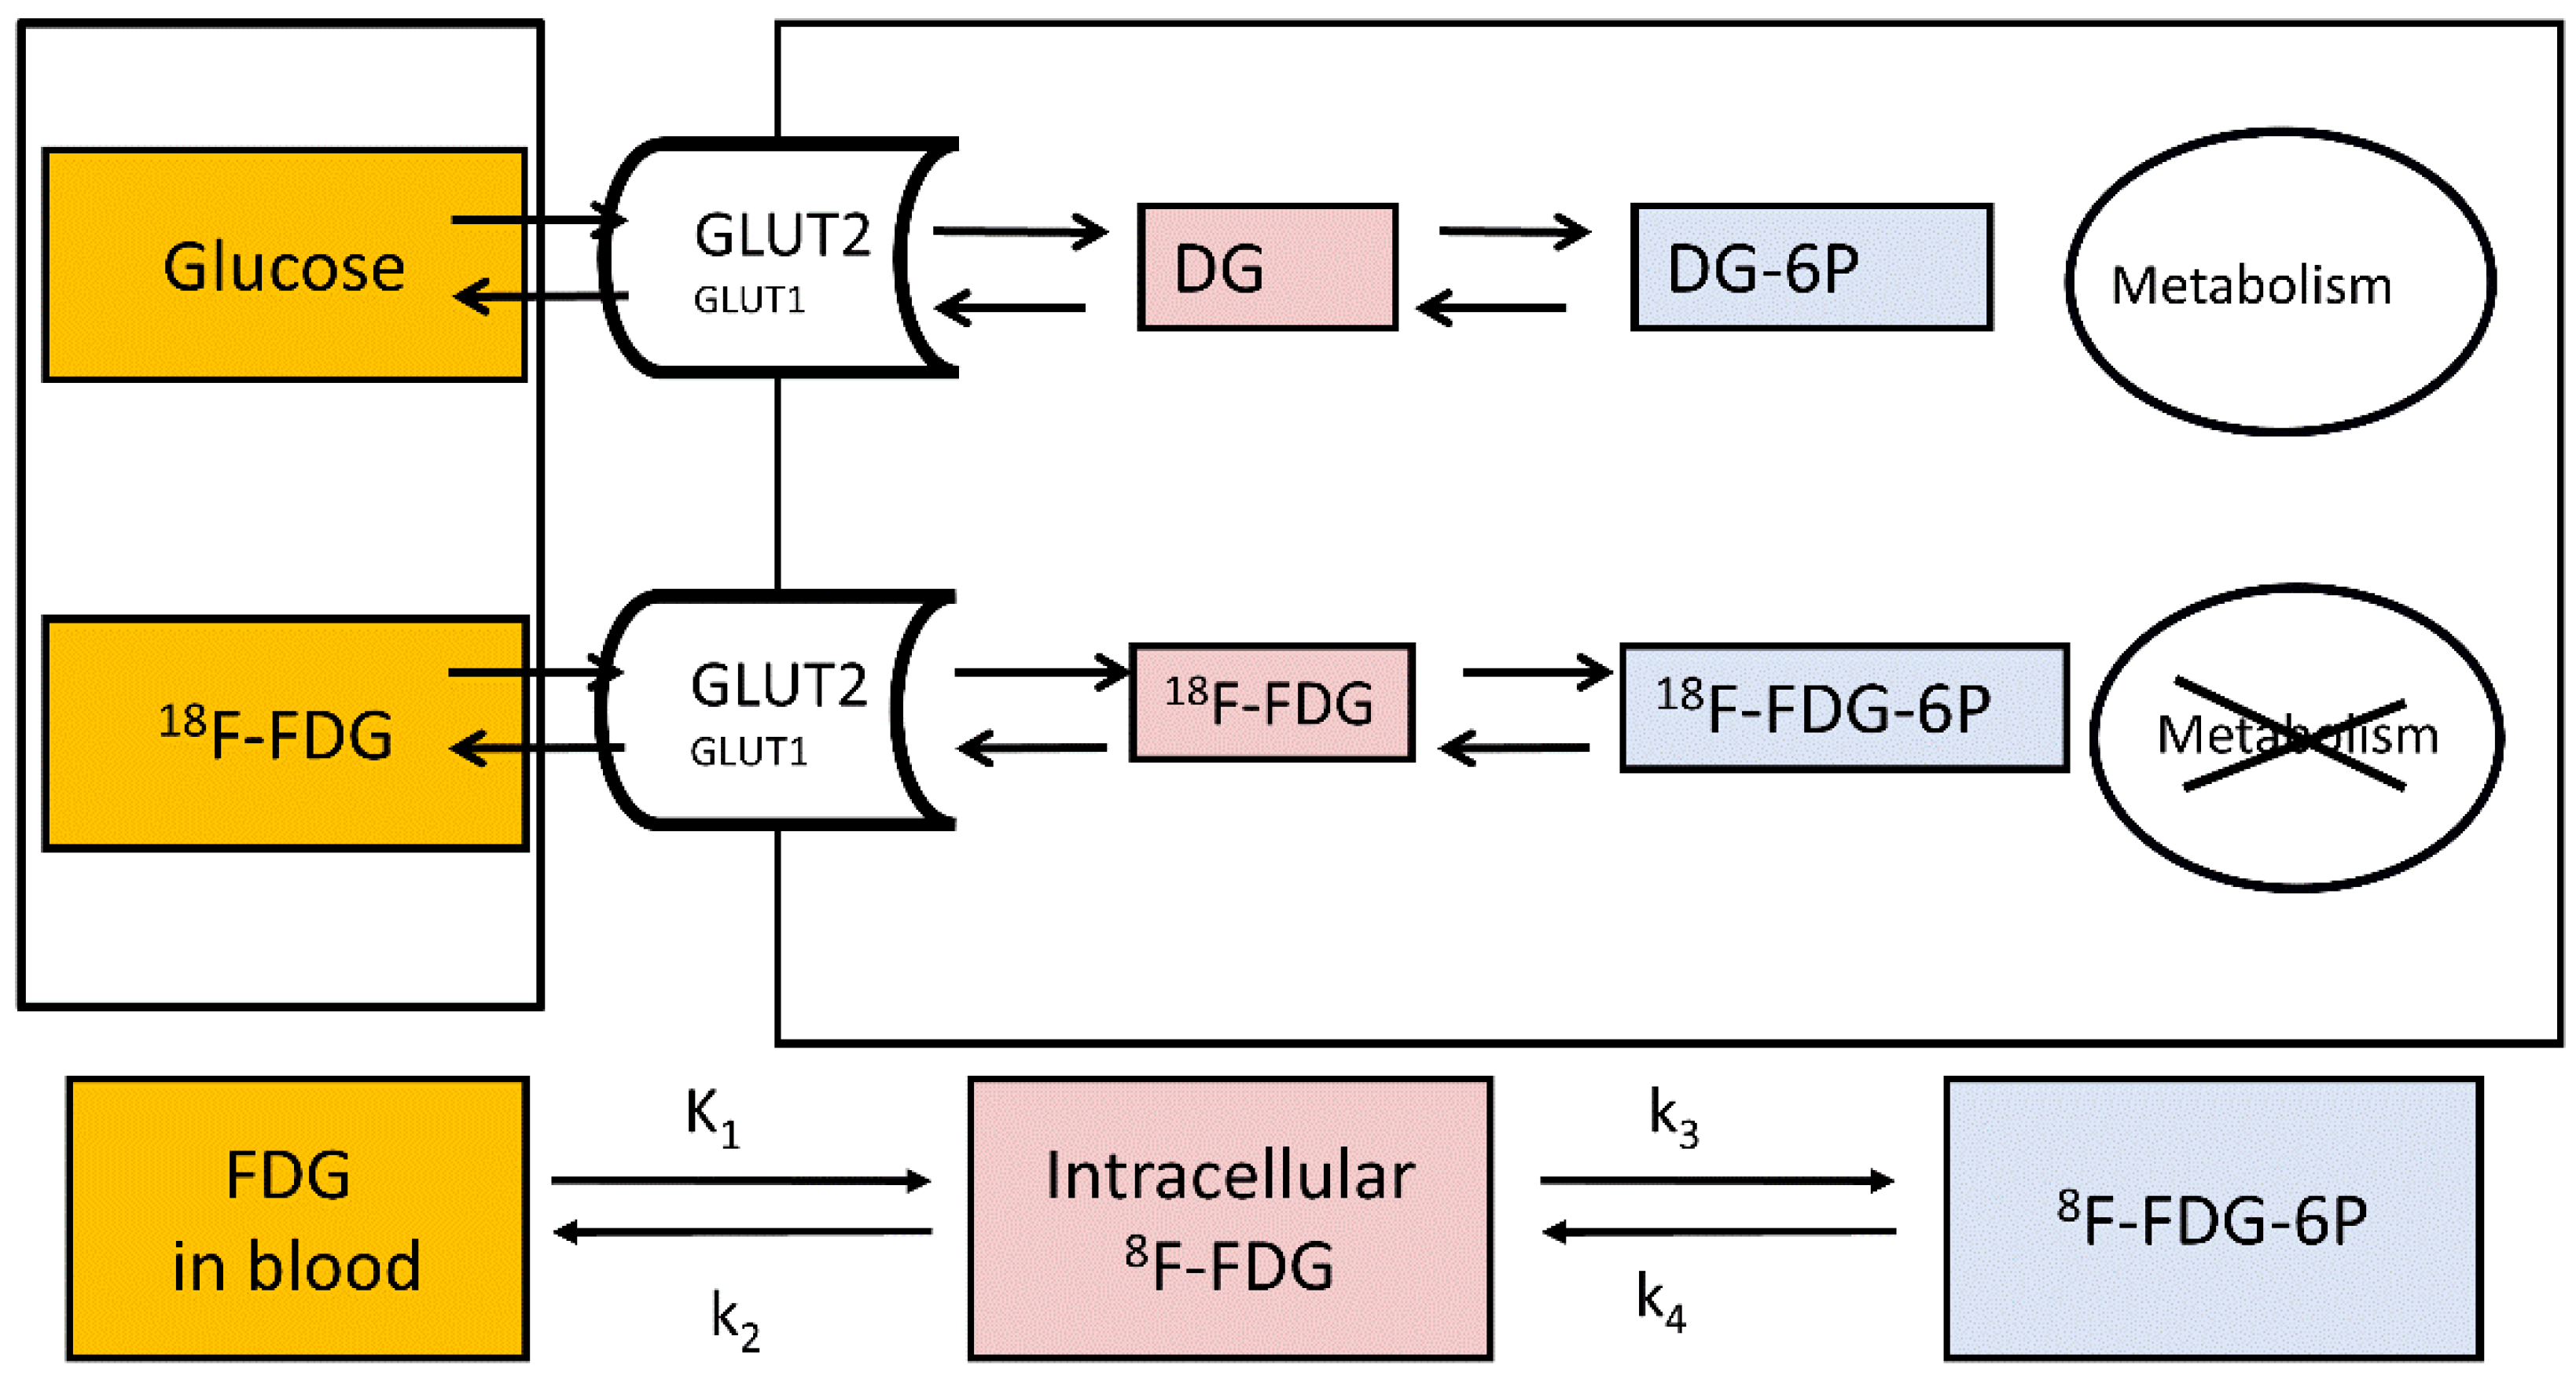
2.2. Study of Hepatic Glucose Uptake Using PET

A positron-emitting glucose analogue 18F-labelled fluorodeoxyglucose (18F-FDG) is widely used for the assessment of tissue glucose uptake (GU) with PET in both clinical and research settings, and the euglycemic-hyperinsulinemic clamp allows the measurement of tissue-specific insulin-stimulated GU [43,44]. The structure of 18F-FDG is favourable for measuring tissue GU due to its limited metabolism; also, it is a good substrate for the facilitated-glucose transporters responsible for glucose transport to and from the liver [45,46]. 18F-FDG transported into the cells is either phosphorylated to 18F-fluorodeoxyglucose-6-phosphate (18F-FDG6P) or transported back out of the cell. The phosphorylated 18F-FDG6P is not transported out of the cells as G6P transporters reside on intracellular membranes and not on cell surfaces [47]. Once phosphorylated, 18F-FDG6P does not proceed to glycolysis (Figure 2), and its metabolisms into the glycogen or pentose phosphate pathways are slow in the liver [48,49]. In fact, in a pig study where we validated the use of 18F-FDG-PET in the quantification of hepatic GU, livers were biopsied 3h after 18F-FDG injection, and no detectable amount of liver 18F-glycogen was found [50]. The metabolites 2-18F-fluoro-2-deoxy-6-phospho-d-gluconolactone (18F-FD6PGL), 2-18F-fluoro-2-deoxy-6-phosphogluconate (18F-FD6PG1), NDP-2-18F-FDG or NDP-2-18F-fluoro-2-deoxy-D-mannose may become important in the liver when the scan duration is longer than 60–90 min [49,51,52]. However, 18F-FDG6P can be dephosphorylated by glucose-6-phosphatase which works actively in the liver. Nevertheless, (1) dephosphorylation activity is generally low compared to phosphorylation [50,53,54] and (2) the phosphorylation of glucose entering the cells and the dephosphorylation of G6P derived from gluconeogenesis, glycogen breakdown or cycling back from glycolysis are compartmentalized processes [16,50,53], allowing thus the measurement of GU in the liver. Liver 18F-FDG6P trapping is enhanced in insulin-sensitive individuals during a hyperinsulinemic clamp where insulin stimulates glucokinase activity while simultaneously suppressing the activity of glucose-6-phosphatase, whereas the suppression of glucose-6-phosphatase activity is blunted in persons with insulin resistance [53].
There are several modelling approaches that can be used to quantify liver glucose metabolism. A dynamic study where tracer concentration is recorded over time in blood to measure tracer input and in target tissue is ideal for quantification. Arterial input function can be precisely measured for PET-studies and arterialised input function corresponds to arterial input reasonably well for 18F-FDG studies [55,56]. However, the dual blood input of the liver poses a challenge for human studies as the portal vein is inaccessible and deriving image-based input functions is difficult due to the small diameter of the vein and respiratory motion [57]. Assuming that an input consists of arterial blood only leads to underestimation of compartmental model rate constants [57,58]. Nevertheless, in our previously mentioned validation study in pigs, the underestimation of GU when using only arterial input function was found to be relatively small (5–10%) [50]. This difference is smaller than interindividual variation in hepatic GU and likely of negligible clinical relevance. Despite underestimation when using only arterial input, GU measured with single and dual input were highly correlated (r = 0.998) [50]. Furthermore, several models have been developed to estimate portal vein (dual) input function [59,60]. Only the arterial input function can be used for liver tumour studies because the hepatic artery is the main blood supply for them [61,62,63].
A three-compartment model consisting of blood, intracellular space and phosphorylated state can be used to model GU [56] (Figure 1) using the following equation:
MR glucose = C glucose LC × K 1   * ×   k 3   * k 2   * +   k 3   *  
where MRglucose is the metabolic rate of glucose (GU rate), K1* is unidirectional rate constant of transport from blood to hepatocytes (hepatic systemic clearance), k2* is the backflux of tracer from hepatocytes to blood and k3* is the rate constant of 18F-FDG’s phosphorylation. Cglucose is the plasma glucose average from 18F-FDG injection until the end of the PET scan. LC is a lumped constant adjusting for differences between the transfer rates of 18F-FDG and glucose of the tissue, which is studied. Studies in pigs and humans suggest LC in the liver does not differ from unity [50,64]. However, a different LC might need to be considered if using a compartment model where the dephosphorylation of 18F-FDG6P is included (k4 > 0) [65,66], depending on the input function used or the presence of a liver disease [67]. In addition, the presence of other metabolites of 18F-FDG than 18F-FDG6P would cause some underestimation of k4 [68]. Importantly, measuring MRglucose does not require blood flow measurements, thus providing an advantage over the arteriovenous difference and microdialysis techniques, which require information about blood flow.
Another way to calculate the GU rate is to use a graphical analysis method: the Patlak plot [69,70]. This analysis assumes that, if there is irreversible tracer uptake, the relationship between tracer activity available in blood and accumulated in tissue becomes linear after the initial mixing of tracer pools reaches an effective steady state [69,70]. The Patlak plot measures the irreversible tracer uptake whereby a net transfer rate is described using term Ki*, which combines K1*, k2* and k3*.
K i   * = K 1   * ×   k 3   * k 2   * +   k 3   *  
MR glucose = C glucose LC ×   K i   *  
The presence of dephosphorylation would show as a bend in the Patlak plot over time [64,71]. An important consideration when measuring liver GU is that higher liver fat content reduces the distribution volume of 18F-FDG in the tissue (V0), thus reducing Ki. According to some authors [72], this issue can be addressed by dividing Ki with the y-axis intercept of the Patlak plot because in healthy livers, V0 is close to unity, meaning that 18F-FDG quickly distributes into both hepatic interstitial space and hepatocytes and Ki/V0 equals k3, which describes the conversion of 18F-FDG to 18F-FDG-6P. Thus, k3 calculated this way would describe glucokinase activity in a lean fraction of liver tissue. A simple model for measuring GU rates is the application of fractional uptake rate (FUR), a method that has been validated against the Patlak plot. Moreover, FUR measurements of blood activity are required, but only one timepoint of tissue activity (static image) is enough to measure tissue activity. With this model, the average tissue activity is divided by the integral of the plasma input activity from the tracer’s injection to the middle time of the PET frame used in FUR calculation, and the effective distribution volume with FUR is assumed to be 0 [73]. FUR yields an estimate of the tracer net transfer rate, which can be translated to a GU rate by multiplying it with the plasma glucose average and dividing by a lumped constant (similarly to the Ki obtained from the Patlak plot). Using FUR leads to some overestimation of the true net transfer rate. The bias is over 20% within the first 20 min from 18F-FDG injection and becomes less than 5% after 60 min of scan time [74]. Therefore, FUR is an accurate alternative for the Patlak plot when only static images are available, and the scanning time is long.
The measurement ofa standardised uptake value (SUV) is a semiquantitative method for assessing tissue GU. An SUV is calculated by multiplying tissue activity with body weight and dividing the result by the injected dose. SUV is affected by several factors, which can lead to large errors and hamper the use of SUV for the measurement of glucose metabolism: (1) body composition and habitus; (2) length of uptake period; (3) plasma glucose; (4) recovery coefficient and partial volume effects (these affect Ki and FUR, too) [75]; and (5) variable urinary excretion [76] or a sink effect caused by variable tissue uptake (e.g., high tumour uptake) on blood tracer concentrations, which affects the total tracer clearance [77]. From these, body fat content and the length of the uptake period are major sources of variation [75]. Although these matters can be often addressed by standardizing scanning times, correcting for anthropometric features and plasma glucose, the accuracy of SUV is inferior to quantitative three-compartment modelling, the Patlak plot and FUR [78]. Using an SUV ratio (SUVR), i.e., adjusting tissue SUV by blood improves the accuracy of an SUV measurement [79] because it accounts for possible variations in tracer supply.

2.3. Evaluation of Endogenous Glucose Production during 18F-FDG-PET

The use of 18F-FDG for the measurement of PET GU allows simultaneous measurement of endogenous glucose production (EGP) at both fasting states and during a euglycemic-hyperinsulinemic clamp [44,80,81]. This measurement is based on determining glucose disappearance rate from plasma by calculating 18F-FDG clearance, which is corrected for activity lost to urine. In the fasting state, EGP equals the glucose disappearance rate when plasma glucose is steady, and during a clamp/18F-FDG study, EGP can be calculated by subtracting the glucose infusion rate from the glucose disappearance rate during the steady state [80]:
EGP   =   R d + V glucose × Δ glucose Δ T GIR  
where Rd is the rate of disappearance, and GIR is the glucose infusion rate. GIR is corrected by a space correction [82] where Vglucose is the estimated glucose distribution volume (0.19 L/kg), Δglucose is the change in glucose from 18F-FDG injection to the end of sampling (mmol/L) and ΔT is the time of 18F-FDG injection to the end of sampling (min).
Glucose disappearance rate (Rd) is calculated using 18F-FDG clearance corrected by tracer lost to urine [80]:
R d = dose FDG   urine FDG AUC FDG * avg glucose  
where doseFDG is the activity of the injected 18F-FDG, urineFDG is 18F-FDG secreted to urine from the tracer injection until voiding bladder at the end of the study, AUCFDG is the area under the curve representing 18F-FDG from the tracer injection to infinity and avgglucose is the average glycemia during the interval between the time of 18F-FDG injection and the end of sampling.
An important consideration for the EGP measurement from a bolus 18F-FDG study is that the measurement time for the tracer blood curve is sufficiently long to reliably estimate 18F-FDG clearance from AUCFDG.

2.4. Measuring Hepatic GU: Effects of Obesity and Weight Loss

Obesity [43,44] and type 2 diabetes (T2DM) [83] have a negative effect on insulin-stimulated liver GU, whereas weight loss by bariatric surgery (BS) increases liver GU [44]. This impairment in insulin stimulation of liver GU measured by 18F-FDG-PET, which indicates decreased hepatic glucokinase activity, is in line with research showing lower UDP-flux during hyperinsulinaemia with intravenous or enteral glucose delivery [84,85] and postprandial glycogen synthesis rate [86] in patients with T2DM. In fact, in a study in rats, glucokinase activity/translocation has been shown to be the rate-controlling step in insulin-stimulated glycogen synthesis [87].

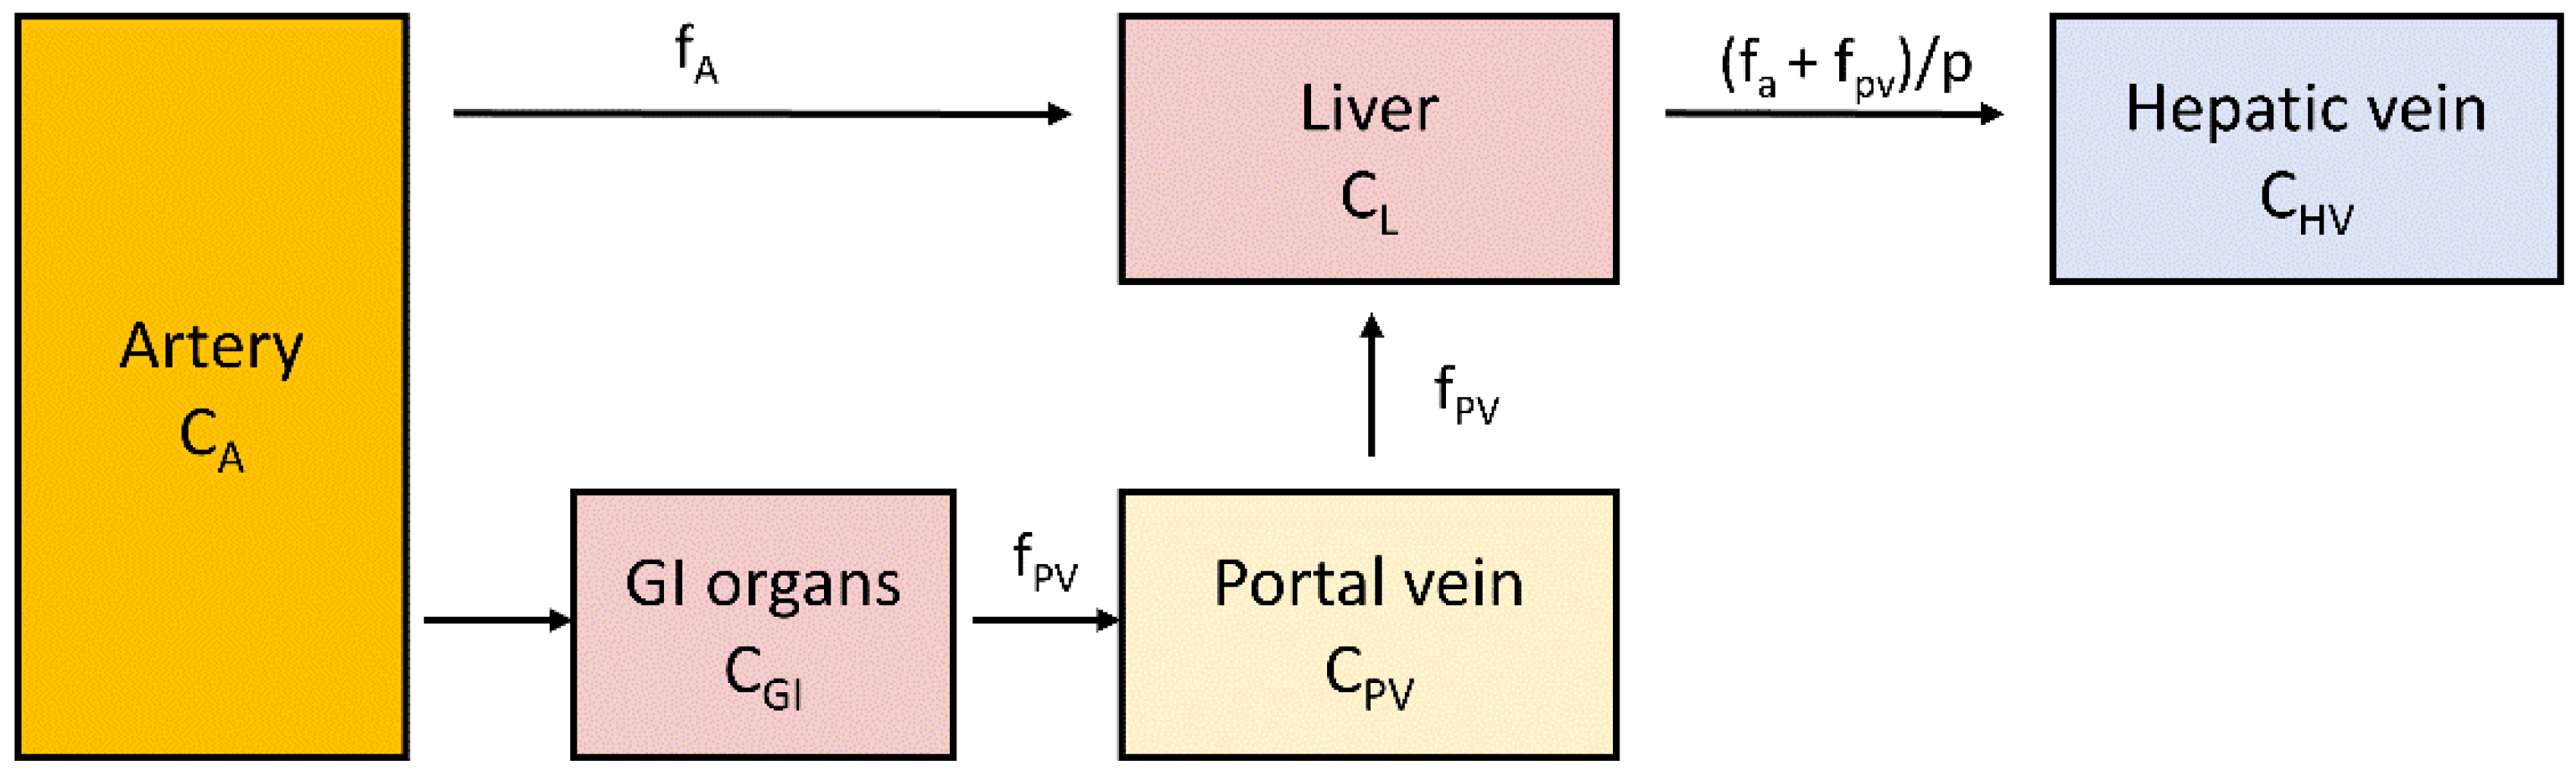
2.5. Measurement of Liver Perfusion

Liver blood flow can be measured using positron emitting oxygen-15 labelled water (15O-H2O), a method that provides reliable information about tissue perfusion. This is possible thanks to the characteristics of this tracer being diffusible and not becoming metabolized or trapped. The labelled water diffuses rapidly from capillaries to extra- and intracellular spaces and back to circulation. 15O has a short half-life of only 122 s, which allows multiple measurements in a short period of time. This is a major improvement over Xenon-133 (half-life 5.3 days), a tracer earlier employed for blood flow measurements [88]. A study of liver blood flow needs to take into account the dual input of blood flow where the peak of the time–activity curve in the portal vein is delayed and dispersed compared to the hepatic artery [60,89,90]. Liver perfusion can be quantified by using a one-tissue compartment model where the tissue compartment receives input from hepatic artery and portal vein (Figure 3). If the arterial input function is obtained by sampling from a peripheral artery, the time-activity curve needs to be corrected for time delay between the sampling site and liver tissue.
In addition to 15O-H2O, various other tracers can be used to assess liver perfusion because of their highly effective clearance from blood to hepatocytes during the first minutes of tracer injection. This makes it possible to estimate hepatic perfusion with metabolic tracers such as 18F-FDG or 3-O-11C-methylglucose, although hepatic perfusion estimated using K1 from a compartment model had some tendency to overestimate perfusion in a pig study [59].
In a BS study [92], we showed that liver blood arterial blood flow (per unit volume) at the fasting state increased in patients with morbid obesity compared to non-obese controls, whereas there was no difference between the groups in portal blood flow. Blood flow was further increased after BS per unit volume but not changed per whole organ as liver volume decreased.
In another study [93], we found that there were no differences in basal hepatic blood flow between lean controls and patients with morbid obesity, but the hepatic blood volume was higher in morbid obesity due to organ size. In both groups, a mixed meal did not change blood flow but reduced hepatic blood volume about 10%. In this study, BS reduced blood flow in hepatic artery at fasting with no change in portal blood flow or hepatic blood volume. Portal blood flow after a mixed meal was increased after BS. BS induced a reduction in hepatic blood volume during gastrointestinal peptide infusion whereas GLP-1 infusion decreased portal vein blood flow and increased hepatic arterial flow in lean controls. [93]
We have previously shown that hepatic blood flow measurement has potential in the diagnosis of acute mesenteric ischemia [94]. Acute mesenteric ischemia has high mortality rates despite the availability of an effective treatment because the condition is difficult to diagnose at early stages based on clinical and laboratory findings or other imaging methods [94].

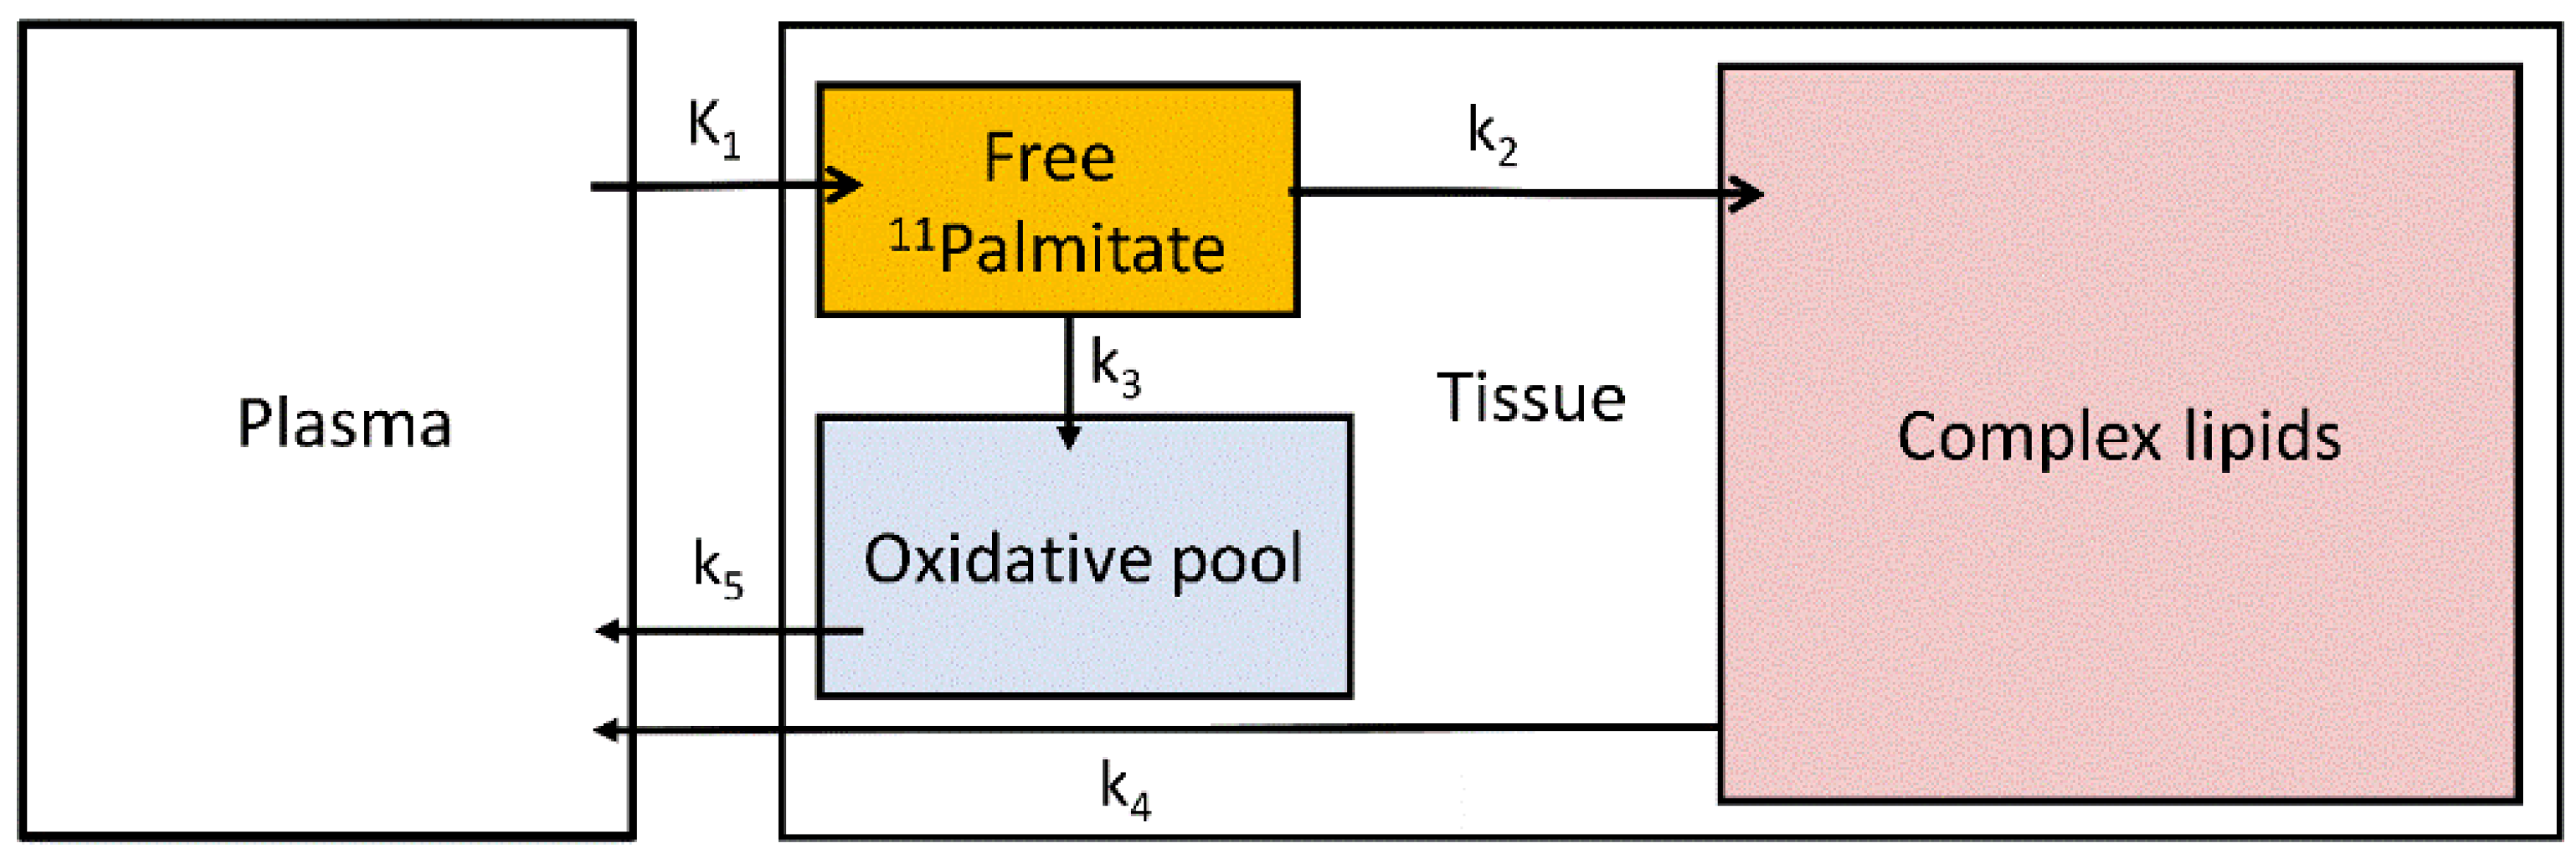
2.6. Measurement of Hepatic Fatty Acid Uptake

Hepatic fatty acid uptake (HFAU) can be measured with PET by using 11C-palmitate or the 18F-labelled fatty acid analogue 14(R,S)-[18F]fluoro-6-thia-Heptadecanoic acid (18F-FTHA).
Palmitate is a physiological substrate of the liver and one of the most common fatty acids stored in the adipose tissue and in circulation in humans [95]. Hepatic 11C-palmitate kinetics can be modelled with a three-tissue compartment model representing free 11C-palmitate, 11C-palmitate bound in lipids and 11C-oxidative metabolites [96] (Figure 4).
18F-FTHA differs from real fatty acids due to the sulfur heteroatom substituting the sixth carbon in the fatty acid carbon chain [97]. The presence of sulfur atom causes the metabolism of 18F-FTHA to stop after two cycles of beta oxidation, and 18F-labels from the metabolites of this process are trapped in the tissue [97]. 18F-FTHA is bound to phospholipids and glycerol esters [97,98], albeit fractional esterification into triglycerides has been shown to be impaired compared to 14C-palmitate [99] and in response to insulin [98,99]. The property of efficient trapping in the tissue allows the use of the Patlak graphical model to measure tissue uptake between 10 and 32 min from tracer injection before tracer loss from the tissue starts to bend the curves at later time points [100].
We have studied the effect of very-low calorie diet on hepatic fatty acid uptake, reporting a decrease of ~26% in HFAU following weight loss [101]. In another study, we studied hepatic fatty acid uptake in conjunction with blood flow and liver fat content (with MRS) in morbidly obese and lean individuals and the effect of BS [44]. Patients with obesity had significantly higher HFAU compared to the lean controls. Contrary to the very-low calorie diet study, in this study, 6-months following BS, HFAU remained high, because of the strong catabolic state induced by metabolic surgery. On the contrary, following BS, the liver’s fat content was markedly decreased. Taken together, it was suggested that in post-surgery settings, the large amounts of fatty acids uptaken by the liver, are not stored in the liver but are used for oxidation to provide energy.
The effect of the sodium-glucose cotransporter-2 inhibitor (SGLT2-i), dapagliflozin, on HFAU was also recently evaluated by us [102]. In that study, we found that hepatic fatty acid uptake was increased by dapagliflozin versus placebo.

2.7. Liver 11C-Acetate: Applications

Imaging with 11C-labelled acetate (1-11C-acetate) can provide information about blood flow, oxidation, and fatty acid synthesis in the liver. The initial build-up of the tracer is related to tissue blood flow and washout describes CO2 production; in addition, part of the tracer is incorporated to amino acids [103]. About 30 min after 1-11C-acetate injection most tracer in the tissue is bound to long-chain fatty acids. This irreversible uptake representing de novo fatty acid synthesis can be measured by using the Patlak-plot similarly to GU and HFAU [103].

2.8. 18F-FDG-PET and Nonalcoholic Fatty Liver Disease

Nonalcoholic fatty liver disease (NAFLD), recently renamed as metabolic associated fatty liver disease (MAFLD), is the leading cause of chronic liver disease worldwide [104]. MAFLD is associated with cardiovascular, metabolic, digestive, and neurodegenerative diseases, but when there is concomitant presence of liver inflammation (i.e., steatohepatitis (NASH)), the progression to these diseases is markedly accelerated [105]. Since inflammatory cells are characterized by high glucose-avidity, it would be expected that in the presence of NASH, 18F-FDG-PET would show high liver GU rates [106]. However, the available literature has yielded contrasting results.
Keramida et al. reported that hepatic steatosis is associated with increased hepatic 18F-FDG uptake [107]. On the contrary two previous studies have reported decreased liver GU rates (evaluated using SUV) in patients with liver steatosis [108,109]. A likely explanation to these apparently contrasting results is that increased fat content reduces uptake per liver volume unit as fat does not contribute to GU but uptake per fat-free liver tissue increases [72]. Thus, measuring liver fat content and volume with computed tomography (CT) or MR [110] should be considered when studying liver metabolism with PET as it can be easily performed with combined PET-CT/MR tomographs.
Two recent reports that used compartmental modelling of 18F-FDG in the liver and also evaluated liver histology reported an inverse correlation between hepatic inflammation grades and liver blood flow [111,112]. However, in these studies, only relative indices but not the absolute rate of hepatic glucose uptake (HGU) were assessed.
Recently, Guzzardi et al. studied Zucker rats (thus, a rat model of leptin-receptor deficiency). They reported that liver glucose uptake was proportional to the degree of fat accumulation and tissue inflammation and was able to dissect healthy from NAFLD and NAFLD/NASH livers. However, the most severe NASH livers showed a decline in glucose uptake [113]. Taken together, whether histology-proven NASH in humans is associated with enhanced HGU remains to be proven.

2.9. 11C-Acetate-PET and NAFLD

In a retrospective study of prostatic carcinoma patients, hepatic 11C-acetate uptake was positively associated with CT-measured hepatic fat content [114]. The study showed the potential for 11C-acetate-PET as a diagnostic tool for NAFLD, although the lack of biopsy-based measurement of fat content, a healthy control group and female participants suggest that more thorough investigation is needed to assess whether 11C-acetate-PET would be useful for NAFLD diagnostics.

3. PET Metabolic Tracers in Hepatic Malignancies

3.1. 18F-FDG

18F-FDG PET is an established imaging method used in the oncology setting for staging, restaging and follow-up of a wide spectrum of malignant diseases. Cancer cells usually present with a disorder of one or more glycolytic pathways, including the higher expression of glucose transporters and hexokinase than normal cells [115,116]. The increased glucose metabolism in cancer tissues results in increased 18F-FDG uptake assessed by PET imaging. The degree of uptake is associated with histological characteristics, tumour differentiation and intratumoural alterations [117].

3.2. 18F-FDG in Hepatocellular Carcinoma

The most common primary malignancy that affects the liver is hepatocellular carcinoma (HCC). Accurate staging of HCC is crucial as only patients with small tumours without distant metastases would benefit from liver resection or transplantation as a curative treatment. HCC cells present with varying expression of 18F-FDG uptake due to the lower expression of glucose transporters and hexokinase in well-differentiated tumours compared to other hepatic malignancies [118]. For this reason, the sensitivity of 18F-FDG PET in detecting primary HCC is relatively limited, with reported values of 50–70% [119,120,121]. However, it has been demonstrated that poorly differentiated HCCs show significantly higher glycometabolic activity [119]. In view of this, 18F-FDG PET imaging might have an important prognostic value, reflecting the potential of tumour progression and recurrence [122]. Moreover, 18F-FDG PET has a promising role in staging HCC because of the high accuracy in detecting extrahepatic metastases, which would possibly affect patient management and treatment selection [122,123].

3.3. 18F-FDG in Intrahepatic Cholangiocarcinoma

Intrahepatic cholangiocarcinoma (ICC), a relatively rare neoplasm that arises from the bile duct epithelium, is the second most common primary liver malignancy after HCC. ICC cells have a higher expression of glucose transporter and hexokinase than HCC, resulting in typically high 18F-FDG uptake that is particularly prominent in nodular or mass-forming cholangiocarcinoma [120,124]. ICC tends also to show ring-shaped uptake, corresponding to peripheral rim enhancement visible on CT and/or MRI [124]. 18F-FDG PET has demonstrated to be an accurate diagnostic tool for the detection of occult metastasis or characterization of indeterminate lesions, having a major influence in clinical decision making in patients with ICC [125]. Moreover, 18F-FDG PET imaging has shown high sensitivity in the detection of primary tumour and nodal metastases [125,126].

3.4. 18F-FDG in Liver Metastases

The liver is involved more often with metastatic disease than primary tumours. The main indication of 18F-FDG PET in liver imaging is, in fact, the evaluation of metastasis arising from tumours of the gastrointestinal tract, lung, breast, pancreas and sarcoma [127,128]. Liver metastases are potentially curable with hepatic resection, and their accurate detection and characterization is essential to determine the proper treatment strategy.18F-FDG PET-CT is highly sensitive and specific in diagnosing liver metastases, which generally show high tracer uptake [128]. Moreover, 18F-FDG PET has a prognostic role in follow-up on patients who underwent surgical or ablative procedures, since it is sensitive in detecting residual or recurrent diseases. The liver is the most frequent site of metastases in colorectal cancer (85). There is solid evidence on the performance of 18F-FDG PET in patients with colorectal cancer. Studies have shown greater accuracy than CT or MRI in primary staging and recurrence settings, as well as in the evaluation after local and ablative therapies [129,130,131].
It is worth mentioning that some liver metastases may present with low FDG-uptake. These might include well-differentiated malignancies, such as pancreatic or lung adenocarcinomas [132,133]. Moreover, tumours with cystic or mucinous components might present with reduced metabolic activity due to low cellularity [134]. Figure 5 shows representative 18F-FDG PET images of hepatocellular carcinoma, cholangiocarcinoma and liver metastases.

3.5. 11C-Acetate in Liver Malignances

Despite 18F-FDG being the most successful PET metabolic tracer used in oncology, 11C-acetate has also shown some promising applications in imaging liver malignancies. The incorporation of 11C-acetate in cancer cells is mostly connected to the upregulation of free fatty acid synthesis [135]. Considering the varying sensitivity of 18F-FDG PET in detecting HCC, 11C-acetate might be used as a complementary tracer. Tumour uptake of HCC with both tracers might be correlated to histologic differentiation, as well-differentiated tumours seem to be 11C-acetate-avid, while in poorly differentiated HCC or in more advanced stages, the metabolic substrates in tumour cells shift to glycolysis and, thus, 18F-FDG uptake [136,137]. Moreover, 11C-acetate seems to be specific for the detection of HCC, as cholangiocarcinoma or secondary metastases might not show tracer uptake [136]. Therefore, a dual-tracer approach may be useful in the appropriate staging of HCC tumours and in the differential diagnosis of unknown liver lesions [136,137,138]. These preliminary data are, however, limited, and further studies are needed to assess the potential role of 11C-acetate in this setting.

3.6. Limitation of PET Technology in Imaging Liver Malignancies

The main technology-related limitation of PET imaging in the assessment of liver malignancies is the relatively low sensitivity in detecting small lesions. This is usually related to the spatial resolution of the camera, which is typically 5 mm in current scanners. The limited spatial resolution can lead to a problem with the phenomenon known as partial volume effect, when radioactivity in the volume of interest (VOI) of small lesions (<1 cm in diameter) is detected as being spread to the surrounding tissues, causing an underestimation of activity concentrations in the volume of interest [139]. In addition, VOI may contain also other tissues when the edges of a metabolically active lesion do not coincide with VOI’s voxel contours [139]. The sensitivity of 18F-FDG PET/CT for the detection of HCC according to tumour size has been reported to be 27% for lesions measuring 1–2 cm, whereas the values were 48% and 93% for lesions of 2–5 cm and >5 cm, respectively [140]. Studies have also demonstrated that 18F-FDG PET/CT is accurate in the detection of hepatic metastases >1 cm in diameter; however, sensitivity can decrease significantly in lesions <1 cm [141,142]. Respiratory motion can also limit the detectability of small liver lesions, especially when located in the cranial area of the liver close to the diaphragm. Moreover, technology-specific limitations such as the misregistration of PET and CT datasets, attenuation correction and truncation artefacts could affect the sensitivity of liver-related PET imaging [143].

4. Discussion

PET imaging provides the unique opportunity to study metabolic rates at the tissue level non-invasively. The previous gold standard AV differences technique has been lately abandoned due to its invasive nature and the fact that it could not exclusively assess liver metabolic rates, but the substrate uptake rates from the splanchnic area were reported. A major discrepancy between the AV differences technique and 18F-FDG PET results has been that whereas DeFronzo et al. [144] did not find an effect of insulin on splanchnic GU at 5 mmol/L euglycemia, Immonen et al. [44] reported an increase in hepatic GU from the fasting to the insulin clamp state. Moreover, the GU rates reported in AV differences studies from the splanchnic area would be much higher to those reported with 18F-FDG PET for liver GU. This difference is likely at least partly explained by GU into other splanchnic organs than the liver, which has been shown to be considerable in dogs [42] and humans [145,146,147]. Quantitative PET studies of the liver are complicated by its dual input function. Blood supply from the hepatic artery has the same tracer concentration as all other arteries, with a very sharp curve peak in the case of bolus administration of the tracer. However, most of the blood supply to the liver comes via a portal vein; the tracer is first distributed to the intestines, spleen, pancreas, and gallbladder, and as a result, the concentration peak is dispersed, delayed, and possibly affected by the metabolic processes in splanchnic organs: Depending on the tracer, AUC, or the fraction of label-carrying metabolites, it may be different in arterial blood and portal vein. A study employing continuous 18F-FDG infusion suggested that the continuous delivery may provide more robust estimates of hepatic glucose metabolism than bolus injection [64]. Alternatively, portal input may be measured directly from PET images for studies of liver metabolism [148] if metabolites of the tracer are not released into circulation as is the case with 18F-FDG or if the amount of metabolites is carefully determined [149]. The relatively small diameter of the vein and movement due to breathing render deriving image-based portal vein input function a laborious task to perform manually. Computational methods for (semi)automatic segmentation [150] and the development of motion correction methods [151,152,153] will likely make obtaining image-derived portal vein input function more feasible in the future. It can be speculated that 18F-FDG6P trapping in the liver would reflect the distribution of labour across the liver acinus where periportal hepatocytes are more focused on gluconeogenesis and glucose release, and pericentral hepatocytes focus on glucose uptake and glycolysis [16]. Thus, novel microvascular compartment models taking into account tracer gradients across the sinusoids and tracer backflow and reuptake [154] have potential for detailing the differences in hepatic cellular metabolism in vivo across the liver acinus in the future.
18F-FDG PET/CT is an accurate and sensitive method to assess primary and metastatic liver malignancies, despite some challenges given by the physiological tracer activity in liver tissue and the varying uptake of liver tumours depending on histology [123,130,155]. In the near future, the development of radiomics, a textural analysis of PET images, might provide new information to better characterize liver tumours, predict prognosis and potentially select management strategies [156]. Moreover, the development of more advanced and sensitive PET technology, together with the increasing use of PET/MRI scanners, might improve the early detection of small liver lesions and lead to a better management of oncological patients.
More general limitations to the use of PET for measuring tissue specific metabolism and blood flow include the high cost of tomographs and tracer production as well as the need for highly trained personnel. The radiation dose emitted by the tracers limits the repeated use of PET especially with 18F-FDG. New PET tomographs with a long axial field-of-view (FOV; 70–200 cm) provide intriguing opportunities for measuring the simultaneous metabolism of different organs, enabling a more effective evaluation of inter-tissue dynamics of metabolism. An important limitation of the currently used 15–30 cm FOV PET tomographs has been their poor ability to detect coinciding emitted photons (<1%) due to their narrow FOV. Thus, an important strength of the long axial field-of-view tomographs is their improved sensitivity, which is estimated to be 4–5 times higher with a 200 cm FOV tomograph when imaging a single organ and up to 40 times higher for the entire body compared to conventional tomographs that are currently in use [157]. Depending on the study question, the possibility to record radioactivity signals from various organs simultaneously and the increased sensitivity of the long axial FOV scanners may allow researchers and clinicians to reduce the scanning time or radiopharmaceutical dose considerably [158].

Author Contributions

Writing—original draft preparation, M.-J.H., E.R. and S.M.; writing—review and editing, P.N. All authors have read and agreed to the published version of the manuscript.

Funding

This research received no external funding.

Acknowledgments

The authors thank Vesa Oikonen, for sharing his expertise regarding modelling of PET.

Conflicts of Interest

The authors declare no conflict of interest.

References

  1. Schenk, W.G.; McDonald, J.C.; McDonald, K.; Drapanas, T. Direct measurement of hepatic blood flow in surgical patients: With related observations on hepatic flow dynamics in experimental animals. Ann. Surg. 1962, 156, 463–469. [Google Scholar] [CrossRef] [PubMed]
  2. Pinal-Garcia, D.F.; Nuno-Guzman, C.M.; Gonzalez-Gonzalez, M.E.; Ibarra-Hurtado, T.R. The celiac trunk and its anatomical variations: A cadaveric study. J. Clin. Med. Res. 2018, 10, 321–329. [Google Scholar] [CrossRef] [PubMed] [Green Version]
  3. Sezai, S.; Sakurabayashi, S.; Yamamoto, Y.; Morita, T.; Hirano, M.; Oka, H. Hepatic arterial and portal venous oxygen content and extraction in liver cirrhosis. Liver 1993, 13, 31–35. [Google Scholar] [CrossRef] [PubMed]
  4. Wild, S.L.; Elghajiji, A.; Grimaldos Rodriguez, C.; Weston, S.D.; Burke, Z.D.; Tosh, D. The canonical wnt pathway as a key regulator in liver development, differentiation and homeostatic renewal. Genes 2020, 11, 1163. [Google Scholar] [CrossRef]
  5. Kang, Y.B.A.; Eo, J.; Mert, S.; Yarmush, M.L.; Usta, O.B. Metabolic patterning on a chip: Towards in vitro liver zonation of primary rat and human hepatocytes. Sci. Rep. 2018, 8, 8951. [Google Scholar] [CrossRef]
  6. Koffert, J.; Honka, H.; Teuho, J.; Kauhanen, S.; Hurme, S.; Parkkola, R.; Oikonen, V.; Mari, A.; Lindqvist, A.; Wierup, N.; et al. Effects of meal and incretins in the regulation of splanchnic blood flow. Endocr. Connect. 2017, 6, 179–187. [Google Scholar] [CrossRef] [Green Version]
  7. Someya, N.; Endo, M.Y.; Fukuba, Y.; Hayashi, N. Blood flow responses in celiac and superior mesenteric arteries in the initial phase of digestion. Am. J. Physiol. Regul. Integr. Comp. Physiol. 2008, 294, R1790–R1796. [Google Scholar] [CrossRef]
  8. Madsen, J.L.; Søndergaard, S.B.; Møller, S. Meal-induced changes in splanchnic blood flow and oxygen uptake in middle-aged healthy humans. Scand. J. Gastroenterol. 2006, 41, 87–92. [Google Scholar] [CrossRef]
  9. Ekataksin, W. The isolated artery: An intrahepatic arterial pathway that can bypass the lobular parenchyma in mammalian livers. Hepatology 2000, 31, 269–279. [Google Scholar] [CrossRef]
  10. Ben-Moshe, S.; Itzkovitz, S. Spatial heterogeneity in the mammalian liver. Nat. Rev. Gastroenterol. Hepatol. 2019, 16, 395–410. [Google Scholar] [CrossRef]
  11. Berndt, N.; Kolbe, E.; Gajowski, R.; Eckstein, J.; Ott, F.; Meierhofer, D.; Holzhütter, H.-G.; Matz-Soja, M. Functional consequences of metabolic zonation in murine livers: Insights for an old story. Hepatology 2021, 73, 795–810. [Google Scholar] [CrossRef] [PubMed] [Green Version]
  12. Droin, C.; Kholtei, J.E.; Bahar Halpern, K.; Hurni, C.; Rozenberg, M.; Muvkadi, S.; Itzkovitz, S.; Naef, F. Space-time logic of liver gene expression at sub-lobular scale. Nat. Metab. 2021, 3, 43–58. [Google Scholar] [CrossRef] [PubMed]
  13. Gebhardt, R.; Matz-Soja, M. Liver zonation: Novel aspects of its regulation and its impact on homeostasis. World J. Gastroenterol. 2014, 20, 8491–8504. [Google Scholar] [CrossRef] [PubMed]
  14. Schleicher, J.; Tokarski, C.; Marbach, E.; Matz-Soja, M.; Zellmer, S.; Gebhardt, R.; Schuster, S. Zonation of hepatic fatty acid metabolism—The diversity of its regulation and the benefit of modeling. Biochim. Biophys. Acta BBA—Mol. Cell Biol. Lipids 2015, 1851, 641–656. [Google Scholar] [CrossRef]
  15. Guzmán, M.; Bijleveld, C.; Geelen, M.J. Flexibility of zonation of fatty acid oxidation in rat liver. Biochem. J. 1995, 311, 853–860. [Google Scholar] [CrossRef] [Green Version]
  16. Kietzmann, T. Metabolic zonation of the liver: The oxygen gradient revisited. Redox Biol. 2017, 11, 622–630. [Google Scholar] [CrossRef]
  17. Tygstrup, N.; Winkler, K.; Mellemgaard, K.; Andreassen, M. Determination of the hepatic arterial blood flow and oxygen supply in man by clamping the hepatic artery during surgery. J. Clin. Investig. 1962, 41, 447–454. [Google Scholar] [CrossRef] [Green Version]
  18. Brooks, A.J.; Eastwood, J.; Beckingham, I.J.; Girling, K.J. Liver tissue partial pressure of oxygen and carbon dioxide during partial hepatectomy. Br. J. Anaesth. 2004, 92, 735–737. [Google Scholar] [CrossRef] [Green Version]
  19. Brooks, A.J.; Hammond, J.S.; Girling, K.; Beckingham, I.J. The effect of hepatic vascular inflow occlusion on liver tissue PH, carbon dioxide, and oxygen partial pressures: Defining the optimal clamp/release regime for intermittent portal clamping. J. Surg. Res. 2007, 141, 247–251. [Google Scholar] [CrossRef]
  20. Leary, T.S.; Klinck, J.R.; Hayman, G.; Friend, P.; Jamieson, N.V.; Gupta, A.K. Measurement of liver tissue oxygenation after orthotopic liver transplantation using a multiparameter sensor. Anaesthesia 2002, 57, 1128–1133. [Google Scholar] [CrossRef]
  21. Kolbe, E.; Aleithe, S.; Rennert, C.; Spormann, L.; Ott, F.; Meierhofer, D.; Gajowski, R.; Stöpel, C.; Hoehme, S.; Kücken, M.; et al. Mutual zonated interactions of Wnt and Hh signaling are orchestrating the metabolism of the adult liver in mice and human. Cell Rep. 2019, 29, 4553–4567.e7. [Google Scholar] [CrossRef] [PubMed] [Green Version]
  22. Cheng, X.; Kim, S.Y.; Okamoto, H.; Xin, Y.; Yancopoulos, G.D.; Murphy, A.J.; Gromada, J. Glucagon contributes to liver zonation. Proc. Natl. Acad. Sci. USA 2018, 115, E4111–E4119. [Google Scholar] [CrossRef] [PubMed] [Green Version]
  23. Rui, L. Energy metabolism in the liver. Compr. Physiol. 2014, 4, 177–197. [Google Scholar] [CrossRef] [Green Version]
  24. Havel, R.J.; Kane, J.P.; Balasse, E.O.; Segel, N.; Basso, L.V. Splanchnic metabolism of free fatty acids and production of triglycerides of very low density lipoproteins in normotriglyceridemic and hypertriglyceridemic humans. J. Clin. Investig. 1970, 49, 2017–2035. [Google Scholar] [CrossRef] [PubMed]
  25. Müller, M.J. Hepatic energy and substrate metabolism: A possible metabolic basis for early nutritional support in cirrhotic patients. Nutrition 1998, 14, 30–38. [Google Scholar] [CrossRef]
  26. Hodson, L.; Bickerton, A.S.T.; McQuaid, S.E.; Roberts, R.; Karpe, F.; Frayn, K.N.; Fielding, B.A. The contribution of splanchnic fat to VLDL triglyceride is greater in insulin-resistant than insulin-sensitive men and women: Studies in the postprandial state. Diabetes 2007, 56, 2433–2441. [Google Scholar] [CrossRef] [Green Version]
  27. Evans, K.; Burdge, G.C.; Wootton, S.A.; Collins, J.M.; Clark, M.L.; Tan, G.D.; Karpe, F.; Frayn, K.N. Tissue-specific stable isotope measurements of postprandial lipid metabolism in familial combined hyperlipidaemia. Atherosclerosis 2008, 197, 164–170. [Google Scholar] [CrossRef]
  28. Sidossis, L.S.; Mittendorfer, B.; Chinkes, D.; Walser, E.; Wolfe, R.R. Effect of hyperglycemia-hyperinsulinemia on whole body and regional fatty acid metabolism. Am. J. Physiol. Endocrinol. Metab. 1999, 276, E427–E434. [Google Scholar] [CrossRef]
  29. Jensen, M.D.; Johnson, C.M.; Cryer, P.E.; Murray, M.J. Thermogenesis after a mixed meal: Role of leg and splanchnic tissues in men and women. Am. J. Physiol. Endocrinol. Metab. 1995, 268, E433–E438. [Google Scholar] [CrossRef]
  30. Hui, S.; Cowan, A.J.; Zeng, X.; Yang, L.; TeSlaa, T.; Li, X.; Bartman, C.; Zhang, Z.; Jang, C.; Wang, L.; et al. Quantitative fluxomics of circulating metabolites. Cell Metab. 2020, 32, 676–688.e4. [Google Scholar] [CrossRef]
  31. Moore, M.C.; Coate, K.C.; Winnick, J.J.; An, Z.; Cherrington, A.D. Regulation of hepatic glucose uptake and storage in vivo. Adv. Nutr. 2012, 3, 286–294. [Google Scholar] [CrossRef] [PubMed] [Green Version]
  32. Petersen, K.F.; Cline, G.W.; Gerard, D.P.; Magnusson, I.; Rothman, D.L.; Shulman, G.I. Contribution of net hepatic glycogen synthesis to disposal of an oral glucose load in humans. Metabolism 2001, 50, 598–601. [Google Scholar] [CrossRef] [PubMed]
  33. Mitrakou, A.; Jones, R.; Okuda, Y.; Pena, J.; Nurjhan, N.; Field, J.B.; Gerich, J.E. Pathway and carbon sources for hepatic glycogen repletion in dogs. Am. J. Physiol. Endocrinol. Metab. 1991, 260, E194–E202. [Google Scholar] [CrossRef]
  34. Taylor, R.; Magnusson, I.; Rothman, D.L.; Cline, G.W.; Caumo, A.; Cobelli, C.; Shulman, G.I. Direct assessment of liver glycogen storage by 13C nuclear magnetic resonance spectroscopy and regulation of glucose homeostasis after a mixed meal in normal subjects. J. Clin. Investig. 1996, 97, 126–132. [Google Scholar] [CrossRef] [PubMed]
  35. Hwang, J.H.; Perseghin, G.; Rothman, D.L.; Cline, G.W.; Magnusson, I.; Petersen, K.F.; Shulman, G.I. Impaired Net Hepatic Glycogen Synthesis in Insulin-Dependent Diabetic Subjects during Mixed Meal Ingestion. A 13C Nuclear Magnetic Resonance Spectroscopy Study. Available online: https://www.jci.org/articles/view/117727/pdf (accessed on 17 January 2022).
  36. Alsahli, M.; Shrayyef, M.Z.; Gerich, J.E. Normal glucose homeostasis. In Principles of Diabetes Mellitus; Poretsky, L., Ed.; Springer International Publishing: Cham, Switzerland, 2017; pp. 23–42. ISBN 978-3-319-18741-9. [Google Scholar]
  37. Katz, J.; Tayek, J.A. Gluconeogenesis and the Cori cycle in 12-, 20-, and 40-h-fasted humans. Am. J. Physiol. Endocrinol. Metab. 1998, 275, E537–E542. [Google Scholar] [CrossRef]
  38. Landau, B.R.; Wahren, J.; Chandramouli, V.; Schumann, W.C.; Ekberg, K.; Kalhan, S.C. Contributions of gluconeogenesis to glucose production in the fasted state. J. Clin. Investig. 1996, 98, 378–385. [Google Scholar] [CrossRef] [Green Version]
  39. Magnusson, I.; Rothman, D.L.; Katz, L.D.; Shulman, R.G.; Shulman, G.I. Increased rate of gluconeogenesis in type II diabetes mellitus. A 13C nuclear magnetic resonance study. J. Clin. Investig. 1992, 90, 1323–1327. [Google Scholar] [CrossRef]
  40. Rothman, D.L.; Magnusson, I.; Katz, L.D.; Shulman, R.G.; Shulman, G.I. Quantitation of hepatic glycogenolysis and gluconeogenesis in fasting humans with 13C NMR. Science 1991, 254, 573–576. [Google Scholar] [CrossRef]
  41. Zierler, K.L. Theory of the use of arteriovenous concentration differences for measuring metabolism in steady and non-steady states. J. Clin. Investig. 1961, 40, 2111–2125. [Google Scholar] [CrossRef] [Green Version]
  42. Defronzo, R.A. 4 use of the splanchnic/hepatic balance technique in the study of glucose metabolism. Baillière’s Clin. Endocrinol. Metab. 1987, 1, 837–862. [Google Scholar] [CrossRef]
  43. Honka, M.-J.; Latva-Rasku, A.; Bucci, M.; Virtanen, K.A.; Hannukainen, J.C.; Kalliokoski, K.K.; Nuutila, P. Insulin-stimulated glucose uptake in skeletal muscle, adipose tissue and liver: A positron emission tomography study. Eur. J. Endocrinol. 2018, 178, 523–531. [Google Scholar] [CrossRef] [PubMed]
  44. Immonen, H.; Hannukainen, J.C.; Iozzo, P.; Soinio, M.; Salminen, P.; Saunavaara, V.; Borra, R.; Parkkola, R.; Mari, A.; Lehtimäki, T.; et al. Effect of bariatric surgery on liver glucose metabolism in morbidly obese diabetic and non-diabetic patients. J. Hepatol. 2014, 60, 377–383. [Google Scholar] [CrossRef] [PubMed]
  45. Sala-Rabanal, M.; Hirayama, B.A.; Ghezzi, C.; Liu, J.; Huang, S.-C.; Kepe, V.; Koepsell, H.; Yu, A.; Powell, D.R.; Thorens, B.; et al. Revisiting the physiological roles of SGLTs and GLUT.Ts using positron emission tomography in mice. J. Physiol. 2016, 594, 4425–4438. [Google Scholar] [CrossRef] [PubMed]
  46. Barrio, J.R.; Huang, S.-C.; Satyamurthy, N.; Scafoglio, C.S.; Yu, A.S.; Alavi, A.; Krohn, K.A. Does 2-FDG PET accurately reflect quantitative in vivo glucose utilization? J. Nucl. Med. 2020, 61, 931–937. [Google Scholar] [CrossRef] [PubMed]
  47. Chou, J.Y.; Jun, H.S.; Mansfield, B.C. The SLC37 family of phosphate-linked sugar phosphate antiporters. Mol. Asp. Med. 2013, 34, 601–611. [Google Scholar] [CrossRef] [PubMed] [Green Version]
  48. Kanazawa, Y.; Umayahara, K.; Shimmura, T.; Yamashita, T. 19F NMR of 2-deoxy-2-fluoro-D-glucose for tumor diagnosis in mice. An NDP-bound hexose analog as a new NMR target for imaging. NMR Biomed. 1997, 10, 35–41. [Google Scholar] [CrossRef]
  49. Bender, D.; Munk, O.L.; Feng, H.-Q.; Keiding, S. Metabolites of 18F-FDG and 3-O-11C-methylglucose in pig liver. J. Nucl. Med. 2001, 42, 1673–1678. [Google Scholar]
  50. Iozzo, P.; Jarvisalo, M.J.; Kiss, J.; Borra, R.; Naum, G.A.; Viljanen, A.; Viljanen, T.; Gastaldelli, A.; Buzzigoli, E.; Guiducci, L.; et al. Quantification of liver glucose metabolism by positron emission tomography: Validation study in pigs. Gastroenterology 2007, 132, 531–542. [Google Scholar] [CrossRef]
  51. Southworth, R.; Parry, C.R.; Parkes, H.G.; Medina, R.A.; Garlick, P.B. Tissue-specific differences in 2-fluoro-2-deoxyglucose metabolism beyond FDG-6-P: A 19F NMR spectroscopy study in the rat. NMR Biomed. 2003, 16, 494–502. [Google Scholar] [CrossRef]
  52. Rokka, J.; Grönroos, T.J.; Viljanen, T.; Solin, O.; Haaparanta-Solin, M. HPLC and TLC methods for analysis of [18F] FDG and its metabolites from biological samples. J. Chromatogr. B 2017, 1048, 140–149. [Google Scholar] [CrossRef]
  53. Iozzo, P.; Geisler, F.; Oikonen, V.; Mäki, M.; Takala, T.; Solin, O.; Ferrannini, E.; Knuuti, J.; Nuutila, P. Insulin stimulates liver glucose uptake in humans: An 18F-FDG PET study. J. Nucl. Med. 2003, 44, 682–689. [Google Scholar] [PubMed]
  54. Rijzewijk, L.J.; van der Meer, R.W.; Lubberink, M.; Lamb, H.J.; Romijn, J.A.; de Roos, A.; Twisk, J.W.; Heine, R.J.; Lammertsma, A.A.; Smit, J.W.A.; et al. Liver fat content in type 2 diabetes: Relationship with hepatic perfusion and substrate metabolism. Diabetes 2010, 59, 2747–2754. [Google Scholar] [CrossRef] [PubMed] [Green Version]
  55. Van der Weerdt, A.P.; Klein, L.J.; Visser, C.A.; Visser, F.C.; Lammertsma, A.A. Use of arterialised venous instead of arterial blood for measurement of myocardial glucose metabolism during euglycaemic-hyperinsulinaemic clamping. Eur. J. Nucl. Med. 2002, 29, 663–669. [Google Scholar] [CrossRef] [PubMed]
  56. Phelps, M.E.; Huang, S.C.; Hoffman, E.J.; Selin, C.; Sokoloff, L.; Kuhl, D.E. Tomographic measurement of local cerebral glucose metabolic rate in humans with (F-18)2-fluoro-2-deoxy-D-glucose: Validation of method. Ann. Neurol. 1979, 6, 371–388. [Google Scholar] [CrossRef] [PubMed]
  57. Keiding, S. Bringing physiology into PET of the liver. J. Nucl. Med. 2012, 53, 425–433. [Google Scholar] [CrossRef] [Green Version]
  58. Munk, O.L.; Bass, L.; Roelsgaard, K.; Bender, D.; Hansen, S.B.; Keiding, S. Liver kinetics of glucose analogs measured in pigs by PET: Importance of dual-input blood sampling. J. Nucl. Med. 2001, 42, 795–801. [Google Scholar]
  59. Winterdahl, M.; Munk, O.L.; Sørensen, M.; Mortensen, F.V.; Keiding, S. Hepatic blood perfusion measured by 3-min dynamic 18F-FDG PET in pigs. J. Nucl. Med. 2011, 52, 1119–1124. [Google Scholar] [CrossRef] [Green Version]
  60. Winterdahl, M.; Keiding, S.; Sørensen, M.; Mortensen, F.V.; Alstrup, A.K.O.; Munk, O.L. Tracer input for kinetic modelling of liver physiology determined without sampling portal venous blood in pigs. Eur. J. Nucl. Med. Mol. Imaging 2011, 38, 263–270. [Google Scholar] [CrossRef] [Green Version]
  61. Ackerman, N.B. Experimental studies on the circulatory dynamics of intrahepatic tumor blood supply. Cancer 1972, 29, 435–439. [Google Scholar] [CrossRef]
  62. Fukuda, K.; Taniguchi, H.; Koh, T.; Kunishima, S.; Yamagishi, H. Relationships between oxygen and glucose metabolism in human liver tumours: Positron emission tomography using 15O and 18F-deoxyglucose. Nucl. Med. Commun. 2004, 25, 577–583. [Google Scholar] [CrossRef]
  63. Breedis, C.; Young, G. The blood supply of neoplasms in the liver. Am. J. Pathol. 1954, 30, 969–985. [Google Scholar] [PubMed]
  64. Trägårdh, M.; Møller, N.; Sørensen, M. Methodologic considerations for quantitative 18F-FDG PET/CT studies of hepatic glucose metabolism in healthy subjects. J. Nucl. Med. 2015, 56, 1366–1371. [Google Scholar] [CrossRef] [PubMed] [Green Version]
  65. Reivich, M.; Alavi, A.; Wolf, A.; Fowler, J.; Russell, J.; Arnett, C.; MacGregor, R.R.; Shiue, C.Y.; Atkins, H.; Anand, A.; et al. Glucose metabolic rate kinetic model parameter determination in humans: The lumped constants and rate constants for [18F] fluorodeoxyglucose and [11C] deoxyglucose. J. Cereb. Blood Flow Metab. 1985, 5, 179–192. [Google Scholar] [CrossRef] [PubMed] [Green Version]
  66. Wu, H.-M.; Bergsneider, M.; Glenn, T.C.; Yeh, E.; Hovda, D.A.; Phelps, M.E.; Huang, S.-C. Measurement of the global lumped constant for 2-deoxy-2-[18F] fluoro-D-glucose in normal human brain using [15O] water and 2-deoxy-2-[18F] fluoro-D-glucose positron emission tomography imaging: A method with validation based on multiple methodologies. Mol. Imaging Biol. 2003, 5, 32–41. [Google Scholar] [CrossRef]
  67. Keiding, S. How should lumped constant be estimated for hepatic 18F-FDG glucose in humans? J. Nucl. Med. 2015, 56, 1302–1303. [Google Scholar] [CrossRef] [Green Version]
  68. Keiding, S.; Sørensen, M.; Frisch, K.; Gormsen, L.C.; Munk, O.L. Quantitative PET of liver functions. Am. J. Nucl. Med. Mol. Imaging 2018, 8, 73–85. [Google Scholar]
  69. Patlak, C.S.; Blasberg, R.G. Graphical evaluation of blood-to-brain transfer constants from multiple-time uptake data. Generalizations. J. Cereb. Blood Flow Metab. 1985, 5, 584–590. [Google Scholar] [CrossRef] [Green Version]
  70. Patlak, C.S.; Blasberg, R.G.; Fenstermacher, J.D. Graphical evaluation of blood-to-brain transfer constants from multiple-time uptake data. J. Cereb. Blood Flow Metab. 1983, 3, 1–7. [Google Scholar] [CrossRef]
  71. Lammertsma, A.A.; Brooks, D.J.; Frackowiak, R.S.J.; Beaney, R.P.; Herold, S.; Heather, J.D.; Palmer, A.J.; Jones, T. Measurement of glucose utilisation with [18F] 2-fluoro-2-deoxy-d-glucose: A comparison of different analytical methods. J. Cereb. Blood Flow Metab. 1987, 7, 161–172. [Google Scholar] [CrossRef]
  72. Keramida, G.; Hunter, J.; Peters, A.M. Hepatic glucose utilization in hepatic steatosis and obesity. Biosci. Rep. 2016, 36, e00402. [Google Scholar] [CrossRef]
  73. Thie, J.A. Clarification of a fractional uptake concept. J. Nucl. Med. 1995, 36, 711–712. [Google Scholar] [PubMed]
  74. Oikonen, V. Fractional Uptake Rate (FUR). Available online: http://www.turkupetcentre.net/petanalysis/model_fur.html (accessed on 5 February 2022).
  75. Keyes, J.W. SUV: Standard uptake or silly useless value? J. Nucl. Med. 1995, 36, 1836–1839. [Google Scholar] [PubMed]
  76. Bach-Gansmo, T.; Dybvik, J.; Adamsen, T.; Naum, A. Variation in urinary excretion of FDG, yet another uncertainty in quantitative PET. Acta Radiol. Short Rep. 2012, 1, 120038. [Google Scholar] [CrossRef] [PubMed]
  77. Cysouw, M.C.F.; Jansen, B.H.E.; Yaqub, M.; Voortman, J.; Vis, A.N.; van Moorselaar, R.J.A.; Hoekstra, O.S.; Boellaard, R.; Oprea-Lager, D.E. Letter to the editor Re: Semiquantitative parameters in PSMA-targeted PET imaging with [18F] DCFPyL: Impact of tumor burden on normal organ uptake. Mol. Imaging Biol. 2020, 22, 15–17. [Google Scholar] [CrossRef]
  78. Bertoldo, A.; Rizzo, G.; Veronese, M. Deriving physiological information from PET images: From SUV to Compartmental modelling. Clin. Transl. Imaging 2014, 2, 239–251. [Google Scholar] [CrossRef] [Green Version]
  79. Van den Hoff, J.; Oehme, L.; Schramm, G.; Maus, J.; Lougovski, A.; Petr, J.; Beuthien-Baumann, B.; Hofheinz, F. The PET-derived tumor-to-blood standard uptake ratio (SUR) is superior to tumor SUV as a surrogate parameter of the metabolic rate of FDG. EJNMMI Res. 2013, 3, 77. [Google Scholar] [CrossRef] [Green Version]
  80. Iozzo, P.; Gastaldelli, A.; Järvisalo, M.J.; Kiss, J.; Borra, R.; Buzzigoli, E.; Viljanen, A.; Naum, G.; Viljanen, T.; Oikonen, V.; et al. 18F-FDG assessment of glucose disposal and production rates during fasting and insulin stimulation: A validation study. J. Nucl. Med. 2006, 47, 1016–1022. [Google Scholar]
  81. Rebelos, E.; Immonen, H.; Bucci, M.; Hannukainen, J.C.; Nummenmaa, L.; Honka, M.-J.; Soinio, M.; Salminen, P.; Ferrannini, E.; Iozzo, P.; et al. Brain glucose uptake is associated with endogenous glucose production in obese patients before and after bariatric surgery and predicts metabolic outcome at follow-up. Diabetes Obes. Metab. 2019, 21, 218–226. [Google Scholar] [CrossRef]
  82. DeFronzo, R.A.; Tobin, J.D.; Andres, R. Glucose clamp technique: A method for quantifying insulin secretion and resistance. Am. J. Physiol. 1979, 237, E214–E223. [Google Scholar] [CrossRef]
  83. Iozzo, P.; Hallsten, K.; Oikonen, V.; Virtanen, K.A.; Kemppainen, J.; Solin, O.; Ferrannini, E.; Knuuti, J.; Nuutila, P. Insulin-mediated hepatic glucose uptake is impaired in type 2 diabetes: Evidence for a relationship with glycemic control. J. Clin. Endocrinol. Metab. 2003, 88, 2055–2060. [Google Scholar] [CrossRef] [Green Version]
  84. Basu, A.; Basu, R.; Shah, P.; Vella, A.; Johnson, C.M.; Nair, K.S.; Jensen, M.D.; Schwenk, W.F.; Rizza, R.A. Effects of type 2 diabetes on the ability of insulin and glucose to regulate splanchnic and muscle glucose metabolism: Evidence for a defect in hepatic glucokinase activity. Diabetes 2000, 49, 272–283. [Google Scholar] [CrossRef] [PubMed] [Green Version]
  85. Basu, A.; Basu, R.; Shah, P.; Vella, A.; Johnson, C.M.; Jensen, M.; Nair, K.S.; Schwenk, W.F.; Rizza, R.A. Type 2 diabetes impairs splanchnic uptake of glucose but does not alter intestinal glucose absorption during enteral glucose feeding: Additional evidence for a defect in hepatic glucokinase activity. Diabetes 2001, 50, 1351–1362. [Google Scholar] [CrossRef] [PubMed] [Green Version]
  86. Krssak, M.; Brehm, A.; Bernroider, E.; Anderwald, C.; Nowotny, P.; Man, C.D.; Cobelli, C.; Cline, G.W.; Shulman, G.I.; Waldhäusl, W.; et al. Alterations in postprandial hepatic glycogen metabolism in type 2 diabetes. Diabetes 2004, 53, 3048–3056. [Google Scholar] [CrossRef] [PubMed] [Green Version]
  87. Nozaki, Y.; Petersen, M.C.; Zhang, D.; Vatner, D.F.; Perry, R.J.; Abulizi, A.; Haedersdal, S.; Zhang, X.-M.; Butrico, G.M.; Samuel, V.T.; et al. Metabolic control analysis of hepatic glycogen synthesis in vivo. Proc. Natl. Acad. Sci. USA 2020, 117, 8166–8176. [Google Scholar] [CrossRef] [PubMed] [Green Version]
  88. Ruotsalainen, U.; Raitakari, M.; Nuutila, P.; Oikonen, V.; Sipilä, H.; Teräs, M.; Knuuti, M.J.; Bloomfield, P.M.; Iida, H. Quantitative blood flow measurement of skeletal muscle using oxygen-15-water and PET. J. Nucl. Med. 1997, 38, 314–319. [Google Scholar]
  89. Kudomi, N.; Slimani, L.; Järvisalo, M.J.; Kiss, J.; Lautamäki, R.; Naum, G.A.; Savunen, T.; Knuuti, J.; Iida, H.; Nuutila, P.; et al. Non-invasive estimation of hepatic blood perfusion from H215O-PET images using tissue-derived arterial and portal input functions. Eur. J. Nucl. Med. Mol. Imaging 2008, 35, 1899–1911. [Google Scholar] [CrossRef] [Green Version]
  90. Ziegler, S.I.; Haberkorn, U.; Byrne, H.; Tong, C.; Schosser, R.; Krieter, H.; Kaja, S.; Richolt, J.A.; Lammertsma, A.A.; Price, P. Measurement of liver blood flow using oxygen-15 labelled water and dynamic positron emission tomography: Limitations of model description. Eur. J. Nucl. Med. 1996, 23, 169–177. [Google Scholar] [CrossRef]
  91. Slimani, L.; Kudomi, N.; Oikonen, V.; Jarvisalo, M.; Kiss, J.; Naum, A.; Borra, R.; Viljanen, A.; Sipila, H.; Ferrannini, E.; et al. Quantification of liver perfusion with [15O] H2O-PET and its relationship with glucose metabolism and substrate levels. J. Hepatol. 2008, 48, 974–982. [Google Scholar] [CrossRef] [Green Version]
  92. Immonen, H.; Hannukainen, J.C.; Kudomi, N.; Pihlajamäki, J.; Saunavaara, V.; Laine, J.; Salminen, P.; Lehtimäki, T.; Pham, T.; Iozzo, P.; et al. Increased liver fatty acid uptake is partly reversed and liver fat content normalized after bariatric surgery. Diabetes Care 2018, 41, 368–371. [Google Scholar] [CrossRef] [Green Version]
  93. Honka, H.; Koffert, J.; Kauhanen, S.; Kudomi, N.; Hurme, S.; Mari, A.; Lindqvist, A.; Wierup, N.; Parkkola, R.; Groop, L.; et al. Liver blood dynamics after bariatric surgery: The effects of mixed-meal test and incretin infusions. Endocr. Connect. 2018, 7, 888–896. [Google Scholar] [CrossRef] [Green Version]
  94. Kiss, J.; Naum, A.; Kudomi, N.; Knuuti, J.; Iozzo, P.; Savunen, T.; Nuutila, P. Non-invasive diagnosis of acute mesenteric ischaemia using PET. Eur. J. Nucl. Med. Mol. Imaging 2009, 36, 1338. [Google Scholar] [CrossRef] [PubMed]
  95. Hodson, L.; Skeaff, C.M.; Fielding, B.A. Fatty acid composition of adipose tissue and blood in humans and its use as a biomarker of dietary intake. Prog. Lipid Res. 2008, 47, 348–380. [Google Scholar] [CrossRef] [PubMed]
  96. Iozzo, P.; Bucci, M.; Roivainen, A.; Någren, K.; Järvisalo, M.J.; Kiss, J.; Guiducci, L.; Fielding, B.; Naum, A.G.; Borra, R.; et al. Fatty acid metabolism in the liver, measured by positron emission tomography, is increased in obese individuals. Gastroenterology 2010, 139, 846–856.e6. [Google Scholar] [CrossRef] [PubMed]
  97. DeGrado, T.R.; Coenen, H.H.; Stöcklin, G. 14(R,S)-[18F] fluoro-6-thia-heptadecanoic acid (FTHA): Evaluation in mouse of a new probe of myocardial utilization of long chain fatty acids. J. Nucl. Med. 1991, 32, 1888–1896. [Google Scholar]
  98. Guiducci, L.; Grönroos, T.; Järvisalo, M.J.; Kiss, J.; Viljanen, A.; Naum, A.G.; Viljanen, T.; Savunen, T.; Knuuti, J.; Ferrannini, E.; et al. Biodistribution of the fatty acid analogue 18F-FTHA: Plasma and tissue partitioning between lipid pools during fasting and hyperinsulinemia. J. Nucl. Med. 2007, 48, 455–462. [Google Scholar]
  99. Ci, X.; Frisch, F.; Lavoie, F.; Germain, P.; Lecomte, R.; van Lier, J.E.; Bénard, F.; Carpentier, A.C. The effect of insulin on the intracellular distribution of 14(R,S)-[18F] fluoro-6-thia-heptadecanoic acid in rats. Mol. Imaging Biol. 2006, 8, 237–244. [Google Scholar] [CrossRef]
  100. Iozzo, P.; Turpeinen, A.K.; Takala, T.; Oikonen, V.; Solin, O.; Ferrannini, E.; Nuutila, P.; Knuuti, J. Liver uptake of free fatty acids in vivo in humans as determined with 14(R,S)-[18F] fluoro-6-thia-heptadecanoic acid and PET. Eur. J. Nucl. Med. Mol. Imaging 2003, 30, 1160–1164. [Google Scholar] [CrossRef]
  101. Viljanen, A.P.M.; Iozzo, P.; Borra, R.; Kankaanpää, M.; Karmi, A.; Lautamäki, R.; Järvisalo, M.; Parkkola, R.; Rönnemaa, T.; Guiducci, L.; et al. Effect of weight loss on liver free fatty acid uptake and hepatic insulin resistance. J. Clin. Endocrinol. Metab. 2009, 94, 50–55. [Google Scholar] [CrossRef] [Green Version]
  102. Oldgren, J.; Laurila, S.; Åkerblom, A.; Latva-Rasku, A.; Rebelos, E.; Isackson, H.; Saarenhovi, M.; Eriksson, O.; Heurling, K.; Johansson, E.; et al. Effects of 6 weeks of treatment with dapagliflozin, a sodium-glucose co-transporter-2 inhibitor, on myocardial function and metabolism in patients with type 2 diabetes: A randomized, placebo-controlled, exploratory study. Diabetes Obes. Metab. 2021, 23, 1505–1517. [Google Scholar] [CrossRef]
  103. Klein, L.J.; Visser, F.C.; Knaapen, P.; Peters, J.H.; Teule, G.J.J.; Visser, C.A.; Lammertsma, A.A. Carbon-11 acetate as a tracer of myocardial oxygen consumption. Eur. J. Nucl. Med. 2001, 28, 651–668. [Google Scholar] [CrossRef]
  104. Eslam, M.; Newsome, P.N.; Sarin, S.K.; Anstee, Q.M.; Targher, G.; Romero-Gomez, M.; Zelber-Sagi, S.; Wai-Sun Wong, V.; Dufour, J.-F.; Schattenberg, J.M.; et al. A new definition for metabolic dysfunction-associated fatty liver disease: An international expert consensus statement. J. Hepatol. 2020, 73, 202–209. [Google Scholar] [CrossRef] [PubMed]
  105. Younossi, Z.; Stepanova, M.; Ong, J.P.; Jacobson, I.M.; Bugianesi, E.; Duseja, A.; Eguchi, Y.; Wong, V.W.; Negro, F.; Yilmaz, Y.; et al. Nonalcoholic steatohepatitis is the fastest growing cause of hepatocellular carcinoma in liver transplant candidates. Clin. Gastroenterol. Hepatol. 2019, 17, 748–755.e3. [Google Scholar] [CrossRef] [PubMed] [Green Version]
  106. Rebelos, E.; Iozzo, P.; Guzzardi, M.A.; Brunetto, M.R.; Bonino, F. Brain-gut-liver interactions across the spectrum of insulin resistance in metabolic fatty liver disease. World J. Gastroenterol. 2021, 27, 4999–5018. [Google Scholar] [CrossRef] [PubMed]
  107. Keramida, G.; Potts, J.; Bush, J.; Dizdarevic, S.; Peters, A.M. Hepatic steatosis is associated with increased hepatic FDG uptake. Eur. J. Radiol. 2014, 83, 751–755. [Google Scholar] [CrossRef]
  108. Lin, C.-Y.; Lin, W.-Y.; Lin, C.-C.; Shih, C.-M.; Jeng, L.-B.; Kao, C.-H. The negative impact of fatty liver on maximum standard uptake value of liver on FDG PET. Clin. Imaging 2011, 35, 437–441. [Google Scholar] [CrossRef]
  109. Abikhzer, G.; Alabed, Y.Z.; Azoulay, L.; Assayag, J.; Rush, C. Altered hepatic metabolic activity in patients with hepatic steatosis on FDG PET/CT. Am. J. Roentgenol. 2011, 196, 176–180. [Google Scholar] [CrossRef]
  110. Goceri, E.; Shah, Z.K.; Layman, R.; Jiang, X.; Gurcan, M.N. Quantification of liver fat: A comprehensive review. Comput. Biol. Med. 2016, 71, 174–189. [Google Scholar] [CrossRef] [PubMed]
  111. Wang, G.; Corwin, M.T.; Olson, K.A.; Badawi, R.D.; Sarkar, S. Dynamic PET of human liver inflammation: Impact of kinetic modeling with optimization-derived dual-blood input function. Phys. Med. Biol. 2018, 63, 155004. [Google Scholar] [CrossRef]
  112. Sarkar, S.; Corwin, M.T.; Olson, K.A.; Stewart, S.L.; Liu, C.-H.; Badawi, R.D.; Wang, G. Pilot study to diagnose nonalcoholic steatohepatitis with dynamic 18F-FDG PET. Am. J. Roentgenol. 2019, 212, 529–537. [Google Scholar] [CrossRef]
  113. Guzzardi, M.A.; Guiducci, L.; Campani, D.; la Rosa, F.; Cacciato Insilla, A.; Bartoli, A.; Cabiati, M.; de Sena, V.; del Ry, S.; Burchielli, S.; et al. Leptin resistance before and after obesity: Evidence that tissue glucose uptake underlies adipocyte enlargement and liver steatosis/steatohepatitis in Zucker rats from early-life stages. Int. J. Obes. 2022, 46, 50–58. [Google Scholar] [CrossRef]
  114. Nejabat, M.; Leisser, A.; Karanikas, G.; Wadsak, W.; Mitterhauser, M.; Mayerhöfer, M.; Kienbacher, C.; Trauner, M.; Hacker, M.; Haug, A.R. [11C] acetate PET as a tool for diagnosis of liver steatosis. Abdom. Radiol. 2018, 43, 2963–2969. [Google Scholar] [CrossRef] [PubMed] [Green Version]
  115. Ong, L.-C.; Jin, Y.; Song, I.-C.; Yu, S.; Zhang, K. 2-[18F]-2-deoxy-d-glucose (FDG) uptake in human tumor cells is related to the expression of glut-1 and hexokinase II. Acta Radiol. 2008, 49, 1145–1153. [Google Scholar] [CrossRef] [PubMed]
  116. Zhao, S.; Kuge, Y.; Mochizuki, T.; Takahashi, T.; Nakada, K.; Sato, M.; Takei, T.; Tamaki, N. Biologic correlates of intratumoral heterogeneity in 18F-FDG distribution with regional expression of glucose transporters and hexokinase-II in experimental tumor. J. Nucl. Med. 2005, 46, 675–682. [Google Scholar] [PubMed]
  117. Pauwels, E.K.; Ribeiro, M.J.; Stoot, J.H.; McCready, V.R.; Bourguignon, M.; Mazière, B. FDG accumulation and tumor biology. Nucl. Med. Biol. 1998, 25, 317–322. [Google Scholar] [CrossRef] [Green Version]
  118. Lee, J.D.; Yang, W.I.; Park, Y.N.; Kim, K.S.; Choi, J.S.; Yun, M.; Ko, D.; Kim, T.-S.; Cho, A.E.H.; Kim, H.M.; et al. Different glucose uptake and glycolytic mechanisms between hepatocellular carcinoma and intrahepatic mass-forming cholangiocarcinoma with increased 18F-FDG uptake. J. Nucl. Med. 2005, 46, 1753–1759. [Google Scholar]
  119. Torizuka, T.; Tamaki, N.; Inokuma, T.; Magata, Y.; Sasayama, S.; Yonekura, Y.; Tanaka, A.; Yamaoka, Y.; Yamamoto, K.; Konishi, J. In vivo assessment of glucose metabolism in hepatocellular carcinoma with FDG-PET. J. Nucl. Med. 1995, 36, 1811–1817. [Google Scholar]
  120. Khan, M.A.; Combs, C.S.; Brunt, E.M.; Lowe, V.J.; Wolverson, M.K.; Solomon, H.; Collins, B.T.; Bisceglie, A.M.D. Positron emission tomography scanning in the evaluation of hepatocellular carcinoma. J. Hepatol. 2000, 32, 792–797. [Google Scholar] [CrossRef]
  121. Wudel, L.J.; Delbeke, D.; Morris, D.; Rice, M.; Washington, M.K.; Shyr, Y.; Pinson, C.W.; Chapman, W.C. The role of [18F] fluorodeoxyglucose positron emission tomography imaging in the evaluation of hepatocellular carcinoma. Am. Surg. 2003, 69, 117–124. [Google Scholar]
  122. Kawamura, E.; Shiomi, S.; Kotani, K.; Kawabe, J.; Hagihara, A.; Fujii, H.; Uchida-Kobayashi, S.; Iwai, S.; Morikawa, H.; Enomoto, M.; et al. Positioning of 18F-fluorodeoxyglucose-positron emission tomography imaging in the management algorithm of hepatocellular carcinoma. J. Gastroenterol. Hepatol. 2014, 29, 1722–1727. [Google Scholar] [CrossRef]
  123. Lee, S.M.; Kim, H.S.; Lee, S.; Lee, J.W. Emerging role of 18F-fluorodeoxyglucose positron emission tomography for guiding management of hepatocellular carcinoma. World J. Gastroenterol. 2019, 25, 1289–1306. [Google Scholar] [CrossRef]
  124. Lee, Y.; Yoo, I.R.; Boo, S.H.; Kim, H.; Park, H.L.; Hyun O, J. The role of F-18 FDG PET/CT in intrahepatic cholangiocarcinoma. Nucl. Med. Mol. Imaging 2017, 51, 69–78. [Google Scholar] [CrossRef] [PubMed] [Green Version]
  125. Kim, Y.-J.; Yun, M.; Lee, W.J.; Kim, K.S.; Lee, J.D. Usefulness of 18F-FDG PET in intrahepatic cholangiocarcinoma. Eur. J. Nucl. Med. Mol. Imaging 2003, 30, 1467–1472. [Google Scholar] [CrossRef] [PubMed]
  126. Annunziata, S.; Caldarella, C.; Pizzuto, D.A.; Galiandro, F.; Sadeghi, R.; Giovanella, L.; Treglia, G. Diagnostic accuracy of fluorine-18-fluorodeoxyglucose positron emission tomography in the evaluation of the primary tumor in patients with cholangiocarcinoma: A meta-analysis. Biomed. Res. Int. 2014, 2014, 247693. [Google Scholar] [CrossRef] [PubMed] [Green Version]
  127. Sacks, A.; Peller, P.J.; Surasi, D.S.; Chatburn, L.; Mercier, G.; Subramaniam, R.M. Value of PET/CT in the management of liver metastases, part 1. Am. J. Roentgenol. 2011, 197, W256–W259. [Google Scholar] [CrossRef]
  128. Chua, S.C.; Groves, A.M.; Kayani, I.; Menezes, L.; Gacinovic, S.; Du, Y.; Bomanji, J.B.; Ell, P.J. The impact of 18F-FDG PET/CT in patients with liver metastases. Eur. J. Nucl. Med. Mol. Imaging 2007, 34, 1906–1914. [Google Scholar] [CrossRef]
  129. Cornelis, F.; Sotirchos, V.; Violari, E.; Sofocleous, C.T.; Schoder, H.; Durack, J.C.; Siegelbaum, R.H.; Maybody, M.; Humm, J.; Solomon, S.B. 18F-FDG PET/CT is an immediate imaging biomarker of treatment success after liver metastasis ablation. J. Nucl. Med. 2016, 57, 1052–1057. [Google Scholar] [CrossRef] [Green Version]
  130. Maffione, A.M.; Lopci, E.; Bluemel, C.; Giammarile, F.; Herrmann, K.; Rubello, D. Diagnostic accuracy and impact on management of 18F-FDG PET and PET/CT in colorectal liver metastasis: A meta-analysis and systematic review. Eur. J. Nucl. Med. Mol. Imaging 2015, 42, 152–163. [Google Scholar] [CrossRef]
  131. Bipat, S.; van Leeuwen, M.S.; Comans, E.F.I.; Pijl, M.E.J.; Bossuyt, P.M.M.; Zwinderman, A.H.; Stoker, J. Colorectal liver metastases: CT, MR imaging, and PET for diagnosis—Meta-analysis. Radiology 2005, 237, 123–131. [Google Scholar] [CrossRef]
  132. Iwano, S.; Ito, S.; Tsuchiya, K.; Kato, K.; Naganawa, S. What causes false-negative PET findings for solid-type lung cancer? Lung Cancer 2013, 79, 132–136. [Google Scholar] [CrossRef]
  133. Wang, Z.; Chen, J.-Q.; Liu, J.-L.; Qin, X.-G.; Huang, Y. FDG-PET in diagnosis, staging and prognosis of pancreatic carcinoma: A meta-analysis. World J. Gastroenterol. 2013, 19, 4808–4817. [Google Scholar] [CrossRef]
  134. Berger, K.L.; Nicholson, S.A.; Dehdashti, F.; Siegel, B.A. FDG PET evaluation of mucinous neoplasms. Am. J. Roentgenol. 2000, 174, 1005–1008. [Google Scholar] [CrossRef] [PubMed]
  135. Yoshimoto, M.; Waki, A.; Yonekura, Y.; Sadato, N.; Murata, T.; Omata, N.; Takahashi, N.; Welch, M.J.; Fujibayashi, Y. Characterization of acetate metabolism in tumor cells in relation to cell proliferation: Acetate metabolism in tumor cells. Nucl. Med. Biol. 2001, 28, 117–122. [Google Scholar] [CrossRef]
  136. Ho, C.-L.; Yu, S.C.H.; Yeung, D.W.C. 11C-acetate PET imaging in hepatocellular carcinoma and other liver masses. J. Nucl. Med. 2003, 44, 213–221. [Google Scholar] [PubMed]
  137. Hwang, K.H.; Choi, D.-J.; Lee, S.-Y.; Lee, M.K.; Choe, W. Evaluation of patients with hepatocellular carcinomas using [11C] acetate and [18F] FDG PET/CT: A preliminary study. Appl. Radiat. Isot. 2009, 67, 1195–1198. [Google Scholar] [CrossRef] [PubMed]
  138. Cheung, T.T.; Ho, C.L.; Lo, C.M.; Chen, S.; Chan, S.C.; Chok, K.S.H.; Fung, J.Y.; Chan, A.C.Y.; Sharr, W.; Yau, T.; et al. 11C-acetate and 18F-FDG PET/CT for clinical staging and selection of patients with hepatocellular carcinoma for liver transplantation on the basis of milan criteria: Surgeon’s perspective. J. Nucl. Med. 2013, 54, 192–200. [Google Scholar] [CrossRef] [Green Version]
  139. Soret, M.; Bacharach, S.L.; Buvat, I. Partial-volume effect in PET tumor imaging. J. Nucl. Med. 2007, 48, 932–945. [Google Scholar] [CrossRef] [Green Version]
  140. Park, J.-W.; Kim, J.H.; Kim, S.K.; Kang, K.W.; Park, K.W.; Choi, J.-I.; Lee, W.J.; Kim, C.-M.; Nam, B.H. A prospective evaluation of 18F-FDG and 11C-acetate PET/CT for detection of primary and metastatic hepatocellular carcinoma. J. Nucl. Med. 2008, 49, 1912–1921. [Google Scholar] [CrossRef] [Green Version]
  141. Fong, Y.; Saldinger, P.F.; Akhurst, T.; Macapinlac, H.; Yeung, H.; Finn, R.D.; Cohen, A.; Kemeny, N.; Blumgart, L.H.; Larson, S.M. Utility of 18F-FDG positron emission tomography scanning on selection of patients for resection of hepatic colorectal metastases. Am. J. Surg. 1999, 178, 282–287. [Google Scholar] [CrossRef]
  142. Delbeke, D.; Vitola, J.V.; Sandler, M.P.; Arildsen, R.C.; Powers, T.A.; Wright, J.K.; Chapman, W.C.; Pinson, C.W. Staging recurrent metastatic colorectal carcinoma with PET. J. Nucl. Med. 1997, 38, 1196–1201. [Google Scholar]
  143. McDermott, S.; Skehan, S.J. Whole body imaging in the abdominal cancer patient: Pitfalls of PET-CT. Abdom. Imaging 2010, 35, 55–69. [Google Scholar] [CrossRef]
  144. DeFronzo, R.A.; Ferrannini, E.; Hendler, R.; Felig, P.; Wahren, J. Regulation of splanchnic and peripheral glucose uptake by insulin and hyperglycemia in man. Diabetes 1983, 32, 35–45. [Google Scholar] [CrossRef] [PubMed]
  145. Honka, H.; Hannukainen, J.C.; Tarkia, M.; Karlsson, H.; Saunavaara, V.; Salminen, P.; Soinio, M.; Mikkola, K.; Kudomi, N.; Oikonen, V.; et al. Pancreatic metabolism, blood flow, and β-cell function in obese humans. J. Clin. Endocrinol. Metab. 2014, 99, E981–E990. [Google Scholar] [CrossRef] [PubMed] [Green Version]
  146. Koffert, J.P.; Mikkola, K.; Virtanen, K.A.; Andersson, A.-M.D.; Faxius, L.; Hällsten, K.; Heglind, M.; Guiducci, L.; Pham, T.; Silvola, J.M.U.; et al. Metformin treatment significantly enhances intestinal glucose uptake in patients with type 2 diabetes: Results from a randomized clinical trial. Diabetes Res. Clin. Pract. 2017, 131, 208–216. [Google Scholar] [CrossRef] [PubMed] [Green Version]
  147. Mäkinen, J.; Hannukainen, J.C.; Karmi, A.; Immonen, H.M.; Soinio, M.; Nelimarkka, L.; Savisto, N.; Helmiö, M.; Ovaska, J.; Salminen, P.; et al. Obesity-associated intestinal insulin resistance is ameliorated after bariatric surgery. Diabetologia 2015, 58, 1055–1062. [Google Scholar] [CrossRef] [Green Version]
  148. Wang, J.; Shao, Y.; Liu, B.; Wang, X.; Geist, B.K.; Li, X.; Li, F.; Zhao, H.; Hacker, M.; Ding, H.; et al. Dynamic 18F-FDG PET imaging of liver lesions: Evaluation of a two-tissue compartment model with dual blood input function. BMC Med. Imaging 2021, 21, 90. [Google Scholar] [CrossRef]
  149. Gormsen, L.C.; Søndergaard, E.; Christensen, N.L.; Jakobsen, S.; Nielsen, E.H.T.; Munk, O.L.; Tolbod, L.P.; Jessen, N.; Nielsen, S. Metformin does not affect postabsorptive hepatic free fatty acid uptake, oxidation or resecretion in humans: A 3-month placebo-controlled clinical trial in patients with type 2 diabetes and healthy controls. Diabetes Obes. Metab. 2018, 20, 1435–1444. [Google Scholar] [CrossRef]
  150. Gill, A.B.; Hilliard, N.J.; Hilliard, S.T.; Graves, M.J.; Lomas, D.J.; Shaw, A. A semi-automatic method for the extraction of the portal venous input function in quantitative dynamic contrast-enhanced CT of the liver. BJR 2017, 90, 20160875. [Google Scholar] [CrossRef]
  151. Walker, M.D.; Morgan, A.J.; Bradley, K.M.; McGowan, D.R. Data-driven respiratory gating outperforms device-based gating for clinical 18F-FDG PET/CT. J. Nucl. Med. 2020, 61, 1678–1683. [Google Scholar] [CrossRef]
  152. Merlin, T.; Visvikis, D.; Fernandez, P.; Lamare, F. Dynamic PET image reconstruction integrating temporal regularization associated with respiratory motion correction for applications in oncology. Phys. Med. Biol. 2018, 63, 045012. [Google Scholar] [CrossRef]
  153. Kyme, A.Z.; Fulton, R.R. Motion Estimation and Correction in SPECT, PET and CT. Phys. Med. Biol. 2021, 66, 18TR02. [Google Scholar] [CrossRef]
  154. Munk, O.L.; Keiding, S.; Baker, C.; Bass, L. A microvascular compartment model validated using 11C-methylglucose liver PET in pigs. Phys. Med. Biol. 2017, 63, 015032. [Google Scholar] [CrossRef] [PubMed] [Green Version]
  155. Ozaki, K.; Harada, K.; Terayama, N.; Kosaka, N.; Kimura, H.; Gabata, T. FDG-PET/CT imaging findings of hepatic tumors and tumor-like lesions based on molecular background. Jpn. J. Radiol. 2020, 38, 697–718. [Google Scholar] [CrossRef] [PubMed]
  156. Lee, J.W.; Lee, S.M. Radiomics in oncological PET/CT: Clinical applications. Nucl. Med. Mol. Imaging 2018, 52, 170–189. [Google Scholar] [CrossRef] [PubMed]
  157. Cherry, S.R.; Jones, T.; Karp, J.S.; Qi, J.; Moses, W.W.; Badawi, R.D. Total-body PET: Maximizing sensitivity to create new opportunities for clinical research and patient care. J. Nucl. Med. 2018, 59, 3–12. [Google Scholar] [CrossRef] [PubMed] [Green Version]
  158. Alberts, I.; Hünermund, J.-N.; Prenosil, G.; Mingels, C.; Bohn, K.P.; Viscione, M.; Sari, H.; Vollnberg, B.; Shi, K.; Afshar-Oromieh, A.; et al. Clinical performance of long axial field of view PET/CT: A head-to-head intra-individual comparison of the biograph vision quadra with the biograph vision PET/CT. Eur. J. Nucl. Med. Mol. Imaging 2021, 48, 2395–2404. [Google Scholar] [CrossRef] [PubMed]
Figure 1. Anatomy (A) and physiology of the human liver. The microstructure of the liver consists of small, generally hexagonal lobules (B). The portal triads comprising a portal venule, hepatic arteriole and bile ductule are located at the corners of the lobules. The acinus is divided into three zones (C), periportal, intermediate and perivenous, with varying environment and metabolic activities according to the location between the portal triad and central vein (D). The acinus comprises a sinusoid connecting hepatic arteriole and portal venule with the central vein where proteins and metabolites are exchanged in the plasma-containing space of Dissé. Bile secreted from the hepatocytes drains into a canal of Hering, which empties into a bile ductule. (A,B) and (D) are adapted from [4] and C from [5] under Creative Commons Attribution 4.0 International License (http://creativecommons.org/licenses/by/4.0/, accessed on 17 January 2022).
Metabolites 12 00321 g001
Figure 2. Measurement of hepatic glucose metabolism using 18F-FDG. K1: clearance from blood to cell (mL of blood/min/cm3 of liver tissue); k2: back flux of 18F-FDG (min−1); k3: phosphorylation of 18F-FDG to 18F-FDG-6-phosphate (min−1); and k4: dephosphorylation of 18F-FDG-6-phosphate to 18F-FDG (min−1).
Metabolites 12 00321 g002
Figure 3. Schematic representation of a single compartment model of liver perfusion. CA, CGI, CPV, CL and CHV represent 15O-H2O concentrations in arterial, gastrointestinal, portal vein, liver and hepatic vein compartments: fA represents perfusion from the artery, and fPV represents portal vein perfusion; p is the partition coefficient of water in the tissue. Tracer concentration in portal vein can be measured either directly or derived from arterial input by taking into account delay and dispersion caused by blood passing through gastrointestinal organs [90,91].
Metabolites 12 00321 g003
Figure 4. Three-tissue compartmental model of 11C-palmitate kinetics. K1 and k2–5 are the transfer rate constants between plasma, tissue free 11C-palmitate pool, oxidative pool and complex lipids.
Metabolites 12 00321 g004
Figure 5. Fused 18F-FDG PET/CT representative images of HCC (a), ICC (b) and liver metastases from colorectal cancer (c). Note the relatively mild uptake in HCC (SUVmax 4.2 g/mL), the ring-shaped uptake in ICC (SUVmax 7.8 g/mL) and the high uptake in metastatic lesions (SUVmax 15.3 g/mL). PET colour scale 0–7. The patient represented in panel (a) had a concomitant oesophageal cancer.
Metabolites 12 00321 g005
Publisher’s Note: MDPI stays neutral with regard to jurisdictional claims in published maps and institutional affiliations.

