Article

The MicroRNA miR-277 Controls Physiology and Pathology of the Adult Drosophila Midgut by Regulating the Expression of Fatty Acid β-Oxidation-Related Genes in Intestinal Stem Cells

1
Institute of Genetics, Department of Biology, The Faculty of Mathematics and Natural Sciences, Heinrich-Heine-Universität Düsseldorf, 40225 Düsseldorf, Germany
2
Cooper Medical School, Rowan University, Camden, NJ 08102, USA
3
Institute for Zoology and Organismic Interactions, Department of Biology, The Faculty of Mathematics and Natural Sciences, Heinrich-Heine-Universität Düsseldorf, 40225 Düsseldorf, Germany
4
Cooper University Hospital, Cooper University Health Care, Cooper Medical School, Rowan University, Camden, NJ 08102, USA
*
Author to whom correspondence should be addressed.
These authors contributed equally to this work.
Metabolites 2022, 12(4), 315; https://doi.org/10.3390/metabo12040315
Submission received: 15 March 2022 / Accepted: 28 March 2022 / Published: 31 March 2022
(This article belongs to the Special Issue The Factors Governing Cell Fate and Metabolism)

Abstract

:
Cell division, growth, and differentiation are energetically costly and dependent processes. In adult stem cell-based epithelia, cellular identity seems to be coupled with a cell’s metabolic profile and vice versa. It is thus tempting to speculate that resident stem cells have a distinct metabolism, different from more committed progenitors and differentiated cells. Although investigated for many stem cell types in vitro, in vivo data of niche-residing stem cell metabolism is scarce. In adult epithelial tissues, stem cells, progenitor cells, and their progeny have very distinct functions and characteristics. In our study, we hypothesized and tested whether stem and progenitor cell types might have a distinctive metabolic profile in the intestinal lineage. Here, taking advantage of the genetically accessible adult Drosophila melanogaster intestine and the availability of ex vivo single cell sequencing data, we tested that hypothesis and investigated the metabolism of the intestinal lineage from stem cell (ISC) to differentiated epithelial cell in their native context under homeostatic conditions. Our initial in silico analysis of single cell RNAseq data and functional experiments identify the microRNA miR-277 as a posttranscriptional regulator of fatty acid β-oxidation (FAO) in the intestinal lineage. Low levels of miR-277 are detected in ISC and progressively rising miR-277 levels are found in progenitors during their growth and differentiation. Supporting this, miR-277-regulated fatty acid β-oxidation enzymes progressively declined from ISC towards more differentiated cells in our pseudotime single-cell RNAseq analysis and in functional assays on RNA and protein level. In addition, in silico clustering of single-cell RNAseq data based on metabolic genes validates that stem cells and progenitors belong to two independent clusters with well-defined metabolic characteristics. Furthermore, studying FAO genes in silico indicates that two populations of ISC exist that can be categorized in mitotically active and quiescent ISC, of which the latter relies on FAO genes. In line with an FAO dependency of ISC, forced expression of miR-277 phenocopies RNAi knockdown of FAO genes by reducing ISC size and subsequently resulting in stem cell death. We also investigated miR-277 effects on ISC in a benign and our newly developed CRISPR-Cas9-based colorectal cancer model and found effects on ISC survival, which as a consequence affects tumor growth, further underlining the importance of FAO in a pathological context. Taken together, our study provides new insights into the basal metabolic requirements of intestinal stem cell on β-oxidation of fatty acids evolutionarily implemented by a sole microRNA. Gaining knowledge about the metabolic differences and dependencies affecting the survival of two central and cancer-relevant cell populations in the fly and human intestine might reveal starting points for targeted combinatorial therapy in the hope for better treatment of colorectal cancer in the future.

Graphical Abstract

1. Introduction

The ability of organisms to maintain their internal conditions in balance requires energy uptake. An organism’s body is considered to be homeostatic while it constantly compensates for fluctuating wear and tear, injuries, changes in environment, and energetical in- and effluxes. To cope with these unpredictable conditions, evolution generated plastic and context-dependent ways to adapt to changes in e.g., nutrients availability. Nutrient-related adaptations go down until the cellular level, affecting the way each cell utilizes resources of energy. Growth, division, and differentiation are genetically encoded processes and are thought to adapt their gene expression in a plastic and context-dependent manner [1,2,3,4].
Prime candidates for such a complex regulation of gene expression of entire pathways and networks are microRNAs, which regulate approximately half of the transcriptome [1,2]. Indeed, apart from established roles in key processes such as cytoskeletal dynamics, cell migration, stemness, and metabolic phenotype [3,4,5,6], microRNAs have been implicated in the control of glucose and lipid metabolism [7].
In adult Drosophila melanogaster females, lipid metabolism is upregulated in a regionalized subpopulation of differentiated intestinal cells upon mating to sustain egg production [5,6,7]. Such regional differences of intestinal cell types have not only been reported regarding metabolism, but localization also seems to be connected with stem cell (SC) identity and proliferation behavior [8,9,10]. Together, this leads to the intriguing question on which metabolic phenotype intestinal stem cells (ISC) rely and whether their metabolism is involved in SC behavior.
In general, in vivo data on SC metabolism is scarce owing to the lack of proper genetic sensors and tools. Here, we employed the fruit fly Drosophila melanogaster, taking advantage of its exhaustive genetic toolbox to study SC metabolism in an adult organism during physiological homeostasis and in the pathological context of tumoral growth. Briefly, the fly intestine harbors around one thousand multipotent ISC, showing regional differences in proliferation behavior and cellular anatomy [8,9,11,12,13]. ISC are able to self-renew, but mainly divide asymmetrically to generate two types of precursor cells: postmitotic enteroblasts (EB) capable of differentiation to absorptive enterocytes (EC) and enteroendocrine precursor cells (EEP) that perform a singular symmetric division giving rise to two enteroendocrine cells (EE) [11,12,14].
For a long time, it was generally assumed that SC harbor immature mitochondria allowing no or limited ATP production through oxidative phosphorylation (OXPHOS). Recent and widespread literature on SC metabolism has provided new insights, revealing that the metabolic phenotype of SC varies depending on species, age, and developmental stage, as well as tissue localization [15]. Studies of embryonic, mesenchymal, neural, and induced pluripotent SC also show that their metabolic phenotype varies from glycolysis, over β-oxidation of fatty acids (FAO) to OXPHOS as an energy source [15,16], suggesting that there is no SC metabolism per se. An important commonality of these studies is that the vast majority was performed in vitro where the sheer availability of oxygen and metabolites in culture media might affect metabolic (re-)programming of cultured SC.
In the adult Drosophila intestine, a few studies hint to metabolic pathways for energy allocation in ISC and how this influences homeostatic processes. In aging ISC, energy supply from nutrient stores is reduced, negatively affecting tissue homeostasis in old flies [17]. A few in vivo studies shed first light on ISC metabolism. Schell and colleagues demonstrated a requirement of mitochondrial metabolism in ISC for intestinal homeostasis in Drosophila and intestinal organoids, which suggests OXPHOS as a possible energy source for Drosophila ISC.
A second study suggests a direct link between ISC metabolic state and nutrient availability. By manipulating a key enzyme of the hexosamine biosynthesis pathway, Mattila and colleagues were able to shift the balance between OXPHOS and glycolysis, linking nutrient content directly to ISC proliferation [18,19]. Recent work from the Edgar lab confirms metabolic changes in EB while differentiating and describes that EGFR signaling increases glycolysis, FAO, and mitochondrial biogenesis [19,20]. In addition, input from EGFR signaling was shown to specifically affect EB survival, supporting the idea of different metabolism and thus nutrient requirements of ISC and EB [21]. Downregulation of key metabolic enzymes for glycolysis and OXPHOS does not affect ISC numbers, suggesting that both metabolic pathways are dispensable for basal metabolism controlling ISC survival [18,20,22]. However, genetic manipulations in both studies were performed using the esg-Gal4 driver line which is active in ISC and EB, thus not allowing discrimination between metabolic requirements in stem or maturing precursor cells [22].
Here, building on in silico data from clustering of metabolic genes and pathways in Drosophila ISC, we set out to functionally identify and characterize the role of FAO genes in ISC metabolism in vivo. Investigating physiology and pathology of genetic manipulations of FAO enzymes, we add to the growing knowledge of metabolic essentials of intestinal stem cells.

2. Results

2.1. Identification of miR-277 as a Regulator of Cellular Metabolism

Changing cell metabolism requires fundamental adaptations of genetic networks and gene expression, which is why we aimed at microRNAs regulating such complex genetic networks. Approximately half of the transcriptome is regulated by microRNAs, which makes them a perfect candidate for the control of such metabolic networks [23,24]. Taking advantage of in silico resources [8,13], putative target gene lists from four different miRNA prediction algorithms were compared (Figure 1a). Predicted target genes of individual miRNAs showing up in at least three out of four miRNA prediction algorithms were then subjected to Gene Ontology Mapping using FatiGO Babelomics 4.0 (http://www.babelomics.org/, accessed on 5 November 2021).
To our surprise, from eight investigated microRNAs, only microRNA miR-277 showed a significant enrichment of a set of predicted target genes all mapping to metabolic pathways (Figure S1). Analyzing and assigning this gene set using KEGG pathways revealed that eight of the miR-277 regulated genes possess enzymatic functions in fatty acid metabolism (Figure 1b) and a known role in branched chain amino acid catabolism [25]. Furthermore, miR-277 was linked to lipid metabolism in Aedes aegypti before [26].
The direct regulation of predicted target genes by miR-277 was investigated using quantitative real- time PCR. Relative mRNA levels of predicted target genes were decreased in whole guts of adult Drosophila upon forced expression of miR-277 in EC (Figure 1d), indicating that all eight target genes involved in fatty acid metabolism are in fact regulated by miR-277. β-oxidation of fatty acids (FAO) provides an important energy source by degrading fatty acids fueling the citrate cycle with acetyl-CoA (Figure 1b). Together with our previous data showing activation of lipid uptake in the posterior midgut upon mating [6], we aimed to investigate the role of miR-277 and FAO in intestinal progenitors.

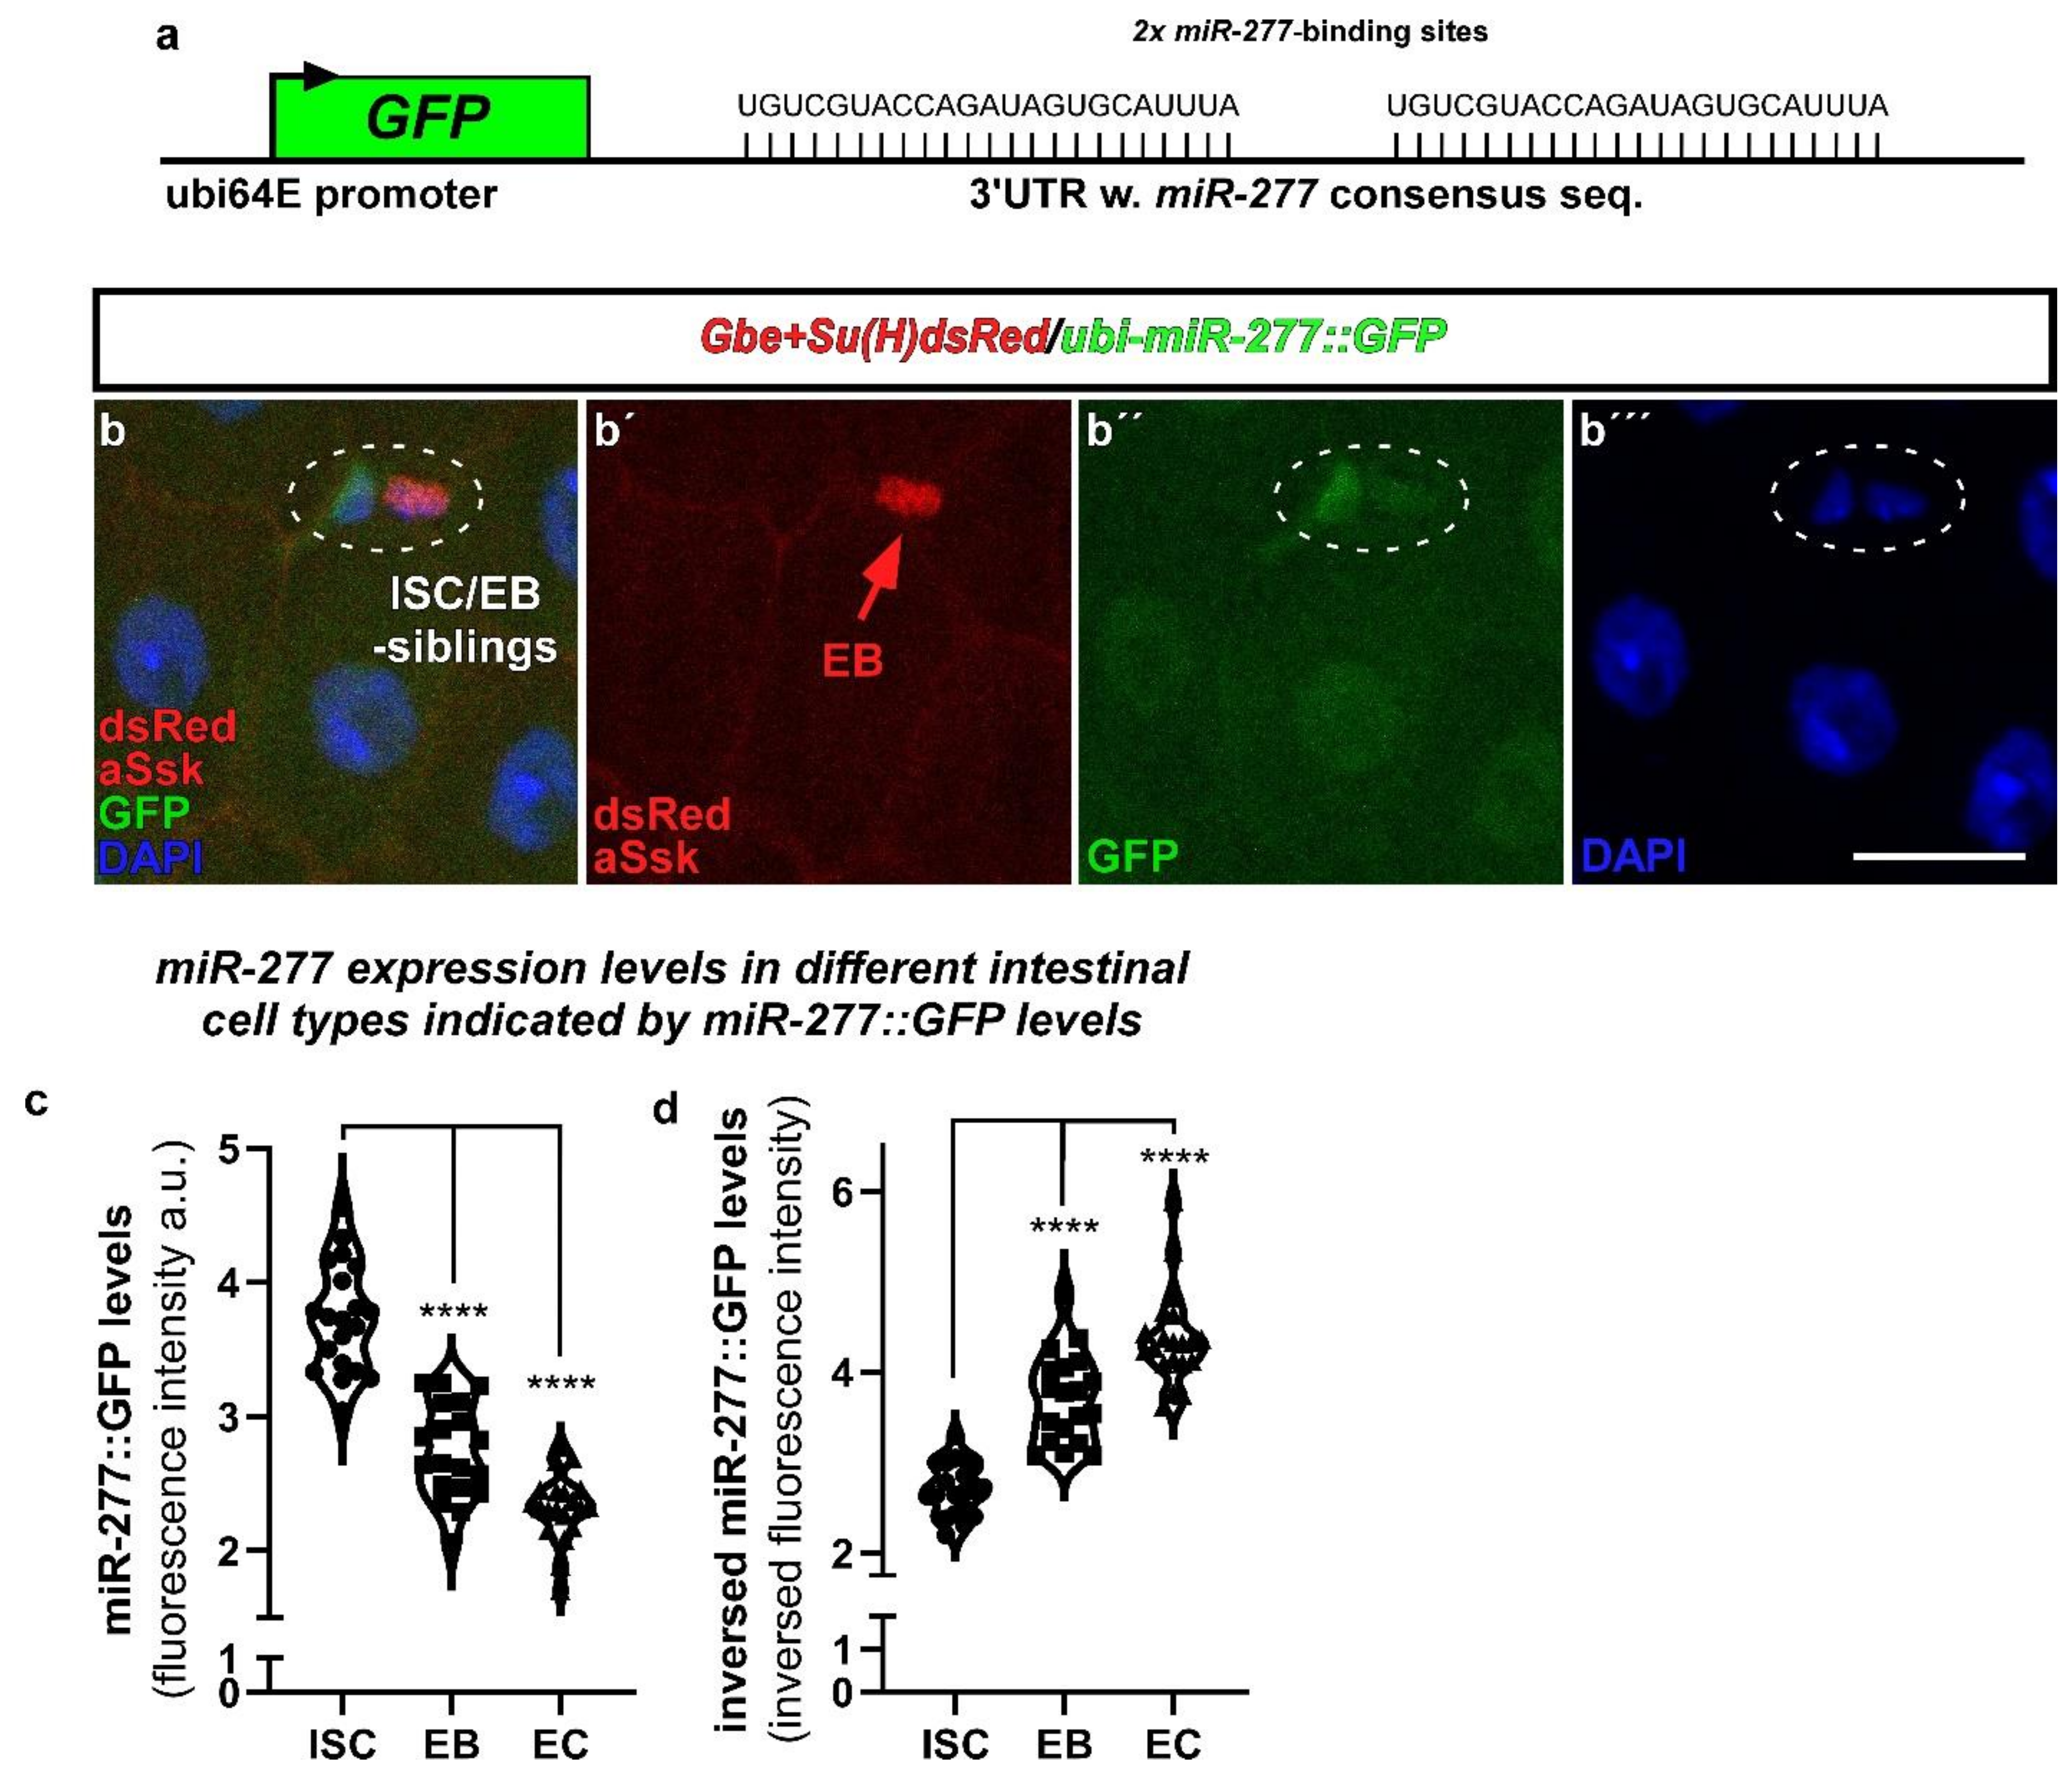
2.2. miR-277 Is Expressed in Differentiating EB and EC in the Adult Drosophila Intestine

Intrigued by these results, we tested for miR-277 expression in the posterior region of the female adult Drosophila intestine and found pre-miRNA-277 expressed in the adult midgut by PCR (Figure 1c). Therefore, we used miR-277 sensor flies containing a transgene consisting of miR-277 consensus sequences fused to a sequence coding for GFP (Figure 2a). Presence of miR-277 results in mRNA degradation and therefore reduced GFP-levels compared to control flies lacking these consensus sequences [27,28]. Crossing these flies with a reporter for Notch-signaling activity (NRE-mcherry or Gbe+Su(H)dsRed, marking EB) enabled us to decipher ISC from EB and epithelial EC and EE (Figure 2b,b’’’) [11,29].
ISC and EB usually occur as duplets (Figure 2b) and maturing EB separate from their mother ISC to differentiate into EC [3,21,30]. We addressed miR-277 expression levels by measuring GFP fluorescence in ISC, EB, and EC. Presence of endogenous miR-277 leads to degradation of GFP encoding mRNA and thus fluorescence intensity. Highest GFP fluorescence was measured in ISC (Figure 2b,c), reflecting low endogenous miR-277 levels (Figure 2d). Differentiating EB and terminally differentiated EC have significantly lower GFP-levels, suggesting higher miR-277 levels (Figure 2c,d), which in turn might reflect less FAO activity. We validated the reactivity of the miR-277 sensor flies to changes in miR-277 expression by crossing miR-277::GFP flies with overexpression (UAS-miR-277) or knockdown of miR-277 using an miR-277 sponge genetic construct (UAS-miR-277-sp, Figure 6e). MicroRNA sponges contain multiple complementary binding sites to the seed sequence of a microRNA of interest (Figure 6e) and reduce endogenous microRNA levels in both flies and human cell culture [31,32]. Upon overexpression of miR-277 in ISC/EB, miR-277::GFP intensities were decreased, while knockdown of miR-277 resulted in increased GFP intensities (Figure S4f–i). These results prove that the sensor is reflecting miR-277 expression levels and underlines endogenous miR-277 expression in ISC/EB. Next, we set out to determine FAO gene transcription in existing scRNAseq datasets of intestinal cell types [13].

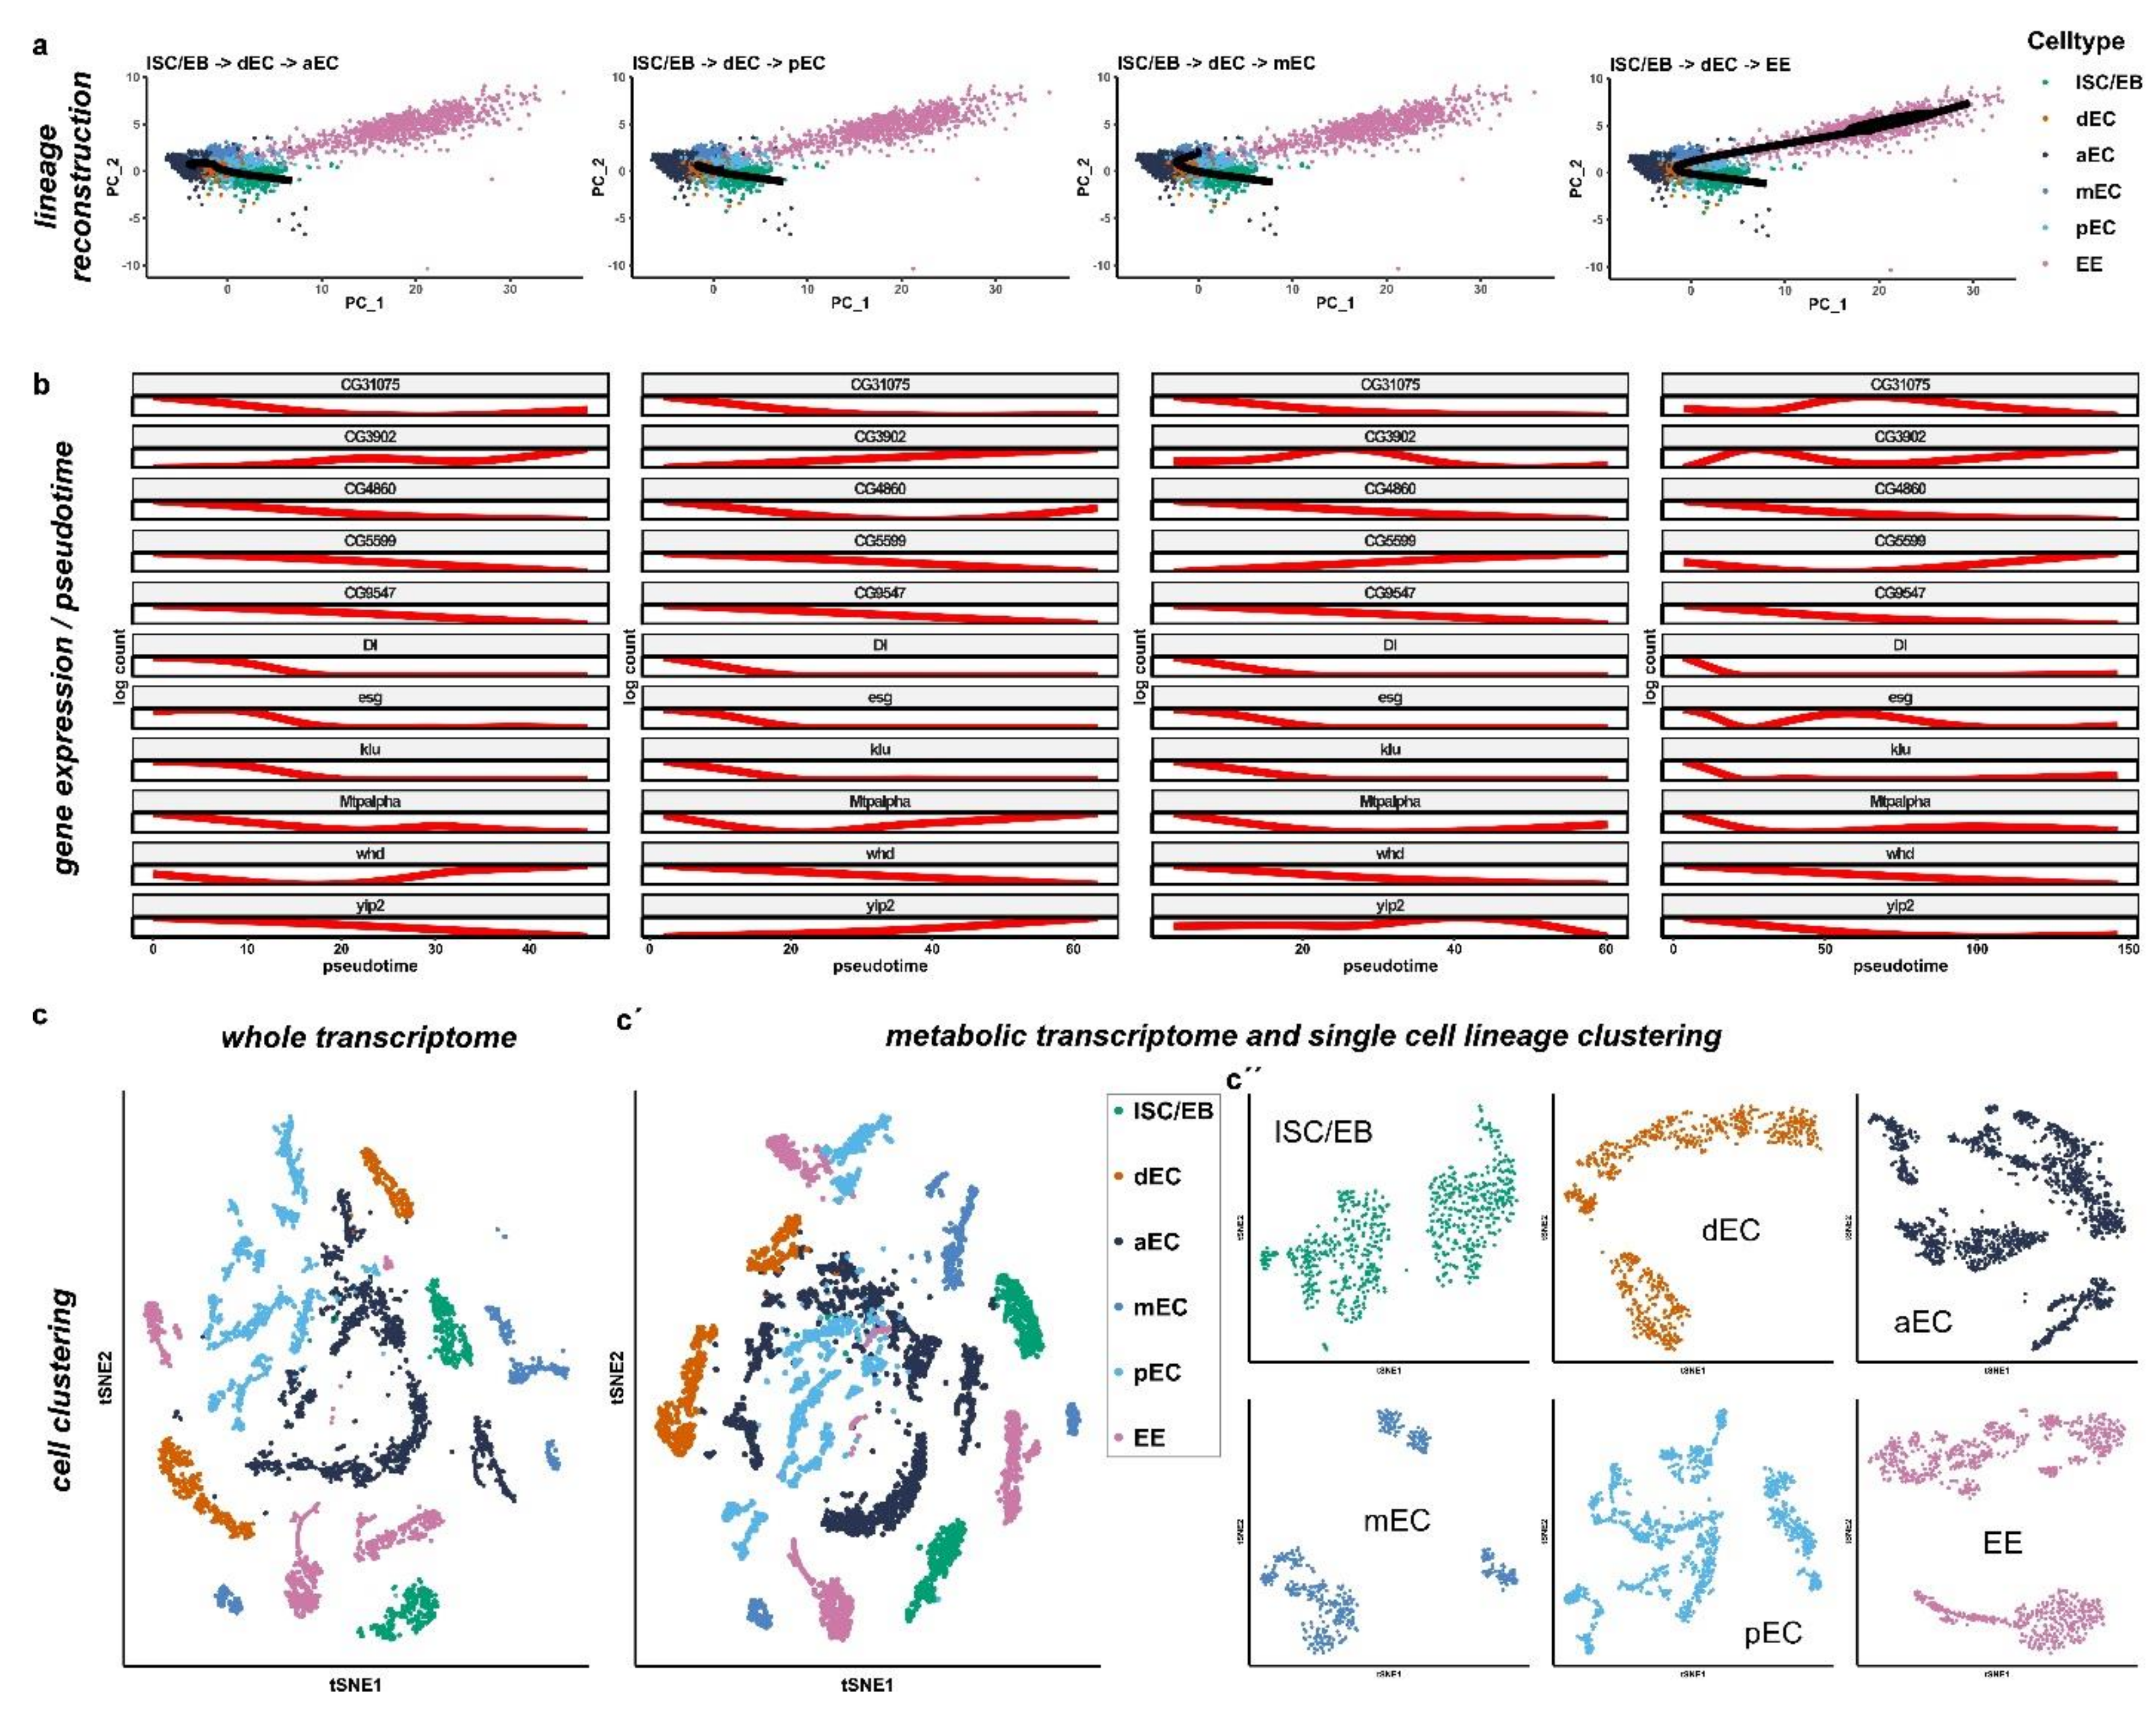
2.3. miR-277 Target Gene Expression in Reconstructed Intestinal Lineage Trajectories from scRNAseq

To investigate the expression of miR-277 target genes and possible metabolic differences between ISC/EB and differentiated progeny, we used the updated 2019 single-cell sequencing dataset [13] to perform a cell clustering and lineage reconstruction based only on metabolic genes [33,34]. To infer cell lineage, we used only ISC/EB, differentiating EC, EC (anterior (aEC), mid (mEC) and posterior EC (pEC)), and EEs, and excluded all other cell types following a previous analysis [13].
Four main lineages were reconstructed: (i) ISC/EBdifferentiating EC (dEC)anterior EC (aEC), (ii) ISC/EBdECmid EC (mEC), (iii) ISC/EBdECposterior EC (pEC) and (iv) ISC/EBEE (Figure 3a). ISC/EB and each EC subtype (aEC, mEC and pEC) showed clustering with a small dispersion indicating a homogenous metabolic profile from anterior to posterior EC (Figure S2a–c). EE instead showed the highest dispersion/metabolic heterogeneity in accordance with a high variety of EE subtypes [35] (Figure 3a). Pseudotime analysis of predicted miR-277 target genes indicates that most genes of the FAO pathways predicted to be regulated by miR-277 are progressively inhibited in dEC towards terminally differentiated EC lineages and in the lineage specification of EE as well (Figure 3b).
In detail, the reconstructed lineage towards pEC shows that FAO metabolic genes CG31075, CG4860, CG5599, CG9547, and whd diminish, while yip2 and CG3902 progressively increase (Figure 3b). Mtpalpha diminishes during the differentiation to then increase again in the terminally differentiated pEC (Figure 3b). In the reconstructed lineage towards anterior EC, the expression profile is similar to the posterior midgut with the difference of yip2, which progressively increases, and whd, which decreases during differentiation to then increase in terminally differentiated anterior EC, similarly to Mtpalpha for pEC (Figure 3b). In the mid midgut, reconstructed lineages also show similar patterns to the pEC, with the exception of CG5599 which increases progressively, CG3902 which initially increases in the process of differentiation to then diminish in terminally differentiated mEC, and yip2 which increases initially and then diminishes. Although few FAO genes seem to be more expressed in differentiated cells or seem to be fluctuate in the process of differentiation, altogether these data show that FAO genes expression levels diminish towards differentiated cells.
This is in accordance with our in vivo data showing that miR-277 levels increase towards EC fate (Figure 2c,d) and further indicates that miR-277 post-transcriptionally represses FAO genes (Figure 1d). To confirm our in silico pseudotime analysis, we investigated flies carrying a GFP-tagged CG9547 fusion protein under control of endogenous regulatory sequences (Figure S5a). We found highest CG9547 protein levels in Notch ligand Delta (Dl) positive ISC (Figure 5d and Figure S5b–b’’’). Using specific markers for intestinal cells [5,11,12,21,29,36], we were able to validate our pseudotime analysis of an expression decline for CG9547 towards epithelial EC cell fates on protein level (Figure 5d). In addition, we could prove that CG9547 protein levels are reduced upon overexpression of miR-277 (Figure S5e,e’,h) or knockdown of CG9547 by RNAi (Figure S5g,g’,h) compared to controls (Figure S5d,d’,h). Upon knockdown of miR-277 using miR-277-sp CG9547 protein levels increase (Figure S5f,f’,h). This observation supports our results showing endogenous expression and regulation of the predicted target genes involved in FAO by miR-27 7 in ISC/EB.
The finding of CG9547 FAO enzyme expression in ISC and its regulation by miR-277 strongly underlines our metabolic analysis from scRNAseq. Our observations suggest that fatty acids in ISC are used for energy production through FAO and might rather be used for membrane build-up in dEC and EC in an anabolic way. Together with the finding that FAO regulating miR-277 levels are low in ISC, we wanted to investigate the hypothesis whether fatty acids might be used differently between ISC and EB.

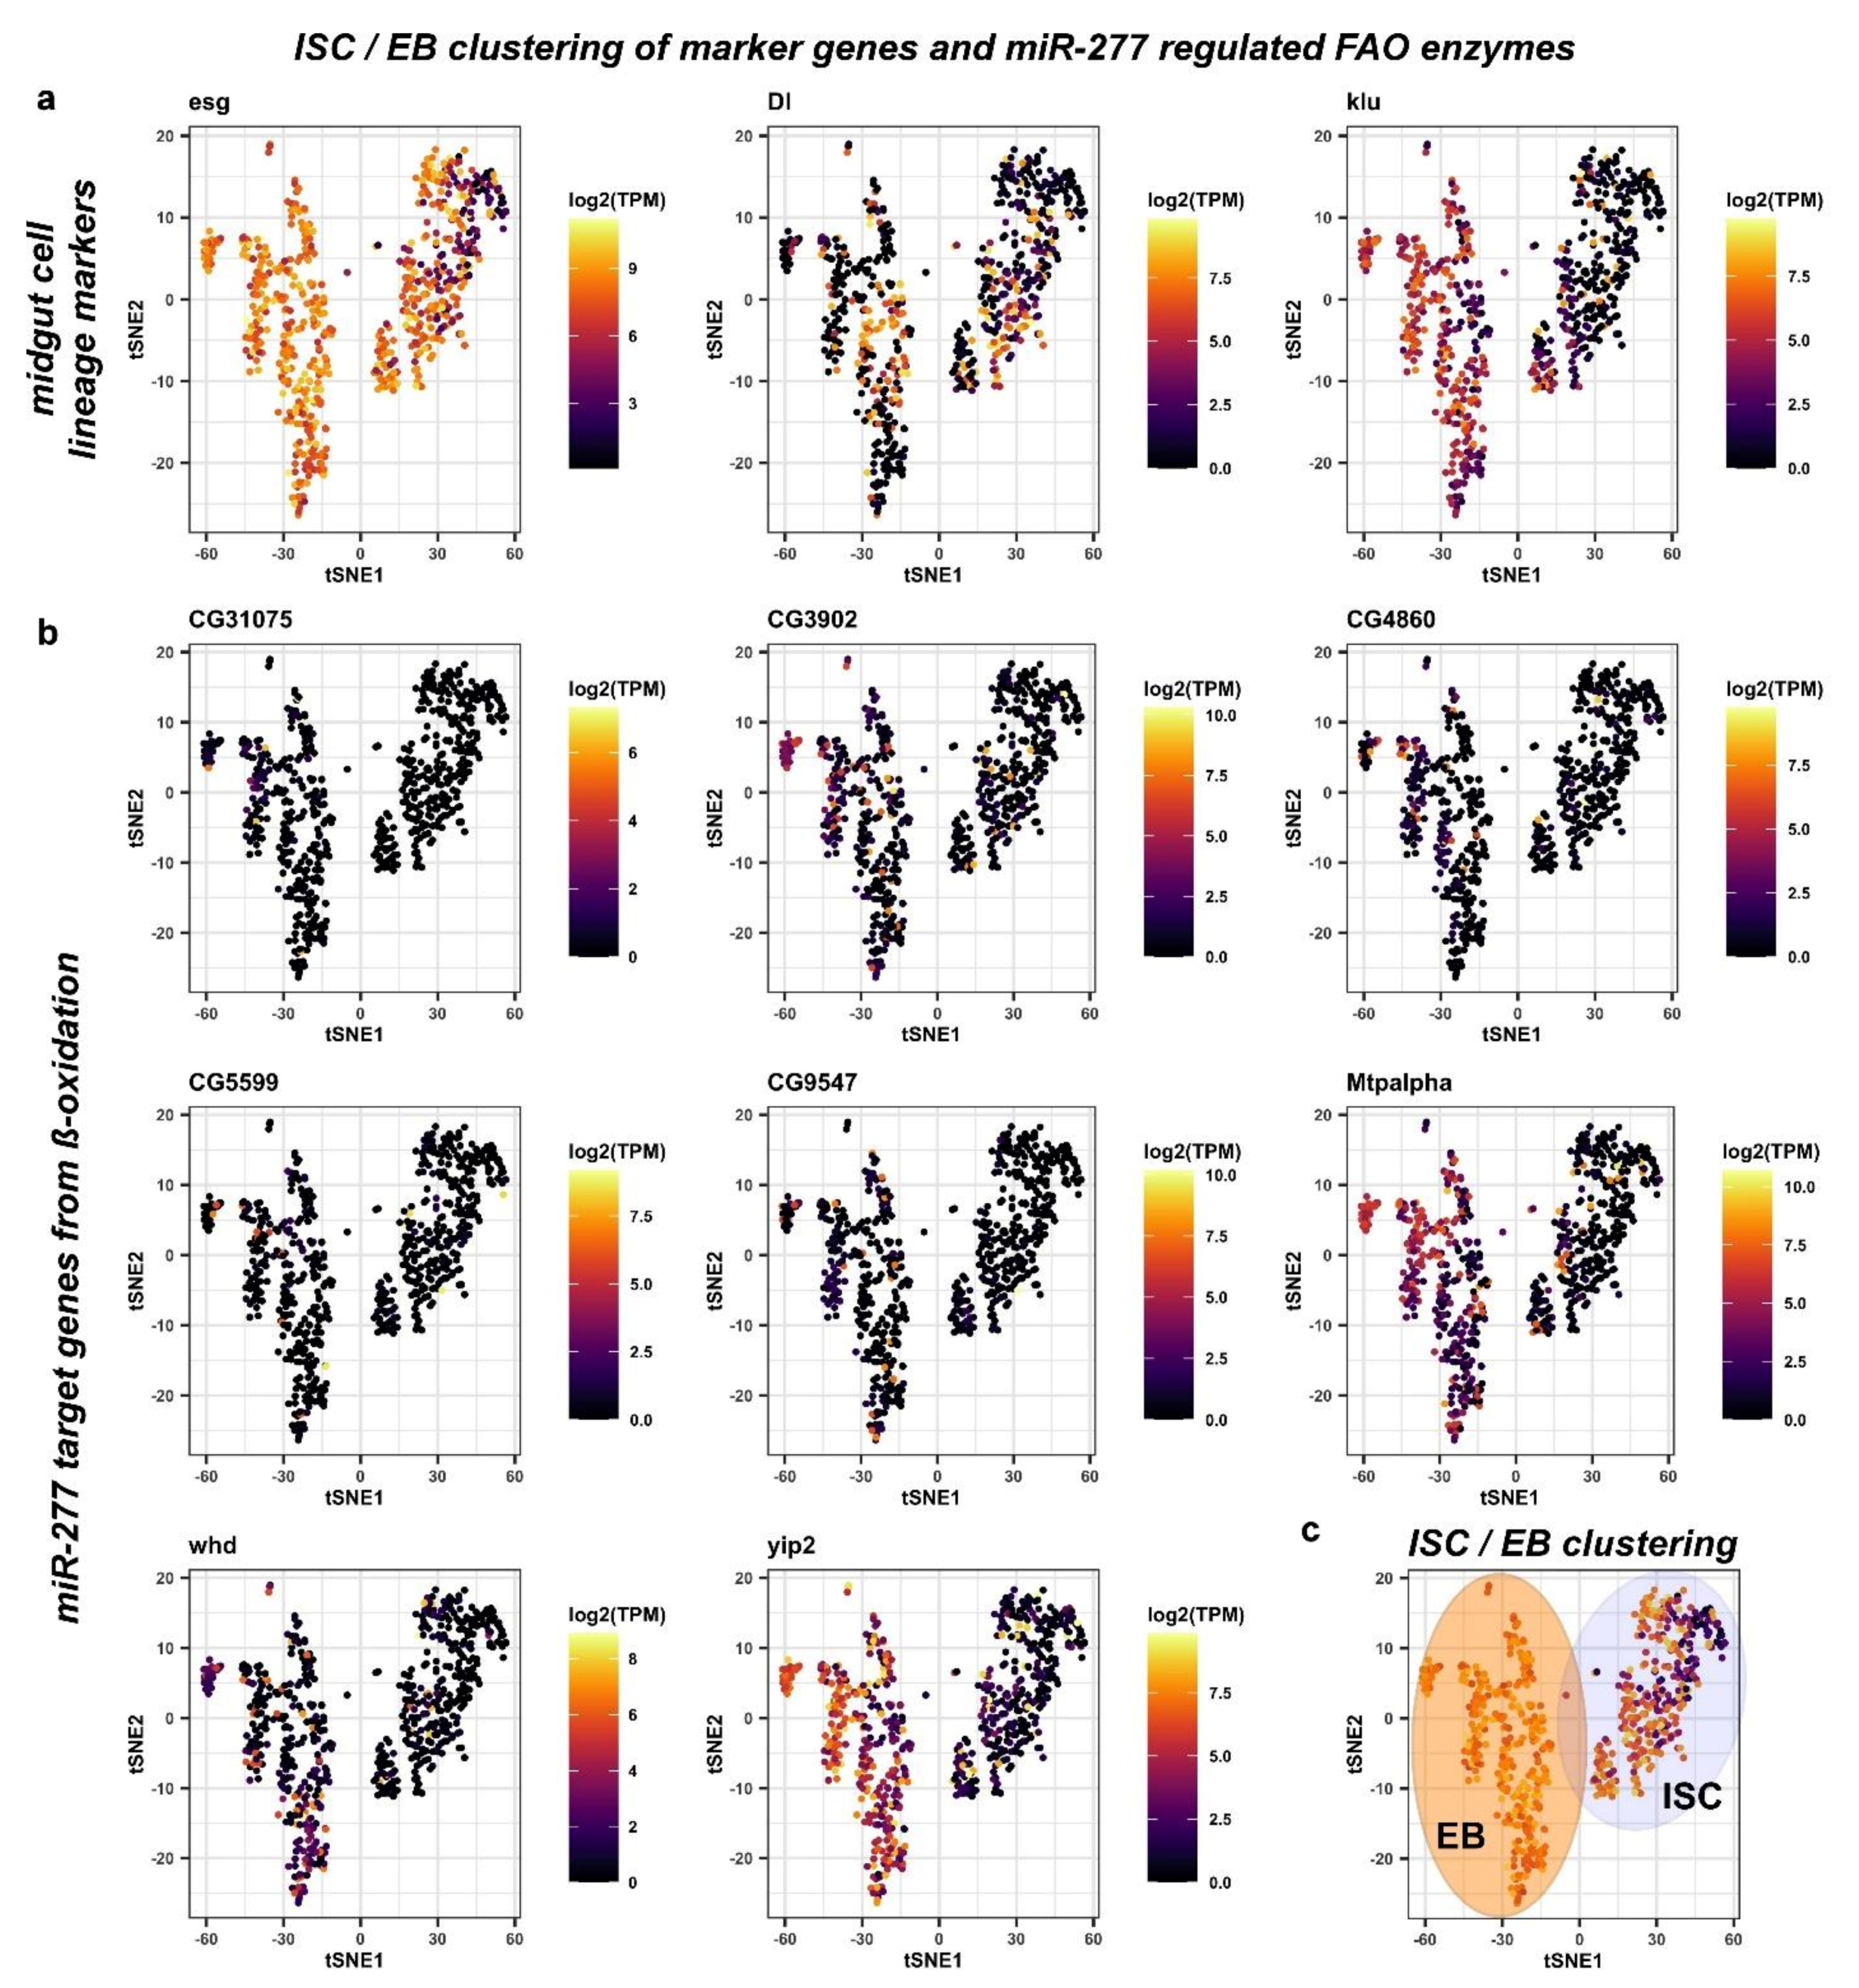
2.4. FAO defines Differences among Intestinal Stem Cells and Enteroblasts

Stem cells and progenitor cells, although both undifferentiated progenitor cell types, are fundamentally different. In the adult Drosophila intestine, ISC are the only cell type capable of self-renewal, while EB are postmitotic and committed towards EC differentiation. EB are a transient but discrete cell type capable of delaying terminal differentiation for sustained periods of time. During differentiation, EB obtain functional mitochondria and endoreplicate [3,5,19,20,21,30]. To investigate whether expression of genes involved in metabolic pathways in ISC and EB have differences reflecting their functional differences, we subdivided the ISC/EB cluster obtained in the principal component analysis of metabolic genes (Figure 3c–c’’) using previously described cell type specific markers such as Dl (ISC), esg (ISC+EB), klu (EB) and pros (EE) [5,11,12,21,29,36] (Figure 4a).
Escargot (esg) marks both ISC and EB, as previously demonstrated [3,37,38]. However, esg has been shown to overlap with EE [3,37,38,39]. First, we observed and excluded a very small number of pros+ cells within the esg+ ISC/EB population from the analysis (Figure S3a). The Notch ligand Delta (Dl) has been shown to be a sufficient but not necessary marker of ISC per se, as it is only necessary during stem cell division for EB cell fate determination by Delta/Notch signaling [1,12,21,31,32]. In EB, the Notch target gene klumpfuss (klu) has been shown to be a sufficient and necessary marker for EB, preventing the EE fate and committing towards the EC fate [21,36]. We hence initially defined ISC as ‘esg+, Dl+, klu, and pros’, and EB as ‘esg+, Dl, klu+, and pros (Figure 4a). Using these criteria for mapping, miR-277 targeted FAO enzymes are found to be expressed in ISC/EB (Figure 4b) and two distinct populations of ISC and EB can be distinguished (Figure 4c). Despite that, we found a high variety of genes contradicting only one ISC population in terms of metabolic gene expression.
After an exhaustive search, we isolated and termed a third group, reflecting a second population of ISC that is Dl (‘esg+, Dl, klu and pros, Figure 5a,f) built on our metabolic mapping, marker gene expression, and a previous unpublished observation that under very low turnover conditions, the majority of ISC of virgin females are negative for the mitosis marker pH3 and importantly esg+/Dl [6] (Antonello and Reiff, unpublished results). We also observed that reprogramming towards lipid uptake upon mating [6] may already cause an upregulation of CG9547 protein levels in MF compared to VF (Figure S5c). Using these criteria, Dl+ proliferating ISC (pISC) have high expression of cell cycle genes CycD, CycE, and stg (string, CDC25A) (Figure 5b), whereas quiescent ISC (qISC) have high levels of nub (POU/OCT1) involved in quiescence [40,41] (Figure 5b). E2F1 is also high in qISC, where it might exert its known role as repressor of OXPHOS and mitochondrial function [42,43] and promote FAO to support self-renewal and drug resistance via NANOG in tumor-initiating stem-like cells [43] (Figure 5a). EB show higher levels of endoreplication genes (Orc1, dup), cellular growth (mTor, Myc) and Eip75B [5] (Figure 5b).
Strikingly, qISC and pISC are characterized by high expression of the FAO genes CG5599, Mtpalpha, and yip2 and, respectively, CG3902, CG4860, CG9547, and whd in comparison to EB (Figure 5c). As an exception from miR-277 target genes showing clear expression differences among populations, CG31075 sticks out being high in a small number of EB (Figure 5c). CG31075 is predicted to code for an orthologue of human ALDH1A, an alcohol dehydrogenase, and is thus not involved in FAO but is part of KEGG pathway ‘Fatty Acid Metabolism’ (Figure 1b). As CG31075 knockdown also results in reduced ISC sizes (Figure S4d,e), it is a tempting candidate for future studies involving metabolism of ISC.
These data suggest that miR-277 target genes are differently regulated between Dl and Dl+ ISC and enriched in both populations (Figure 5c,d) compared to the cell types of the intestinal lineage. In accordance with our in silico data on ISC metabolic gene expression, this suggests that ISC are characterized by FAO and that ISC, from a metabolic point of view, are dissimilar to EB that can be clearly distinguished by published marker genes (Figure 5b–d) [5,20,44]. Together, our analysis and experiments show high expression of FAO genes in qISC gradually declining towards terminal EC differentiation (Figure 5e), a tempting lead towards understanding of ISC metabolism, which we sought to experimentally address in the following.

2.5. miR-277 Levels affect Midgut Homeostasis and Progenitor Survival

Taking advantage of the accessible and versatile genetic toolbox of Drosophila, we set out to investigate whether there are consequences of altered expression levels of genes involved in FAO metabolism in ISC. Like its human counterpart, the adult Drosophila midgut is replenished by tightly controlled ISC division and differentiation of progenitors into absorptive enterocytes (EC) and secretory enteroendocrine cells (EE) [11,12,14] (Figure 6a). To better understand the function of miR-277 in intestinal homeostasis , we employed the ‘ ReDDM’ tracing system (Repressible Dual Differential Marker) [3,21,30]. ReDDM allows determination of tissue turnover with temporal control of tracing and simultaneous expression of further UAS-driven transgenes. The spectrum of possible effects that we can detect and decipher using ReDDM ranges from proliferation, differentiation, and over apoptosis to aberrant cellular morphology [3,5,6,21,30].
The principle of ReDDM relies on differential marking of cells having active or inactive Gal4 expression with fluorophores of different stability. Combined with the enhancer trap esg-Gal4, esgReDDM, double marks qISC, pISC, and EB driving the expression of UAS-CD8::GFP (>CD8::GFP) with short half-life and >H2B::RFP with long half-life (Figure 6a). Crosses are grown at 18°C in which transgene expression is repressed by ubiquitous tubulin-driven temperature sensitive Gal80ts. By shifting adult females to 29 °C, Gal80ts is destabilized, in turn enabling spatiotemporal control of esgReDDM tracing and additional UAS-driven transgenes including UAS-Cas9, important in experiments making use of CRISPR-Cas9 (Figure S7a–f, esgReDDMCas9). Upon epithelial replenishment, newly differentiated epithelial EC and EE stemming from ISC divisions retain RFP+-nuclei due to fluorophore stability and show gradual renewal of the intestinal epithelium (Figure 6b–d) [3].
By crossing esgReDDM with flies carrying either UAS-constructs encoding for miR-277 or a miR-277-sponge (miR-277-sp), we investigated overexpression and knockdown of miR-277. MicroRNA sponges contain multiple complementary binding sites to the seed sequence of a microRNA of interest (Figure 6e) and reduce endogenous microRNA levels in both flies and human cell culture [31,32]. Intriguingly, raised levels of miR-277 led to significantly reduced ISC and EB numbers compared to controls after seven days of tracing and transgene expression (Figure 6f,h,i). Consequently, numerical loss of ISC and EB (Figure 6h) impairs intestinal homeostasis reflected by the lack of newly generated EC (Figure 6i). Strikingly, forced miR-277 levels affect ISC and EB survival displayed by membrane-blebbing and nuclear fragmentation (Figure 6f inset, Figure S4a), both hallmarks of apoptotic progenitors in the intestine [21].
Conversely, knockdown of miR-277 using miR-277 sponges leads to accumulation of mature EB accompanied by low numbers of small diploid ISC (Figure 6g, morphological identification of esg+3). Progenitor numbers and tissue renewal is significantly increased compared to controls (Figure 6h,i), which suggests a requirement for optimal miR-277 levels in ISC survival and differentiation of EB to epithelial EC. EE differentiation was addressed by immunostaining with the EE marker prospero [11,12,29], but is not affected by miR-277 manipulations (data not shown).
In addition, the survival of ISC and EB upon forced miR-277 expression is rescued by baculoviral P35 (Figure S4b,b’) underlining that the observed form of cell death is apoptosis [45]. However, rescued progenitors remain small in size and rarely divide suggestive for an additional proliferation and growth-related impact of miR-277 (Figure S4b’). Apoptosis of ISC upon miR-277 expression reveals their dependence on proper miR-277 levels, which led us to hypothesize that ISC depend on proper regulation of genes involved in FAO metabolism. As microRNAs are known to post transcriptionally regulate many genes, we sought to directly address FAO with RNAi against individual FAO genes in the next experiments.

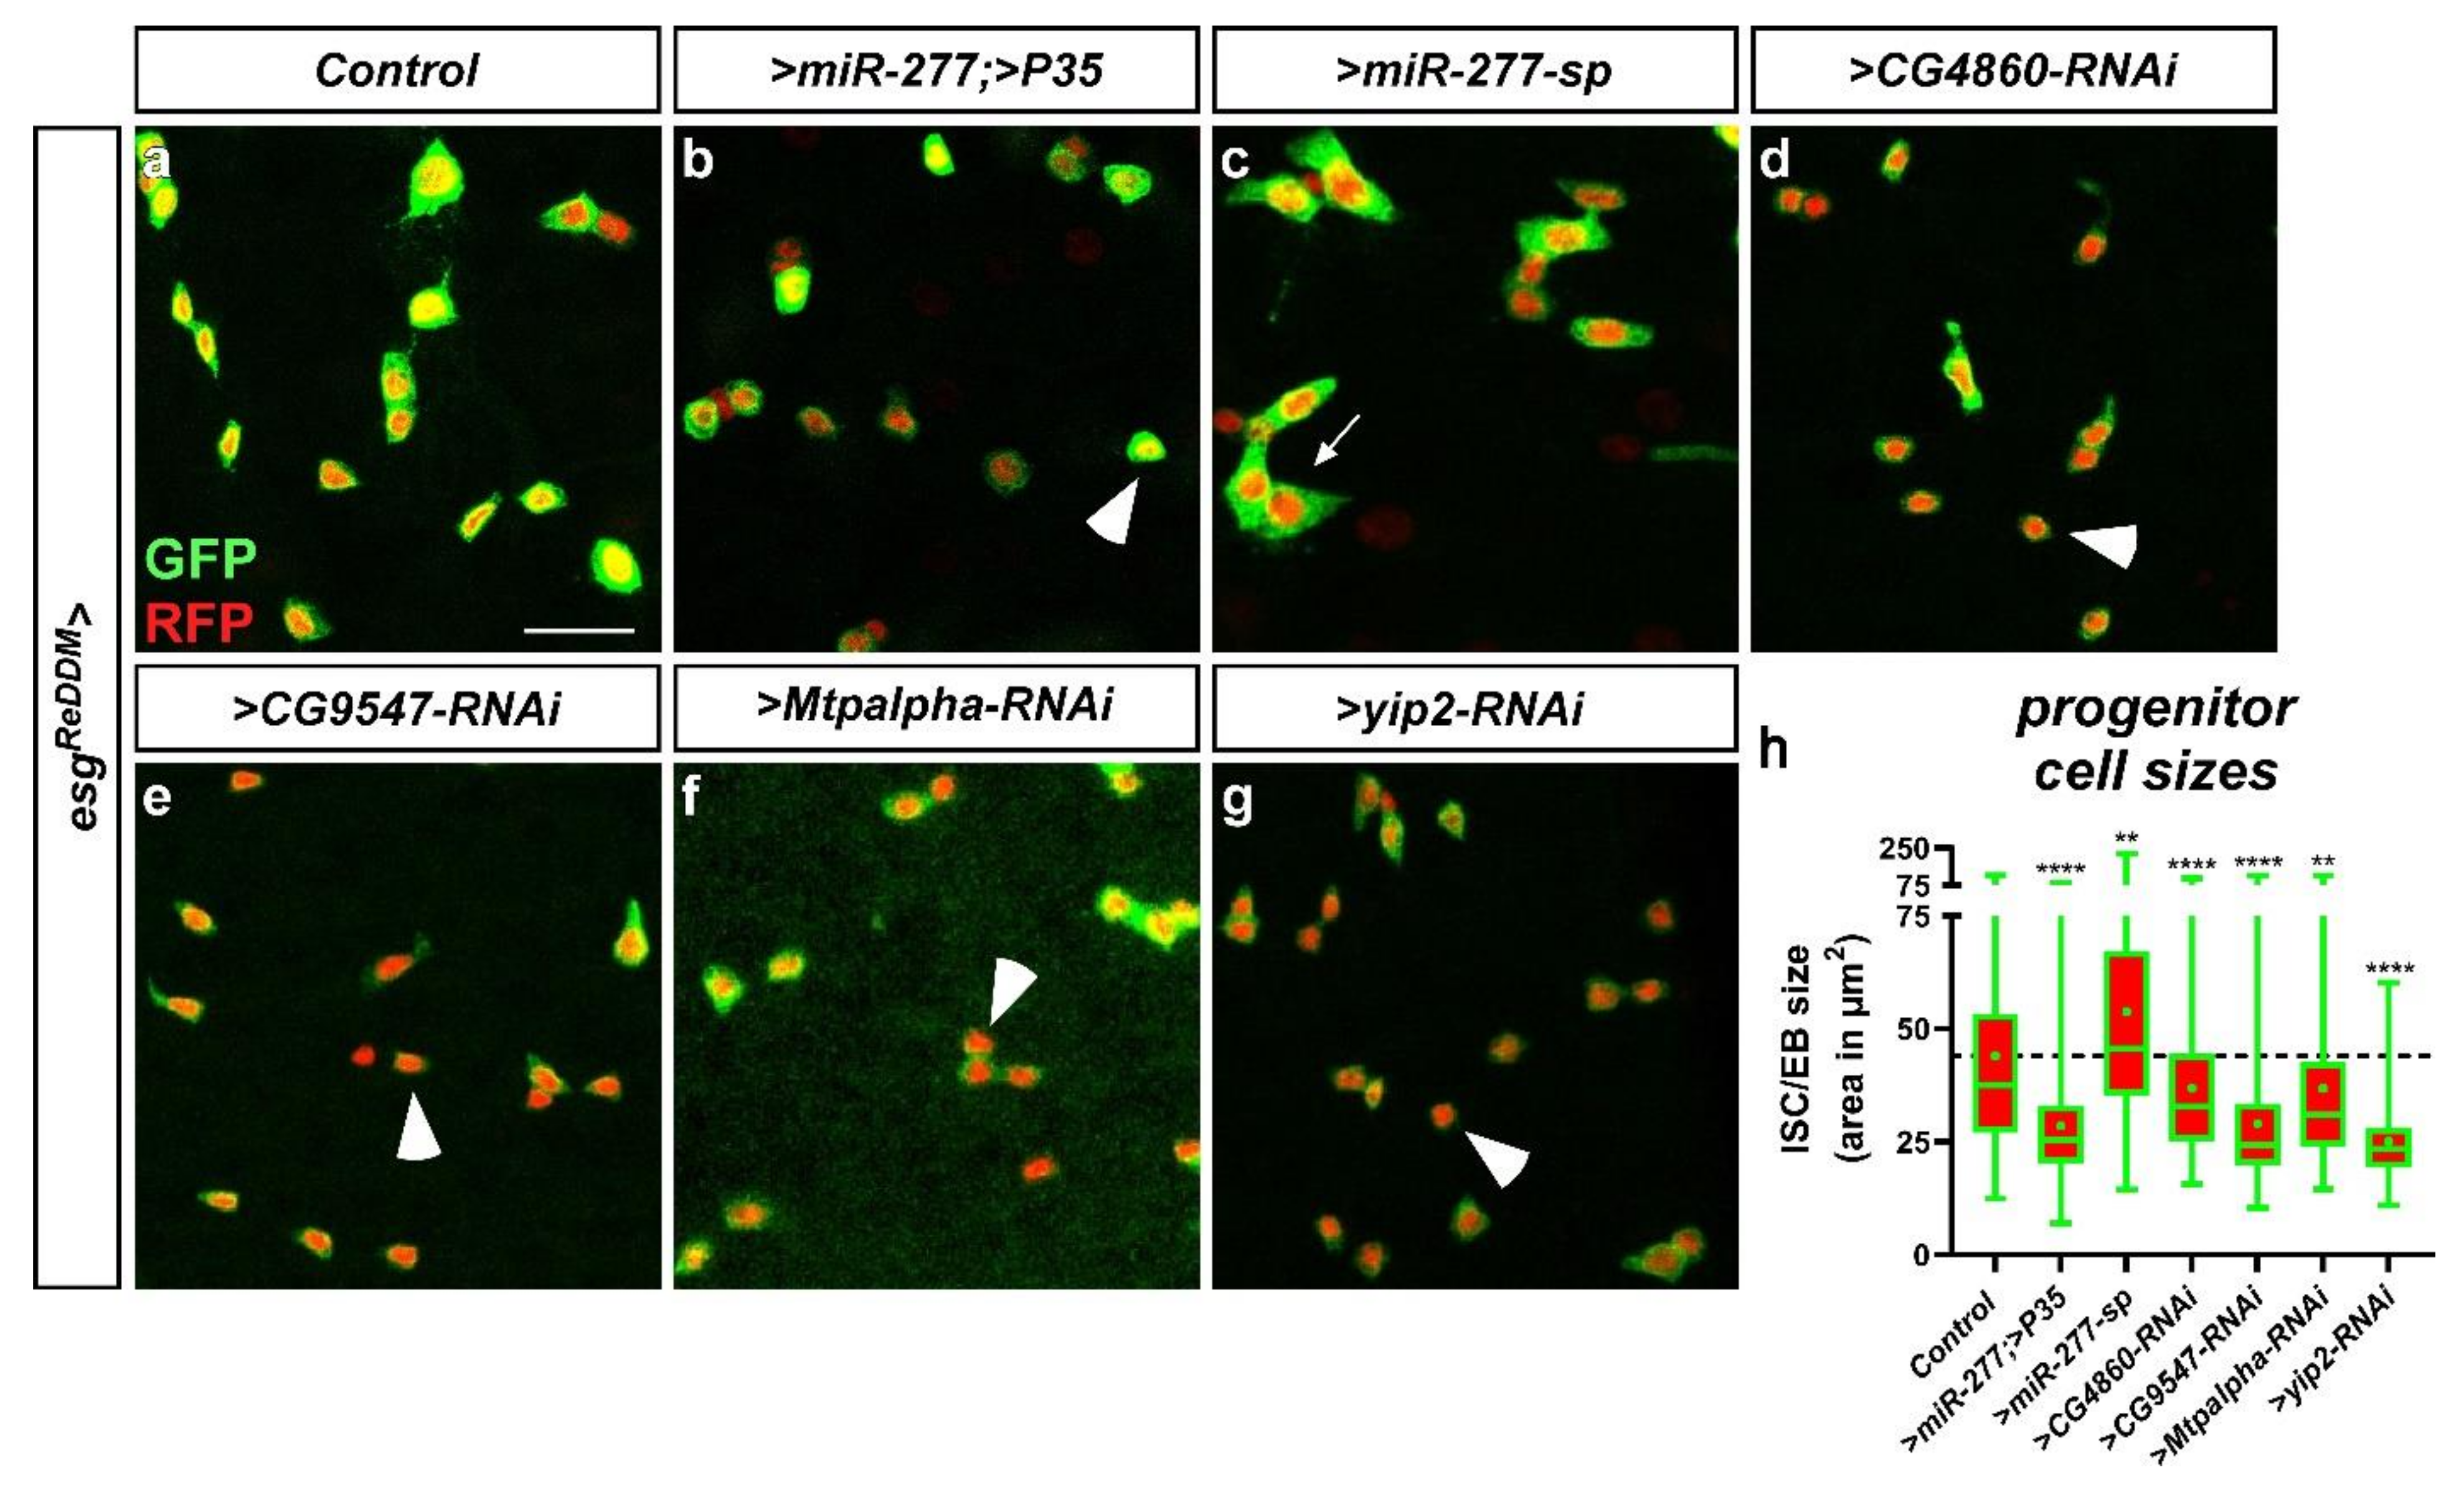
2.6. miR-277 and FAO Deficiency affect ISC Morphology and Subsequently Survival in Physiology and Pathology

Our findings of miR-277-induced apoptosis are of great interest as apoptotic mechanisms controlling ISC survival are unknown and harbor therapeutic potential as ISC are the cells of origin for colorectal cancer (CRC). Cellular growth, mitochondrial maturation and endoreplication are hallmarks during the differentiation process from ISC to EC [3,5,19,20,21,30]. In previous experiments (Figure 6f, Figure S4a) we observed that when miR-277 induced apoptosis is blocked with p35, ISC survive although much smaller in size (Figure S4b’ arrowheads). Thus, we sought to address consequences of miR-277-mediated FAO gene knockdown and individual FAO gene RNAi knockdown on ISC size and survival using esgReDDM [3,30].
After seven days of knockdown using esgReDDM, we found no indication of apoptosis, but significantly decreased ISC size upon forced miR-277 expression (Figure 7b) and after knockdown of individual FAO genes (CG4860, CG9547, Mtpalpha and yip2, Figure 7d–h), possibly reflecting a disruption of metabolic energy supply for metabolic growth. Conversely, knockdown of miR-277 using miR-277-sponges increased ISC size (Figure 7c,h). Strikingly, yip2, the enzyme catalyzing the last step of FAO, also revealed the strongest impact on ISC size (Figure 7h) and followed the pseudotime differentiation (Figure 3b and Figure 5b). Together, these experiments show a strong impact of FAO genes for ISC growth and that our observation of miR-277-induced apoptosis is not caused by the regulation of other miR-277 targets.
In contrast to miR-277, FAO gene RNAi did not result in ISC apoptosis after seven days. However, after 21 days of RNAi-mediated CG5599 and Mtpalpha knockdown, we observed membrane-blebbing and nuclear fragmentation indicating apoptosis in progenitors (Figure S5j,k, arrowheads). Generally, RNAi-mediated knockdown should resemble downregulation comparable to forced expression of a microRNA. Our data in Figure S5 suggests that RNAi is probably less effective than an endogenous microRNA evolved to regulate these genes, which might account for this phenotypic delay. Together these data suggest a crucial role of FAO as energy source for ISC that is subsequently essential for their survival. Intrigued by the effects of FAO gene depletion reduction on ISC survival, we wanted to study ISC survival with greater detail in a benign pathological context.

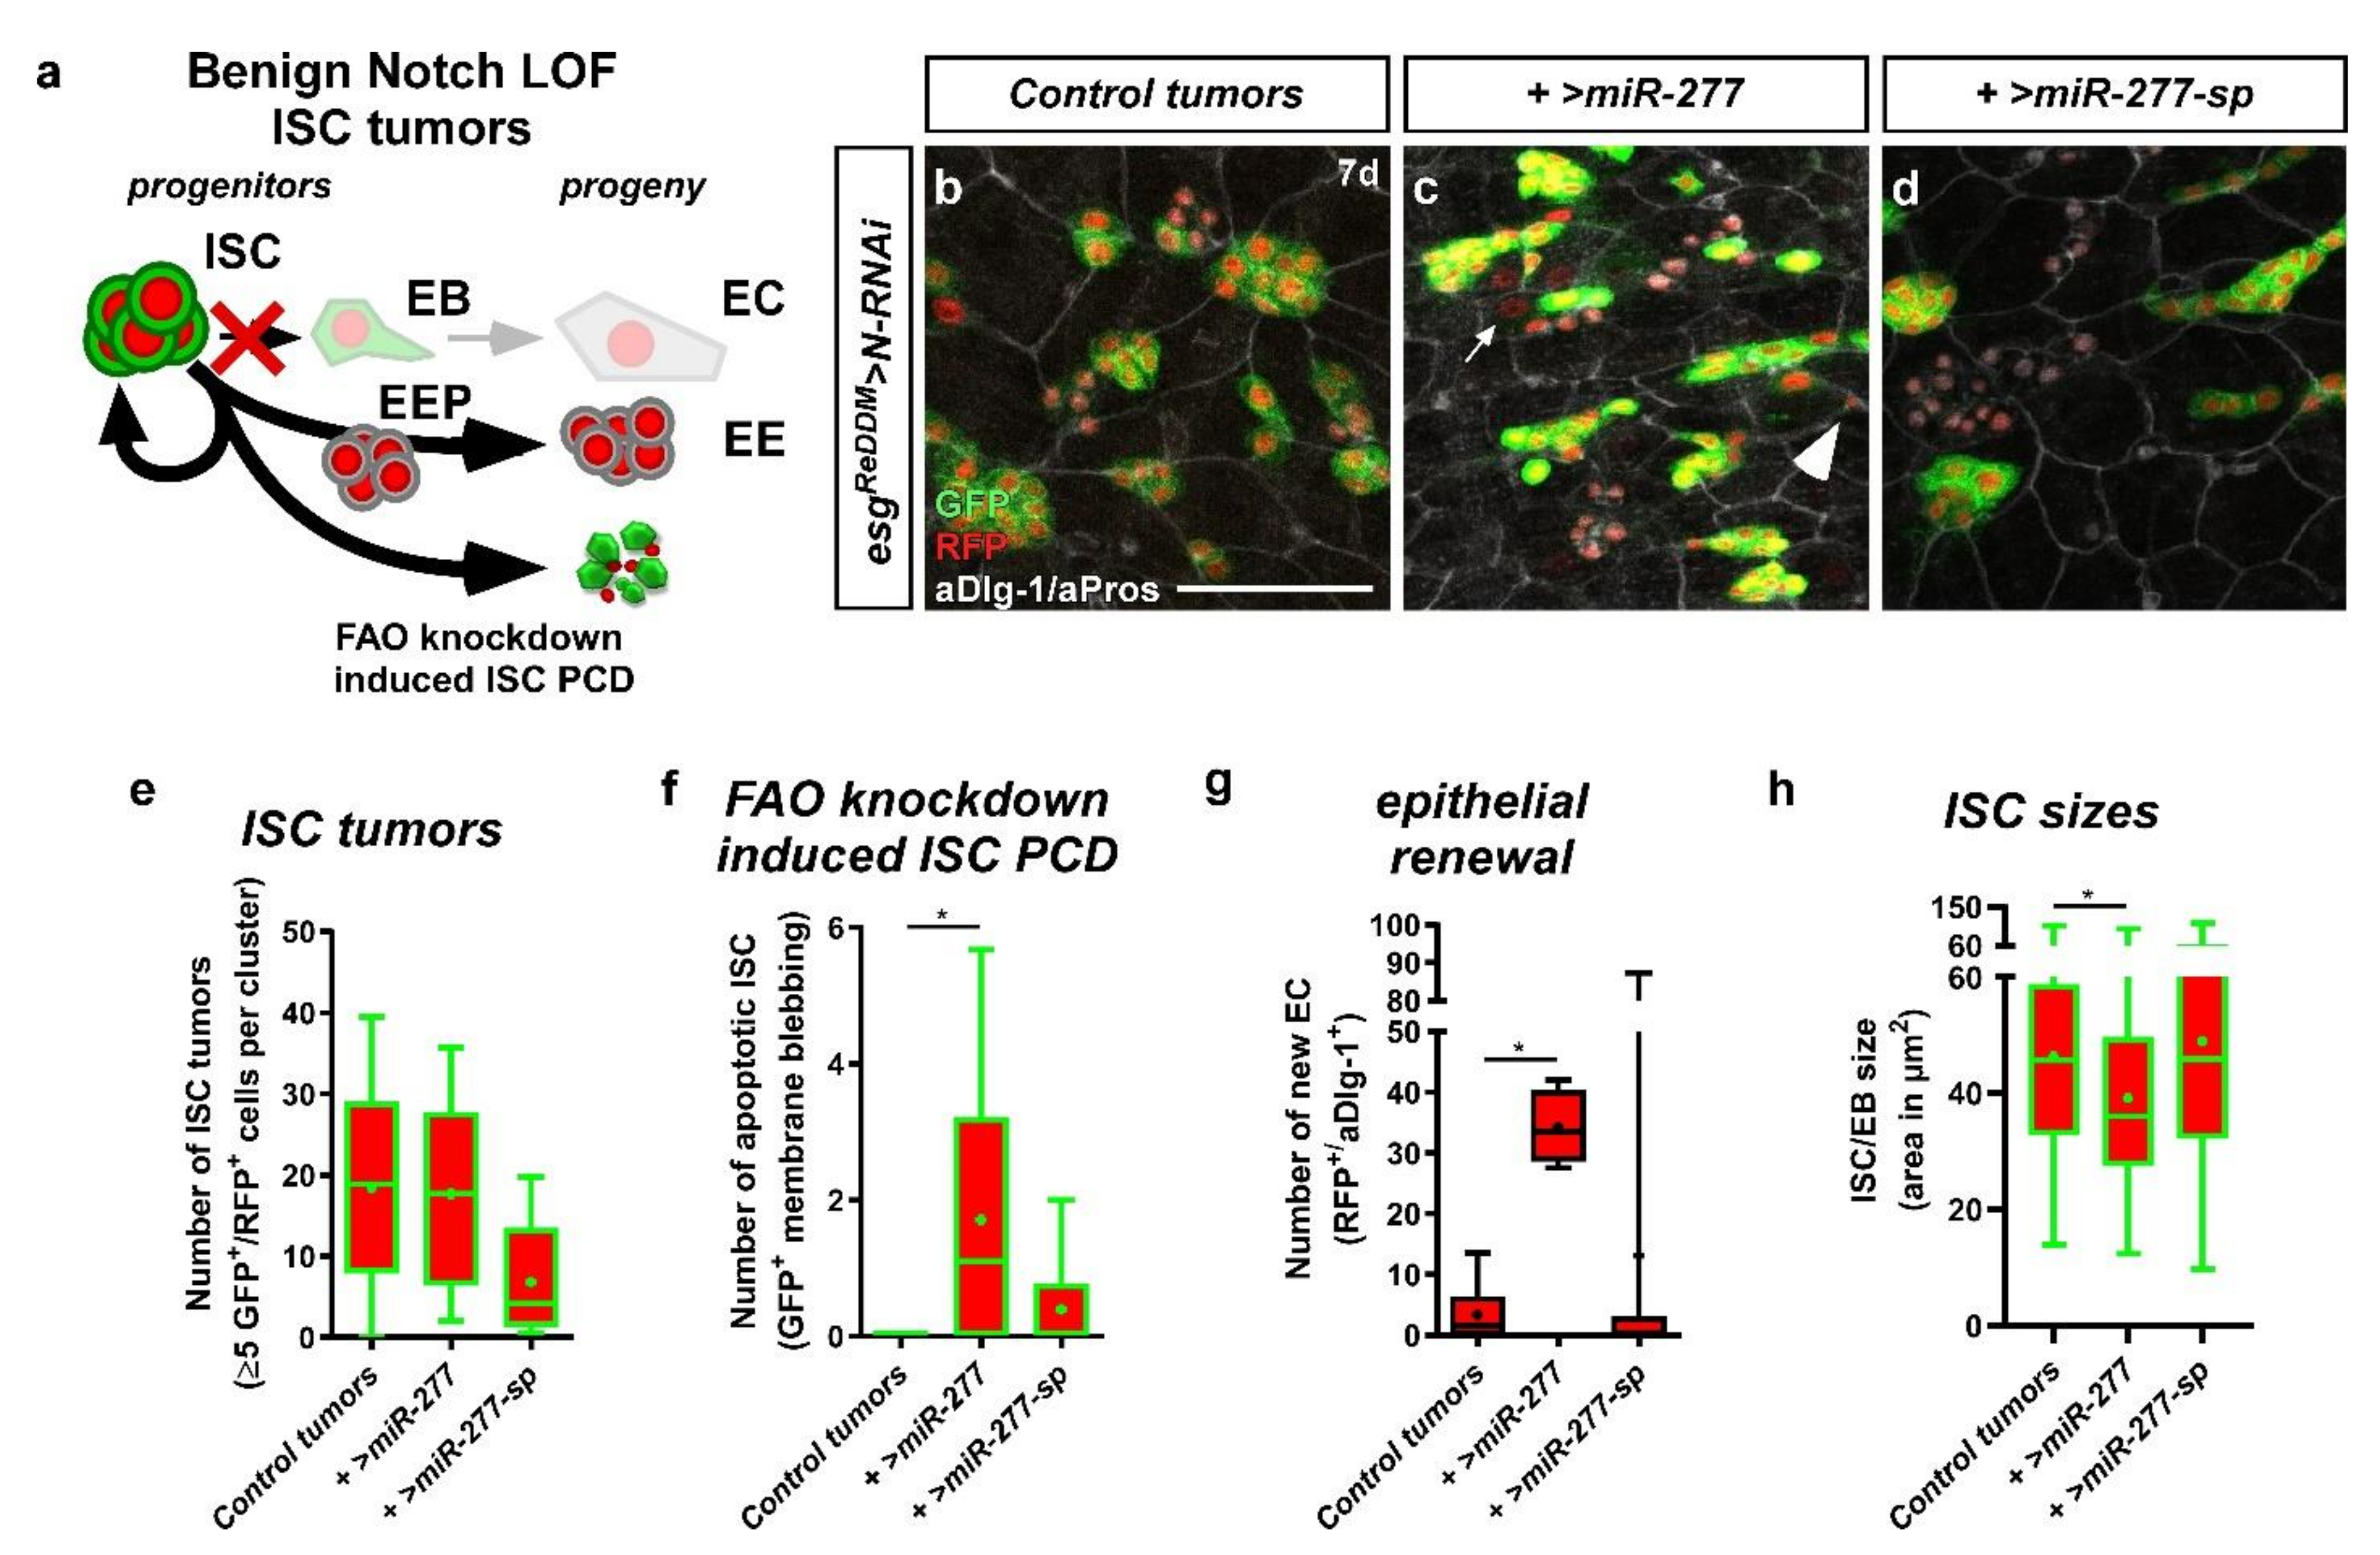
2.7. miR-277 in a Benign ISC Tumor Model

The discovery of miR-277-mediated ISC survival is intriguing, as ISC are known to resist radiation and chemically induced apoptosis. ISC have been established as cell of origin for colorectal cancer (CRC) in the mammalian and fly intestine [46,47,48,49]. While several mitogenic factors have been described, no factors regulating ISC survival have been identified [50] and might bear high therapeutic value. We previously described that revealing cell death in vivo is challenging as dying cells are cleared off rapidly from the intestinal epithelium by macrophages [21], which hampers quantification and might result in underestimation of apoptotic cell loss.
Here, we sought to circumvent this issue by raising the number of ISC using the established Notch (N) loss-of-function (LOF) tumor model (Figure 8a) [5,51]. N LOF results in the accumulation of ISC-like cells that are unable to differentiate (Figure 8a,b) [21]. Using esgReDDM tracing in combination with N LOF and forced miR-277 expression (Figure 8c), we found no effect on tumor number (Figure 8e), composition (Figure S6b), and size (Figure S6a). Strikingly, we found N-tumors with forced miR-277 expression to undergo high rates of apoptotic cell death (Figure 8f and Figure S6c,c’) and ISC-like cells are significantly reduced in size (Figure 8h). In addition, new epithelial EC differentiate from the tumors, which might reflect an escape from apoptosis through differentiation (Figure 8g).
Loss of programmed cell death is observed during tumorigenesis and is a hallmark of malignant growth. The basis of the used benign model, LOF of N receptors, is not a frequent alteration observed in CRC tumorigenesis, which is why we designed and established the first Drosophila model of CRC that is based on CRISPR-Cas9-induced gene excision (Figure 9a and Figure S7a). Individual conditional CRISPR-Cas9 gene editing of single tumor suppressors was recently shown to induce similar benign intestinal tumors [52]. We chose to mimic sporadic CRC development by targeting frequently mutated genes simultaneously that were previously shown to induce all hallmarks of CRC [49]. For that purpose, we advanced a cloning protocol for multiplex single-guideRNA arrays involving ‘scarless’ ligation with high efficiency (Figure S9) [53].
GuideRNAs in our model are under control of a UAS promoter and target apc1, apc2 (adenomatous polyposis coli 1&2), p53, Medea (dSmad4) and Pten (Phosphatase and tensin homolog) (Figure S7g,h). Transgenic flies were injected and subsequently recombined with flies harboring oncogenic >rasG12V, reflecting EGFR signaling gain of function (Figure 9a). To allow simultaneous Cas9 excisions, tracing, and UAS-driven genetic manipulations in ISC, we recombined an UAS-Cas9.P2 transgene into the esgReDDM tracing flies (esgReDDMCas9) (Figure S7a–c). In control experiments, ISC and EB appear more rounded upon Cas9.P2 expression (Figure S7c) in accordance with a previous study [52], but their numbers remain constant comparable to esgReDDM controls (Figure S7b) and also tissue homeostasis is not disrupted after seven days (Figure S7d,e). Additionally, we approached the efficiency of CRISPR-Cas9 events and found a 99% reduction crossing single guideRNA flies targeting CD8::GFP in esgReDDM (Figure S7f), proving highly efficient excision. One of several advantages of our CRISPR/Cas9-based model over previous CRC models [49] is the irreversibility of Cas9 excision, which also excludes possible compensation of RNAi-mediated knockdown.

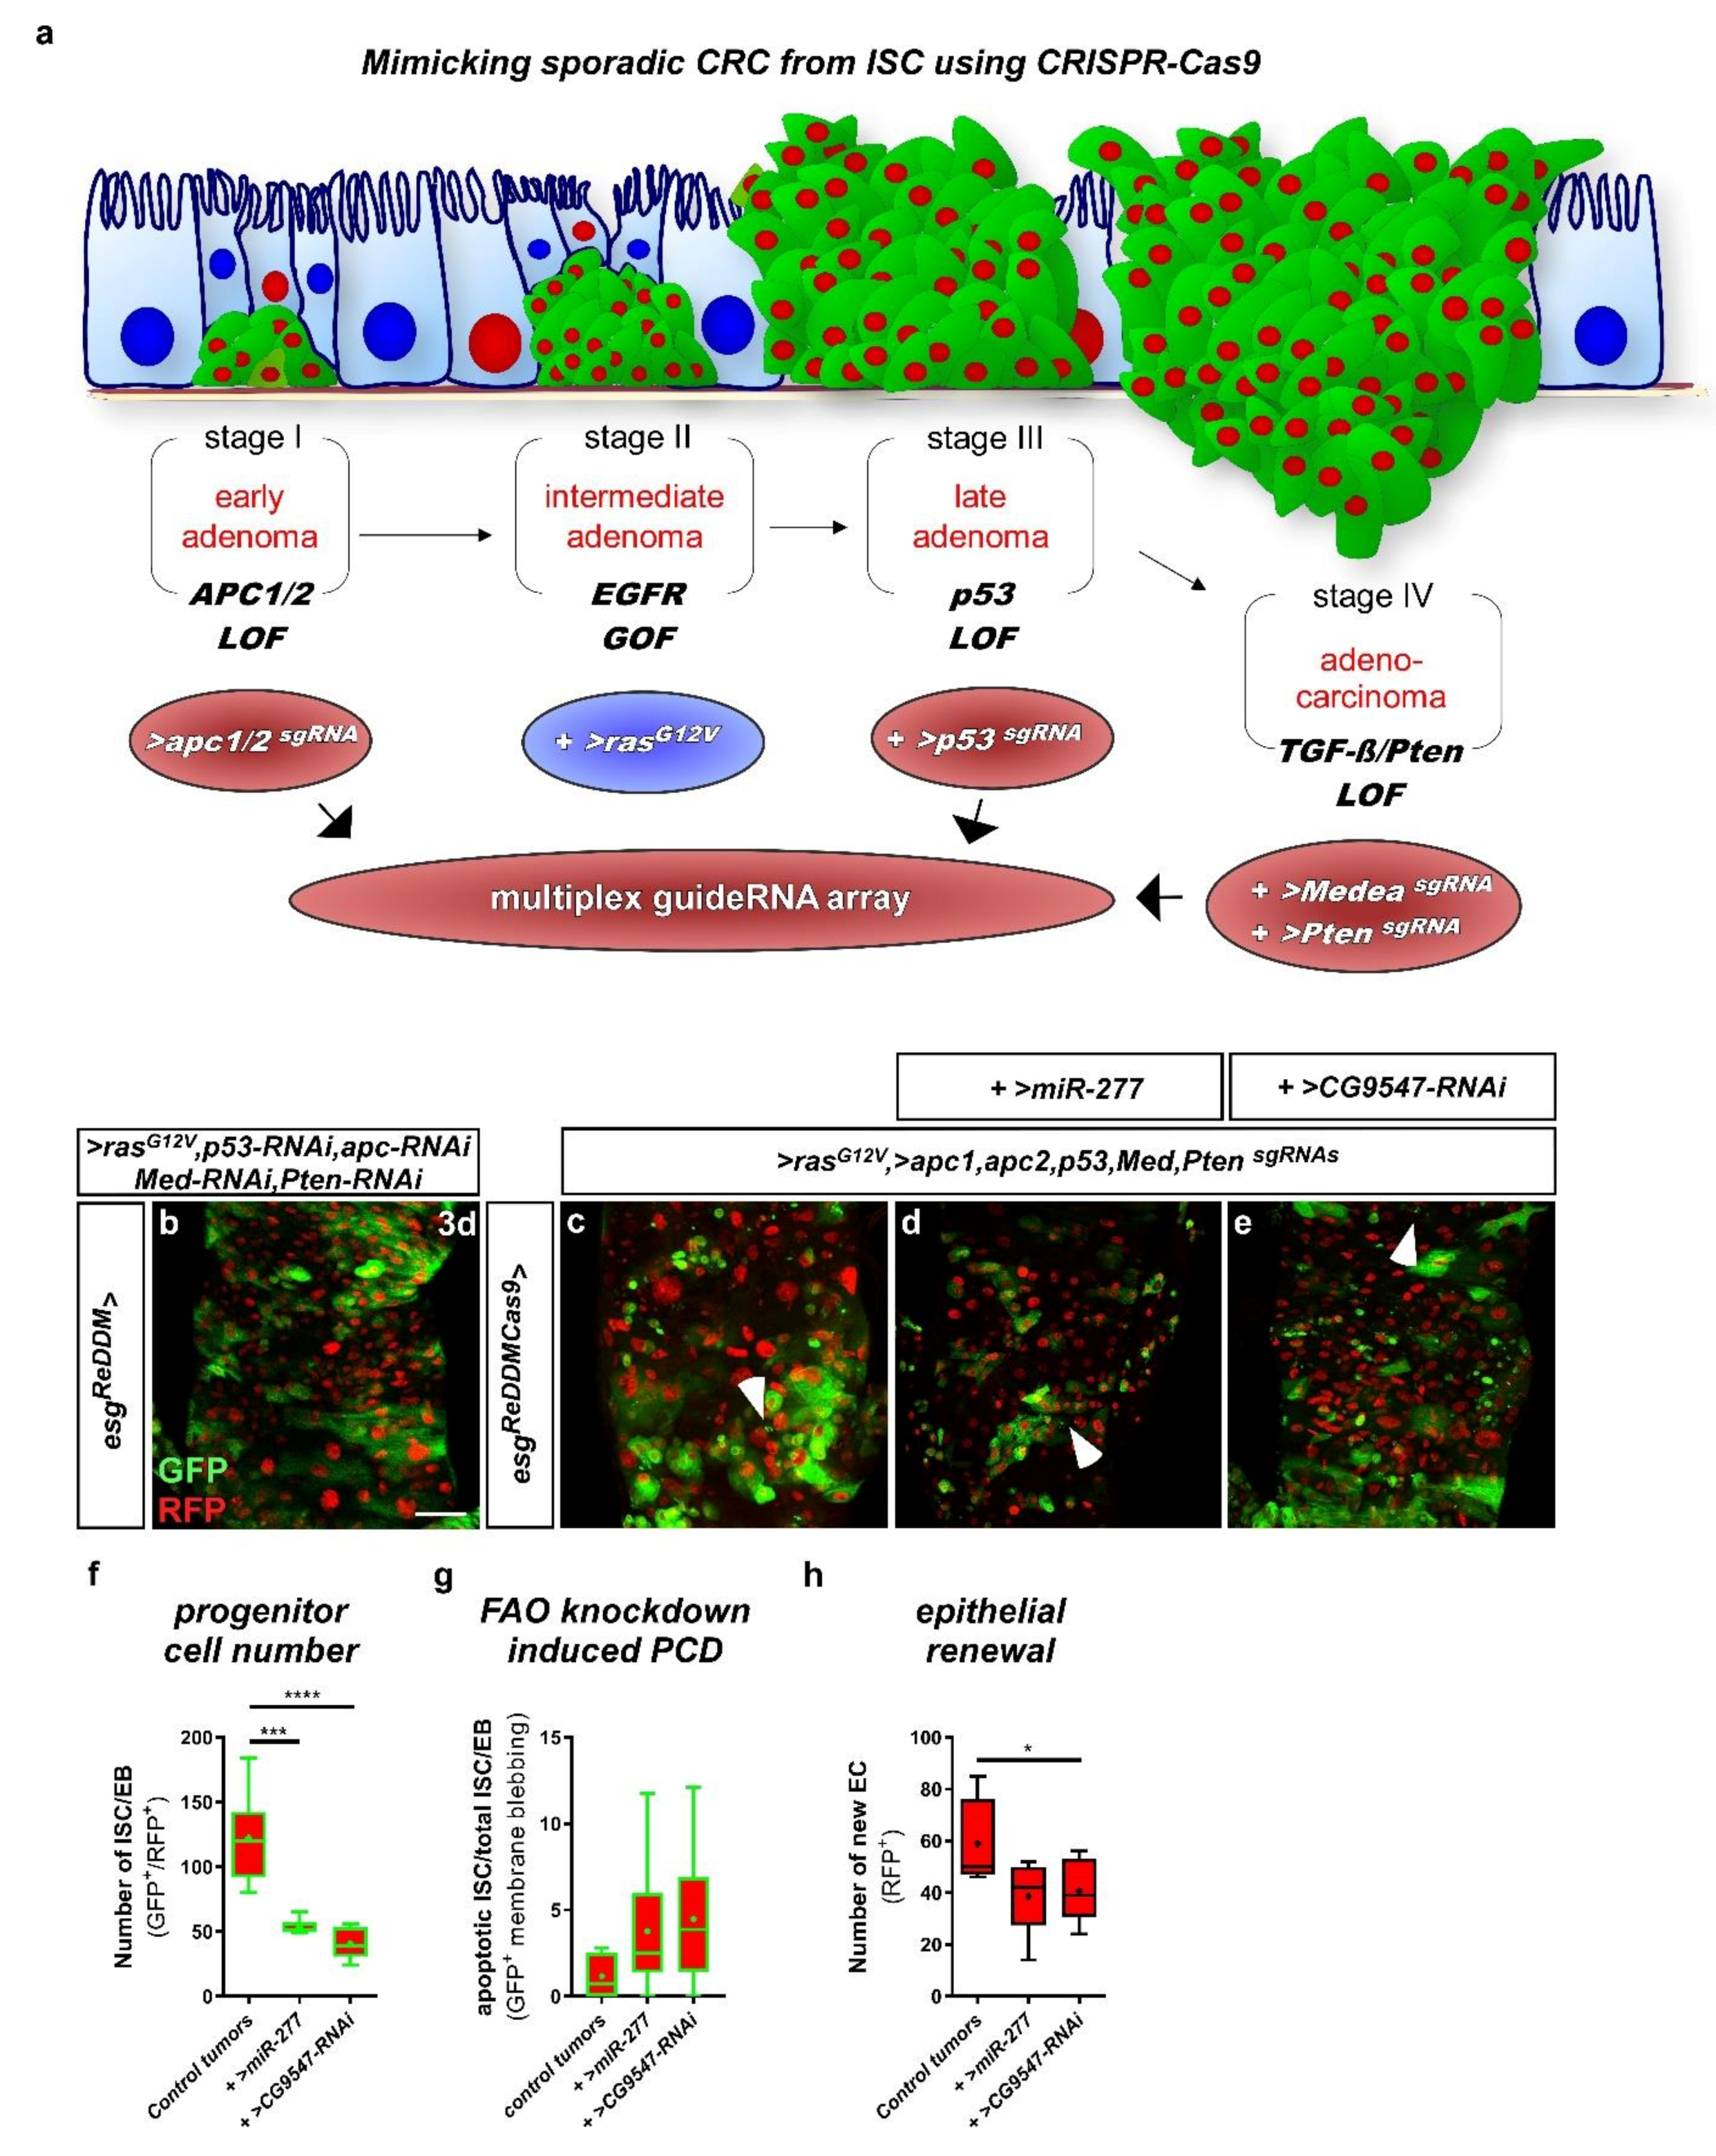
2.8. miR-277 and Colorectal Tumorigenesis

Firstly, we compared the CRC model from Bangi et al., 2016 [49] (Figure 9b) with our new model with CRISPR-Cas9 excision of apc1/2, p53, Medea, and Pten in conjunction with oncogenic rasG12V (Figure 9a). Using esgReDDMCas9 as an ISC-specific driver for intestinal tumorigenesis [46,47,48,49], virtually all ISC should be converted into aberrant CRC tumor stem cells (Figure S7f). Intestines of both CRC models showed strong proliferation, defective differentiation, overgrowth of progenitor cells, and multilayering (Figure 9c,d) revealed by additional esgReDDM tracing. Traced ISC and their progeny can be differentiated using specific markers for EC and EE (not shown). Progenitor cell production as well as turnover of the midgut is dramatically accelerated and after only 48–72h, the remaining hypotrophic epithelium consists of new EC only. Of note, complete renewal of the midgut epithelium in non-tumoral controls usually takes about 4 weeks [3,30].
Reprogramming of fatty acid metabolism was previously observed in various tumor entities [54]. We thus wanted to address whether miR-277, and thus expression levels of FAO genes, is affected in our CRC model. Therefore, we crossed the miR-277 sensor flies to our CRC model and investigated whether miR-277 levels change upon tumor induction (Figure S8a). esgReDDM tracing allows distinguishing between manipulated tumoral and unmodified intestinal cells (inset Figure S8b–c’). By determining GFP fluorescence intensity, we found that GFP levels inside of tumoral tissue are significantly higher than in the surrounding cells (Figure S8d). Thus, miR-277 levels are reduced in cells of the tumoral tissue, suggesting higher expression of FAO genes (Figure S8e).
Finally, we aimed at testing a putative favorable role of miR-277 and FAO genes and investigated whether forced miR-277 expression in our CRC model affects ISC-like cell survival, like in benign Notch tumors (Figure 8c,f,h). In our CRC model tumors, sporadic CRC gene deletions induce pleiotropic phenotypes including proliferation, differentiation, cellular growth, and multilayering (Figure 9a,c–e). On top of that, intestines with forced miR-277 expression (Figure 9d) or RNAi-mediated knockdown of CG9547 (Figure 9e), and thus, reduced levels of FAO gene expression, present further clearly distinct phenotypes (Figure 9c–e): (i) progenitor cells undergo apoptosis but with a similar frequency as controls (Figure 9g), which is probably owed to p53 deletion (Figure 9a); (ii) progenitor cell number (Figure 9f) and progeny are strongly reduced (Figure 9h).
In summary, our findings suggest an important role of miR-277-regulated FAO genes in intestinal stem cell metabolism. Using physiological and pathological paradigms, we show that suppressed FAO gene expression clearly affect intestinal stem cell size and once miR-277, in its role as a pan-FAO gene regulator, is forcedly expressed, ISC even become apoptotic, hampering tumoral growth. These findings are especially important in a pathological context as so far, no specific triggers for intestinal stem cell survival have been described. Our in vivo findings on intestinal stem cell metabolic gene expression might thus pave the way for future investigation of fatty acid oxidation as a promising new therapeutic target in colorectal cancer, but also other tumor entities relying on similar metabolic cues.

3. Discussion

Physiological in vivo data on stem cell metabolism is scarce owing to the complexity of experimental setup and availability of proper genetic sensors and tools. Here, we employed the fruit fly Drosophila melanogaster, taking advantage of its exhaustive genetic toolbox to study SC metabolism in an adult organism and investigated the metabolic gene expression profile of intestinal stem cells following leads from combined in silico resources. Building on the identification of miR-277 as a negative regulator of fatty acid β-oxidation (FAO), our data hint to a new and quiescent ISC population that depends on lipids as an energy source. In contrast to dispensable OXPHOS [20], a previous study discovered lipolysis involved in ISC survival [55]. In functional experiments, we discovered that FAO gene expression is essential for ISC survival, providing detailed insight on the metabolic cues by identifying miR-277 as controller of the majority of FAO enzymes, and show that they are capable of eliciting ISC starvation and subsequent apoptosis. Our data however cannot exclude effects of a miR-277-dependent regulation of further pathways, like BCAA catabolism [25], and further miR-277-regulated genes involved in similar phenotypes. ISC apoptosis can be triggered under physiological conditions, in turn disrupting tissue homeostasis, but importantly, is also observed in pathological contexts in a benign tumor model. In addition, FAO-deprived ISC show strongly reduced tumor size in a new CRISPR-Cas9 fly model of colorectal cancer.

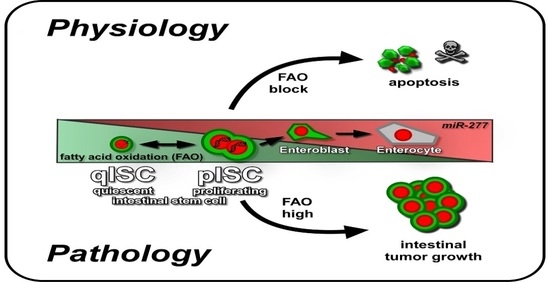
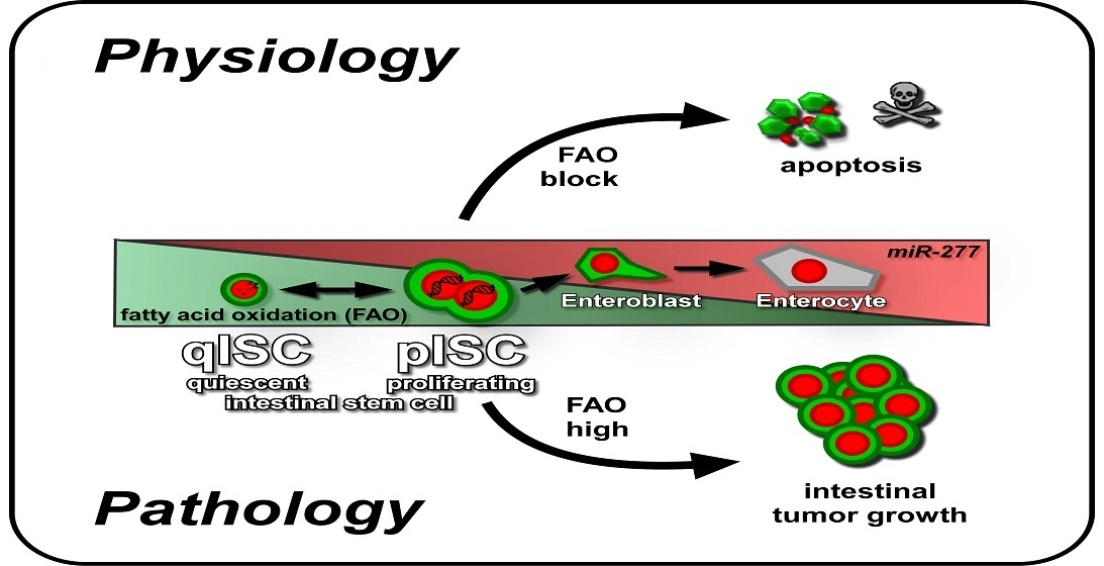
3.1. A Putative Role of Fatty Acid β-Oxidation in Controlling Quiescence in Stem Cells and their Lineage

The most important cue of our study, that requires and definitely warrants future investigation, is the discovery that ISC can be metabolically subdivided into a quiescent and an active ISC population using established markers [11,12,21,29,36] and existing scRNAseq data [13]. Although our data only provide a first step towards understanding the metabolic differences between quiescent and active ISC, several of our functional investigations support this hypothesis: (i) direct FAO downregulation by miR-277 and (ii) specific individual knockdown of FAO enzymes affects ISC size and (iii) subsequently their survival.
Stalling FAO as an energy source is thought to cause rapid depletion of acetyl-CoA [56]. Studies in yeast show that acetyl-CoA levels serve as checkpoint between quiescent and proliferative state. Furthermore, high acetyl-CoA drives the acetylation of histones with loci encoding for growth regulatory genes [57,58]. EB growth has previously been shown to depend on input from EGFR-Ras signaling and occurs in parallel with endoreplication and glycolysis during EB differentiation to polyploid absorptive EC [3,20,30,44,59]. Cellular growth is a crucial process that might require the anabolic generation of cell membrane from fatty acids. It is tempting to speculate that miR-277 expression reflects a switching mechanism for fatty acid usage between metabolic energy generation in quiescent ISC and cell membrane generation necessary in mitotically active ISC and growing EB. In line with this, SC in the Drosophila testis requires mitochondria and accumulates fatty acids when mitochondrial fusion is genetically ablated [60]. Interestingly, it was previously observed that knockdown of FAO enzymes phenocopy mitochondrial fusion defects [60,61]. A single study observed mitochondria in long cellular protrusions of intestinal progenitors, but did not perform any functional studies [62]. Studying the interplay between FAO and mitochondrial function in ISC and EB will be a fascinating topic for future studies.
The prime candidate pathway switching from quiescence to active ISC state and progenitor maturation is EGFR-Ras signaling. Apart from growth, EGFR stimulates proliferation in ISC under homeostatic conditions [20,44,59,63] and deprivation of EGFR signaling leads to programmed cell death of EB [21]. Interestingly, ISC are spared from blockade of EGFR-induced apoptosis and survive as mitotically inactive singletons supported by lineage tracing in two publications [21,59]. This further supports the idea that quiescent ISC are capable of surviving without EGFR input probably by relying on FAO as an energy source. Future efforts will aim to further dissect this metabolic switch. Central to resolve this issue is to reveal specific signals and conditions driving stem cells into FAO metabolism, such as is already known for fasting [64].

3.2. miR-277, Fatty Acid Oxidation and ISC Apoptosis

A commonality of all investigated FAO genes is their role in mitochondrial FAO and high levels of FAO genes in ISC further support the hypothesis that ISC harbor immature mitochondria [20]. Direct molecular interactions linking apoptosis and FAO have been described in various in vitro approaches, including human CRC cell lines [65,66,67]. In accordance with our data and a role for FAO in metabolism and subsequent ISC loss, our data shows that the CPT1A orthologue, whd (withered), diminishes progressively in the reconstructed lineages (Figure 3b). The whd orthologue catalyzes the transport of long-chain fatty acids from the cytoplasm to the mitochondria and whd mutants are highly sensitive to starvation and oxidative stress [68]. Further FAO genes follow that expression pattern from ISC declining to EC lineage: CG3902 (acyl-CoA dehydrogenase), CG5599 (dihydrolipoamide branched chain transacylase E2), CG9547 (glutaryl-CoA dehydrogenase), Mtpalpha (mitochondrial trifunctional protein), and yip2 (acetyl-CoA C-acetyltransferase) (Figure 3b and Figure 5c), which catalyzes the last step of FAO [69].
Studies in yeast support the idea of a connection between FAO and apoptosis induced at mitochondria as the yip2 orthologue ACAA2 interacts with proapoptotic BNIP3, a known interactor of Bcl-2, controlling cell survival [69]. Furthermore, murine ISC induce FAO upon fasting which in turn improves regeneration. The same authors found that ISC diminish over time when Cpt1a, the rate-limiting carnitine palmitoyltransferase in FAO, is genetically disrupted [56,64]. In our functional experiments, we could show that FAO knockdown in ISC phenocopies miR-277-induced starvation and subsequent apoptosis (Figure 7a–h).
In a previous study we found that progenitors undergoing apoptosis are cleared off rapidly e, which we circumvented by genetically increasing the number of ISC with the benign Notch tumor model. FAO depletion upon forced miR-277 expression drives a significant number of ISC into apoptosis, despite the pro-survival signal from N LOF [21]. The same experiments also showed that significantly more progenitors from N tumors escape cell death by differentiating to EC fate. This N-independent differentiation behavior was observed before for factors inducing EC fate [5,21,40]. In our case it might reflect a locally controlled metabolic switch of ISC to an early EB fate allowing OXPHOS by activating mitochondrial energy production and thus FAO independent survival and differentiation to EC.
It was also observed that mitotically active ISC in N tumors are located at the outer rim of the ISC clusters, where they are capable of receiving mitogens like the EGF-ligand spitz [51]. Thus, central ISC in an N tumor mass might become quiescent and, in case of additional >miR-277, undergo apoptosis because FAO cannot be activated (Figure 8f). Unfortunately, we and others failed to obtain reliable cleaved caspase 3 stainings in N tumors (Parthive Patel, personal communication) [51]. miR-277-induced apoptosis would in turn select for FAO-independent pISC, which might provide an explanation for the tendency of higher cell numbers (Figure S6a) found in our experiments. It will be an interesting topic for future studies to elucidate which factors sense and stimulate the necessity to enter quiescence.

3.3. The Role of miR-277 and FAO Genes in a CRC Model

Our observed dependence of ISC on FAO is of high importance as ISC are the established cells of origin for CRC in the mammalian intestine [46,47,48,49,55]. Furthermore, Drosophila ISC are known to resist radiation and chemically induced apoptosis [21,50], and in rodents, quiescent +4 ISC, but not LGR5+ ISC, are indispensable for intestinal homeostasis following radiation [70,71,72,73,74]. It is thus tempting to speculate that Drosophila and mouse ISC and patient CRC-SC have similar apoptotic dependencies. Until now, no other factors than FAO regulating ISC survival have been described [50,55,64]. Survival in various tumor entities depends on EGFR signaling, which is strongly altered in about two thirds of sporadic CRC patients [49]. The drugs Cetuximab and Panitumumab containing antibodies targeting EGFR signaling have become standard therapy [49,75]. Both drugs are highly effective in neoadjuvant therapy as tumor mass is strongly reduced, which facilitates timely resection before therapy resistance develops. However, resection remains the indispensable step for successful treatment as the vast reduction of tumor mass after treatments results from the reduction of transient-amplifying (TA)-like cells through (i) reduced EGFR-dependent ISC proliferation resulting in less TA cells, but more strikingly from (ii) a reduction of the more numerous, rapidly dividing TA cells. Additionally, data in Drosophila suggests that the analogous cell type to mammalian TA cells, the EB, respond to EGFR inhibition with apoptosis [21].
Unfortunately, fly ISC and human CRC stem cells do not share the apoptotic sensitivity of TA cells to EGFR antibody treatments, but are driven into quiescence [76]. It is tempting to speculate that quiescence and change to FAO metabolism enable CSC to survive treatment and in turn might explain rapid CRC recurrence after treatment. Drug therapy is known to exert selective pressure additionally promoting for e.g., oncogenic RAS or BRAF variants and thus contribute to the active selection for therapy-resistant tumor stem cells. Interestingly, using our newly developed CRC model, we found that introducing a mutational pattern resembling spontaneous CRC into ISC renders ISC resistant to miR-277/FAO-induced apoptosis. During the stepwise and stage-specific tumorigenesis, p53 mutation results in aberrant survival of tumor cells. As a consequence of loss of pro-apoptotic p53 in our CRC model, we found that ISC gain capability to withstand forced miR-277 expression (Figure 9f) in contrary to benign Notch tumors in which apoptosis can still take place normally (Figure 8f).
Loss of p53 is a key event in human colorectal tumorigenesis and our findings may add to the understanding of metabolic changes conferring survival and possibly also further tumor properties. Indeed, data from other tumor entities shows that cancer SC utilize FAO for self-renewal and resistance to chemotherapy [43,77]. The dependence of adult stem cells on mitochondrial FAO and lipid metabolism for their maintenance is not only highlighted in our study, but has also been evidenced in mammalian hematopoietic and neural SCs [78,79]. Our data provides additional understanding underlining the dependency of ISC on FAO and its control by a microRNA. In follow up studies, the possibilities of combinatorial treatments of FAO together with targeting EGFR might be investigated and their therapeutic combined value will be evaluated to help improve future cancer treatment.

4. Materials and Methods

4.1. In Silico microRNA Target Prediction

Targets of miRNAs are usually predicted by scanning for consensus sequences of their seed sequence in mRNA. Several online tools are available that generate lists of genes predicted to be regulated by a given miRNA. Depending on the stringency of the algorithm used in a particular prediction tool, dozens, up to the magnitude of thousands, of genes are predicted to be targets of a particular microRNA. To combine lists from four different prediction tools (Miranda, Pictar, Targetscan and a miRNA target collection from Bielefeld), we extracted multiple hits from all four tools and restricted the final list of eight genes that showed up in at least three of four predicted target lists (see Figure 1). The list of investigated microRNAs encompasses miRs-7, 8, 14, 34, 124, 277, 278, 315.
An earlier in silico study on miR-277 also identified the BCAA degradation pathway. However, it did not identify multiple hits in endocytosis nor fatty acid metabolism like our study, probably due to the early developmental state of prediction tools for miRNA targets [25,80]. As the vast majority of genes stemmed from FAO, our study focused on FAO metabolism and the role of miR-277 in ISC.

4.2. Genetics and fly Husbandry/Fly Strains

The following transgenic flies were employed: esgReDDM [3], NRE::mCherry [81], Gbe+Su(H)dsRed (T. Klein), UAS-miR-277 [25], Mex-Gal4, UAS-P35 (Bruce A. Hay), UAS-rasG12V,UAS-p53-RNAi,UAS-apc-RNAi;UAS-Med-RNAi,UAS-Pten-RNAi [49]. Ubi-GFP and Ubi-miR-277::GFP sensor flies are kindly provided by Klaus Förstemann. From Bloomington Drosophila Stock Center (BDSC): UAS-miR-277-sponge (BL61408), UAS-CG4860-RNAi (BL67769), UAS-CG9547-RNAi (BL53327), UAS-Mtpα-RNAi (BL32873), UAS-yip2-RNAi (BL36874), UAS-CG4389-RNAi (BL32873), UAS-CG5599-RNAi (BL32876), UAS-Cas9.P2 (BL58985), vas-phiC31;attP51C (BL24482), vas-phiC31;;attP86Fb (BL24749), UAS-rasG12V (II) (BL64195), UAS-rasG12V (III) (BL64196), U6-EGFP-sgRNA (BL79393), UAS-CG31075-RNAi (BL50654), UAS-mCherrymitoOMM (BL66532). From Vienna Drosophila Resource Center (VDRC): UAS-N-RNAi (GD14477), CG9547::sGFP (v318106).

4.3. Food Composition and Fly Keeping

Fly food contained 1424 g corn meal, 900 g malt extract, 800 g sugar beet syrup, 336 g dried yeast, 190 g soy fluor, 100 g agarose, 90 mL propionic acid, and 30 g NIPAGIN powder (antimycotic agent) in 20 L H2O. Food was cooked for about an hour to reduce bioburden, then filled into small plastic vials and cooled down to RT. Flies were kept at 25 °C except for crosses with temperature-sensitive GAL80ts (GAL4 repressor) which were kept at 18 °C (permissive temperature) until shifted to 29 °C (restrictive temperature) to activate GAL4-mediated transgene expression. Crosses with esgReDDM were carried out as described previously [3,6,30]. Due to persisting problems with mucous formation on food surface in vials with VF, all experiments distinguishing between mated and virgin female flies were run on food with twice the amount of NIPAGIN. Mucous formation was avoided because of massive induction of tissue renewal by pathogenic stress.

4.4. RNA Isolation and cDNA Synthesis

The midguts from at least 5 mated female flies were dissected and transferred into a droplet of RNA later Solution (Invitrogen by Thermo Fisher Scientific, Bremen, Germany) on ice. The dissected tissue was homogenized in 100 µL peqGOLD TriFast (VWR Life Science) and total RNA was isolated as specified by the manufacturer. The following cDNA synthesis was performed with 250 ng of total RNA and the SuperScript IV Reverse Transcriptase (Invitrogen by Thermo Fisher Scientific) using a 1:1 mixture of oligo-dT primers and random hexamers directly upon RNA isolation. Prior to Real-time qPCR, cDNA samples were diluted 1:4 in dH2O.

4.5. Real-Time qPCR and Conventional PCR

Expression levels of predicted miR-277 target genes were determined upon forced expression of miR-277 in enterocytes of midguts from adult Drosophila. Mexts> flies were crossed to w1118 (control) or >miR-277 flies at 18 °C and their progeny shifted to 29 °C for 24 h prior to RNA isolation and cDNA synthesis before running the qPCRs. After an enzyme activation step (2 min 95 °C), 40 cycles of denaturation (15 s 95 °C), primer annealing (20 s 58 °C) and elongation (30 s 72 °C) were run. SYBR Green intensities were measured at the end of every elongation step and a melting curve was calculated at the end of the PCR reaction. Primers were designed to anneal at 59 °C. Reaction was set up with KAPA SYBR FAST Universal (Roche) in a total volume of 10 µL. All qPCR results were normalized to the house-keeping gene rp49. For gel visualization (Figure 1c), the qPCR protocol was used and visualized on 2% agarose gel (Table 1).

4.6. Plasmid Cloning

For cloning of multiple sgRNAs into the pCFD6 plasmid [82], a SapI restriction site in pCFD6 was removed by site-directed mutagenesis (SDM) using a pfu polymerase (Promega) following the QuikChange II-E-Site-Directed Mutagenesis Kit Manual (Agilent). The following primers were used for SDM: pCFD6_SDM_noSapI_for TTGCGTATTGGGCGCACTTCCGCTTCC and pCFD6_SDM_noSapI_rev GGAAGCGGAAGTGCGCCCAATACGCAA to generate the pCFD6_noSapI plasmid. Successful removal of the SapI restriction site was verified by Sanger Sequencing.

4.7. gRNA Design

The CRISPR Optimal Target Finder [83] was used to design gRNAs and to search for possible off-targets. Gene regions of the tumor suppressors apc1, apc2, p53, Med, and Pten, which are orthologous to the most frequently mutated genes in CRC patients [49], were copied into the target finder. Additionally, a gRNA targeting the EGFR signaling repressor capicua (cic) was designed to induce an activation of EGFR signaling, which is the second most common step in colon carcinogenesis. CRISPR targets with a length of 20 bp and a 5′ NGG were identified using Drosophila melanogaster (reference genome, r_6) as reference. The specificities of identified CRISPR targets were evaluated using the CRISPR Optimal Target Finder [83] with maximum stringency searching for NGG and NAG PAMs in the Drosophila melanogaster (reference genome, r_6) reference genome. For each gene the CRISPR target with the lowest number of off-targets was selected (Table 2).
Forward primers for gRNA amplification were designed containing a BbsI or SapI restriction site, the selected guide sequence, and a sequencecomplementary to the gRNAcore on the pCFD6_noSapI plasmid (5′-3′). Reverse primers for gRNA amplification were designed containing a BbsI or SapI restriction site matching the forward primer, two SapI or BbsI restriction sites contrariwise to the flanking restriction sites, and a sequence complementary to the tRNA sequence of the pCFD6_noSapI plasmid (5′-3′). A linker between the flanking BbsI or SapI restriction sites and the remaining primer sequence was added to enable seamless cloning of multiple gRNAs. The last guide sequence targeting Pten was added to a final reverse primer, which lacks additional restriction sites. PCR reactions were performed using the Q5® High-Fidelity DNA Polymerase (NEB, New England Biolabs) and the pCFD6_noSapI as template DNA. Resulting in fragments of gRNA, gRNAcore, tRNA and two SapI or BbsI restriction sites flanked by BbsI or SapI restriction sites (Figure S9).
The pCFD6_noSapI plasmid contains a gRNAcore followed by a tRNA sequence which are flanked by BbsI restriction sites. The DNA fragment containing the first gRNA1 followed by the gRNAcore sequence, the tRNA sequence, and two SapI restriction sites is also flanked by BbsI restriction sites. This fragment is combined with the plasmid by cutting with the BbsI restriction enzyme prior to ligation. The next DNA fragment contains the second target sequence, gRNA2, and two BbsI restriction sites. This fragment is flanked by SapI restriction sites and added to the plasmid by cutting with the SapI restriction enzyme and ligation. The third DNA fragment is designed as the first one with except for the gRNA sequence, along with others. To create these fragments, primer pairs were designed with forward primers binding the gRNAcore sequence on the plasmid and the specific gRNA sequence and flanking restriction site in a primer extension. The reverse primers consist of a sequence complementary to the tRNA sequence in the plasmid and the specific restriction sites in an extension (Table 3).
The pCFD6_noSapI plasmid and the DNA fragment containing the first gRNA flanked by BbsI restriction sites were cut by the BbsI restriction enzyme (NEB, New England Biolabs) prior to ligation of the fragment into the plasmid using a T4 ligase (NEB, New England Biolabs). In the next step, the created plasmid now containing the two SapI restriction sites 3′ of the first gRNA and the second DNA fragment containing the next gRNA flanked by SapI restriction sites were cut by the SapI restriction enzyme (NEB, New England Biolabs) prior to ligation. These steps were repeated until the gRNAs of all six genes were ligated into the pCFD6_noSapI plasmid. The resulting construct was injected into flies containing a phiC31 integrase and an attP docking site.
Transformant flies carrying the construct were identified by eye color produced by a mini-white gene which is inserted into the construct. These flies were used to establish stocks in single crosses. Later successful excisions mediated by the gRNA construct and the Cas9 protein were verified by PCR using primers flanking the targeted gene regions and genomic DNA from fly guts of esgReDDMCas9 controls and esgReDDMCas9>apc1,apc2,cic,Med,p53,Pten sgRNAs as templates. A knockout of cic could not be verified; instead, the UAS-rasG12V transgene was added to activate EGFR signaling and the cic-sgRNA was left out in the genotypic description.

4.8. Immunohistochemistry

Dissected guts from mated female flies were fixed in 4% PFA in 1XPBS for 45 min. After fixation the guts were washed with 1XPBS for 10 min and stained with primary antibodies 1:500 anti-Ssk (rabbit; [84]); 1:250 anti-Dlg-1 [mouse; Developmental studies Hybridoma Bank (DSHB)]; 1:250 anti-Pros [mouse; Developmental studies Hybridoma Bank (DSHB)], 1:200 anti-Casp3 [rabbit, Cell signalling technology cleaved caspase-3 (Asp175)], 1:200 anti-GFP [chicken, Abcam (ab13970)], 1:200 anti-Dl [mouse, Developmental studies Hybridoma Bank (DSHB, C594.9B)]) diluted in 0.5% PBT (0.5% Triton (Sigma-Aldrich) in 1XPBS) + 5% normal goat serum (Thermo Fisher Scientific, Berman, Germany). Primary antibody staining was performed at 4 °C over night on an orbital shaker. Next, guts were washed with 1XPBS for 10 min and incubated with secondary antibodies (1:500 Goat anti-RabbitAlexa568 [Invitrogen], 1:500 Goat anti-MouseAlexa647 [Invitrogen], 1:500 Goat anti-RabbitAlexa647 [Invitrogen], 1:500 Goat anti-chickenAlexa488 [Invitrogen]) and DAPI (1:1000; 100 µg/mL stock solution in 0.18 M Tris pH 7.4; DAPI No. 18860, Serva, Heidelberg) for at least 1.5 h at RT. After washing with 1XPBS for 10 min the stained guts were mounted in Fluoromount-G Mounting Medium (Electron Microscopy Sciences).

4.9. Image Acquisition

The posterior parts of stained midguts were imaged using a LSM 710 confocal microscope (Carl Zeiss) using ‘Plan-Apochromat 20 × /0.8 M27′ and ‘C-Apochromat 40 × /1.20 W Corr M27′ objectives. Image resolution was set to at least 2048 × 2048 pixels. Focal planes with 1 µm distance were scanned and combined into Z-stacks to image one cell layer of the tubular gut and to compensate for gut curvature.

4.10. Quantification of Proliferation, Cell Size and Fluorophore Intensity Measurements

Quantification of progenitor cell number and epithelial renewal and fluorescence intensity measurements were performed as described previously [5]. Fiji (ImageJ 1.51 n, Wayne Rasband, National Institutes of Health, USA) was used to calculate maximum intensity images from z-stack images. GFP positive progenitor cells of esgReDDM [3] guts were counted manually whereas RFP positive renewed epithelial cells were counted semi-automatically by a self-written macro for Fiji. Cell size measurements were performed in Fiji by outlining the single cells by hand and measuring the area.
Midguts of Ubi-miR-277::GFP sensor flies and the Ubi-GFP controls or CG9547::sGFP flies were scanned with fixed laser settings and exposure times. Mean intensities of manually selected areas were determined using Fiji.

4.11. Statistical Analysis

GraphPad Prism 9.0.0 was used to run statistical analysis and create graphs of quantifications. For single comparisons, data sets were analyzed by two-sided unpaired t-test. Multiple comparisons were analyzed by one-way ANOVA and Turkey’s post-hoc test. Significant differences are displayed as * for p ≤ 0.05, ** for p ≤ 0.01, *** for p ≤ 0.001 and **** for p ≤ 0.0001.

4.12. Metabolic Landscape of Adult Drosophila Midgut at Single Cell Level

4.12.1. Preprocessing

Previously published single-cell RNA sequencing data derived from 10,605 midgut epithelial cells from 7-d-old females were retrieved from Gene Expression Omnibus accession GSE120537 [13]. Gene expression values were gene length normalized in TPM (transcripts per million) space and log2 transformed. For genes associated with multiple transcripts, the longest transcript length was used. Transcript lengths were obtained from Ensembl Biomart (https://m.ensembl.org/index.html, accessed on 5 November 2021). Missing gene expression values were input using scImpute algorithm with default settings and only applied to genes with dropout rates larger than 50% to prevent over-input [85]. Metabolic gene lists were downloaded from KEGG database (http://www.kegg.jp/, accessed on 5 November 2021). Input expression values were used for t-SNE clustering [86] using Rtsne package with default settings after Krijthe, J. H. Rtsne: T-Distributed Stochastic Neighbor Embedding using Barnes-Hut Implementation. https://github.com/jkrijthe/Rtsne, 2015, accessed on 5 November 2021].

4.12.2. Normalization

Four normalization methods were evaluated. Upper-quartile [87] and trimmed mean of M-values [88] were implemented using calcNormFactors function from the edgeR package [88]. Relative log expression [89] was implemented from DESeq2 [90], Deconvolution normalization using the scran package computed tumor subgroup-specific size factors [91]. Read counts were divided by size factors corresponding to tumor subgroup and then transformed back to TPM. Only genes with dropout rate <0.75 were used as reference genes for normalization to avoid noise from low-expressed genes. Performance of the methods was evaluated using the distributions of relative gene expression values amongst different cell types. The deconvolution normalization derived expression values were used, as it was most effective in minimizing the differences in the distributions of relative gene expression levels between the cell types (Figure S2c).

4.12.3. Pathway Activity Analysis

The pathway score analysis from Xiao et al. was used with the input and deconvolution-normalized values [92]. The pathway activity score is defined as the relative gene expression values averaged over all genes in a specific pathway and all subgroup cells of this type [92]. Statistical significance of pathway activities in specific subgroups was calculated by random permutation test, where subgroup labels were randomly shuffled 5000 times to simulate null distribution, followed by comparison of pathway activity scores to original scores.
All code is available from the authors upon request.

Supplementary Materials

The following supporting information can be downloaded at: https://www.mdpi.com/article/10.3390/metabo12040315/s1. Figure S1: Overview of metabolic pathways in biological systems, Figure S2: Analysis of metabolic pathways and their activity in different cell types, Figure S3: Subclustered quiescent ISC (esg+, Dl and klu) within the metabolic ISC cluster are negative for expression of the EE marker pros, Figure S4: esgReDDM tracing of ISC/EB with forced miR-277 expression and block of apoptosis, Figure S5: esgReDDM tracing and manipulation of miR-277 target genes CG4389 and CG5599 for 21 days and endogenous CG9547 expression in different cell types, Figure S6: esgReDDM tracing and manipulation of miR-277 in the Notch tumor model, Figure S7: Comparison of the esgReDDM and esgReDDMCas9 system and schematic composition of the newly developed CRISPR-Cas9 CRC model, Figure S8: miR-277-expression in CRC tumors revealed by miR-277::GFP sensor flies, Figure S9: schematic illustration of the strategy for seamless cloning of multiple gRNAs into the pCFD_noSapI plasmid.

Author Contributions

Conceptualization, Z.A.A. and T.R.; Formal analysis, L.Z. and S.B.; Funding acquisition, T.R.; Investigation, L.Z. and N.H.K.; Software, S.B.; Supervision, Z.A.A. and T.R.; Visualization, T.R.; Writing–original draft, L.Z., Z.A.A. and T.R.; Writing–review & editing, L.Z., Z.A.A. and T.R. All authors have read and agreed to the published version of the manuscript.

Funding

The research was funded by Wilhelm Sander Stiftung: 2018.145.1; Deutsche Forschungsgemeinschaft: RE-3453/3-1 and The Camden Health Research Initiative (CHRI) Award: 2020–2023.

Institutional Review Board Statement

Not applicable.

Informed Consent Statement

Not applicable.

Data Availability Statement

The data presented in this study are available in the article and supplementary materials.

Acknowledgments

We thank Klaus Förstemann, Thomas Klein, Michael Krahn, the Bloomington Drosophila Stock Center (NIHP400D018537), the Transgenic RNAi Project (TRiP) at Harvard Medical School (NIK/NIGMS R01-GM084947) and the Vienna Drosophila Resource Center (VDRC, http://www.vdrc.at, accessed on 5 November 2021) for providing transgenic fly stocks. We would like to acknowledge the Center for Advanced Imaging (CAi) at Heinrich Heine University for providing support with imaging and access to the Zeiss LSM 880 microscope system (DFG INST 208/746-1 FUGG) and Zeiss LSM 710 microscope system (DFG INST 208/539-1 FUGG). TR and ZA thank Maria Dominguez in whose lab we initiated this project and Thomas Klein for being a very supportive host. The project is funded by a Deutsche Forschungsgesellschaft (DFG-Sachbeihilfe RE 3453/2–1) grant. LZ is supported by the Wilhelm Sander-Stiftung (2018.145.1).

Conflicts of Interest

The authors declare no conflict of interest.

References

  1. Lai, X.; Wolkenhauer, O.; Vera, J. Understanding microRNA-mediated gene regulatory networks through mathematical modelling. Nucleic Acids Res. 2016, 44, 6019–6035. [Google Scholar] [CrossRef] [PubMed] [Green Version]
  2. Lamouille, S.; Subramanyam, D.; Blelloch, R.; Derynck, R. Regulation of epithelial–mesenchymal and mesenchymal–epithelial transitions by microRNAs. Curr. Opin. Cell Biol. 2013, 25, 200–207. [Google Scholar] [CrossRef] [PubMed] [Green Version]
  3. A Antonello, Z.; Reiff, T.; Ballesta-Illan, E.; Dominguez, M. Robust intestinal homeostasis relies on cellular plasticity in enteroblasts mediated by miR-8–Escargot switch. EMBO J. 2015, 34, 2025–2041. [Google Scholar] [CrossRef] [PubMed]
  4. Hu, S.; Jiang, Q.; Luo, D.; Zhao, L.; Fu, X.; Chen, Y.; Song, X.; Li, L.; Zhao, H.; He, Y.; et al. miR-200b is a key regulator of tumor progression and metabolism targeting lactate dehydrogenase A in human malignant glioma. Oncotarget 2016, 7, 48423–48431. [Google Scholar] [CrossRef]
  5. Zipper, L.; Jassmann, D.; Burgmer, S.; Görlich, B.; Reiff, T. Ecdysone steroid hormone remote controls intestinal stem cell fate decisions via the PPARγ-homolog Eip75B in Drosophila. eLife 2020, 9, e55795. [Google Scholar] [CrossRef]
  6. Reiff, T.; Jacobson, J.; Cognigni, P.; Antonello, Z.; Ballesta, E.; Tan, K.J.; Yew, J.Y.; Dominguez, M.; Miguel-Aliaga, I. Endocrine remodelling of the adult intestine sustains reproduction in Drosophila. eLife 2015, 4, e06930. [Google Scholar] [CrossRef] [Green Version]
  7. Ahmed, S.M.H.; Maldera, J.A.; Krunic, D.; Paiva-Silva, G.O.; Pénalva, C.; Teleman, A.A.; Edgar, B.A. Fitness trade-offs incurred by ovary-to-gut steroid signalling in Drosophila. Nature 2020, 584, 415–419. [Google Scholar] [CrossRef]
  8. Dutta, D.; Dobson, A.; Houtz, P.L.; Gläßer, C.; Revah, J.; Korzelius, J.; Patel, P.; Edgar, B.A.; Buchon, N. Regional Cell-Specific Transcriptome Mapping Reveals Regulatory Complexity in the Adult Drosophila Midgut. Cell Rep. 2015, 12, 346–358. [Google Scholar] [CrossRef] [Green Version]
  9. Buchon, N.; Osman, D.; David, F.P.; Fang, H.Y.; Boquete, J.P.; Deplancke, B.; Lemaitre, B. Morphological and molecular characterization of adult midgut compartmentalization in Drosophila. Cell Rep. 2013, 3, 1725–1738. [Google Scholar] [CrossRef] [Green Version]
  10. Stine, R.R.; Sakers, A.P.; TeSlaa, T.; Kissig, M.; Stine, Z.E.; Kwon, C.W.; Cheng, L.; Lim, H.-W.; Kaestner, K.H.; Rabinowitz, J.D.; et al. PRDM16 Maintains Homeostasis of the Intestinal Epithelium by Controlling Region-Specific Metabolism. Cell Stem. Cell 2019, 25, 830–845.e8. [Google Scholar] [CrossRef]
  11. Ohlstein, B.; Spradling, A. The adult Drosophila posterior midgut is maintained by pluripotent stem cells. Nature 2006, 439, 470–474. [Google Scholar] [CrossRef] [PubMed]
  12. Micchelli, C.A.; Perrimon, N. Evidence that stem cells reside in the adult Drosophila midgut epithelium. Nature 2006, 439, 475–479. [Google Scholar] [CrossRef] [PubMed]
  13. Hung, R.J.; Hu, Y.; Kirchner, R.; Liu, Y.; Xu, C.; Comjean, A.; Tattikota, S.G.; Li, F.; Song, W.; Sui, S.H.; et al. A cell atlas of the adult Drosophila midgut. Proc. Natl. Acad. Sci. USA 2020, 117, 1514–1523. [Google Scholar] [CrossRef] [PubMed]
  14. Chen, J.; Xu, N.; Wang, C.; Huang, P.; Huang, H.; Jin, Z.; Yu, Z.; Cai, T.; Jiao, R.; Xi, R. Transient Scute activation via a self-stimulatory loop directs enteroendocrine cell pair specification from self-renewing intestinal stem cells. Nat. Cell Biol. 2018, 20, 152–161. [Google Scholar] [CrossRef]
  15. Hu, C.; Fan, L.; Cen, P.; Chen, E.; Jiang, Z.; Li, L. Energy Metabolism Plays a Critical Role in Stem Cell Maintenance and Differentiation. Int. J. Mol. Sci. 2016, 17, 253. [Google Scholar] [CrossRef] [Green Version]
  16. Shyh-Chang, N.; Daley, G.Q.; Cantley, L.C. Stem cell metabolism in tissue development and aging. Development 2013, 140, 2535–2547. [Google Scholar] [CrossRef] [Green Version]
  17. Biteau, B.; Karpac, J.; Supoyo, S.; DeGennaro, M.; Lehmann, R.; Jasper, H. Lifespan Extension by Preserving Proliferative Homeostasis in Drosophila. PLoS Genet. 2010, 6, e1001159. [Google Scholar] [CrossRef] [Green Version]
  18. Mattila, J.; Kokki, K.; Hietakangas, V.; Boutros, M. Stem Cell Intrinsic Hexosamine Metabolism Regulates Intestinal Adaptation to Nutrient Content. Dev. Cell 2018, 47, 112–121.e3. [Google Scholar] [CrossRef] [Green Version]
  19. Deng, H.; Takashima, S.; Paul, M.; Guo, M.; Hartenstein, V. Mitochondrial dynamics regulates Drosophila intestinal stem cell differentiation. Cell Death Discov. 2018, 4, 81. [Google Scholar] [CrossRef] [Green Version]
  20. Jin, Y.; Zhang, C.; Marchetti, M.; Hammouda, O.; Edgar, B. EGFR Signaling Activates Intestinal Stem Cells by Promoting Mitochondrial Biogenesis. SSRN Electron. J. 2021. [Google Scholar] [CrossRef]
  21. Reiff, T.; Antonello, Z.A.; Ballesta-Illán, E.; Mira, L.; Sala, S.; Navarro, M.; Martinez, L.M.; Dominguez, M. Notch and EGFR regulate apoptosis in progenitor cells to ensure gut homeostasis in Drosophila. EMBO J. 2019, 38, e101346. [Google Scholar] [CrossRef] [PubMed]
  22. Schell, J.C.; Wisidagama, D.R.; Bensard, C.; Zhao, H.; Wei, P.; Tanner, J.; Flores, A.; Mohlman, J.; Sorensen, L.K.; Earl, C.S.; et al. Control of intestinal stem cell function and proliferation by mitochondrial pyruvate metabolism. Nat. Cell Biol. 2017, 19, 1027–1036. [Google Scholar] [CrossRef] [PubMed]
  23. Urbich, C.; Kuehbacher, A.; Dimmeler, S. Role of microRNAs in vascular diseases, inflammation, and angiogenesis. Cardiovasc. Res. 2008, 79, 581–588. [Google Scholar] [CrossRef] [PubMed] [Green Version]
  24. Friedman, R.C.; Farh, K.K.-H.; Burge, C.B.; Bartel, D.P. Most mammalian mRNAs are conserved targets of microRNAs. Genome Res. 2009, 19, 92–105. [Google Scholar] [CrossRef] [PubMed] [Green Version]
  25. Esslinger, S.M.; Schwalb, B.; Helfer, S.; Michalik, K.M.; Witte, H.; Maier, K.C.; Martin, D.; Michalke, B.; Tresch, A.; Cramer, P.; et al. Drosophila miR-277 controls branched-chain amino acid catabolism and affects lifespan. RNA Biol. 2013, 10, 1042–1056. [Google Scholar] [CrossRef]
  26. Ling, L.; Kokoza, V.A.; Zhang, C.; Aksoy, E.; Raikhel, A.S. MicroRNA-277 targets insulin-like peptides 7 and 8 to control lipid metabolism and reproduction in Aedes aegypti mosquitoes. Proc. Natl. Acad. Sci. USA 2017, 114, E8017–E8024. [Google Scholar] [CrossRef] [Green Version]
  27. Schertel, C.; Rutishauser, T.; Förstemann, K.; Basler, K. Functional Characterization of Drosophila microRNAs by a Novel in Vivo Library. Genetics 2012, 192, 1543–1552. [Google Scholar] [CrossRef] [Green Version]
  28. Brennecke, J.; Hipfner, D.R.; Stark, A.; Russell, R.B.; Cohen, S.M. Bantam Encodes a Developmentally Regulated microRNA that Controls Cell Proliferation and Regulates the Proapoptotic Gene hid in Drosophila. Cell 2003, 113, 25–36. [Google Scholar] [CrossRef] [Green Version]
  29. Ohlstein, B.; Spradling, A. Multipotent Drosophila Intestinal Stem Cells Specify Daughter Cell Fates by Differential Notch Signaling. Science 2007, 315, 988–992. [Google Scholar] [CrossRef] [Green Version]
  30. Antonello, Z.A.; Reiff, T.; Dominguez, M. Mesenchymal to epithelial transition during tissue homeostasis and regeneration: Patching up the Drosophila midgut epithelium. Fly 2015, 9, 132–137. [Google Scholar] [CrossRef]
  31. Ebert, M.S.; Neilson, J.R.; Sharp, P.A. MicroRNA sponges: Competitive inhibitors of small RNAs in mammalian cells. Nat. Methods 2007, 4, 721–726. [Google Scholar] [CrossRef] [PubMed]
  32. Horwich, M.D.; Zamore, P.D. Design and delivery of antisense oligonucleotides to block microRNA function in cultured Drosophila and human cells. Nat. Protoc. 2008, 3, 1537–1549. [Google Scholar] [CrossRef] [PubMed]
  33. Leader, D.P.; A Krause, S.; Pandit, A.; A Davies, S.; Dow, J.A.T. FlyAtlas 2: A new version of the Drosophila melanogaster expression atlas with RNA-Seq, miRNA-Seq and sex-specific data. Nucleic Acids Res. 2017, 46, D809–D815. [Google Scholar] [CrossRef] [PubMed]
  34. Street, K.; Risso, D.; Fletcher, R.B.; Das, D.; Ngai, J.; Yosef, N.; Purdom, E.; Dudoit, S. Slingshot: Cell lineage and pseudotime inference for single-cell transcriptomics. BMC Genom. 2018, 19, 477. [Google Scholar] [CrossRef] [PubMed] [Green Version]
  35. Guo, X.; Yin, C.; Yang, F.; Zhang, Y.; Huang, H.; Wang, J.; Deng, B.; Cai, T.; Rao, Y.; Xi, R. The Cellular Diversity and Transcription Factor Code of Drosophila Enteroendocrine Cells. Cell Rep. 2019, 29, 4172–4185.e5. [Google Scholar] [CrossRef] [Green Version]
  36. Korzelius, J.; Azami, S.; Ronnen-Oron, T.; Koch, P.; Baldauf, M.; Meier, E.; A Rodriguez-Fernandez, I.; Groth, M.; Sousa-Victor, P.; Jasper, H. The WT1-like transcription factor Klumpfuss maintains lineage commitment of enterocyte progenitors in the Drosophila intestine. Nat. Commun. 2019, 10, 4123. [Google Scholar] [CrossRef] [Green Version]
  37. Korzelius, J.; Naumann, S.K.; A Loza-Coll, M.; Chan, J.S.; Dutta, D.; Oberheim, J.; Gläßer, C.; Southall, T.D.; Brand, A.; Jones, D.L.; et al. Escargot maintains stemness and suppresses differentiation in Drosophila intestinal stem cells. EMBO J. 2014, 33, 2967–2982. [Google Scholar] [CrossRef]
  38. A Loza-Coll, M.; Southall, T.D.; Sandall, S.L.; Brand, A.; Jones, D.L. Regulation of Drosophila intestinal stem cell maintenance and differentiation by the transcription factor Escargot. EMBO J. 2014, 33, 2983–2996. [Google Scholar] [CrossRef] [Green Version]
  39. Li, Y.; Pang, Z.; Huang, H.; Wang, C.; Cai, T.; Xi, R. Transcription Factor Antagonism Controls Enteroendocrine Cell Specification from Intestinal Stem Cells. Sci. Rep. 2017, 7, 988. [Google Scholar] [CrossRef] [Green Version]
  40. Tang, X.; Zhao, Y.; Buchon, N.; Engström, Y. The POU/Oct Transcription Factor Nubbin Controls the Balance of Intestinal Stem Cell Maintenance and Differentiation by Isoform-Specific Regulation. Stem Cell Rep. 2018, 10, 1565–1578. [Google Scholar] [CrossRef]
  41. Tsuji, T.; Hasegawa, E.; Isshiki, T. Neuroblast entry into quiescence is regulated intrinsically by the combined action of spatial Hox proteins and temporal identity factors. Development 2008, 135, 3859–3869. [Google Scholar] [CrossRef] [PubMed] [Green Version]
  42. Blanchet, E.; Annicotte, J.-S.; Lagarrigue, S.; Aguilar, V.; Clapé, C.; Chavey, C.; Fritz, V.; Casas, F.; Apparailly, F.; Auwerx, J.; et al. E2F transcription factor-1 regulates oxidative metabolism. Nat. Cell Biol. 2011, 13, 1146–1152. [Google Scholar] [CrossRef] [PubMed] [Green Version]
  43. Chen, C.-L.; Kumar, D.B.U.; Punj, V.; Xu, J.; Sher, L.; Tahara, S.M.; Hess, S.; Machida, K. NANOG Metabolically Reprograms Tumor-Initiating Stem-like Cells through Tumorigenic Changes in Oxidative Phosphorylation and Fatty Acid Metabolism. Cell Metab. 2015, 23, 206–219. [Google Scholar] [CrossRef] [PubMed] [Green Version]
  44. Xiang, J.; Bandura, J.; Zhang, P.; Jin, Y.; Reuter, H.; Edgar, B.A. EGFR-dependent TOR-independent endocycles support Drosophila gut epithelial regeneration. Nat. Commun. 2017, 8, 15125. [Google Scholar] [CrossRef] [PubMed] [Green Version]
  45. A Hay, B.; Wolff, T.; Rubin, G.M. Expression of baculovirus P35 prevents cell death in Drosophila. Development 1994, 120, 2121–2129. [Google Scholar] [CrossRef]
  46. Barker, N.; Ridgway, R.A.; Van Es, J.H.; Van De Wetering, M.; Begthel, H.; van den Born, M.; Danenberg, E.; Clarke, A.R.; Sansom, O.J.; Clevers, H. Crypt stem cells as the cells-of-origin of intestinal cancer. Nature 2009, 457, 608–611. [Google Scholar] [CrossRef]
  47. Sato, T.; Vries, R.G.; Snippert, H.J.; Van De Wetering, M.; Barker, N.; Stange, D.E.; Van Es, J.H.; Abo, A.; Kujala, P.; Peters, P.J.; et al. Single Lgr5 stem cells build crypt-villus structures in vitro without a mesenchymal niche. Nature 2009, 459, 262–265. [Google Scholar] [CrossRef]
  48. Barker, N.; Van Es, J.H.; Kuipers, J.; Kujala, P.; Van Den Born, M.; Cozijnsen, M.; Haegebarth, A.; Korving, J.; Begthel, H.; Peters, P.J.; et al. Identification of stem cells in small intestine and colon by marker gene Lgr5. Nature 2007, 449, 1003–1007. [Google Scholar] [CrossRef]
  49. Bangi, E.; Murgia, C.; Teague, A.G.; Sansom, O.J.; Cagan, R.L. Functional exploration of colorectal cancer genomes using Drosophila. Nat. Commun. 2016, 7, 13615. [Google Scholar] [CrossRef]
  50. Xing, Y.; Su, T.T.; Ruohola-Baker, H. Tie-mediated signal from apoptotic cells protects stem cells in Drosophila melanogaster. Nat. Commun. 2015, 6, 7058. [Google Scholar] [CrossRef] [Green Version]
  51. Patel, P.H.; Dutta, D.; Edgar, B.A. Niche Appropriation by Drosophila Intestinal Stem Cell Tumors. Nat. Cell Biol. 2015, 17, 1182–1192. [Google Scholar] [CrossRef] [PubMed]
  52. Bahuguna, S.; Redhai, S.; Zhou, J.; Wang, T.; Port, F.; Boutros, M. Conditional CRISPR-Cas Genome Editing in Drosophila to Generate Intestinal Tumors. Cells 2021, 10, 3156. [Google Scholar] [CrossRef] [PubMed]
  53. Port, F.; Strein, C.; Stricker, M.; Rauscher, B.; Heigwer, F.; Zhou, J.; Beyersdörffer, C.; Frei, J.; Hess, A.; Kern, K.; et al. A large-scale resource for tissue-specific CRISPR mutagenesis in Drosophila. eLife 2020, 9, e53865. [Google Scholar] [CrossRef] [PubMed]
  54. Koundouros, N.; Poulogiannis, G. Reprogramming of fatty acid metabolism in cancer. Br. J. Cancer 2019, 122, 4–22. [Google Scholar] [CrossRef] [PubMed] [Green Version]
  55. Singh, S.R.; Zeng, X.; Zhao, J.; Liu, Y.; Hou, G.; Liu, H.; Hou, S.X. The lipolysis pathway sustains normal and transformed stem cells in adult Drosophila. Nature 2016, 538, 109–113. [Google Scholar] [CrossRef] [PubMed]
  56. Tiwari, S.K.; Toshniwal, A.G.; Mandal, S.; Mandal, L. Fatty acid β-oxidation is required for the differentiation of larval hematopoietic progenitors in Drosophila. eLife 2020, 9, e53247. [Google Scholar] [CrossRef] [PubMed]
  57. Cai, L.; Sutter, B.M.; Li, B.; Tu, B.P. Acetyl-CoA Induces Cell Growth and Proliferation by Promoting the Acetylation of Histones at Growth Genes. Mol. Cell 2011, 42, 426–437. [Google Scholar] [CrossRef] [PubMed] [Green Version]
  58. Shi, L.; Tu, B.P. Acetyl-CoA and the Regulation of Metabolism: Mechanisms and Consequences. Curr. Opin. Cell Biol. 2015, 33, 125–131. [Google Scholar] [CrossRef] [Green Version]
  59. Jiang, H.; Grenley, M.O.; Bravo, M.-J.; Blumhagen, R.Z.; Edgar, B.A. EGFR/Ras/MAPK Signaling Mediates Adult Midgut Epithelial Homeostasis and Regeneration in Drosophila. Cell Stem. Cell 2011, 8, 84–95. [Google Scholar] [CrossRef] [Green Version]
  60. Demarco, R.S.; Uyemura, B.S.; D’Alterio, C.; Jones, D.L. Mitochondrial fusion regulates lipid homeostasis and stem cell maintenance in the Drosophila testis. Nat. Cell Biol. 2019, 21, 710–720. [Google Scholar] [CrossRef]
  61. Torroja, L.; Ortuño-Sahagún, D.; Ferrús, A.; Hämmerle, B.; Barbas, J.A. scully, an Essential Gene of Drosophila, is Homologous to Mammalian Mitochondrial Type II l-3-hydroxyacyl-CoA Dehydrogenase/Amyloid-β Peptide-binding Protein. J. Cell Biol. 1998, 141, 1009–1017. [Google Scholar] [CrossRef] [PubMed] [Green Version]
  62. A Endow, S.; E Miller, S.; Ly, P.T. Mitochondria-enriched protrusions are associated with brain and intestinal stem cells in Drosophila. Commun. Biol. 2019, 2, 427. [Google Scholar] [CrossRef] [PubMed] [Green Version]
  63. Liang, J.; Balachandra, S.; Ngo, S.; O’Brien, L.E. Feedback regulation of steady-state epithelial turnover and organ size. Nature 2017, 548, 588–591. [Google Scholar] [CrossRef] [PubMed] [Green Version]
  64. Mihaylova, M.M.; Cheng, C.-W.; Cao, A.; Tripathi, S.; Mana, M.D.; Bauer-Rowe, K.E.; Abu-Remaileh, M.; Clavain, L.; Erdemir, A.; Lewis, C.A.; et al. Fasting Activates Fatty Acid Oxidation to Enhance Intestinal Stem Cell Function during Homeostasis and Aging. Cell Stem. Cell 2018, 22, 769–778.e4. [Google Scholar] [CrossRef] [PubMed] [Green Version]
  65. Boren, J.; Brindle, K.M. Apoptosis-induced mitochondrial dysfunction causes cytoplasmic lipid droplet formation. Cell Death Differ. 2012, 19, 1561–1570. [Google Scholar] [CrossRef] [PubMed] [Green Version]
  66. Escudero, S. Direct Regulation of Mitochondrial Fatty Acid Oxidation by Anti-Apoptotic MCL-1. Ph.D. Thesis, Harvard University, Cambridge, MA, USA, 2017. [Google Scholar]
  67. Iuchi, K.; Ema, M.; Suzuki, M.; Yokoyama, C.; Hisatomi, H. Oxidized unsaturated fatty acids induce apoptotic cell death in cultured cells. Mol. Med. Rep. 2019, 19, 2767–2773. [Google Scholar] [CrossRef] [PubMed] [Green Version]
  68. Strub, B.R.; Parkes, T.L.; Mukai, S.T.; Bahadorani, S.; Coulthard, A.B.; Hall, N.; Phillips, J.P.; Hilliker, A.J. Mutations of the withered (whd) gene in Drosophila melanogaster confer hypersensitivity to oxidative stress and are lesions of the carnitine palmitoyltransferase I (CPT I) gene. Genome 2008, 51, 409–420. [Google Scholar] [CrossRef]
  69. Cao, W.; Liu, N.; Tang, S.; Bao, L.; Shen, L.; Yuan, H.; Zhao, X.; Lu, H. Acetyl-Coenzyme A acyltransferase 2 attenuates the apoptotic effects of BNIP3 in two human cell lines. Biochim. Biophys. Acta Gen. Subj. 2008, 1780, 873–880. [Google Scholar] [CrossRef]
  70. Montgomery, R.K.; Carlone, D.L.; Richmond, C.A.; Farilla, L.; Kranendonk, M.E.G.; Henderson, D.E.; Baffour-Awuah, N.Y.; Ambruzs, D.M.; Fogli, L.K.; Algra, S.; et al. Mouse telomerase reverse transcriptase (mTert) expression marks slowly cycling intestinal stem cells. Proc. Natl. Acad. Sci. USA 2010, 108, 179–184. [Google Scholar] [CrossRef] [Green Version]
  71. Sangiorgi, E.; Capecchi, M.R. Bmi1 is expressed in vivo in intestinal stem cells. Nat. Genet. 2008, 40, 915–920. [Google Scholar] [CrossRef] [Green Version]
  72. Yan, K.S.; Chia, L.A.; Li, X.; Ootani, A.; Su, J.; Lee, J.Y.; Su, N.; Luo, Y.; Heilshorn, S.C.; Amieva, M.R.; et al. The intestinal stem cell markers Bmi1 and Lgr5 identify two functionally distinct populations. Proc. Natl. Acad. Sci. USA 2011, 109, 466–471. [Google Scholar] [CrossRef] [PubMed] [Green Version]
  73. Powell, A.E.; Wang, Y.; Li, Y.; Poulin, E.J.; Means, A.L.; Washington, M.K.; Higginbotham, J.N.; Juchheim, A.; Prasad, N.; Levy, S.E.; et al. The Pan-ErbB Negative Regulator Lrig1 Is an Intestinal Stem Cell Marker that Functions as a Tumor Suppressor. Cell 2012, 149, 146–158. [Google Scholar] [CrossRef] [PubMed] [Green Version]
  74. Barker, N.; van Oudenaarden, A.; Clevers, H. Identifying the Stem Cell of the Intestinal Crypt: Strategies and Pitfalls. Cell Stem. Cell 2012, 11, 452–460. [Google Scholar] [CrossRef] [PubMed] [Green Version]
  75. You, B.; Chen, E.X. Anti-EGFR Monoclonal Antibodies for Treatment of Colorectal Cancers: Development of Cetuximab and Panitumumab. J. Clin. Pharmacol. 2012, 52, 128–155. [Google Scholar] [CrossRef] [PubMed]
  76. Basak, O.; Beumer, J.; Wiebrands, K.; Seno, H.; van Oudenaarden, A.; Clevers, H. Induced Quiescence of Lgr5+ Stem Cells in Intestinal Organoids Enables Differentiation of Hormone-Producing Enteroendocrine Cells. Cell Stem. Cell 2017, 20, 177–190.e4. [Google Scholar] [CrossRef] [PubMed] [Green Version]
  77. Samudio, I.; Harmancey, R.; Fiegl, M.; Kantarjian, H.; Konopleva, M.; Korchin, B.; Kaluarachchi, K.; Bornmann, W.; Duvvuri, S.; Taegtmeyer, H.; et al. Pharmacologic inhibition of fatty acid oxidation sensitizes human leukemia cells to apoptosis induction. J. Clin. Investig. 2010, 120, 142–156. [Google Scholar] [CrossRef] [Green Version]
  78. Knobloch, M.; Braun, S.; Zurkirchen, L.; Von Schoultz, C.; Zamboni, N.; Araúzo-Bravo, M.J.; Kovacs, W.; Karalay, Ö.; Suter, U.; Machado, R.A.M.; et al. Metabolic control of adult neural stem cell activity by Fasn-dependent lipogenesis. Nature 2012, 493, 226–230. [Google Scholar] [CrossRef] [Green Version]
  79. Ito, K.; Carracedo, A.; Weiss, D.; Arai, F.; Ala, U.; Avigan, D.E.; Schafer, Z.T.; Evans, R.M.; Suda, T.; Lee, C.-H.; et al. A PML–PPAR-δ pathway for fatty acid oxidation regulates hematopoietic stem cell maintenance. Nat. Med. 2012, 18, 1350–1358. [Google Scholar] [CrossRef] [Green Version]
  80. Stark, A.; Brennecke, J.; Russell, R.B.; Cohen, S.M. Identification of Drosophila MicroRNA Targets. PLOS Biol. 2003, 1, e60. [Google Scholar] [CrossRef]
  81. Housden, B.; Millen, K.; Bray, S.J. Drosophila Reporter Vectors Compatible with ΦC31 Integrase Transgenesis Techniques and Their Use to Generate New Notch Reporter Fly Lines. G3 Genes|Genomes|Genetics 2012, 2, 79–82. [Google Scholar] [CrossRef] [Green Version]
  82. Port, F.; Bullock, S.L. Augmenting CRISPR applications in Drosophila with tRNA-flanked sgRNAs. Nat. Methods 2016, 13, 852–854. [Google Scholar] [CrossRef] [PubMed] [Green Version]
  83. Gratz, S.J.; Ukken, F.P.; Rubinstein, C.D.; Thiede, G.; Donohue, L.K.; Cummings, A.M.; O’Connor-Giles, K.M. Highly Specific and Efficient CRISPR/Cas9-Catalyzed Homology-Directed Repair in Drosophila. Genetics 2014, 196, 961–971. [Google Scholar] [CrossRef] [PubMed] [Green Version]
  84. Izumi, Y.; Motoishi, M.; Furuse, K.; Furuse, M. A tetraspanin regulates septate junction formation in Drosophila midgut. J. Cell Sci. 2016, 129, 1155–1164. [Google Scholar] [CrossRef] [PubMed] [Green Version]
  85. Li, W.V.; Li, J.J. An accurate and robust imputation method scImpute for single-cell RNA-seq data. Nat. Commun. 2018, 9, 997. [Google Scholar] [CrossRef] [Green Version]
  86. Van Der Maaten, L.; Hinton, G. Visualizing data using t-SNE. J. Mach. Learn. Res. 2008, 9, 2579–2625. [Google Scholar]
  87. Bullard, J.H.; Purdom, E.; Hansen, K.D.; Dudoit, S. Evaluation of statistical methods for normalization and differential expression in mRNA-Seq experiments. BMC Bioinform. 2010, 11, 94. [Google Scholar] [CrossRef] [Green Version]
  88. Robinson, M.D.; McCarthy, D.J.; Smyth, G.K. EdgeR: A Bioconductor package for differential expression analysis of digital gene expression data. Bioinformatics 2010, 26, 139–140. [Google Scholar] [CrossRef] [Green Version]
  89. Anders, S.; Huber, W. Differential expression analysis for sequence count data. Genome Biol. 2010, 11, R106. [Google Scholar] [CrossRef] [Green Version]
  90. Love, M.I.; Huber, W.; Anders, S. Moderated estimation of fold change and dispersion for RNA-seq data with DESeq2. Genome Biol. 2014, 15, 550. [Google Scholar] [CrossRef] [Green Version]
  91. LLun, A.T.; Bach, K.; Marioni, J.C. Pooling across cells to normalize single-cell RNA sequencing data with many zero counts. Genome Biol. 2016, 17, 75. [Google Scholar] [CrossRef]
  92. Xiao, Z.; Dai, Z.; Locasale, J.W. Metabolic landscape of the tumor microenvironment at single cell resolution. Nat. Commun. 2019, 10, 3763. [Google Scholar] [CrossRef] [PubMed]
Figure 1. Workflow of the identification process for Gene Ontology Networks from microRNA target gene prediction and subsequent Gene Ontology mapping and proof of actual target gene regulation by miR-277. (a) Putative target gene lists for different miRNAs were obtained and analyzed from four microRNA prediction algorithms. Target genes that showed up in at least three out of four prediction algorithms were subjected to FatiGO prediction for Gene Ontology networks on Babelomics 4.0 servers (Barcelona, Spain) and resulting GO-terms (Gene Ontology) with a p-value p < 0.05 were considered. (b) Summary of predicted miR-277 target genes involved in fatty acid metabolism: shown is the involvement of miR-277 regulated genes in KEGG nomenclature with red lettering and green background. The table (top-right) lists all targeted genes from the KEGG pathway prediction for fatty acid metabolism, the according Drosophila melanogaster genes, and functions. KEGG involvement image modified, copyright by Kanehisa Laboratories. (c) PCR reaction using specific primer sets for the pre-miR-277 reveal miR-277 on adult Drosophila midgut cDNA; (d) relative mRNA levels of predicted miR-277 target genes involved in fatty acid metabolism were decreased in whole guts upon forced expression of UAS-miR-277 in EC using a Mexts-Gal4 driver (n = 3; unpaired t-test: ** p < 0.01, *** p < 0.001, **** p < 0.0001).
Metabolites 12 00315 g001
Figure 2. miR-277-expression in ISC, EB and EC revealed by miR-277::GFP sensor flies in the R5 region of the posterior midgut. (a) miR-277-expression in R5 regions of adult posterior midguts was analyzed using a transgenic sensor for miR-277. The sensor is expressed ubiquitously by ubi-promoter sequences and consists of miR-277 consensus sequences fused to the coding sequence of GFP. Thus, raised miR-277 levels directly reduce GFP signals. (bb’’’) Flies carrying the miR-277 sensor were crossed with flies carrying the Notch-activity reporter Gbe+Su(H)dsRed labelling EB. After seven days at 25 °C, images were taken with fixed 488 nm laser settings to enable comparison of GFP-intensity (b’’). Ubi-miR-277::GFP flies reveal a significant decrease in GFP-signal in EB and epithelial EC (identified by big nuclear size and aSsk staining of septate junctions) compared to GFP signal detected in ISC. (c,d) Quantification of GFP-fluorescence intensity of ISC, EB and EC corrected to control ubi-GFP flies ((c); see materials and methods; n = 20, 19, 20; ANOVA, **** p < 0.001) and numerical inversion for comprehensibility (d). (Scale bar is 10 µm).
Metabolites 12 00315 g002
Figure 3. Metabolic transcriptome analysis of single-cell sequencing data from the cell atlas of the Drosophila midgut. (a) Cell lineages based on metabolic genes expression were inferred using Slingshot. Four lineages were constructed starting from ISC/EB and ending in each differentiated cell type (anterior EC (aEC), middle EC (mEC), posterior EC (pEC), and EE). (b) Plot of gene expression as a function of pseudotime for each lineage. Target genes of miR-277 are shown together with the known markers of ISC and EB (esg, Dl, klu and pros). (cc’’) Comparison of whole transcriptomic (c) and only metabolic genes (c’c’’) cell clustering with correspondent activity score. (c’,c’’) Metabolic cell clusters separated by cell type (c’) and single cell lineage clustering (c’’) as previously described.
Metabolites 12 00315 g003
Figure 4. Analysis of midgut progenitor cell markers and miR-277 target genes from ß-oxidation in metabolic cell clusters of ISC/EB. (a) Two distinct ISC/EB clusters in the metabolic cell clusters were identified being positive for esg expression. The ISC marker Dl is expressed in cells of both clusters that are negative for expression of the EB marker klu. (b) Analysis of miR-277 target genes from FAO in metabolic cell clusters of ISC/EB (c) ISC/EB clusters can be subdivided into two distinct metabolic clusters, ISC (grey circle) and EB (orange circle) analyzing expression of Dl and klu marker genes.
Metabolites 12 00315 g004
Figure 5. Subclustering of ISC/EB using combined expression of esg, Dl, klu, and pros identify quiescent and proliferating ISC within the ISC cluster. (a) The analysis of Dl and klu expression levels in the escargot positive intestinal progenitor lineage identifies 3 populations within the esg+ ISC/EB cell cluster: klu+, Dl (red), Dl+, klu (green), and Dl, klu (grey). Double positive cells are not identified confirming the mutual exclusivity of these markers. (b) Dot plot representation of additional lineage markers and cell cycle genes shows high expression of quiescence marker nub in esg+, Dl, klu, and pros quiescent ISC (qISC), whereas expression of cell cycle genes CycE, CycD, and stg is high in esg+, Dl+, klu, and pros proliferating ISC (pISC) and expression of EB markers like Eip75B is highest in esg+, Dl, klu+, and pros EB cell cluster. (c) Dot plot representation of miR-277 target genes identify the differentially expressed FAO genes Mtpalpha, yip2, and CG5599 as quiescent ISC (Dl) markers. CG3902, CG4860, CG9547, and whd are higher expressed in proliferating ISC (esg+, Dl+, klu, and pros). CG31075 is the only miR-277 target gene showing higher expression in EB (esg+, Dl, klu+, and pros). (d) CG9547 protein expression levels significantly decline in the ISC lineage (n = 6, 8, 9; ANOVA: ** p < 0.01, **** p < 0.0001). (e,f) cartoons depicting esg+ intestinal progenitor lineage clusters can be further subdivided in qISC (grey circle), pISC (green circle) and EB (orange circle) upon expression of Dl, klu, and pros.
Metabolites 12 00315 g005
Figure 6. esgReDDM tracing of stem cell production and manipulation of miR-277 in ISC and EB. (a) The expression of two different fluorophores (CD8::GFP and H2B::RFP) is driven by the ISC and EB specific driver esg-Gal4. EB differentiating to epithelial EC loose esg-Gal4 driven CD8::GFP, while stable H2B::RFP persists. Also, the enteroendocrine precursors (EEP) and their progeny (EE) loose the esg-Gal4 driven CD8::GFP, but retain the H2B::RFP. The expression of UAS-driven transgenes is temporally controlled by a ubiquitously expressed temperature-sensitive Gal80ts repressor, which is inactivated by a temperature shift to 29 °C. (b,c) show tracing in control (esgReDDM>/w1118) adult Drosophila mated females. EB integrate in the epithelium as EC or EE (GFP/RFP+) revealing midgut turnover rate under physiological conditions after 7 days (b) and 21 days at 29 °C (c). (d) Quantification of epithelial renewal in adult PMG traced for 7–21 days (ad, modified from Antonello et al., 2015). (e) Schematic of loss-of-function by microRNA sponges achieved by the expression of multiple consensus sequences for the according microRNA. (f) esgReDDM driven overexpression of miR-277 resulting in cell death of presumably small GFP+/RFP+-ISC (inset arrowheads). (g) Depletion of miR-277 with a UAS-driven sponge titrating intracellular miR-277 levels. (h,i) Quantification of ISC/EB-numbers (h) and EC renewal (i) in miR-277 overexpression and knockdown after 7 days in R5a/b (n = 13, 5, 8; ANOVA: ** p < 0.01, *** p < 0.001, **** p < 0.0001). (scale bar is 50 µm in (b,c,f,g)).
Metabolites 12 00315 g006
Figure 7. esgReDDM tracing with manipulation of miR-277 and miR-277 target genes from FAO in ISC/EB. (a) Confocal image of control PMG (R5a/b) after 7 days showing normal ISC and EB-numbers and sizes. (b) Forced expression of miR-277 with block of apoptosis by P35. Arrowheads point to small ISC, whereas arrows indicate particularly and unusually big ISC. (c) Knockdown of miR-277 using miR-277-sponges increases the number of ISC/EB with enlarged size (c,h). (dg) knockdown of miR-277 target genes from FAO results in a higher number of small ISC ((dh), arrowheads). (h) Quantification of ISC/EB-sizes in manipulations of miR-277 and knockdown of miR-277 target genes after 7 days in R5a/b (n = 200, 199, 150, 150, 199, 150, 150; ANOVA: ** p < 0.01, **** p < 0.0001). (scale bar is 20 µm).
Metabolites 12 00315 g007
Figure 8. esgReDDM tracing and manipulation of miR-277 in the benign Notch tumor model. (a) N LOF in ISC/EB prevents EB specification through N signaling and EC production, thus resulting in a stochastic rate of symmetric ISC divisions (ISC tumor formation) and the production of EE (EE tumor formation). We added ISC apoptosis caused by overexpression of miR-277 as a possible outcome for ISC division (apoptotic ISC, aCasp3 positive, Figure S6c–c’). (b) esgReDDM tracing combined with N-RNAi driven in ISC and EB results in the formation of ISC tumors (GFP+/RFP+) and EE tumors (GFP/RFP+/aPros+) and a reduced number of renewed EC (GFP/RFP+/aDlg-1+) in midguts of mated female flies after 7 d at 29 °C. (c) Simultaneous overexpression of miR-277 in the Notch tumor model is not affecting ISC nor EE tumor formation, but shows a significant increase in apoptotic ISC indicated by membrane blebbing (c,f, arrowhead), an increased production of newly differentiated EC (c,g, GFP/RFP+/aDlg-1+, arrow), and significantly reduced ISC size (h). (dg) Knockdown of miR-277 in the Notch tumor model has no effect on tumor formation (e), number of apoptotic ISC (f), nor the number of renewed EC (g). (eg) Quantification of number of ISC tumors (e), number of apoptotic ISC (f), and number of new EC (g) of miR-277 manipulations in the Notch tumor model after 7 days in R5a/b normalized to an area of 100,000 µm2. (h) Quantification of ISC sizes (n = 8, 6, 7/8, 8, 7/8, 8, 7/75, 150, 121; ANOVA: * p < 0.05). (scale bar is 50 µm).
Metabolites 12 00315 g008
Figure 9. esgReDDM tracing and overexpression of miR-277 in a newly established colorectal cancer (CRC) model based on CRISPR-Cas9 excision. (a) A newly established Drosophila model for CRC combines the esgReDDM tracing system with expression of Cas9 and single guideRNAs (sgRNAs) targeting the Drosophila orthologs of the most frequently mutated tumor suppressors in CRC patients. Early adenoma-like lesions and hyperactive Wnt/wg signaling are induced by knockout of the Apc orthologs apc1 and apc2. Additional expression of an oncogenic rasG12V leads to an activation of EGFR signaling, knockout of p53, and knockouts of the TGF-ß ortholog Medea and Pten mimic sporadic CRC patient-like carcinoma. In this model, the hallmarks of colorectal cancer, namely, (i) an increased SC proliferation, (ii) decreased differentiation to epithelial cells, (iii) a decreased apoptosis rate, and (iv) cell migration through the basal membrane, can be modeled and analyzed. Here, we used this model to investigate miR-277 overexpression in CRC-like modified ISC. (b) esgReDDM tracing combined with the RNAi-based Drosophila CRC model established by Bangi et al. 2016 results in the formation of ISC/EB cell clusters (GFP+/RFP+) and an increased EB growth in midguts of mated female flies after 7 d at 29 °C. (c) esgReDDMCas9 tracing combined with our new CRISPR-Cas9-induced CRC model reflects all CRC characteristics previously observed by Bangi and colleagues [49]. In detail, Cas9 excision of sporadic CRC associated genes leads to the formation of ISC/EB cell clusters, increased EB growth and PCD of ISC/EB indicated by membrane blebbing (arrowheads) in midguts of mated female flies after 3 d at 29 °C. As a consequence, overall survival of CRC flies is strongly reduced to about one week. (d,e) Simultaneous overexpression of miR-277 (d) or RNAi mediated knockdown of CG9547 (e) in the CRISPR-Cas9-induced CRC model reduces the number of ISC/EB compared to control tumors and reduces EB differentiation. (fh) Quantification of ISC/EB numbers (f), number of apoptotic ISC/EB (g), and number of newly differentiated EC (h) of the newly established CRISPR-Cas9 induced CRC model and simultaneous overexpression of miR-277 after 3 days in an area of 40,000 µm2 in R5a/b (n = 7,6,6/7,6,6/7,6,6; ANOVA: * p < 0.05, *** p < 0.001, **** p < 0.0001). (scale bar is 50 µm).
Metabolites 12 00315 g009
Table 1. List of primers used in real-time qPCR to investigate expression levels of predicted target genes of miR-277.
PrimerForward (5′-3′)Reverse (5′-3′)
Rp49TGGTTTCCGGCAAGCTTCAATGTTGTCGATACCCTTGGGC
miR-277GCGTGTCAGGAGTGCATTTGGATTGTACGTTCTGGAATGTCGT
CG31075TCCGAGGGAGATAAGGCTGAGAATGCCTTGTCCCGATCCA
CG3902CTTCTCCCTGAAGACCGTCGGGATGGCTACCGTGGCATTA
CG4860CGACCGGGAGGAGCTTTATCTCCAATCCGGAACCACCATAC
CG5599TCGATGACGGAATCCCTGAAAATCTCCTTGGCCACTAACTGC
CG9547CAAGCTGATTGGTGCCTTTGGGCGCACTAGTAATCCACGTCT
MtpAlphaCCAGTCCTTCGTCATGGACACACGGATCACATCGAGAATCTTCA
whdAACTTCTACGGCACGGATGCTGCCCTGAACCATGATAGGC
Yip2CATGAGTTGCAGCGCAAGAAGGCTGTAGGATTAGACAGCCTCG
Table 2. List of genes and the specific sequence targeted in the CRC model with number of off-targets predicted by the CRISPR Optimal Target Finder [83].
Targeted GeneTarget SequenceNumber of Off-Targets
apc1GGGCATCGCCGAGCTCAGTC3
apc2GGAGAGACGATCCGCTCAGA5
cicGGCTTGCCCGGGGAGCTTAG4
p53GGCTATTACGTGCCCCAATA5
MedGGTGAAGGACGAATACTCAG1
PtenGACGGTTTCTGAATAGGCCC4
Table 3. List of Primers used to amplify gRNA constructs for the CRC model (Colors recapitulate Figure S9).
PrimerSequence (5’-3’)
BbsI_apc1_forATAAGAAGACCTTGCAGGGCATCGCCGAGCTCAGTCGTTTCAGAGCTATGCTGGAAAC
SapI_apc2_forATAAGCTCTTCCTGCAGGAGAGACGATCCGCTCAGAGTTTCAGAGCTATGCTGGAAAC
BbsI_cic_forATAAGAAGACCTTGCAGGCTTGCCCGGGGAGCTTAGGTTTCAGAGCTATGCTGGAAAC
SapI_p53_forATAAGCTCTTCCTGCAGGCTATTACGTGCCCCAATAGTTTCAGAGCTATGCTGGAAAC
BbsI_Med_forATAAGAAGACCTTGCAGGTGAAGGACGAATACTCAGGTTTCAGAGCTATGCTGGAAAC
final_rev_Pten_BbsIATAAGAAGACCCAAACGACGGTTTCTGAATAGGCCCTGCACCAGCCGGGAATCGAACC
universal_rev_2xSapI_BbsIATAAGAAGACCCAAACTGAAGAGCTGAACGGCTCTTCTGCACCAGCCGGGAATCGAACC
universal_rev_2xBbsI_SapIATAAGCTCTTCAAACTGGTCTTCTGAAGGGAAGACTATGCACCAGCCGGGAATCGAACC
Publisher’s Note: MDPI stays neutral with regard to jurisdictional claims in published maps and institutional affiliations.

