Article

Altered Liver Metabolism, Mitochondrial Function, Oxidative Status, and Inflammatory Response in Intrauterine Growth Restriction Piglets with Different Growth Patterns before Weaning

1
Guangdong Province Key Laboratory of Animal Nutrition Control, College of Animal Science, South China Agricultural University, Guangzhou 510642, China
2
State Key Laboratory of Animal Nutrition, College of Animal Science and Technology, China Agricultural University, Beijing 100193, China
3
College of Animal Science and National Engineering Research Center for Breeding Swine Industry, South China Agricultural University, Guangzhou 510642, China
*
Authors to whom correspondence should be addressed.
Metabolites 2022, 12(11), 1053; https://doi.org/10.3390/metabo12111053
Submission received: 10 October 2022 / Revised: 30 October 2022 / Accepted: 31 October 2022 / Published: 1 November 2022
(This article belongs to the Special Issue Energy and Protein Metabolism in Sows and Piglets)

Abstract

:
Frequent occurrence of intrauterine growth restriction (IUGR) causes huge economic losses in the pig industry. Accelerated catch-up growth (CUG) in the early stage of life could restore multiple adverse outcomes of IUGR offspring; however, there is little knowledge about this beneficial phenomenon. We previously found that nutrient absorption related to intestinal function was globally promoted in CUG-IUGR piglets before weaning, which might be the dominant reason for CUG, but what this alteration could lead to in subsequent liver metabolism is still unknown. Firstly, a Normal, CUG, and non-catch-up growth (NCUG) piglet model before weaning was established by dividing eighty litters of newborn piglets into normal birth weight (NBW) and IUGR groups according to birth weight, and those piglets with IUGR but above-average weanling body weight were considered CUG, and the piglets with IUGR still below average body weight were considered NCUG at weaning day (d 26). Liver samples were collected and then systematically compared in glycolipid metabolism, mitochondrial function, antioxidant status, and inflammatory status among these three different growth models. Enhanced hepatic uptake of fatty acids, diminished de novo synthesis of fatty acids, and increased oxidation of fatty acids were observed in CUG livers compared to Normal and NCUG. In contrast, the NCUG liver showed enhanced glucose uptake and gluconeogenesis compared to Normal and CUG. We also observed deteriorating hepatic vacuolation in NCUG piglets, while increasing hepatic lipid deposition in CUG piglets. Besides, the expression of genes related to mitochondrial energy metabolism and biogenesis was reduced in CUG piglets and the phosphorylation level of AMPK was significantly higher compared to Normal (p < 0.05). Moreover, NCUG liver showed decreased T-AOC (p < 0.01) and GSH-PX (p < 0.05), increased MDA concentrations (p < 0.01), upregulated phosphorylation levels of ERK and NF-κB (p < 0.05), and elevated pro-inflammatory factors IL-1β, IL-6 and TNF-α (p < 0.05) compared to Normal. Furthermore, correlation analysis revealed a significant positive correlation between glucose metabolism and inflammatory factors, while a negative correlation between mitochondrial function-related genes and fatty acid transport. NGUG piglets showed simultaneous enhancement of glucose uptake and gluconeogenesis, as well as reduced antioxidant capacity and increased inflammatory status, whereas CUG comes at the expense of impaired hepatic mitochondrial function and pathological fat accumulation.

Graphical Abstract

1. Introduction

Intrauterine growth retardation (IUGR), defined as impaired growth and development of the mammalian embryo/fetus or its organs during pregnancy, is a major inducer of high pre-weaning morbidity and mortality in the pig industry [1]. IUGR is usually accompanied by impaired organ development and metabolic disorders which can result in long-term adverse impacts on their postnatal life [2]. It was observed that some IUGR offspring could undergo a period of accelerated growth and eventually reach a normal weight, which is called catch-up growth (CUG) [3,4]. Accumulating evidence shows that CUG eliminates multiple growth defects of IUGR, including growth retardation, and thus reduces the incidence of malnutrition, mortality, and morbidity [5]. Although the benefit of CUG may be of great significance in ameliorating the economic losses caused by the high occurrence of IUGR in the pig industry, there have only been very limited investigations paying attention to this subject.
During pregnancy, IUGR fetuses preferentially supply nutrients to vital organs such as the brain and heart to firstly ensure basic survival, which would directly damage other peripheral organs due to insufficient nutrient supply in utero [6,7]. As the largest metabolic organ, the liver plays an important role in macronutrient metabolism, immune regulation, and the maintenance of lipid and cholesterol homeostasis [8,9]. It has been widely reported that IUGR piglets are usually accompanied by liver dysfunction, which is characterized by morphological damage, metabolic disorders, and changes in abnormal blood lipid levels [10,11]. Investigations in humans, mice, and rats have shown that IUGR offspring might exhibit CUG when the postnatal nutritional environment is improved, while this change in nutritional status potentially caused a severe metabolic burden on the liver resulting in abnormal glucose metabolism, lipid deposition, and lipid degeneration [12,13], as well as mitochondrial dysfunction [14,15]. As a consequence, CUG-IUGR in adulthood has been shown to have a high incidence rate of diseases related to functional liver disorders, such as fatty liver [16], obesity, insulin resistance [10], poor glucose tolerance, and so on [16]. Our previous study revealed that nutrient absorption related to intestinal function was globally promoted in CUG-IUGR piglets before weaning which might be the dominant reason for CUG [17], but what this alteration could lead to in subsequent liver metabolism was still unknown.
Therefore, in the present study, we systematically compared the liver glycolipid metabolism, mitochondrial function, antioxidant capacity, and inflammatory status of CUG, NCUG, and Normal before weaning to study the effects of different growth patterns on liver metabolism and function in IUGR piglets. To our best knowledge, this is the first study to use weanling piglets as CUG models, and the results would better fill the understanding gap regarding the consequences and underlying mechanisms of pig early-stage CUG.

2. Materials and Methods

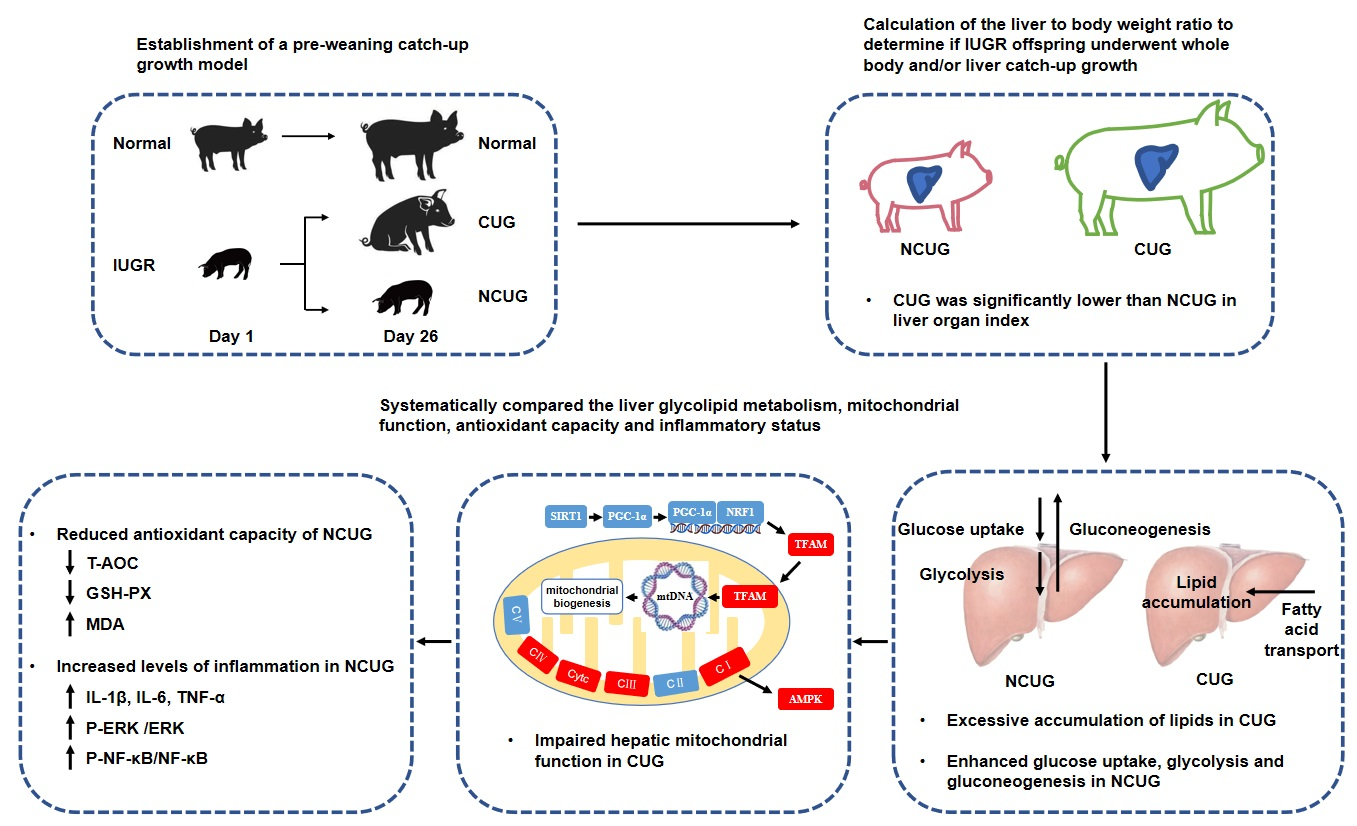
2.1. Animals, Experimental Diets, and Sample Collection

During gestation, 80 healthy pregnant sows (Landrace Yorkshire) were preselected according to similar parity (2–3), litter size, and expected farrowing date. The newborn piglets were weighed immediately after delivery. IUGR piglets were defined as having an average birth weight two standard deviations below the average birth weight of the total population, and normal birth weight piglets were defined as having a birth weight within 0.5 standard deviations of the average birth weight of the total population. Based on this criterion, 28 normal-weight piglets and 55 IUGR piglets were selected, and all the piglets were weighed and measured weekly. All piglets were fed milk and water freely. The sows were fed the same composition and nutrient content basal diet.
The composition of the basal diet (Table 1) was formulated in compliance with the National Research Council (1998) nutrient requirements. Sows were housed in individual stalls (2.0 m × 0.6 m) and fed twice (07:30 and 15:30) a day with a constant amount of 2.5 kg during gestation. Five days before farrowing, the sows were moved into individual farrowing crates (2 m × 1.5 m), with parturitions being observed frequently in all groups. The farrowing room was strictly controlled, with disturbances avoided as much as possible, and the inner temperature was kept approximately at 20 to 25 °C by an air conditioning system. All the farrowing crates were equipped with a feeder and a nipple drinker for sows; a nipple drinker and a heating lamp were provided for suckling piglets. Sows were not provided with feed on their farrowing day but were fed a lactation diet twice a day (07:30 and 17:00) from the next day until weaning. The initial amount of feed was 1.5 kg on the first day postpartum which increased daily by 0.5 kg until 7 d postpartum, then the sows were fed ad libitum until weaning. On weaning day (26 days), 6 IUGR piglets exceeding the weaning average individual weight were divided into the CUG group, and 6 IUGR not exceeding the weaning average individual weight were divided into the NCUG group (Figure 1). Meanwhile, 6 weaning piglets with normal birth weight were allotted to Normal group (Figure 1). Animals were euthanized by humane euthanasia with sodium pentobarbital. The weights of the heart, liver, spleen, lung, and kidney from piglets of each group were recorded. Liver specimens were collected from the same position in the left lobe of the liver and immersed in a 4% paraformaldehyde solution for preservation. In addition, liver tissue samples were collected, snap-frozen in liquid nitrogen, and stored in a −80 °C freezer.

2.2. Liver Biopsy Staining

Liver specimen samples were processed using standard paraffin-embedding techniques. After dehydration, liver samples were sectioned at 5 μm and stained with hematoxylin and eosin (H&E) (Thermo Fisher Scientific, Beijing, China) for histopathological evaluation. Stained sections were observed and photographed under a light microscope (Nikon YS100; Nikon Corporation, Tokyo, Japan).

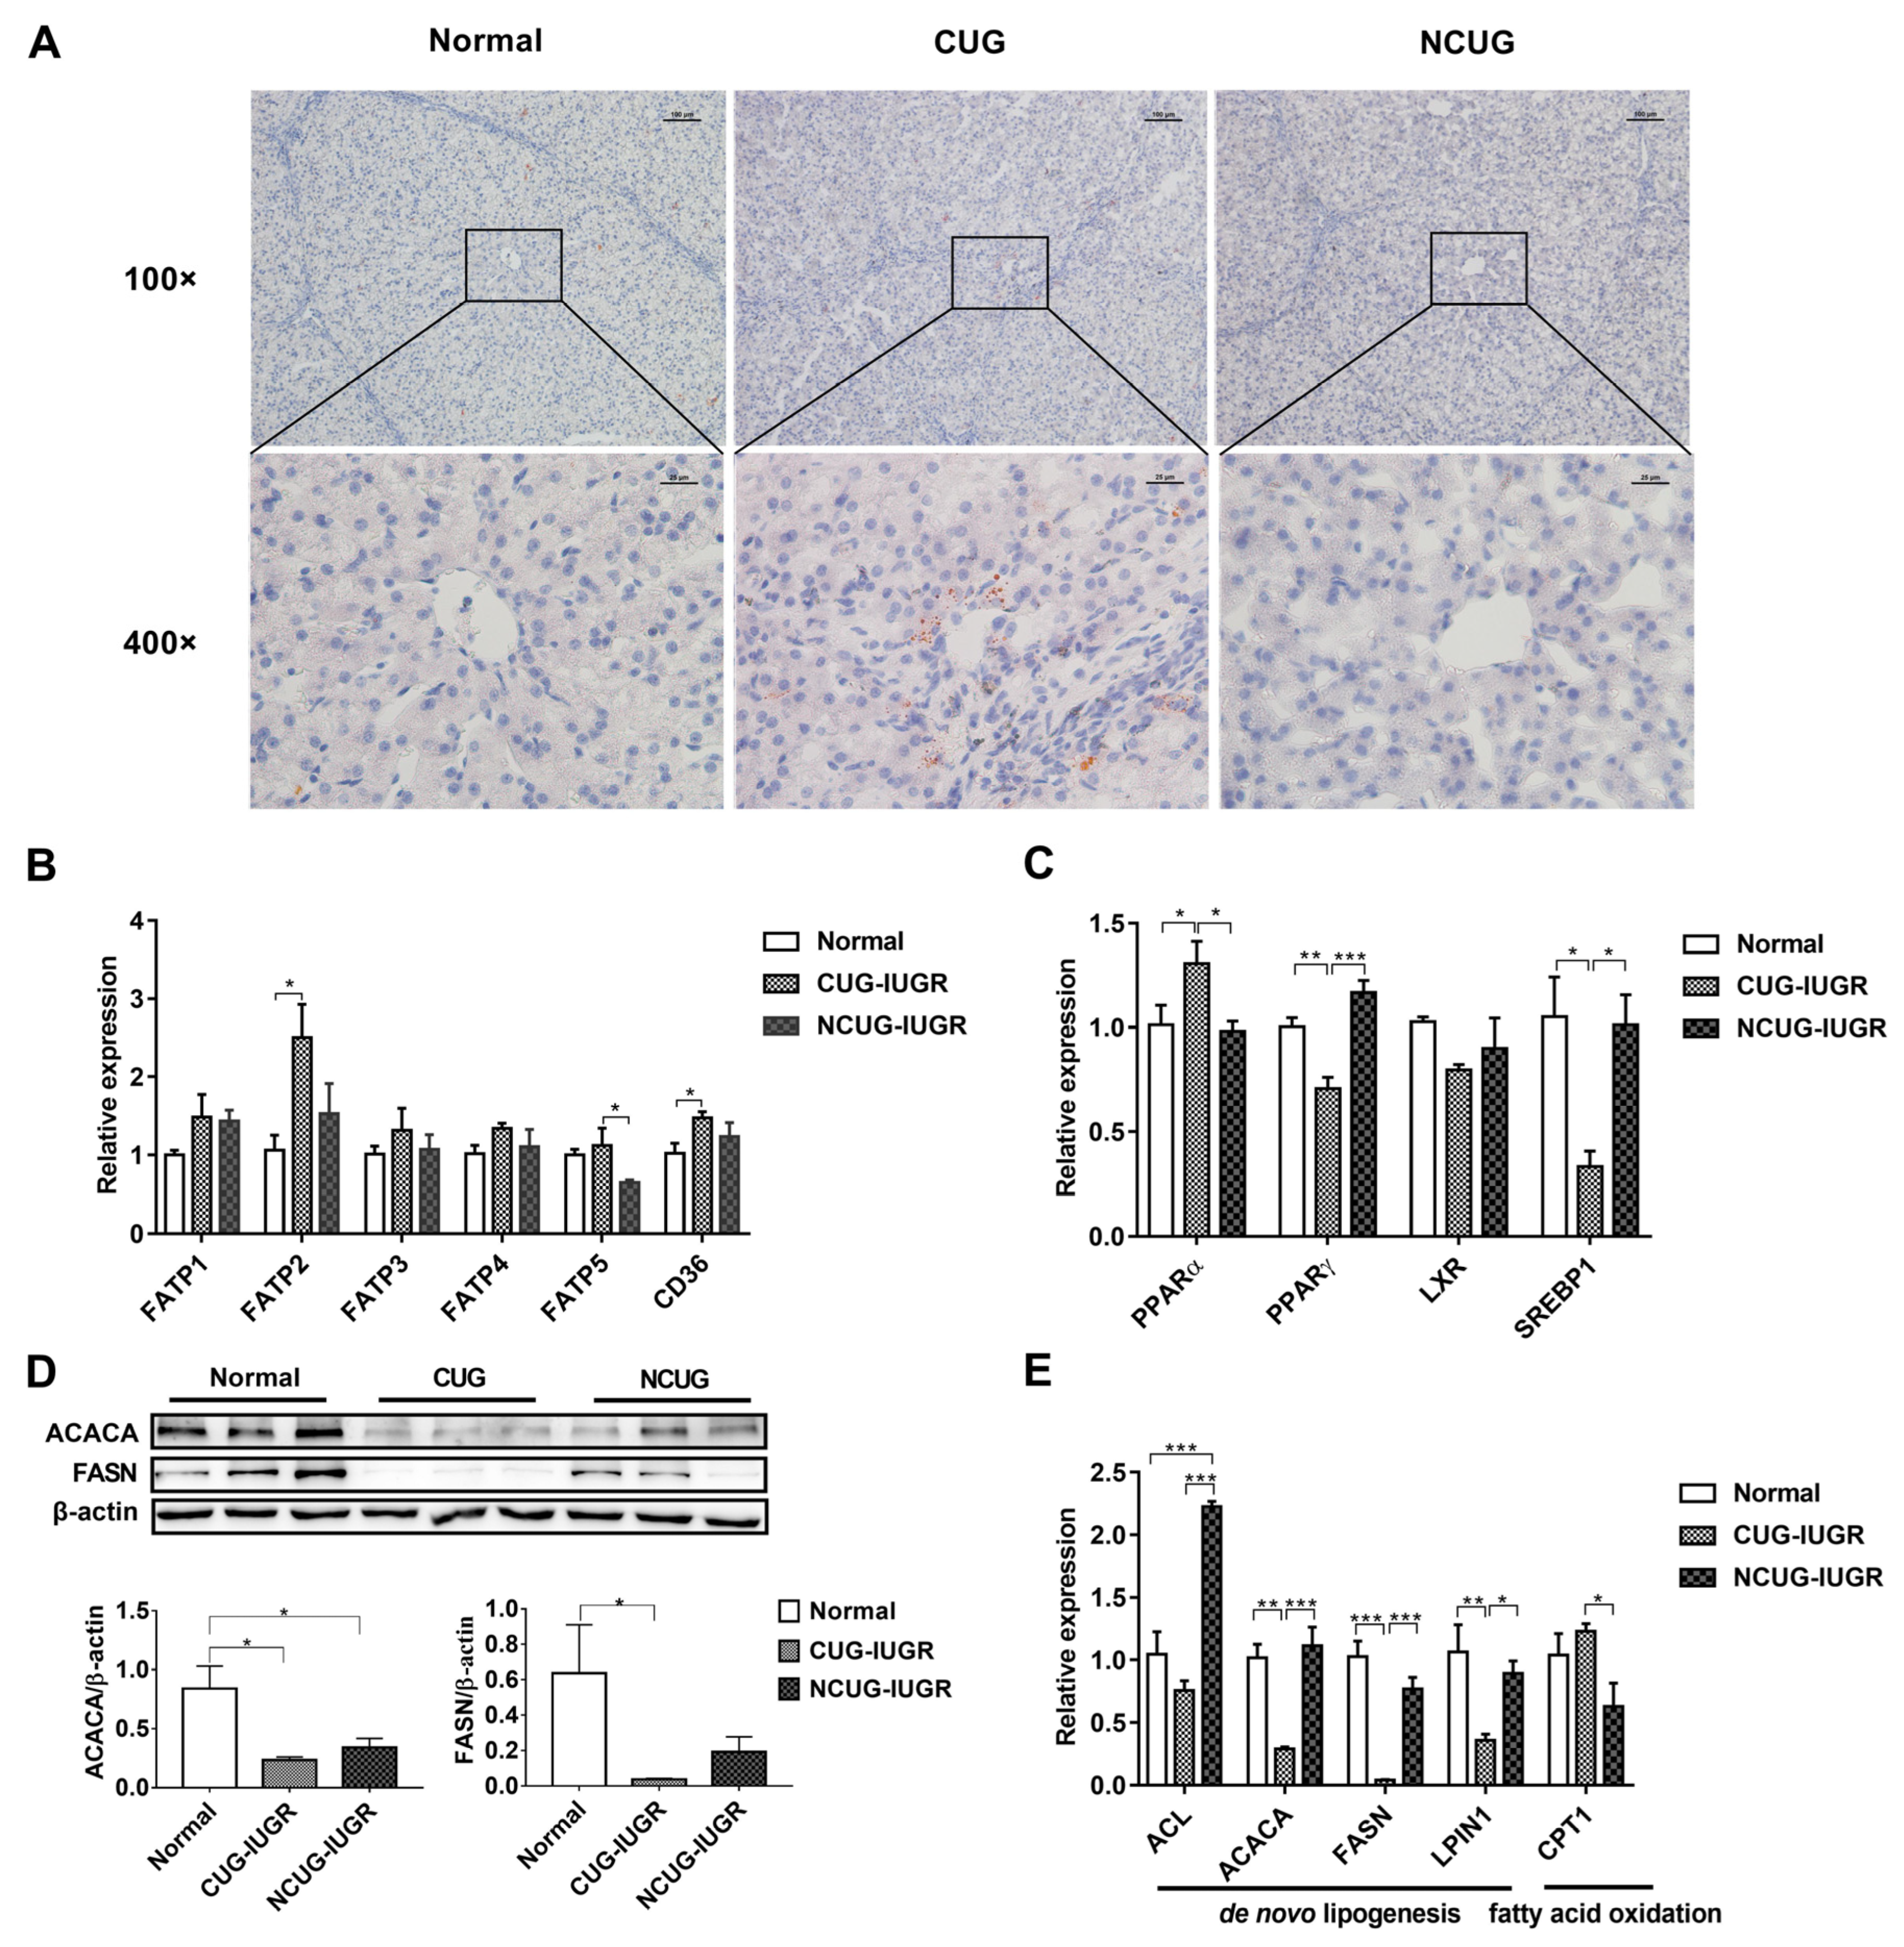
2.3. Oil Red O Staining of Liver Sections

Liver tissue specimens were removed from the fixative, placed in a 15% sucrose solution, dehydrated, and settled in a 4 °C refrigerator, and then transferred to a 30% sucrose solution to dehydrate and settle in a 4 °C refrigerator. The dehydrated tissues were blotted with filter paper to dry the surface water and then dripped with OCT embedding agent (Sakura, Tokyo, Japan), sectioned (5 μm thickness) while using a frozen microtome (Thermo Fisher Scientific, Beijing, China), and then stained using oil red stain for 8 to 10 min, followed by background differentiation using isopropyl alcohol and then hematoxylin (Thermo Fisher Scientific, Beijing, China) staining. The prepared sections were observed and photographed using a light microscope (Nikon YS100; Nikon Corporation, Tokyo, Japan) equipped with a digital camera (NIKON DS-Fi1c, Tokyo, Japan).

2.4. Hepatic Oxidative Stress

To evaluate hepatic oxidative stress, the amounts of malondialdehyde (MDA, A003-1), reduced glutathione (GSH, A006-2-1), and the activities of total superoxide dismutase (T-SOD, A001-3), total antioxidant capacity (T-AOC, A015-3-1), and glutathione peroxidase (GSH-PX, A005-1) were measured using commercially available kits from Nanjing Jiancheng Bioengineering Institute (Nanjing, China), according to the guidelines of the manufacturer.

2.5. Total RNA Isolation and Real-Time PCR

Total RNA was isolated from 100 mg tissue samples using TRIZOL reagent (Thermo Fisher Scientific, Beijing, China) according to the manufacturer’s instructions. The RNA quality was confirmed by calculating the OD 260/280 ratio via an RNA Concentration Analyzer (NanoDrop, 2000c; Thermo Scientific, Wilmington, NC, USA), and the integrity of the RNA was verified by agarose gel electrophoresis. RNA was reverse transcribed to cDNA using gDNA Remover and 4× RT Master Mix (EZBioscience, Beijing, China). 2× Color SYBR Green qPCR Master Mix (EZBioscience, Beijing, China) was used for quantitative PCR. PCR reactions were performed with an Mx3005p instrument (Stratagene, San Diego, CA, USA). Primer sequences for qRT-PCR are listed in Table 2. Gene expression profiles were normalized with gene expression profiles of β-actin, and the relative mRNA expression of target genes was calculated using the 2-ΔΔCt method.

2.6. Western Blot Analysis

Liver tissue samples were homogenized in RIPA lysis buffer (Beyotime, Nanjing, China). Extracted protein samples were heated in water at 100 °C for 5 min and separated by electrophoresis (Bio-Rad, Richmond, CA, USA) in 8-12% SDS-PAGE gel, and then electrically transferred to polyvinylidene difluoride (PVDF) membranes (Millipore, Billerica, MA). After polyvinylidene fluoride membranes were blotted with Tris-buffer containing 5% fat-free dry milk and 0.05% Tween-20 (Sangon biotech, Shanghai, China) for 1 h at 25 °C, they were rinsed in TBST (TBST; 0.05% Tween 20, 100 mmol/L of Tris-HCl, and 150 mmol/L of NaCl, pH 7.5) (Sangon biotech, Shanghai, China) 4 times and incubated overnight at 4 °C with primary antibodies: GLUT1 (Abcam, ab150299, Cambridge, UK) dilution ratio of 1:500. The dilution ratios of p-AMPK (Cell Signaling Technology, 2535T, Boston, USA), AMPK (Abcam, ab3759, Cambridge, UK), NF-κB (Proteintech, 20536-1-AP, Chicago, IL, USA), p-NF-κB (Cell Signaling Technology, 3033s, Boston, USA) were all 1:1000. The dilution ratios of ACACA (Abcam, ab72046, Cambridge, UK), FASN (Abcam, ab99359, Cambridge, UK), and β-actin (Proteintech, 20536-1-AP, Chicago, FL, USA) were all 1:2000. The dilution ratios of JNK (Cell Signaling Technology, 9252s, Boston, USA), p-JNK (Cell Signaling Technology, 4668s, Boston, USA), ERK (Cell Signaling Technology, 9102s, Boston, USA), p-ERK (Cell Signaling Technology, 9101s, Boston, USA) were all 1:3000. After washing, membranes were incubated with a secondary antibody (Amersham Biosciences, Buckinghamshire, UK). Protein expression was measured and analyzed using a Fluor Chem M fluorescent imaging system (Protein Simple, Santa Clara, CA, USA) and ImageJ software.

2.7. Statistical Analysis

Data were collected from at least three independent experiments, and all data were analyzed using one-way analysis of variance (ANOVA) followed by Duncan’s multiple range test in SPSS software (v20.0; SPPS Inc., Chicago, IL, USA). Data are shown as means ± SEM. p < 0.05 was considered statistically significant, and p < 0.01 was considered highly statistically significant. Liver antioxidant capacity index parameters measured by kits and liver glucose metabolism, inflammatory status, mitochondrial function, and fatty acid metabolism-related gene mRNA expression level index parameters measured by RT-PCR were tested using Pearson’s correlation test (all groups), and a correlation heat map was drawn using the heat map R package.

2.8. Ethics Approval and Consent to Participate

All animal procedures used in this experiment were approved by the Animal Care and Use Committee of the South China Agricultural University (No. 20110107-1, Guangzhou, China).

3. Results

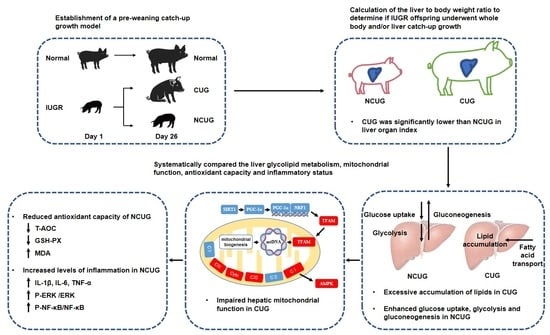
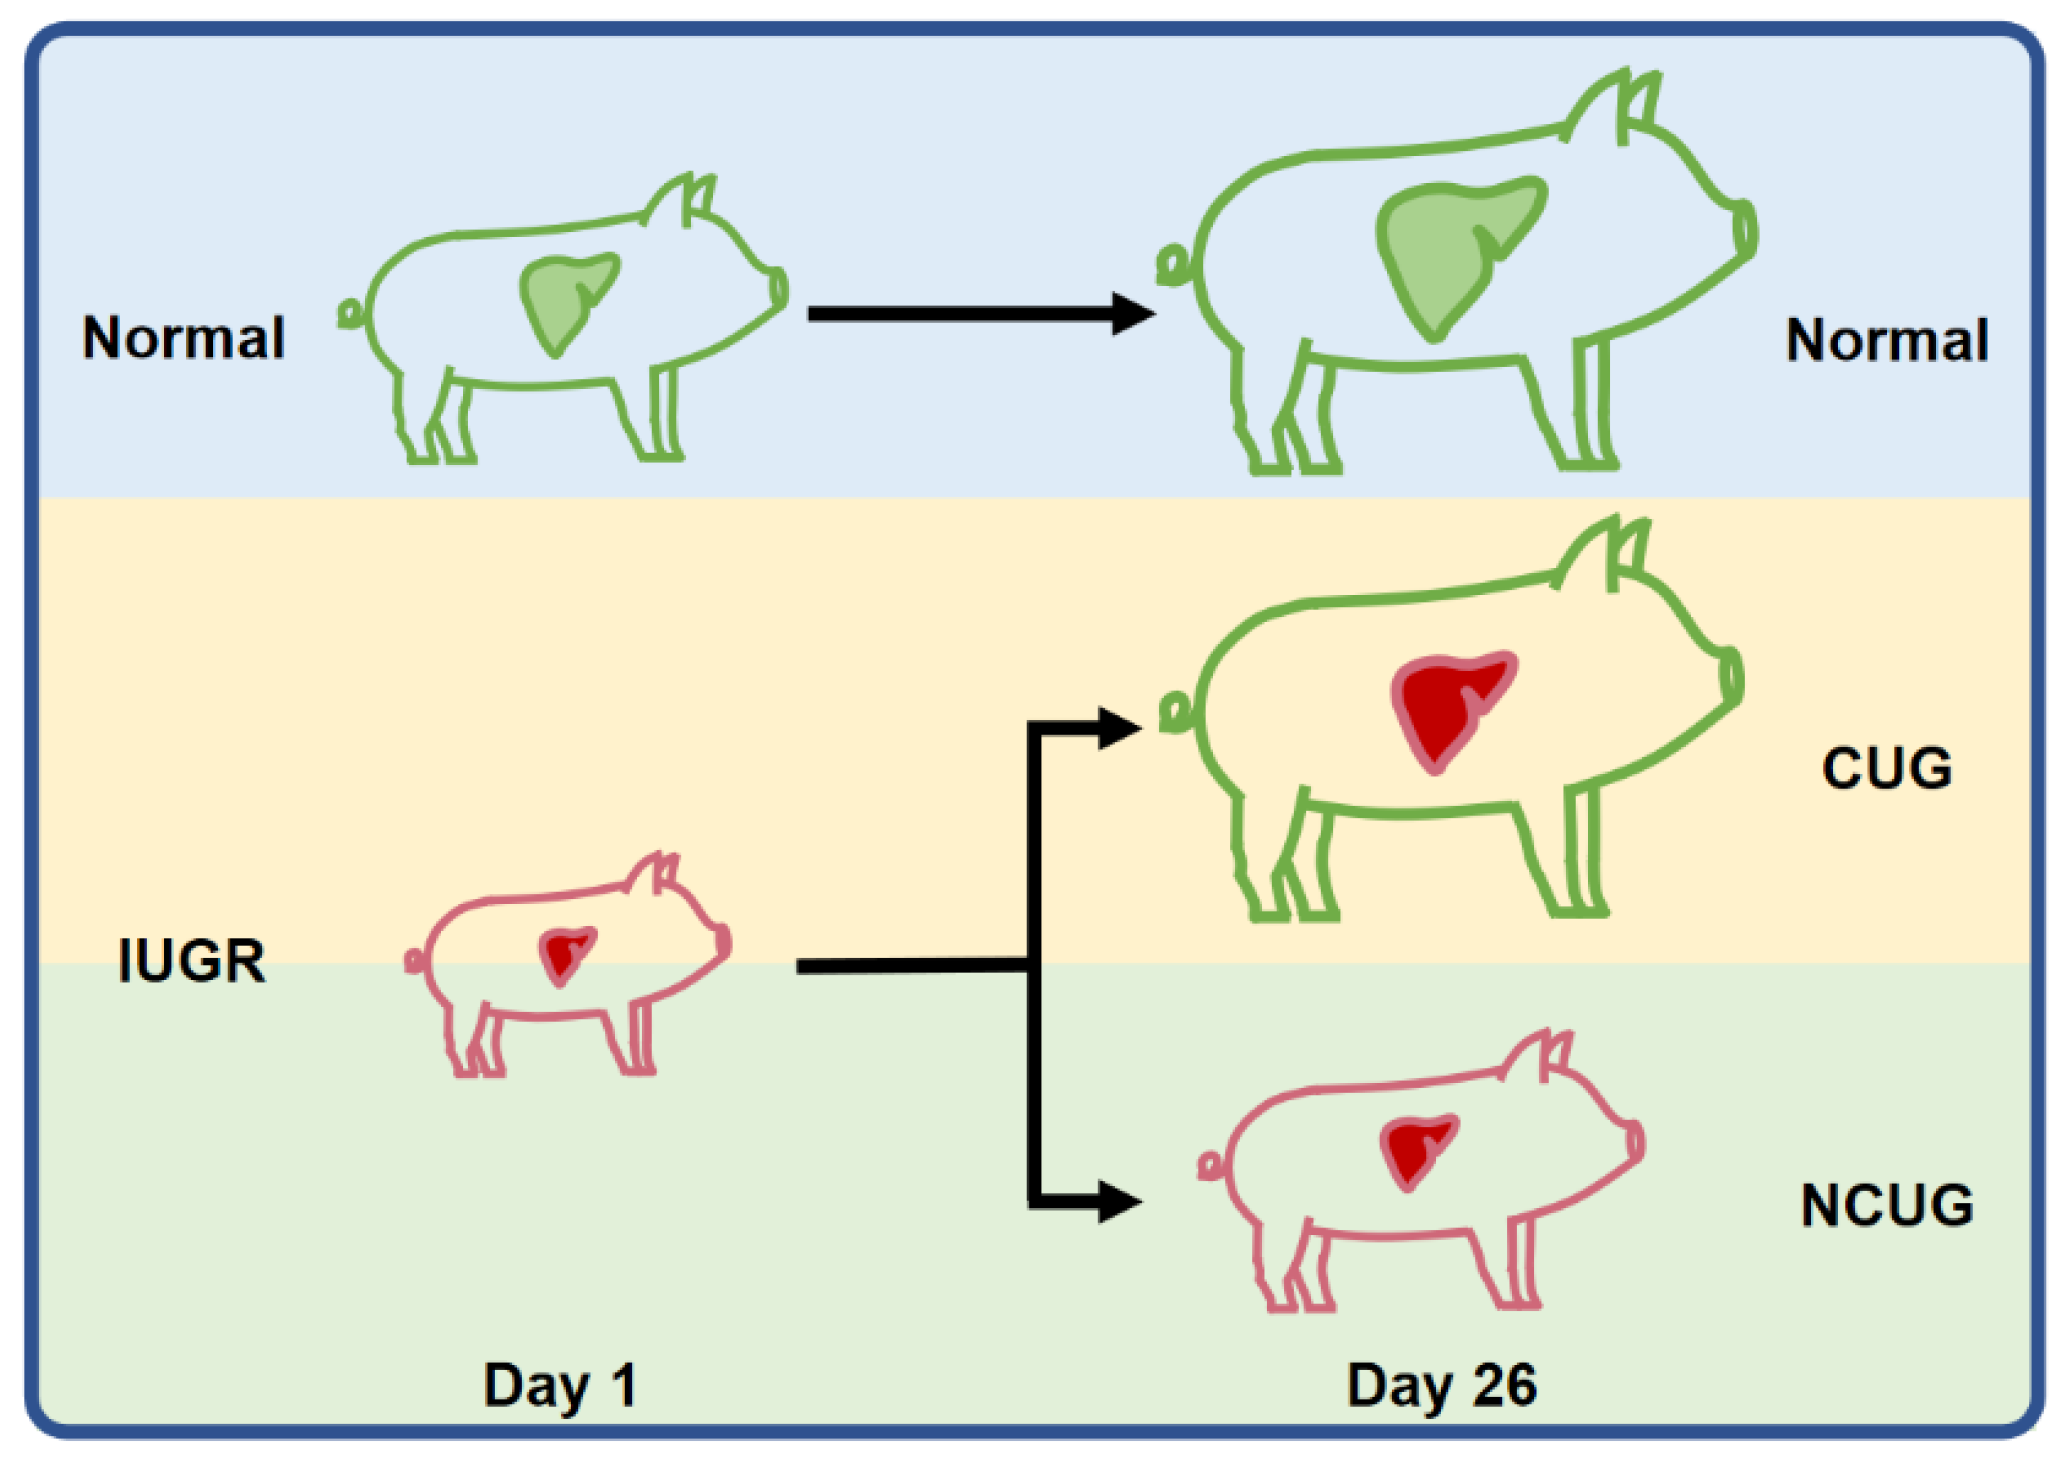
3.1. Growth Performance and Organ Index of Piglets with Different Growth Patterns

To establish animal models with different growth patterns, body weight and length were measured weekly to track the growth pattern of piglets. Body weight, length, and BMI of CUG and NCUG were significantly lower than Normal at birth (p < 0.05), while all these parameters of CUG have no obvious difference from the Normal group on weaning day. Additionally, the body weight, body length, and BMI of NCUG piglets at 1, 14, 21, and 26 days were significantly lower than those of Normal piglets, showing growth retardation (p < 0.05) (Figure 2). Mortality of IUGR piglets increased most rapidly in the first week and reached its highest rate in the second week (14.55%). At the end of the experiment, piglets achieving CUG accounted for 25.45% of IUGR piglets (Figure 2D). The average daily gain (ADG) during the whole suckling period had a higher trend in CUG compared with the Normal group (Table 3), and the ADG in the third week of suckling showed significantly higher in CUG than Normal (p < 0.01) (Table 4). The weight of the spleen (p < 0.05), heart (p < 0.01), kidney (p < 0.01), lung (p < 0.01), and liver (p < 0.01) were significantly lower in NCUG than in Normal, while the liver weight was significantly lower in CUG than in Normal (p < 0.05), other organs were not significantly different from Normal (Table 5). The organ index was obtained by dividing the organ weight by the body weight, liver organ index decreased in CUG compared to NCUG (p < 0.05), while kidney organ index was greatest in NCUG compared to CUG and Normal (p < 0.05), and all other organs were proportionally reduced with body weight (Table 6).

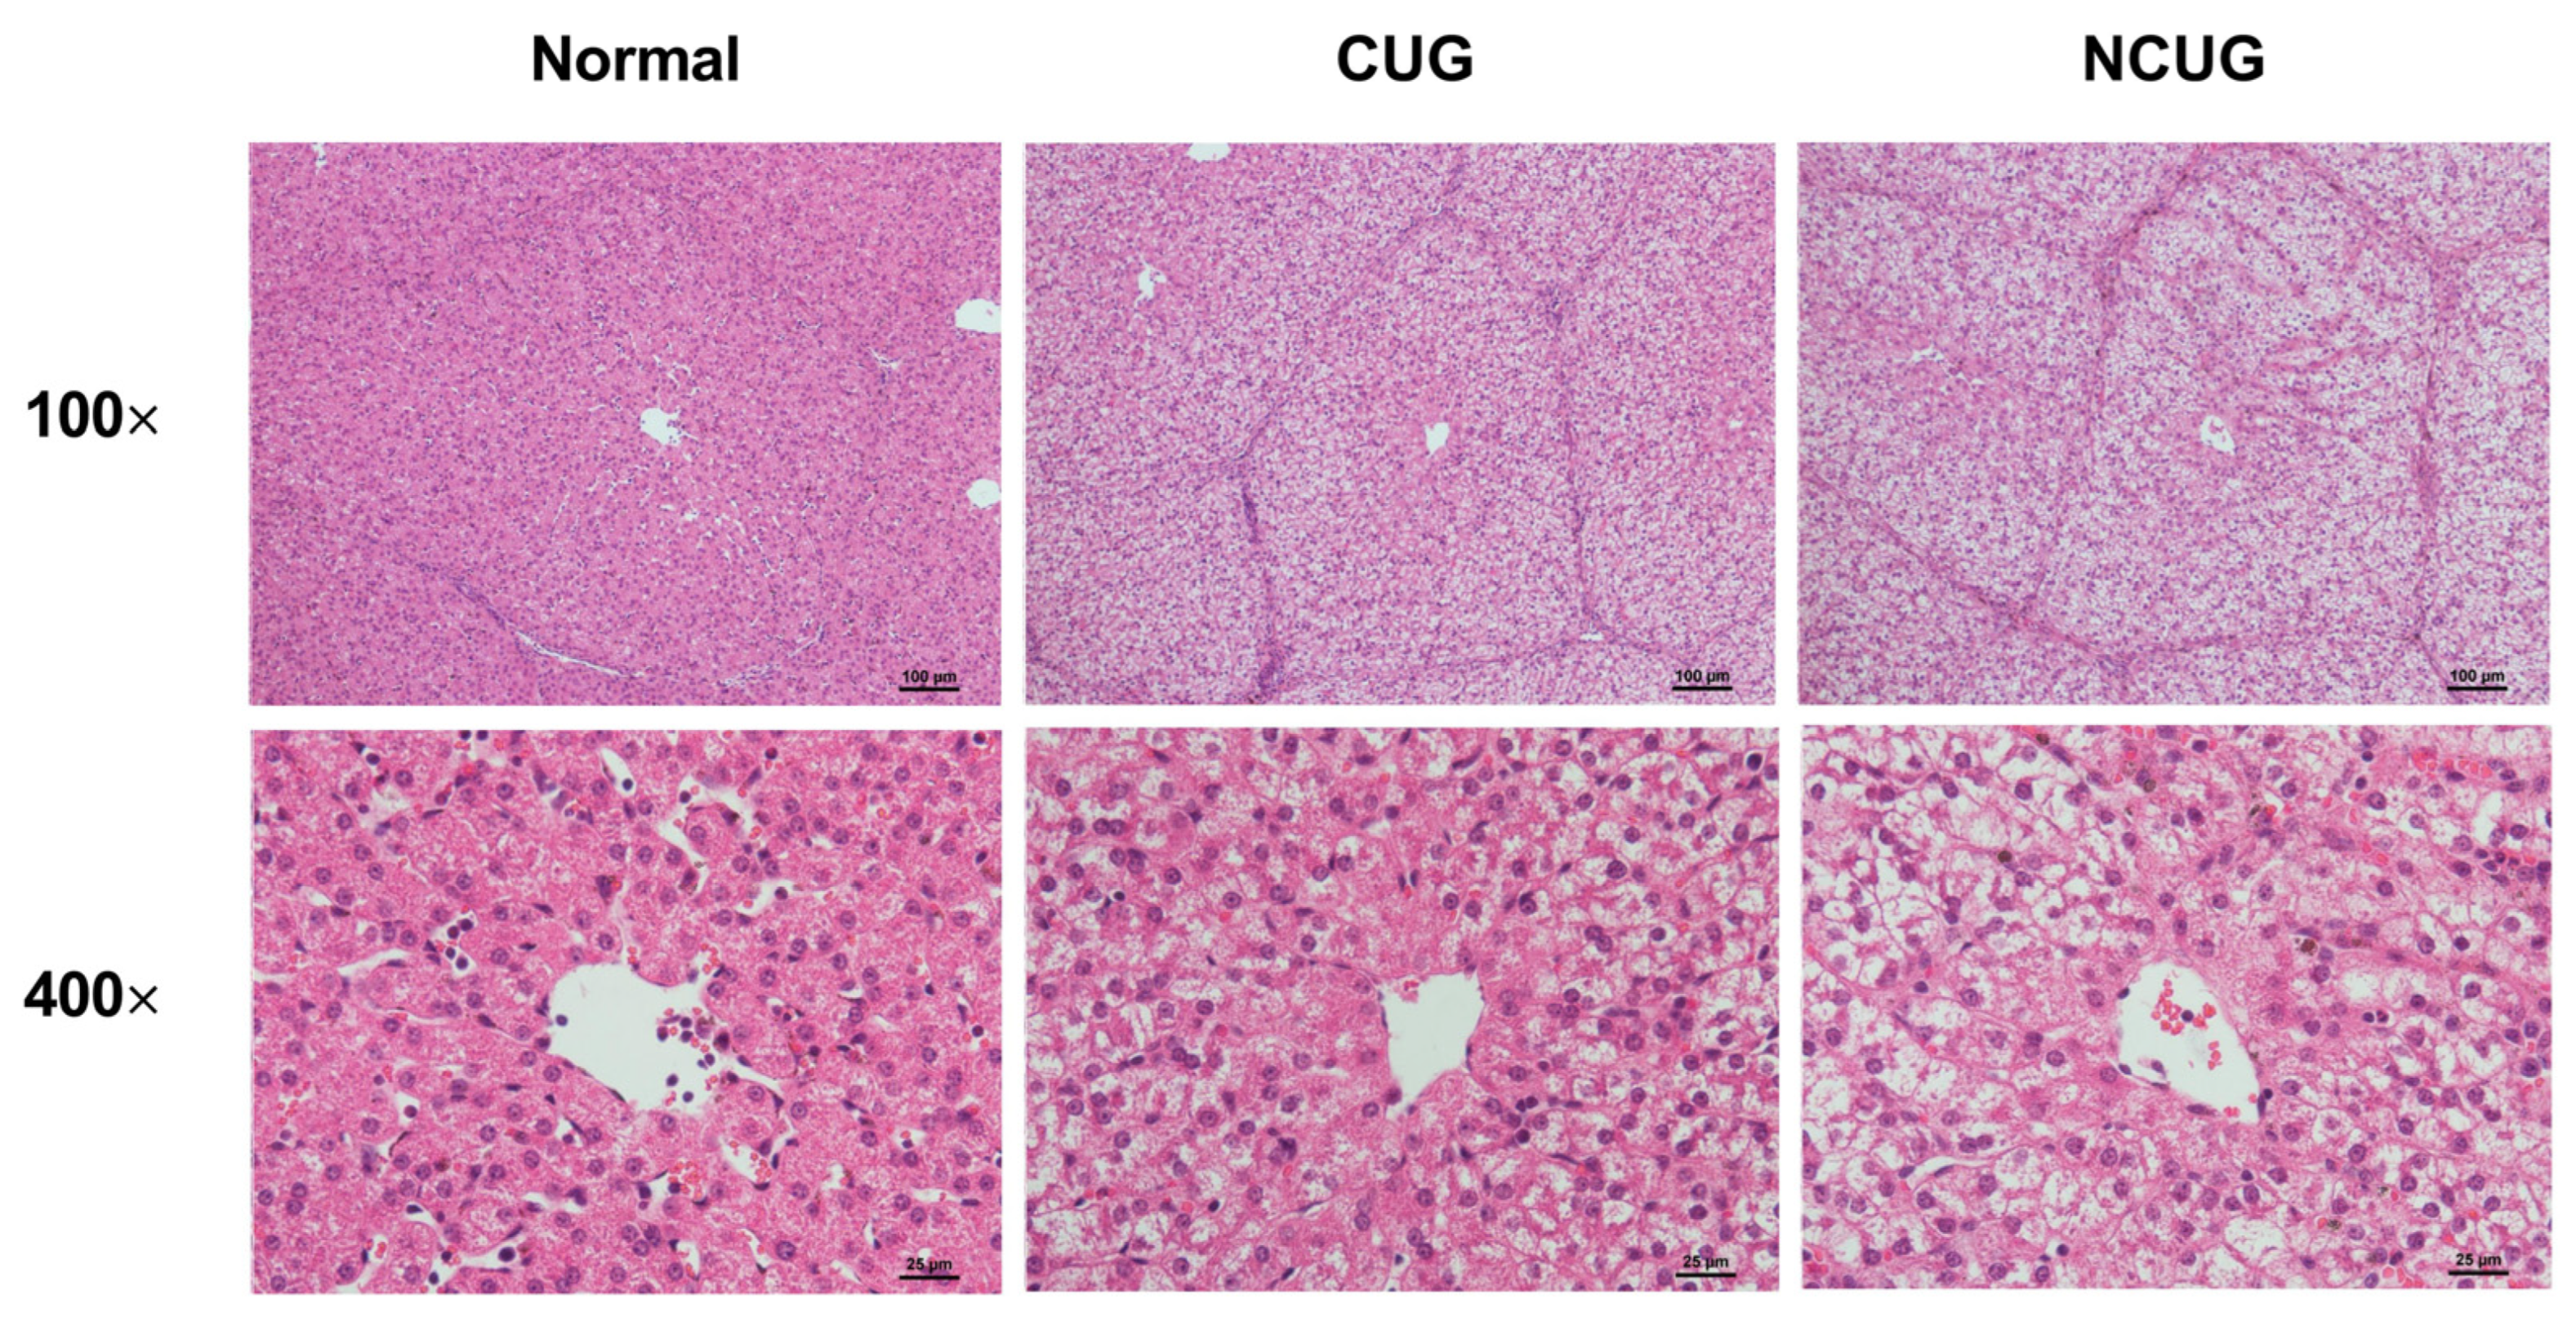
3.2. Liver Histology Section

We subsequently detected hepatic pathological sections in three piglet groups. Compared to Normal and CUG piglets, NCUG piglets displayed apparent vacuoles, and severe structural damage appeared in the hepatocytes (Figure 3). These results confirmed the existence of a liver injury in NCUG piglets.

3.3. Hepatic Lipid Metabolism in Piglets with Different Growth Patterns

Oil Red O staining was performed to estimate lipid content in hepatocytes. CUG piglets showed significant lipid deposition in the liver, but no obvious lipid droplets were observed in either Normal or NCUG groups (Figure 4A). In addition, fatty acid transporters and genes involved in lipid metabolism were assayed to determine the source of CUG hepatic lipid deposition in the present study. The results showed that the mRNA expression of FATP2 and CD36 in CUG were significantly higher than those in Normal (p < 0.05), and FATP5 was significantly higher than that in the NCUG group (p < 0.05). There was no significant difference observed between NCUG and Normal piglets (Figure 4B). Interestingly, significant downregulation of fatty acid de novo synthesis-related proteins was also observed in CUG. Compared with Normal, a significant decrease in the protein levels of ACACA and FASN was observed in CUG (p < 0.05), while only a decrease in ACACA was observed in NCUG (p < 0.05) (Figure 4D). Expression of PPAR-γ (p < 0.01), SREBP1 (p < 0.05), ACACA (p < 0.01), FASN (p < 0.01), and LPIN1 (p < 0.05) decreased in CUG livers compared with Normal and NCUG. In addition, the expression of fatty acid de novo synthesis-related genes in NCUG was not significantly different from Normal (Figure 4C,E). In addition, the mRNA expression level of ACL was extremely significantly higher in NCUG than in Normal and CUG (p < 0.001), and there was no significant difference between CUG and Normal (Figure 4E). Expression of the fatty acid oxidation regulatory gene PPAR-α was upregulated in CUG compared with NCUG and Normal (p < 0.05), while no significant difference between NCUG and Normal was observed (Figure 4C). The expression of CPT1 in CUG was significantly upregulated compared with NCUG (p < 0.05), but was not significantly different from Normal (Figure 4E).

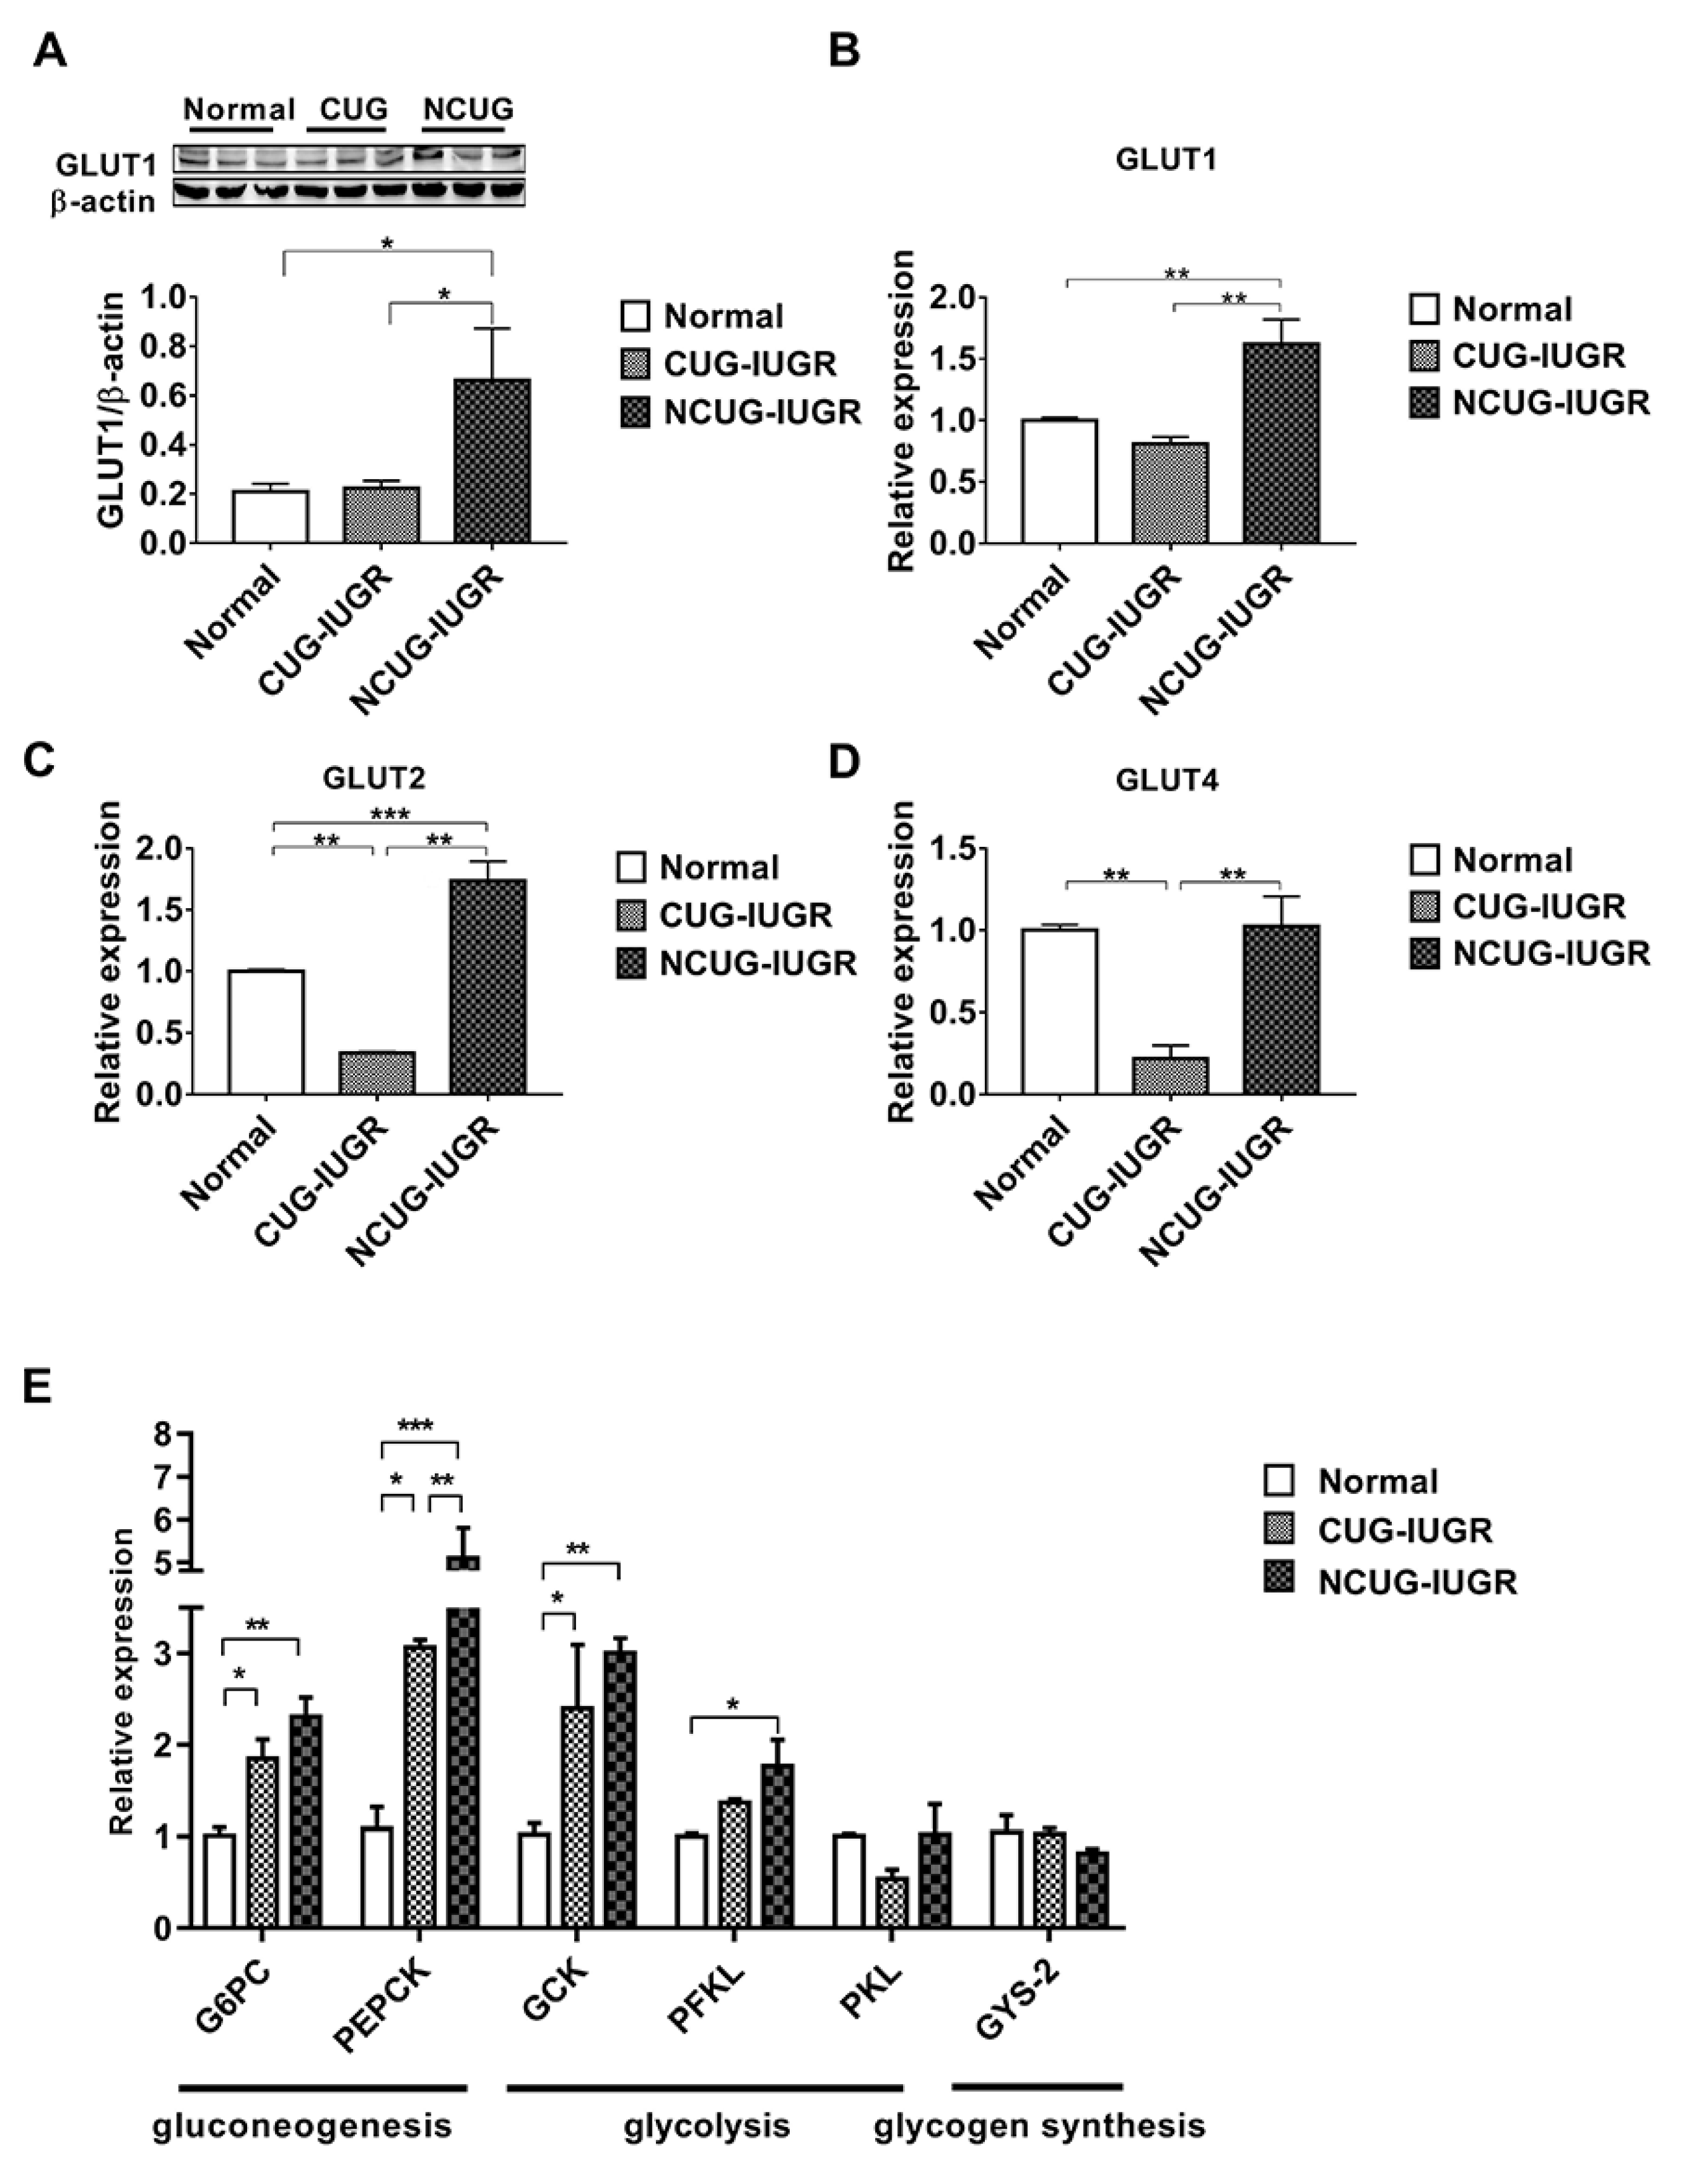
3.4. Hepatic Glucose Metabolism in Piglets with the Different Growth Patterns

Compared with CUG and Normal, the protein level of GLUT1 was significantly increased in NCUG (p < 0.05) (Figure 5A), along with the mRNA expression levels of GLUT1 and GLUT2 (p < 0.01) (Figure 5B,C). In CUG, no significant difference was observed in GLUT1 protein level and mRNA level compared with Normal (Figure 5B), while the mRNA level of GLUT2 was significantly lower than that in NCUG (p < 0.001) and Normal (p < 0.01) (Figure 5C). The expression of GLUT4 in CUG was significantly lower than that in NCUG and Normal (p < 0.01), and there was no significant difference between NCUG and Normal (Figure 5D). Compared with Normal, the mRNA expressions of G6PC, PEPCK, and GCK genes were significantly increased in CUG (p < 0.05) and extremely significantly increased in NCUG (p < 0.01). Although there was no significant difference between NCUG and CUG in G6PC and GCK, PEPCK of NCUG was significantly upregulated compared to CUG (p < 0.05). Compared to Normal, PFKL was significantly upregulated in NCUG (p < 0.05), and there was no significant difference between CUG and Normal (Figure 5E).

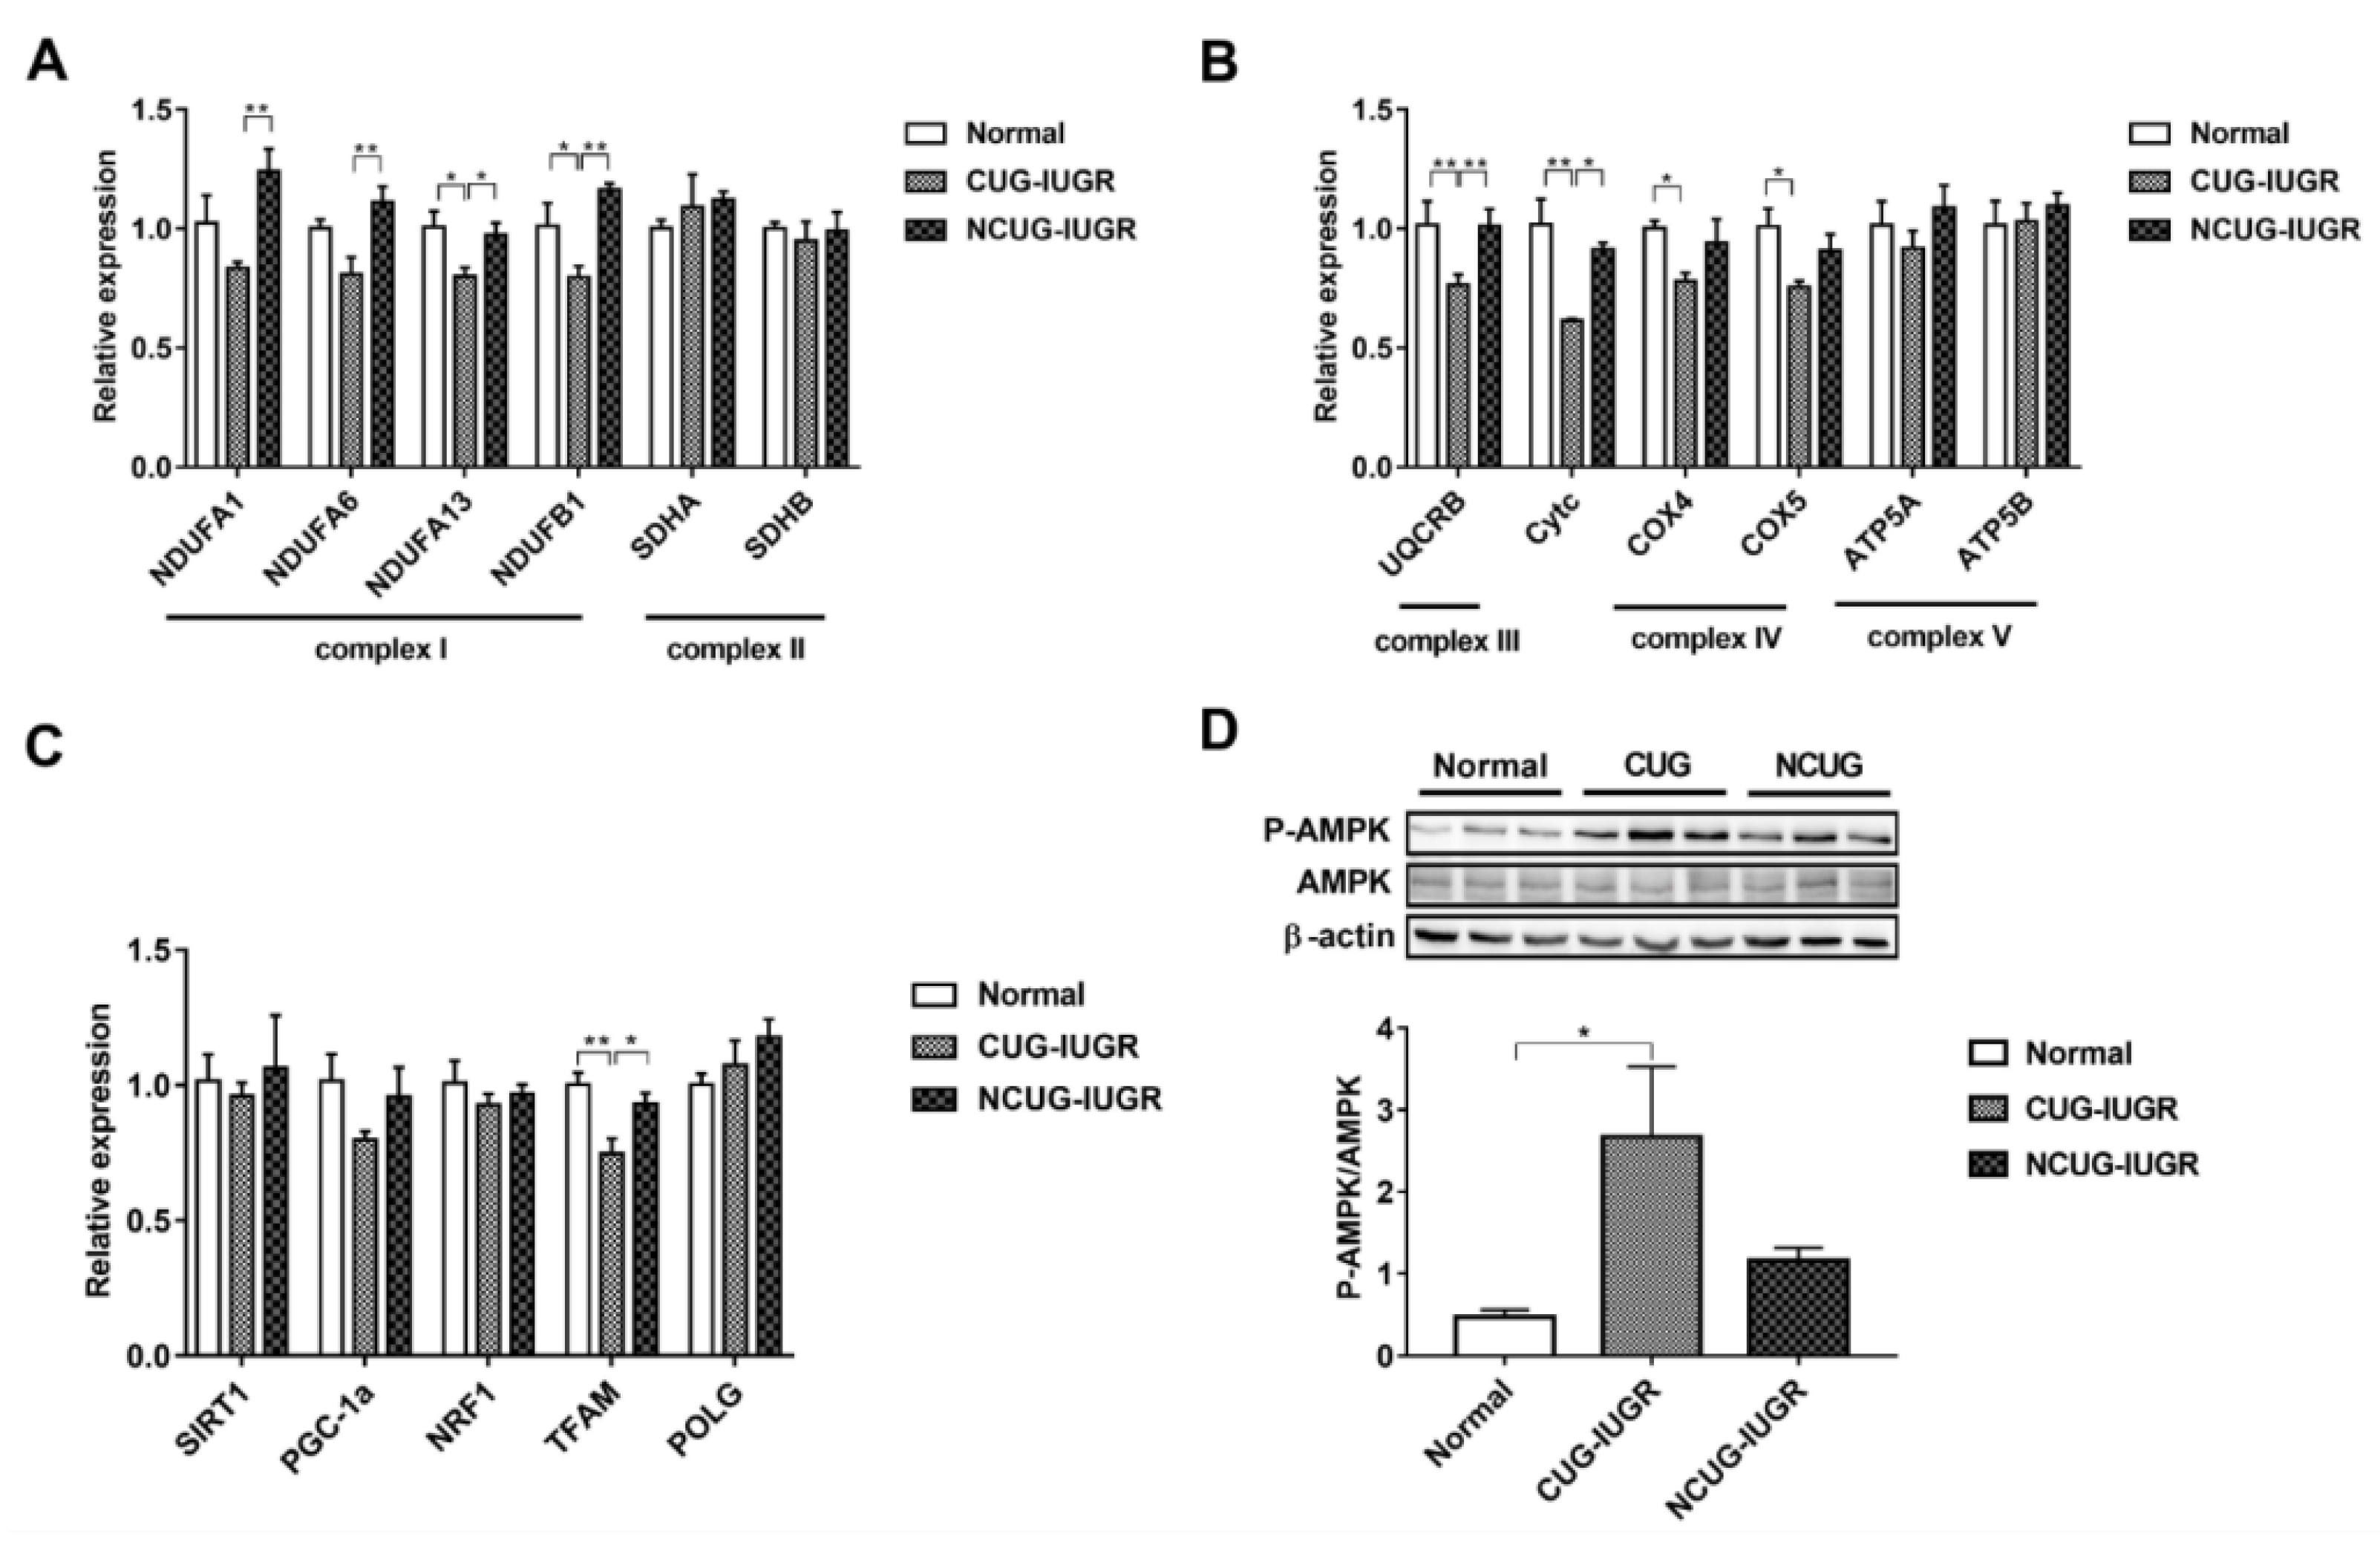
3.5. Mitochondrial Electronic Transmission Chain (ETC) and AMPK Signaling Pathway in the Liver among Different Growth Patterns of Piglets

We measured the expression of genes related to ETC and biogenesis to compare the effect of CUG growth on mitochondrial function. Gene expression of NDUFA1 and NDUFA6 decreased in CUG compared with NCUG (p < 0.01), but was not significantly different from Normal. The expression of NDUFA13 decreased in CUG compared with NCUG and Normal (p < 0.05), while the expression of NDUFB1 in CUG was significantly lower than that in Normal (p < 0.05) and extremely significantly lower than that in NCUG (p < 0.01). Compared to NCUG and Normal, CUG reduced the gene expression of UQCRB (p < 0.01) and Cytc (p < 0.05). In addition, the expression of COX IV and COX V was downregulated in the CUG compared to Normal (p < 0.05) (Figure 6A,B). Furthermore, CUG inhibited the expression of gene TFAM related to mitochondrial biogenesis (p < 0.05) (Figure 6C). In contrast, no significant difference in mitochondrial energy metabolism and biogenesis-related genes was observed between NCUG and Normal. In addition, compared with Normal, CUG piglets increased the ratio of phosphorylated AMPK to total AMPK (p-AMPK/AMPK) (p < 0.05), while p-AMPK/AMPK in NCUG was not significantly different from that of CUG and Normal (Figure 6D).

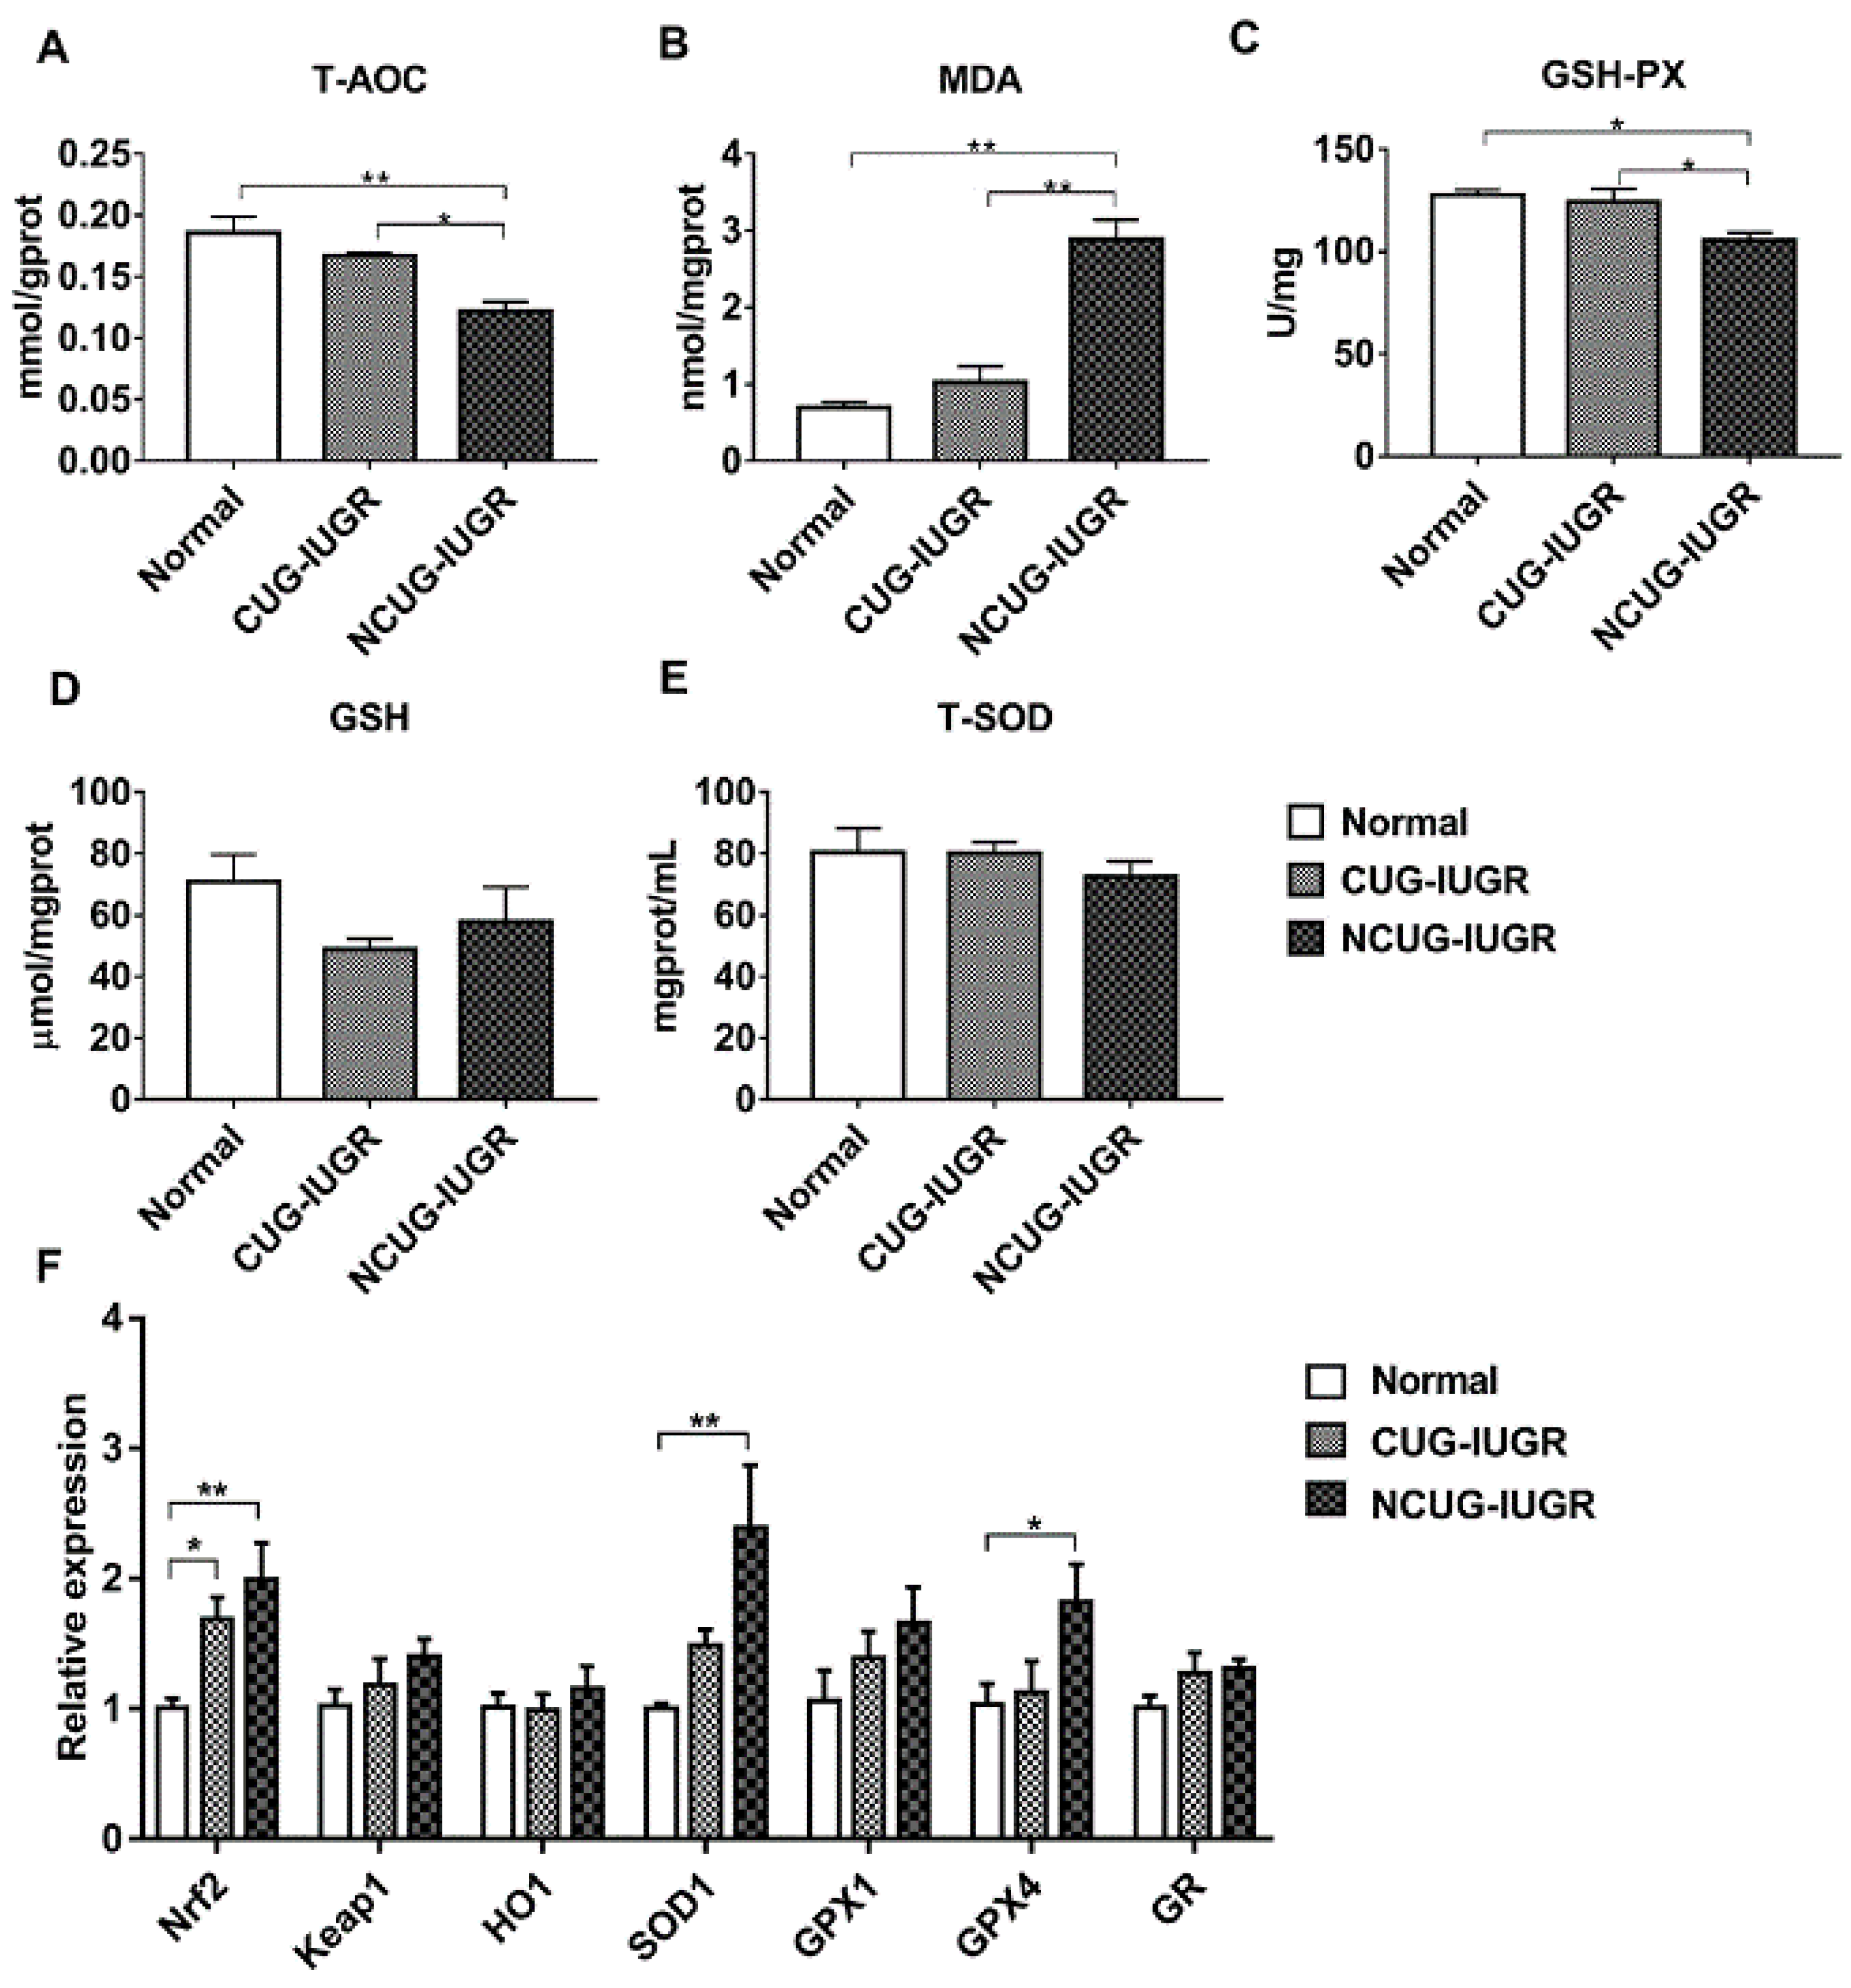
3.6. Hepatic Oxidative Stress Comparison among Different Growth Patterns of Piglets

Given the significant differences in liver metabolic indices between CUG and NCUG, we next measured the differences in antioxidant capacity between the three groups of piglets. In NCUG, the activities of T-AOC (Figure 7A) and GSH-PX (Figure 7C) were significantly decreased compared with CUG and Normal (p < 0.05), while the MDA content was significantly increased compared with CUG and Normal (p < 0.01) (Figure 7B). No significant difference in GSH (Figure 7D) and T-SOD (Figure 7E) was observed between NCUG and CUG groups. The mRNA expression of Nrf2 was significantly increased in CUG (p < 0.05) and extremely significantly increased in NCUG (P < 0.01). Compared with Normal, the mRNA expression levels of SOD1 and GPX4 were significantly upregulated in NCUG (p < 0.05), while no significant difference was observed between CUG and Normal (Figure 7F).

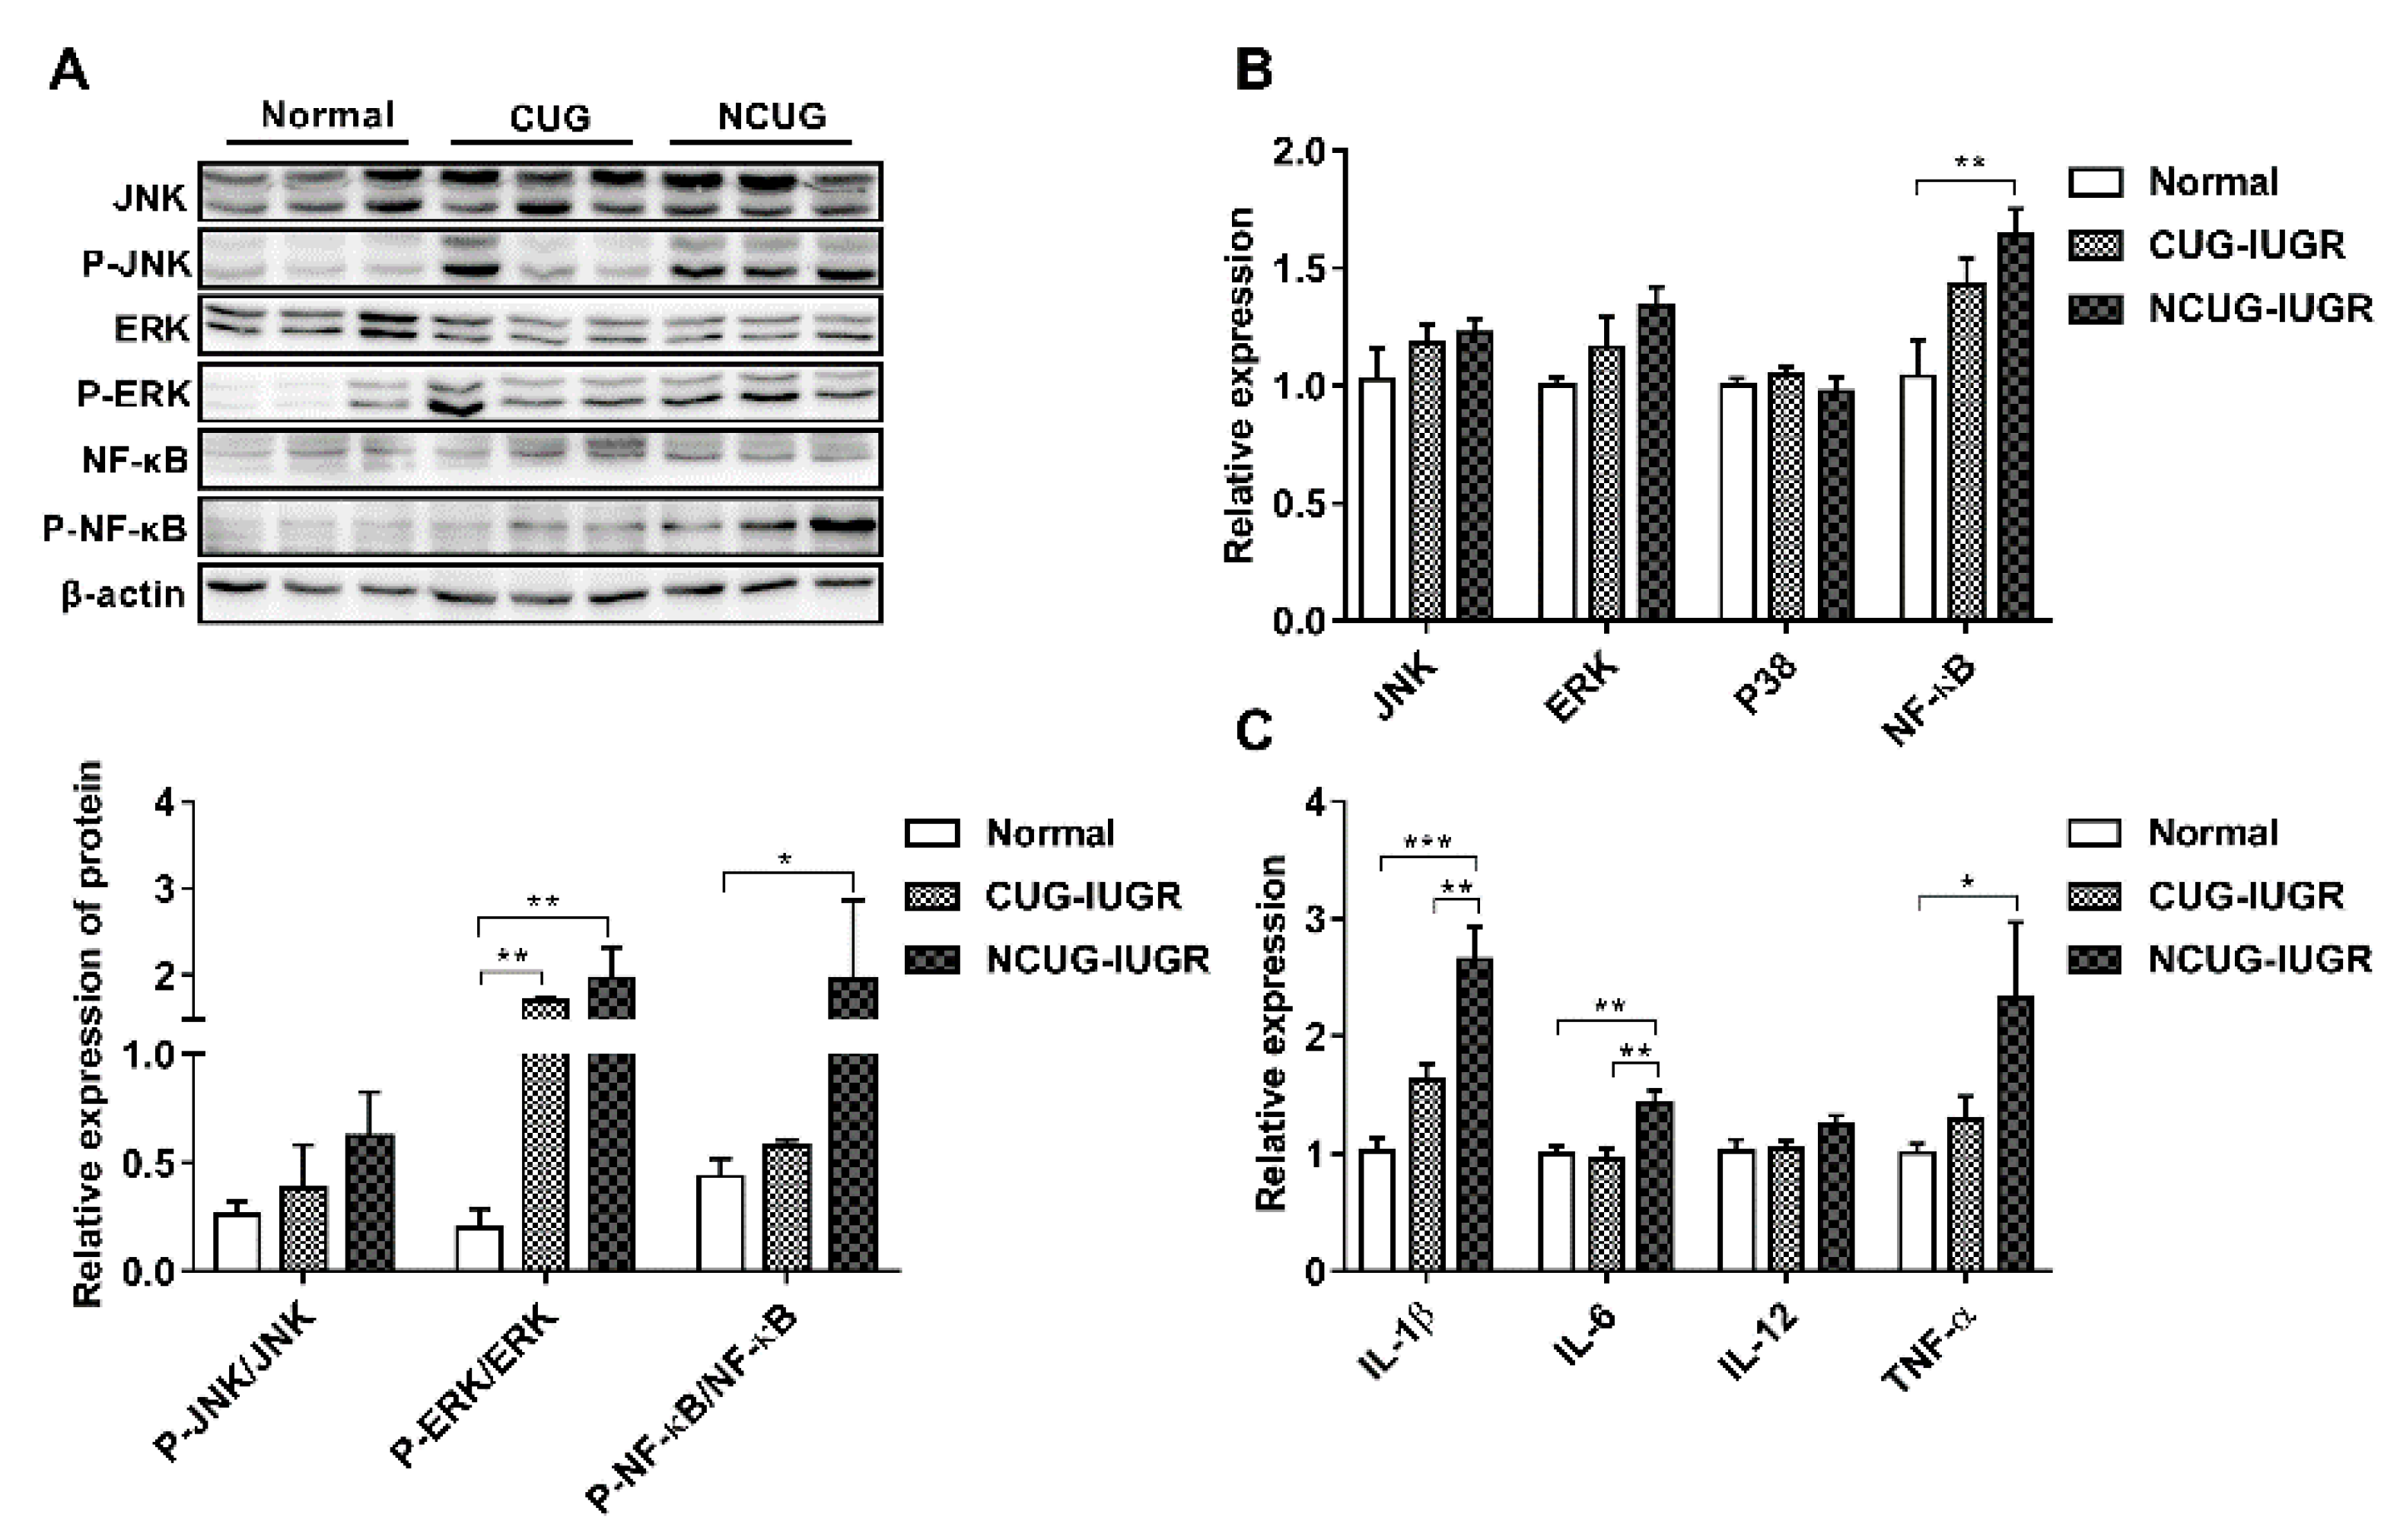
3.7. Hepatic Inflammatory State and NF-κB/MAPK Signaling Pathway

There are no significant differences in the phosphorylation of JNK protein among Normal, CUG and NCUG (Figure 8A). The phosphorylation of ERK protein in NCUG and CUG was significantly higher than that in Normal (p < 0.01) (Figure 8A). The level of NF-κB phosphorylation was significantly increased in NCUG compared with Normal (p < 0.05), while no significant difference was observed between CUG and Normal (Figure 8A). The mRNA expressions of NF-κB and MAPK-related proteins and their downstream pro-inflammatory factors were consistent with the phosphorylation of NF-κB/MAPK pathway proteins. NF-κB was significantly upregulated in NCUG compared to Normal (Figure 8B). The mRNA expressions of IL-1β and IL-6 in NCUG were significantly higher than those in CUG and Normal (p < 0.01), and the expression of TNF-α was significantly higher than in Normal (p < 0.05). In contrast, no significant difference was observed between the expression of pro-inflammatory factors in Normal and CUG (Figure 8C).

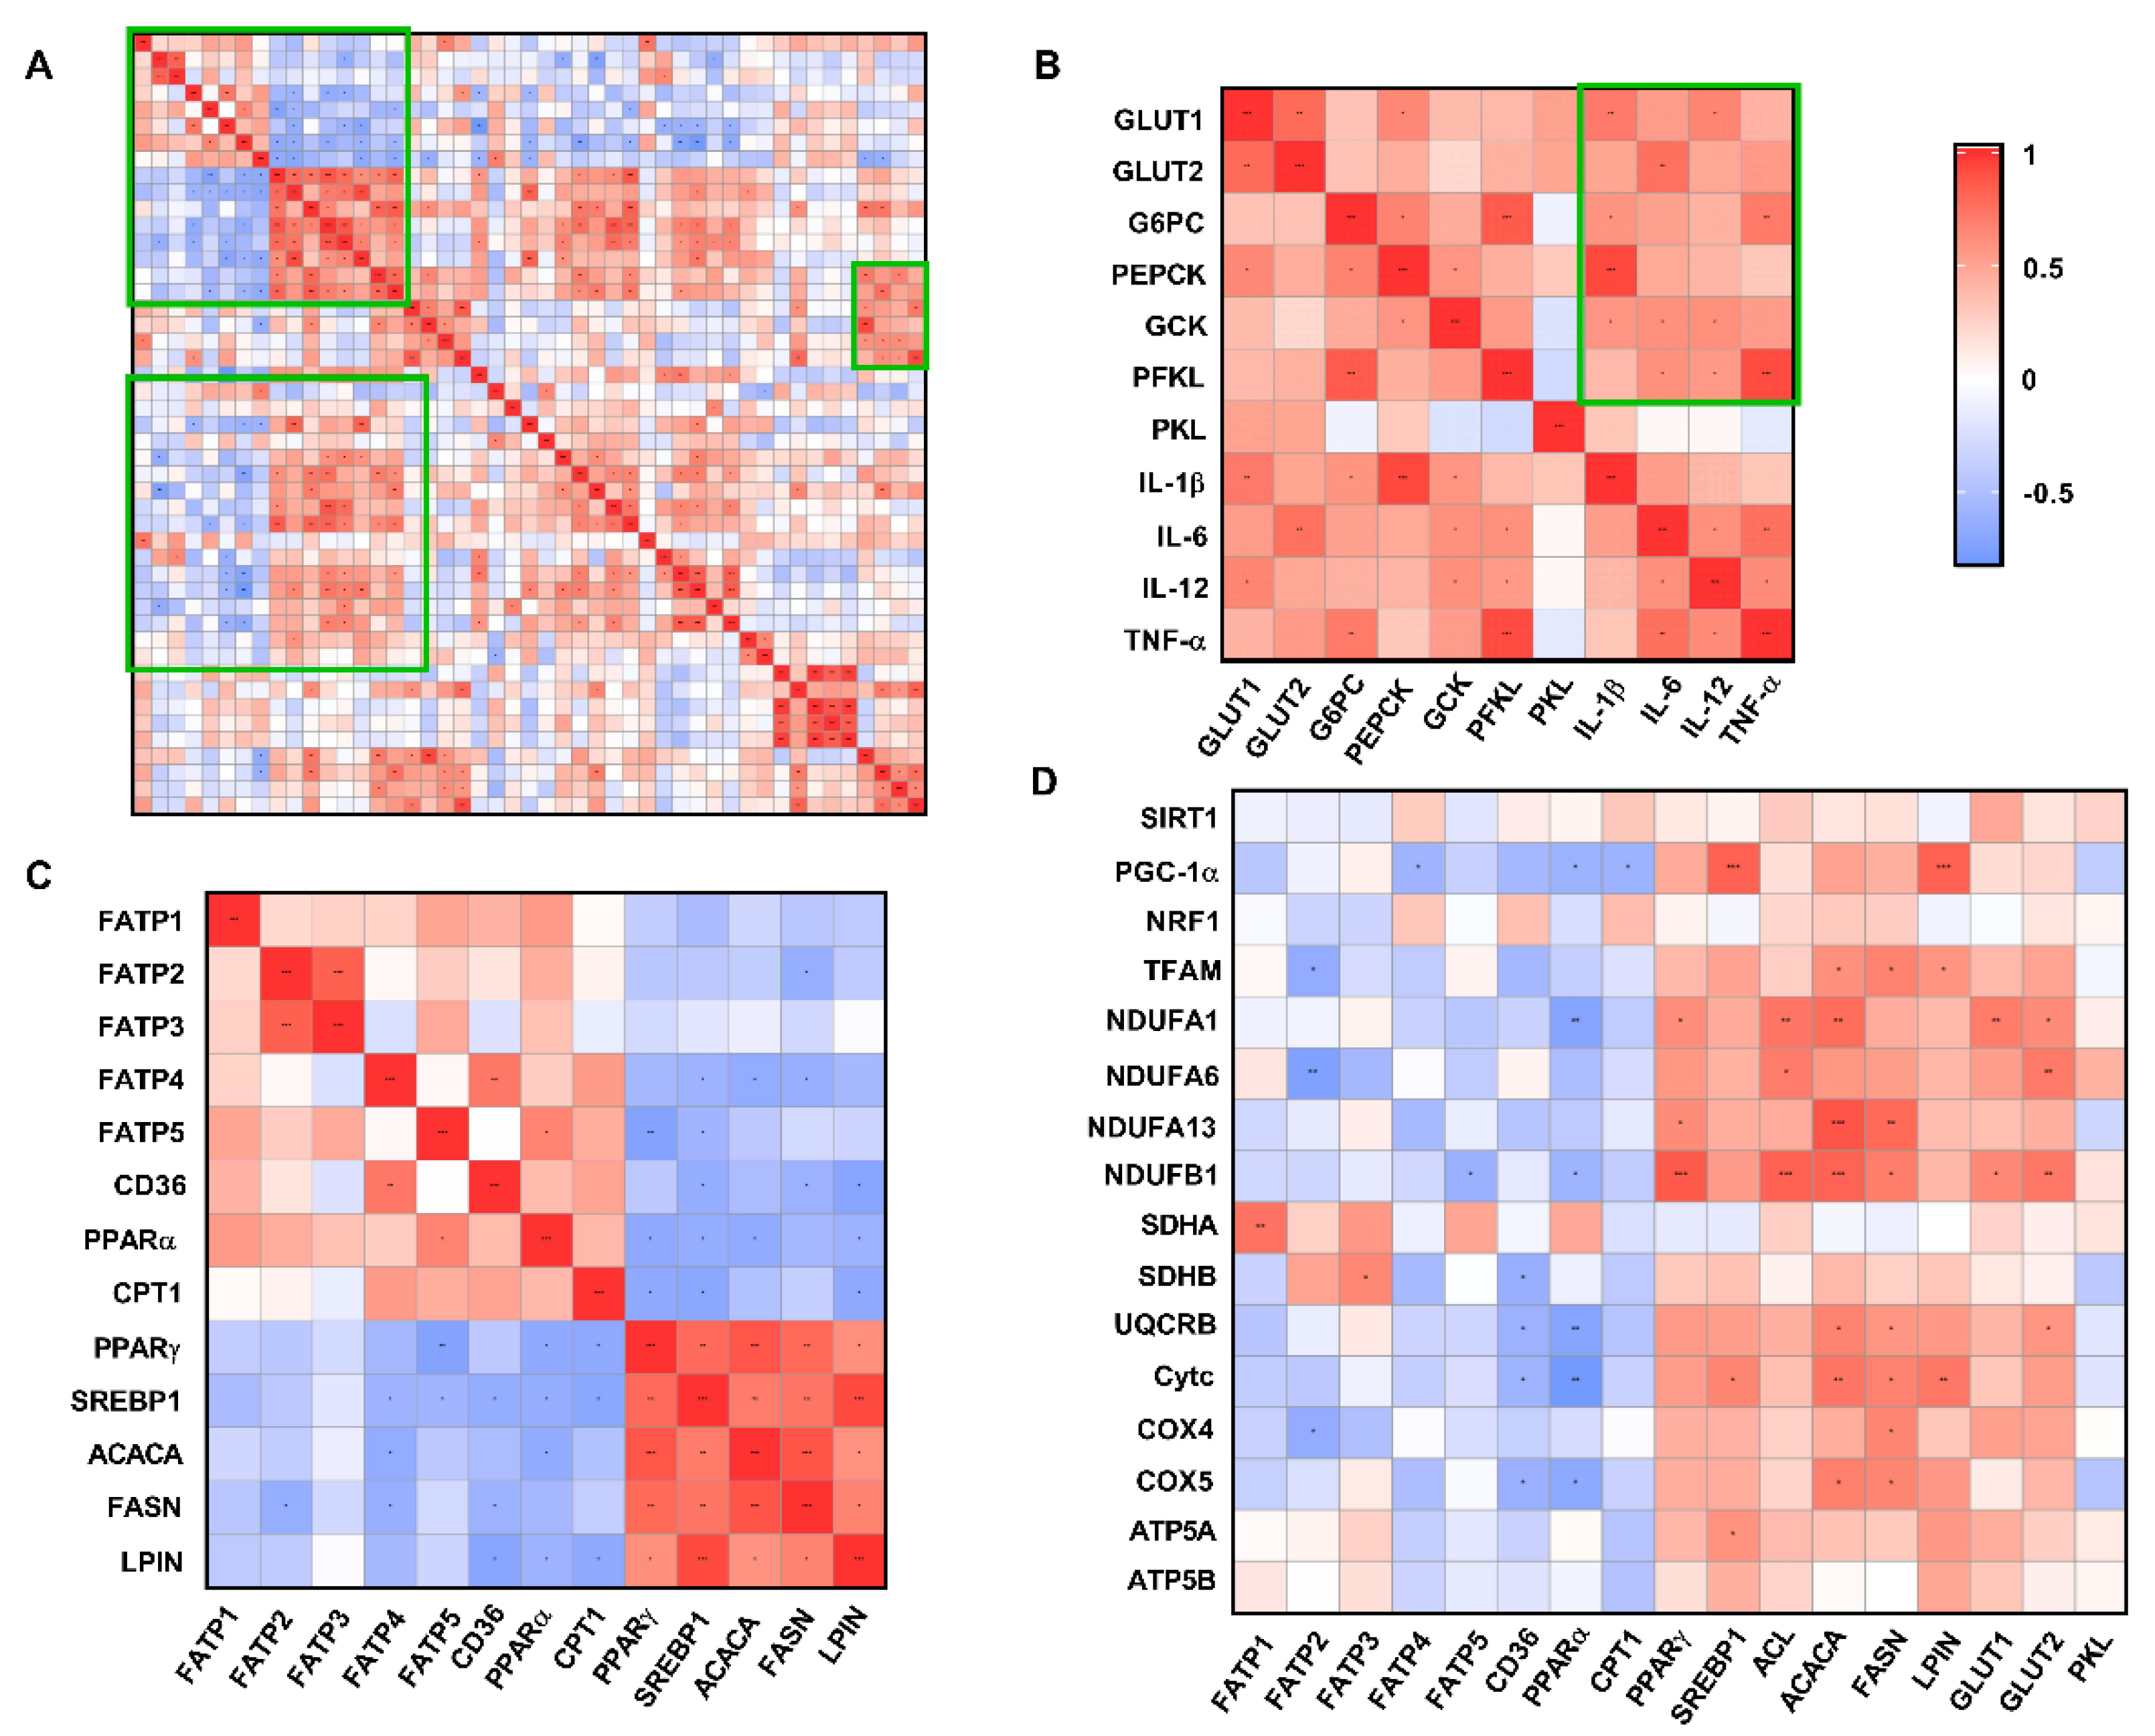
3.8. Correlation Analysis of Liver Metabolism-Related Indexes

Fatty acid transport-related genes (FATP2/FATP4/FATP5/CD36) and fatty acid oxidation-related genes (PPAR-α/ CPT1) were significantly negatively correlated with fatty acid de novo synthesis-related genes (PPAR-γ/SREBP1/ACACA/FASN/LPIN) (R > 0.5, p < 0.05) (Figure 9C). However, hepatic glucose transport (GLUT1/GLUT2), gluconeogenesis and glycolysis-related genes (G6PC/PEPCK/GCK/PFKL/PKL) were associated with pro-inflammatory factor (IL-1β/IL-6/IL-12/TNF-α) expression with a significantly positively correlation (R > 0.5, p < 0.05) (Figure 9B). In addition, the gene expression levels of PGC-1α-, TFAM-, and ETC-related proteins were significantly negatively correlated with those genes related to fatty acid transport and fatty acid oxidation, while genes related to fatty acid de novo synthesis and glucose transport showed a significantly positive correlation (Figure 9D).

4. Discussion

Postnatal catch-up weight gain in IUGR individuals is primarily due to greater lipid accumulation in organs and tissues rather than muscle gain [18]. It has been demonstrated that IUGR with a CUG pattern is highly associated with an increased risk of nonalcoholic fatty liver disease (NAFLD), obesity, and metabolic syndrome in adulthood [10,19]. In the current study, we also observed a significant accumulation of lipid droplets in the liver of the CUG group, which is consistent with previous results. Generally, hepatic lipid deposition is the result of fatty acid influx over efflux under the condition of disordered lipid metabolism [20]. The results of our current study showed that the expression of several key genes related to fatty acids transporters including fatty acid transport protein (FATP2, FATP5) and fatty acid translocase (CD36) was higher in the liver of the CUG group than in those of the Normal and NCUG groups, which indicated more fatty acid uptake from circulation for potential triglyceride (TG) synthesis or oxidation. However, we interestingly found that the genes related to TG de novo syntheses such as peroxisome proliferator-activated receptor gamma (PPAR-γ), acetyl-CoA carboxylase alpha (ACACA) and fatty acid synthase (FASN) decreased in CUG compared with NCUG and Normal group. Evidence from rodent stable isotope analysis studies showed that the amount of esterified fatty acids in the liver is 2 times greater than the de novo synthesis of fatty acids [21]. Similar results were found in a human study that circulating uptake accounted for 45.1% to 74.3% of hepatic triacylglycerol (TAG) sources, while only 12.7% to 37.0% of fatty acids were de novo synthesized, suggesting that exogenous lipid uptake is the main source of hepatic lipid deposition [22]. Therefore, we propose that the increased lipid deposition in the liver of CUG piglets is mainly due to increased hepatic fatty acid uptake rather than increased lipid de novo synthesis. It has been well demonstrated that peroxisome proliferator-activated receptor alpha (PPAR-α) could be activated by elevated lipid accumulation in the liver, and then in turn induce the expression of genes involved in fatty acids oxidative pathway to eliminate excess hepatic lipid store [23]. Compensatory enhancement of fatty acid oxidation was observed in the early stage of NALFD formation to maintain hepatic lipid homeostasis in a previous investigation [20]. Consistently, we also found in the present study that the fatty acid oxidation-regulated nuclear receptor PPAR-α and fatty acid β oxidation key enzyme (CPT1) were upregulated in CUG compared with NCUG, implying that adaptive increased fatty acid oxidation was not sufficient to reverse hepatic lipid deposition.
Data from several studies suggest that IUGR fetuses have lower glucose concentration levels than Normal piglets [24,25]. It is worth noting that the liver, as an insulin-responsive organ, exhibited an adaptive promoted glucose storage capacity with elevated insulin action, glucose production, and uptake, while reduced glycogen synthesis to maintain glucose homeostasis under the hypoglycemic–hypoinsulinemic IUGR environment during pregnancy [24]. Interestingly, many recent studies have shown that when CUG occurs, IUGR offspring exhibit decreased glucose tolerance [26]. In the present experiment, hepatic glucose uptake key proteins (GLUT1, GLUT2) were upregulated in NCUG compared to Normal, and relatively, hepatic glucose transport proteins (GLUT1, GLUT2, GLUT4) expression was downregulated in CUG compared to NCUG, which may be one of the reasons for the reduced glucose tolerance in CUG-IUGR offspring. In addition, several studies have shown that IUGR has early activation of hepatic gluconeogenesis to adapt to the intrauterine hypoglycemic environment [27] and resistance to insulin’s normal suppression of hepatic gluconeogenesis [28]. Similar results have been observed in a pig model, where IUGR consistently increases the pig’s hepatic gluconeogenic key enzymes (PEPCK and G6PC) expression and activities at 49 and 105 days [29,30]. Another study found that dietary restriction further increased the expression of hepatic PEPCK in adult IUGR pigs, and suggested that these alterations may exacerbate glucose intolerance in adult offspring exposed to intrauterine undernutrition [31]. Consistent with these results, we found that PEPCK and G6PC expression were enhanced in IUGR piglets, and PEPCK expression was further upregulated in NCUG compared to CUG, suggesting that NCUG has stronger gluconeogenesis. Several studies have shown that CUG-IUGR offspring manifested elevated fasting blood glucose levels [32]. In addition, combined with the results of our other experiments, we found elevated glucose transporter in the intestine of CUG, which may indicate that early nutritional correction attenuates abnormal gluconeogenesis in CUG (unpublished results). In summary, glucose uptake, glycolysis, and gluconeogenesis were more significantly enhanced in NCUG. Brown et al. reported that this may create a potential futile cycle in glucose metabolism in the IUGR offspring liver [33], which may be associated with retarded growth of NCUG.
Mitochondria acting as a metabolic hub and energy-producing factory are involved in a variety of vital cellular activities [34]. Mitochondrial energy production is mainly accomplished by the electron transport chain (ETC) complexes (CI, CII, CII, CIV, CV) located on the mitochondrial inner membrane [34]. Evidence is mounting that poor intrauterine nutrition causes long-lasting adverse effects in hepatic mitochondria biogenesis and function that may contribute to postnatal development [12]. IUGR has been reported to be associated with compromised mitochondrial function showing less ATP content, reduced complex activity, and downregulated expression of genes related to mitochondrial biogenesis and energy metabolism [35]. Previous research interestingly reported that CUG-IUGR rats induced by nutritional treatment lead to further deterioration of mitochondrial dysfunction with higher oxidative injury and decreased complex II and mitochondrial transcription factor A (TFAM) [36]. In another similar study, decreased peroxisome proliferator-activated receptor-γ coactivator 1α (PGC-1α) mRNA expression and mtDNA/nDNA ratio were observed in the liver of CUG-IUGR rats, suggesting reduced mitochondrial content and impaired mitochondrial function [37]. In the current study, we consistently found that the mRNA levels of ETC complex subunits and TFAM were significantly reduced in CUG pigs, while there was no difference between NCUG pigs and Normal pigs. Serine/threonine kinase adenosine monophosphate-activated protein kinase (AMPK) is a low ATP sensor that restores intracellular ATP homeostasis [38]. In addition, an increasing piece of evidence points to inhibition of the mitochondrial ETC complex to induce AMPK activation [39]. We also observed that the activation of the AMPK signaling pathway was significantly upregulated in the CUG-IUGR piglet’s liver compared with the other two groups in the current study, further confirming the mitochondria impairment.
IUGR offspring are characterized by systemic redox imbalance and impaired antioxidant capacity, leading to apparent oxidative stress and tissue damage [40,41], especially in the liver due to its extensive energy metabolism [41,42]. Several researchers have observed decreased T-AOC and SOD activity and increased MDA (a marker of lipid peroxidation) [43] concentration in the liver of IUGR piglets compared to normal piglets [41]. Interestingly, we found that NCUG-IUGR had elevated concentrations of MDA and decreased T-AOC and GPX enzyme activities compared with Normal and CUG piglets indicating higher oxidative stress and reduced antioxidant capacity in the present study. Meanwhile, no significant difference was observed between the Normal and CUG-IUGR groups, implying a restored redox balance in the CUG liver. The Nrf2 system has been described as a critical defense mechanism for animals against oxidative stress [44]. Under oxidative stress with cellular excess ROS accumulation, the interaction between Nrf2 and Keap1 is disrupted and then release-activated Nrf2 translocation into the nucleus to bind with ARE sequence, consequently resulting in numbers of antioxidative gene expression to counteract the adverse redox imbalance [45,46]. In the present investigation, we also found that the transcript levels of Nrf2 and its downstream target genes including SOD1 and GPX4 were greatly elevated in NCUG piglet livers which were consistent with their higher oxidative stress.
Additionally, there is considerable evidence demonstrating that oxidative stress is involved in chronic inflammation [47] by activating survival signaling pathways such as the Nuclear factor kappa-B (NF-κB) [48,49] and mitogen-activated protein kinase (MAPK) [50] signaling pathways, which in turn promote the transcription of TNF-α, IL-1β, IL-6 and IL-12 thereby promoting the development of inflammation [51]. A growing number of studies show that IUGR leads to a high risk of fetal liver inflammation [52,53]. Research has demonstrated that the concentration and expression of pro-inflammatory cytokines IL-1β, IL-6, and TNF-α in the liver and serum were enhanced in IUGR piglets [35,54]. The results of the present study showed that gene expression of TNF-α, IL-1β, and IL-6 in the liver of NCUG piglets was significantly higher than in Normal piglets, and the NCUG liver exhibited a more pronounced vacuolated structure, which might be attributed to the extensive oxidative stress and suggested that NCUG-IUGR piglets were prone to liver inflammatory injury. It is worth noting that the upregulated activation of the ERK signaling pathway was observed in the livers of both NCUG and CUG piglets, which was different from the result that oxidative indicators were only changed in NCUG, but the NF-κB signal showed further activated in NCUG groups compared to Normal. These results suggest that NF-κB pathways might play the dominant role in chronic inflammatory injury induced by oxidative stress in IUGR piglets, implying a potential intervention target for liver dysfunction caused by IUGR in the future. In addition, we found that abnormal liver glucose metabolism in IUGR piglets was significantly and positively correlated with pro-inflammatory factors in the correlation analysis of this experiment, suggesting that abnormal glucose metabolism in NCUG may be associated with an elevated inflammatory state in the liver (Figure 9B).
Although we found comprehensive alterations in CUG piglets’ livers, including lipid and glucose metabolism, oxidative stress, and inflammation response, as well as related regulatory signaling pathway from the present study, we still have no idea how these differences happen and what the underlying mechanisms for these differences are, which is of importance for understanding the occurrence of CUG before weaning. Additionally, it is worth further exploring liver alteration after weaning to clarify the long-term impact of different growth patterns on liver metabolism and function in the future.

5. Conclusions

The present study is the first to establish naturally occurring CUG and NCUG-IUGR piglet models before weaning to investigate the hepatic alteration with different growth patterns. Obviously, hepatic metabolism, mitochondrial function, oxidative status, and the inflammatory response showed comprehensive differences. The liver of NCUG-IUGR piglets exhibited elevated glucose uptake and gluconeogenesis, increased expression of pro-inflammatory factors, and lower antioxidant capacity. In contrast, hepatic mitochondrial function was impaired and fatty acid uptake was enhanced resulting in excess fat accumulation in CUG-IUGR piglets. These results shed light on and deepen our understanding of the occurrence of CUG in IUGR piglets before weaning. Therefore, targeted nutritional intervention strategies should consider the trade-off between postpartum catch-up growth and negative metabolic effects in IUGR piglets to provide a theoretical basis for alleviating the high morbidity and mortality and permanent retardation of growth in IUGR piglets prior to weanling.

Author Contributions

Conceptualization, F.C.; methodology, F.C.; formal analysis, J.W.; data curation, J.W.; writing—original draft preparation, J.W.; writing—review and editing, P.Z., X.Z. (Xiaoyu Zhengand), Z.M., C.C., C.W., X.Z. (Xiangfang Zeng) and W.G. All authors critically reviewed the manuscript for intellectual content and gave final approval for the version to be published. All authors have read and agreed to the published version of the manuscript.

Funding

This study was supported by the National Natural Science Foundation of China (32272894) and the Natural Science Foundation of Guangdong Province (2021A1515010944).

Institutional Review Board Statement

All animal procedures were carried out by the Guidelines for Care and Use of Laboratory Animals of South China Agricultural University and approved by the Animal Ethics Committee of South China Agricultural University (No. 20110107-1, Guangzhou, China).

Informed Consent Statement

Not applicable.

Data Availability Statement

The data presented in this study are available in the article.

Conflicts of Interest

The authors declare that they have no known competing financial interests or personal relationships that could have appeared to influence the work reported in this paper.

Abbreviations

IUGR: Intrauterine growth restriction; CUG: Catch-up growth; NCUG: Non-catch-up growth; ACACA: Acetyl-CoA carboxylase alpha; ACL: ATP citrate lyase; AMPK: Adenosine monophosphate activated protein kinase; ANOVA: One-way analysis of variance; ATP: Adenosine triphosphate; ATP5A: ATP synthase alpha subunit; ATP5B: ATP synthase beta polypeptide; CD36: Fatty acid translocase/CD36; COX IV: Cytochrome c oxidase IV; COX V: Cytochrome c oxidase V; CPT-1: Carnitine palmityl transferase 1; CytC: Cytochrome C; ERK: Extracellular-signal-regulated kinase; FASN: Fatty acid synthase; G6PC: Glucose-6-phosphatase catalytic; GLUT: Glucose transporter; GSH-PX: Glutathione peroxidase; GSH: Glutathione; GYS-2: Glycogen synthase 2; HO1: Heme oxygenase 1; IL-1β: Interleukin-1β; IL-6: Interleukin-6; JNK: c-Jun N-terminal kinases; Keap1: Kelch like ECH associated protein 1; LPIN1: Lipin 1; LXR: Liver X Receptor; MAPK: Mitogen activated protein kinase; mt DNA: Mitochondrial DNA; NF-κB: Nuclear factor-kappa B; NRF1: Nuclear respiratory factor 1; Nrf2: Nuclear factor erythroid-derived 2-like 2; NDUFA1: NADH dehydrogenase (ubiquinone) 1 alpha subcomplex 1; NDUFA6: NADH dehydrogenase (ubiquinone) 1 alpha subcomplex 6; NDUFA13: NADH dehydrogenase (ubiquinone) 1 alpha subcomplex 13; NDUFB1: NADH dehydrogenase (ubiquinone) 1 beta subcomplex 1; p38: p38 MAP Kinase; PEPCK: Phosphoenolpyruvate carboxykinase; PFKL: phosphofructokinase; PGC-1α: Peroxisome proliferator-activated receptor-γ coactlvator-1α; PKL: pyruvate kinase liver; PPAR-α/γ: Peroxisome proliferator-activated receptor alpha/gamma; SIRT-1: Sirtuin1; SREBP: Sterol regulatory element binding transcription factor; SDHA: succinate dehydrogenase complex flavoprotein subunit A; SDHB: succinate dehydrogenase complex iron sulfur subunit B; SOD: Superoxide dismutase; T-AOC: Total antioxidant capacity; TNF-α: Tumor necrosis factor; TFAM: Mitochondrial transcription factor A; UQCRB: Ubiquinol-Cytochrome c reductase binding protein.

References

  1. Wu, G.; Bazer, F.W.; Wallace, J.M.; Spencer, T.E. Board-invited review: Intrauterine growth retardation: Implications for the animal sciences. J. Anim. Sci. 2006, 84, 2316–2337. [Google Scholar] [CrossRef] [PubMed]
  2. Soo, J.Y.; Wiese, M.D.; Berry, M.J.; McMillen, I.C.; Morrison, J.L. Intrauterine growth restriction may reduce hepatic drug metabolism in the early neonatal period. Pharmacol. Res. 2018, 134, 68–78. [Google Scholar] [CrossRef] [PubMed]
  3. Poore, K.R.; Fowden, A.L. The effects of birth weight and postnatal growth patterns on fat depth and plasma leptin concentrations in juvenile and adult pigs. J. Physiol. 2004, 558, 295–304. [Google Scholar] [CrossRef] [PubMed]
  4. Boersma, B.; Wit, J.M. Catch-up growth. Endocr. Rev. 1997, 18, 646–661. [Google Scholar] [CrossRef] [PubMed]
  5. Jain, V.; Singhal, A. Catch up growth in low birth weight infants: Striking a healthy balance. Rev. Endocr. Metab. Disord. 2012, 13, 141–147. [Google Scholar] [CrossRef] [PubMed]
  6. Posont, R.; Yates, D.T. Postnatal Nutrient Repartitioning due to Adaptive Developmental Programming. Veter-Clin. N. Am. Food Anim. Pr. 2019, 35, 277–288. [Google Scholar] [CrossRef]
  7. Cianfarani, S.; Agostoni, C.; Bedogni, G.; Canani, R.B.; Brambilla, P.; Nobili, V.; Pietrobelli, A. Effect of intrauterine growth retardation on liver and long-term metabolic risk. Int. J. Obes. 2012, 36, 1270–1277. [Google Scholar] [CrossRef] [Green Version]
  8. Bechmann, L.P.; Hannivoort, R.A.; Gerken, G.; Hotamisligil, G.S.; Trauner, M.; Canbay, A. The interaction of hepatic lipid and glucose metabolism in liver diseases. J. Hepatol. 2012, 56, 952–964. [Google Scholar] [CrossRef] [Green Version]
  9. A Gruppuso, P.; A Sanders, J. Regulation of liver development: Implications for liver biology across the lifespan. J. Mol. Endocrinol. 2016, 56, R115–R125. [Google Scholar] [CrossRef] [Green Version]
  10. Morrison, J.L.; Duffield, J.A.; Muhlhausler, B.; Gentili, S.; McMillen, I.C. Fetal growth restriction, catch-up growth and the early origins of insulin resistance and visceral obesity. Pediatr. Nephrol. 2010, 25, 669–677. [Google Scholar] [CrossRef]
  11. Hales, C.N.; Barker, D.J. Type 2 (non-insulin-dependent) diabetes mellitus: The thrifty phenotype hypothesis. Diabetologia 1992, 35, 595–601. [Google Scholar] [CrossRef]
  12. Pendleton, A.L.; Wesolowski, S.R.; Regnault, T.R.H.; Lynch, R.M.; Limesand, S.W. Dimming the powerhouse: Mitochondrial dysfunction in the liver and skeletal muscle of intrauterine growth restricted fetuses. Front. Endocrinol. 2021, 12, 612888. [Google Scholar] [CrossRef]
  13. Shen, L.; Gan, M.; Zhang, S.; Ma, J.; Tang, G.; Jiang, Y.; Li, M.; Wang, J.; Li, X.; Che, L.; et al. Transcriptome analyses reveal adult metabolic syndrome with intrauterine growth restriction in pig models. Front. Genet. 2018, 9, 291. [Google Scholar] [CrossRef] [Green Version]
  14. Fernandez-Twinn, D.; Ozanne, S. Mechanisms by which poor early growth programs type-2 diabetes, obesity and the metabolic syndrome. Physiol. Behav. 2006, 88, 234–243. [Google Scholar] [CrossRef]
  15. Zhang, H.; Li, Y.; Su, W.; Ying, Z.; Zhou, L.; Zhang, L.; Wang, T. Resveratrol attenuates mitochondrial dysfunction in the liver of intrauterine growth retarded suckling piglets by improving mitochondrial biogenesis and redox status. Mol. Nutr. Food Res. 2017, 61, 1600653. [Google Scholar] [CrossRef]
  16. Saget, S.; Cong, R.; Decourtye, L.; Endale, M.-L.; Martinerie, L.; Girardet, C.; Perret, C.; Clemessy, M.; Leneuve, P.; Dinard, L.; et al. Changes in circulating miRNA19a-3p precede insulin resistance programmed by intra-uterine growth retardation in mice. Mol. Metab. 2020, 42, 101083. [Google Scholar] [CrossRef]
  17. Cui, C.; Wu, C.; Wang, J.; Ma, Z.; Zheng, X.; Zhu, P.; Wang, N.; Zhu, Y.; Guan, W.; Chen, F. Restored intestinal integrity, nutrients transporters, energy metabolism, antioxidative capacity and decreased harmful microbiota were associated with IUGR piglet’s catch-up growth before weanling. J. Anim. Sci. Biotechnol. 2022, 13, 129. [Google Scholar] [CrossRef]
  18. Ju, L.; Tong, W.; Qiu, M.; Shen, W.; Sun, J.; Zheng, S.; Chen, Y.; Liu, W.; Tian, J. Antioxidant MMCC ameliorates catch-up growth related metabolic dysfunction. Oncotarget 2017, 8, 99931–99939. [Google Scholar] [CrossRef] [Green Version]
  19. Kopec, G.; Shekhawat, P.S.; Mhanna, M.J. Prevalence of diabetes and obesity in association with prematurity and growth restriction. Diabetes Metab. Syndr. Obes. 2017, 10, 285–295. [Google Scholar] [CrossRef] [Green Version]
  20. Ipsen, D.H.; Lykkesfeldt, J.; Tveden-Nyborg, P. Molecular mechanisms of hepatic lipid accumulation in non-alcoholic fatty liver disease. Cell. Mol. Life Sci. 2018, 75, 3313–3327. [Google Scholar] [CrossRef]
  21. Duarte, J.A.G.; Carvalho, F.; Pearson, M.; Horton, J.D.; Browning, J.D.; Jones, J.G.; Burgess, S.C. A high-fat diet suppresses de novo lipogenesis and desaturation but not elongation and triglyceride synthesis in mice. J. Lipid Res. 2014, 55, 2541–2553. [Google Scholar] [CrossRef] [PubMed] [Green Version]
  22. Donnelly, K.L.; Smith, C.I.; Schwarzenberg, S.J.; Jessurun, J.; Boldt, M.D.; Parks, E.J. Sources of fatty acids stored in liver and secreted via lipoproteins in patients with nonalcoholic fatty liver disease. J. Clin. Investig. 2005, 115, 1343–1351. [Google Scholar] [CrossRef] [PubMed] [Green Version]
  23. Ten Hove, M.; Pater, L.; Storm, G.; Weiskirchen, S.; Weiskirchen, R.; Lammers, T.; Bansal, R. The hepatic lipidome: From basic science to clinical translation. Adv. Drug Deliv. Rev. 2020, 159, 180–197. [Google Scholar] [CrossRef] [PubMed]
  24. Limesand, S.W.; Rozance, P.J.; Smith, D.; Hay, W.W., Jr. Increased insulin sensitivity and maintenance of glucose utilization rates in fetal sheep with placental insufficiency and intrauterine growth restriction. Am. J. Physiol. Metab. 2007, 293, E1716–E1725. [Google Scholar] [CrossRef] [PubMed] [Green Version]
  25. Lynegaard, J.; Hansen, C.; Kristensen, A.; Amdi, C. Body composition and organ development of intra-uterine growth restricted pigs at weaning. Animal 2020, 14, 322–329. [Google Scholar] [CrossRef] [PubMed]
  26. Pericuesta, E.; Gutierrez-Arroyo, J.L.; Sanchez-Calabuig, M.J.; Gutierrez-Adan, A. Postnatal catch-up growth programs telomere dynamics and glucose intolerance in low birth weight mice. Int. J. Mol. Sci. 2021, 22, 3657. [Google Scholar] [CrossRef]
  27. Houin, S.S.; Rozance, P.J.; Brown, L.D.; Hay, W.W., Jr.; Wilkening, R.B.; Thorn, S.R. Coordinated changes in hepatic amino acid metabolism and endocrine signals support hepatic glucose production during fetal hypoglycemia. Am. J. Physiol. Endocrinol. Metab. 2015, 308, E306–E314. [Google Scholar] [CrossRef]
  28. Jones, A.K.; Brown, L.D.; Rozance, P.J.; Serkova, N.J.; Hay, W.W., Jr.; Friedman, J.E.; Wesolowski, S.R. Differential effects of intrauterine growth restriction and a hypersinsulinemic-isoglycemic clamp on metabolic pathways and insulin action in the fetal liver. Am. J. Physiol.-Regul. Integr. Comp. Physiol. 2019, 316, R427–R440. [Google Scholar] [CrossRef]
  29. Ying, Z.; Ge, X.; Zhang, H.; Su, W.; Li, Y.; Zhou, L.; Zhang, L.; Wang, T. Effects of dietary methionine restriction on postnatal growth, insulin sensitivity, and glucose metabolism in intrauterine growth retardation pigs at 49 and 105 d of age. J. Anim. Sci. 2018, 97, 610–619. [Google Scholar] [CrossRef]
  30. Rui, L. Energy metabolism in the liver. Compr. Physiol. 2014, 4, 177–197. [Google Scholar]
  31. Wang, J.; Cao, M.; Zhuo, Y.; Che, L.; Fang, Z.; Xu, S.; Lin, Y.; Feng, B.; Wu, D. Catch-up growth following food restriction exacerbates adulthood glucose intolerance in pigs exposed to intrauterine undernutrition. Nutrition 2016, 32, 1275–1284. [Google Scholar] [CrossRef]
  32. Duan, C.; Liu, M.; Xu, H.; Tang, W.; Liu, J.; Hou, L.; Li, L. Decreased expression of GLUT4 in male CG-IUGR rats may play a vital role in their increased susceptibility to diabetes mellitus in adulthood. Acta Biochim. et Biophys. Sin. 2016, 48, 872–882. [Google Scholar] [CrossRef] [Green Version]
  33. Brown, L.D.; Rozance, P.J.; Bruce, J.L.; Friedman, J.E.; Hay, W.W., Jr.; Wesolowski, S.R. Limited capacity for glucose oxidation in fetal sheep with intrauterine growth restriction. Am. J. Physiol.-Regul. Integr. Comp. Physiol. 2015, 309, R920–R928. [Google Scholar] [CrossRef] [Green Version]
  34. Guo, R.; Gu, J.; Zong, S.; Wu, M.; Yang, M. Structure and mechanism of mitochondrial electron transport chain. Biomed. J. 2018, 41, 9–20. [Google Scholar] [CrossRef]
  35. Cheng, K.; Jia, P.; Ji, S.; Song, Z.; Zhang, H.; Zhang, L.; Wang, T. Improvement of the hepatic lipid status in intrauterine growth retarded pigs by resveratrol is related to the inhibition of mitochondrial dysfunction, oxidative stress and inflammation. Food Funct. 2020, 12, 278–290. [Google Scholar] [CrossRef]
  36. Oke, S.L.; Sohi, G.; Hardy, D.B. Perinatal protein restriction with postnatal catch-up growth leads to elevated p66Shc and mitochondrial dysfunction in the adult rat liver. Reproduction 2020, 159, 27–39. [Google Scholar] [CrossRef] [Green Version]
  37. Xie, X.; Lin, T.; Zhang, M.; Liao, L.; Yuan, G.; Gao, H.; Ning, Q.; Luo, X. IUGR with infantile overnutrition programs an insulin-resistant phenotype through DNA methylation of peroxisome proliferator-activated receptor-gamma coactivator-1alpha in rats. Pediatr. Res. 2015, 77, 625–632. [Google Scholar] [CrossRef] [Green Version]
  38. Ruderman, N.B.; Xu, X.J.; Nelson, L.; Cacicedo, J.M.; Saha, A.K.; Lan, F.; Ido, Y. AMPK and SIRT1: A long-standing partnership? Am. J. Physiol.-Endocrinol. Metab. 2010, 298, E751–E760. [Google Scholar] [CrossRef]
  39. Wu, S.; Zou, M.H. AMPK, mitochondrial function, and cardiovascular disease. Int. J. Mol. Sci. 2020, 21, 4987. [Google Scholar] [CrossRef]
  40. Zi, Y.; Ma, C.; Li, H.; Shen, S.; Liu, Y.; Li, M.; Gao, F. Effects of intrauterine growth restriction during late pregnancy on the ovine fetal renal function and antioxidant capacity. Anim. Sci. J. 2021, 92, e13613. [Google Scholar] [CrossRef]
  41. Zhang, H.; Li, Y.; Wang, T. Antioxidant capacity and concentration of redox-active trace mineral in fully weaned intra-uterine growth retardation piglets. J. Anim. Sci. Biotechnol. 2015, 6, 48. [Google Scholar] [CrossRef] [PubMed]
  42. Che, L.; Xuan, Y.; Hu, L.; Liu, Y.; Xu, Q.; Fang, Z.; Lin, Y.; Xu, S.; Wu, D.; Zhang, K.; et al. Effect of Postnatal Nutrition Restriction on the Oxidative Status of Neonates with Intrauterine Growth Restriction in a Pig Model. Neonatology 2014, 107, 93–99. [Google Scholar] [CrossRef] [PubMed]
  43. Liu, J.; Yao, Y.; Yu, B.; Mao, X.; Huang, Z.; Chen, D. Effect of folic acid supplementation on hepatic antioxidant function and mitochondrial-related gene expression in weanling intrauterine growth retarded piglets. Livest. Sci. 2012, 146, 123–132. [Google Scholar] [CrossRef]
  44. Chen, Q.M.; Maltagliati, A.J. Nrf2 at the heart of oxidative stress and cardiac protection. Physiol. Genom. 2018, 50, 77–97. [Google Scholar] [CrossRef] [PubMed] [Green Version]
  45. Sajadimajd, S.; Khazaei, M. Oxidative Stress and Cancer: The role of Nrf2. Curr. Cancer Drug Target. 2018, 18, 538–557. [Google Scholar] [CrossRef] [PubMed]
  46. Yin, J.; Ren, W.; Liu, G.; Duan, J.; Yang, G.; Wu, L.; Li, T.; Yin, Y. Birth oxidative stress and the development of an antioxidant system in newborn piglets. Free Radic. Res. 2013, 47, 1027–1035. [Google Scholar] [CrossRef]
  47. Reuter, S.; Gupta, S.C.; Chaturvedi, M.M.; Aggarwal, B.B. Oxidative stress, inflammation, and cancer: How are they linked? Free Radic. Biol. Med. 2010, 49, 1603–1616. [Google Scholar] [CrossRef] [Green Version]
  48. Lawrence, T. The nuclear factor NF-kappaB pathway in inflammation. Cold Spring Harb. Perspect. Biol. 2009, 1, a001651. [Google Scholar] [CrossRef] [Green Version]
  49. Medzhitov, R. Origin and physiological roles of inflammation. Nature 2008, 454, 428–435. [Google Scholar] [CrossRef]
  50. Matulewicz, N.; Karczewska-Kupczewska, M. Insulin resistance and chronic inflammation. Postep. Hig. I Med. Dosw. (Online) 2016, 70, 1245–1258. [Google Scholar]
  51. Oeckinghaus, A.; Hayden, M.S.; Ghosh, S. Crosstalk in NF-kappaB signaling pathways. Nat. Immunol. 2011, 12, 695–708. [Google Scholar] [CrossRef]
  52. Liu, C.; Lin, G.; Wang, X.; Wang, T.; Wu, G.; Li, D.; Wang, J. Intrauterine growth restriction alters the hepatic proteome in fetal pigs. J. Nutr. Biochem. 2013, 24, 954–959. [Google Scholar] [CrossRef]
  53. Tarry-Adkins, J.L.; Fernandez-Twinn, D.S.; Hargreaves, I.P.; Neergheen, V.; E Aiken, C.; Martin-Gronert, M.S.; McConnell, J.M.; E Ozanne, S. Coenzyme Q10 prevents hepatic fibrosis, inflammation, and oxidative stress in a male rat model of poor maternal nutrition and accelerated postnatal growth. Am. J. Clin. Nutr. 2016, 103, 579–588. [Google Scholar] [CrossRef] [Green Version]
  54. Niu, Y.; He, J.; Zhao, Y.; Shen, M.; Zhang, L.; Zhong, X.; Wang, C.; Wang, T. Effect of Curcumin on Growth Performance, Inflammation, Insulin level, and Lipid Metabolism in Weaned Piglets with IUGR. Animals 2019, 9, 1098. [Google Scholar] [CrossRef]
Figure 1. Overview of the experimental design. Based on their birth weight, the piglets were classified into either the IUGR or Normal group. In addition, based on weaning weight, IUGR piglets were divided into the CUG group and NCUG group. CUG = catch-up growth; NCUG = non-catch-up growth; WW = weaning weight.
Metabolites 12 01053 g001
Figure 2. Growth performance and organ index of piglets. (A) Body weight, (B) body length, (C) body mass index, (D) mortality rate, and percentage of CUG before weanling. a, b, c Different letters indicated a significant difference (p < 0.05). CUG = catch-up growth; NCUG = non-catch-up growth; WW = weaning weight.
Metabolites 12 01053 g002
Figure 3. Histopathology with H&E staining of the liver section in different groups (Normal, CUG, NCUG). CUG = catch-up growth; NCUG = non-catch-up growth; WW = weaning weight.
Metabolites 12 01053 g003
Figure 4. Effects of CUG and NCUG growth patterns on liver lipid metabolism in piglets. (A) Piglet liver oil red O staining. (B) mRNA expression of liver fatty acid transport-related genes. (C) mRNA expression of nuclear receptor genes regulates hepatic lipid metabolism. (D) Protein levels of lipid synthesis-related proteins ACACA and FASN. (E) mRNA expression of genes related to hepatic lipid metabolism. All data with error bars are mean ± SEM. * p < 0.05, ** p < 0.01, *** p < 0.001. CUG = catch-up growth; NCUG = non-catch-up growth; WW = weaning weight.
Metabolites 12 01053 g004
Figure 5. Effects of CUG and NCUG patterns on hepatic glucose metabolism in piglets. (A) Protein levels of GLUT1 measured by Western blot analysis. (B) mRNA expression of hepatic GLUT1. (C) mRNA expression of hepatic GLUT2. (D) mRNA expression of hepatic GLUT4. (E) Liver glucose metabolism-related mRNA expression. All data with error bars are mean ± SEM. * p < 0.05, ** p < 0.01, *** p < 0.001. CUG = catch-up growth; NCUG = non-catch-up growth; WW = weaning weight.
Metabolites 12 01053 g005
Figure 6. Effects of CUG and NCUG patterns on liver mitochondrial function. (A,B) mRNA expression of subunits of the liver mitochondrial electron transport chain complex. (C) mRNA expression of genes regulates mitochondrial biogenesis. (D) Level of AMPK protein phosphorylation. All data with error bars are mean ± SEM. In histograms, * p < 0.05, ** p < 0.01. CUG = catch-up growth; NCUG = non-catch-up growth; WW = weaning weight.
Metabolites 12 01053 g006
Figure 7. Effects of CUG and NCUG growth patterns on the antioxidant status of the liver. (AE) Relative activities of T-AOC, GSH- PX, T-SOD, and relative concentrations of GSH and MDA in liver tissues. (F) mRNA expression of liver Nrf2 pathway. All data with error bars are mean ± SEM. In histograms, * p < 0.05, ** p < 0.0). CUG = catch-up growth; NCUG = non-catch-up growth; WW = weaning weight.
Metabolites 12 01053 g007
Figure 8. Effects of CUG and NCUG growth patterns on hepatic inflammatory factor expression and NF-κB/MAPK pathways. (A) Phosphorylation level of the NF-κB/MAPK pathway in liver tissue. (B) mRNA expression of liver NF-κB/MAPK pathway-related genes. (C) mRNA expression levels of pro-inflammatory factors in liver tissue. All data with error bars are mean ± SEM. In histograms, * p < 0.05, ** p < 0.01, *** p < 0.001. CUG = catch-up growth; NCUG = non-catch-up growth; WW = weaning weight.
Metabolites 12 01053 g008
Figure 9. Correlation analysis of liver metabolism-related genes and antioxidant indices (all groups). (A) Total correlation analysis of liver metabolism−related genes and antioxidant indices. (B) Correlation analysis of mRNA expression levels of glucose metabolism-related genes and pro−inflammatory factors. (C) Correlation analysis of mRNA expression levels of genes related to fatty acid experience transport, oxidation, and synthesis. (D) Correlation analysis of mRNA expression of glucose and lipid metabolism-related genes and the mRNA expression of mitochondrial function-related genes. * p < 0.05, ** p < 0.01, *** p < 0.001. CUG = catch−up growth; NCUG = non−catch−up growth; WW = weaning weight.
Metabolites 12 01053 g009
Table 1. Composition and nutrient levels of basal diets (%).
ItemContent
Late GestationLactation
Ingredients
High quality northeast corn47.9057.67
Barley30.0010.00
Bran5.00
Soybean meal (43%)12.1022.60
Soybeans 2.00
Fish meal1.001.50
Soybean oil 1.63
Limestone1.001.40
CaHPO41.201.20
Salt0.500.60
Lys0.150.20
DL-Met0.150.20
Premix 11.001.00
Total100100
Nutrient composition 2
DE, MJ/kg3150.003400.00
CP13.5017.50
EE2.504.80
CF3.242.82
Ash5.185.49
Ca0.951.00
TP0.600.62
AP0.350.45
TLys0.701.20
1 The premix provided the following per kg of diets: VA 10,000 IU, VD3 2100 IU, VE 45 IU, VK3 2.0 mg, thiamine 3.0 mg, riboflavin 5.0 mg, VB6 1.8 mg, VB12 0.03 mg, choline chloride 1000 mg, nicotinic acid 25.0 mg, pantothenic acid 15.0 mg, biotin 0.08 mg, folic acid 1.0 mg, Mn 20.0mg, Zn 80.0 mg, Fe 80 mg, Cu 6.0 mg, I 0.15 mg, Se 0.25 mg. 2 Nutrient levels are calculated values.
Table 2. Primer sequences used in real-time PCR.
Gene NameGene AccessionPrimer Sequences (5′ → 3′)Size, bp
FATP1NM_001083931.1F: GGCAACAGACGTGATCTATGAC125
R: AGCGGCTGGCTGAAAACT
FATP2JX092264.1F: TCTAACACGGATGGGGTCG107
R: AGGGCAGGAGTGGAAAAGT
FATP3XM_001929591.2F: AGGTCTCAGCCGAAGTGGAT206
R: TGGGAGGGCGAGGTAGAT
FATP4XM_003353676.1F: AGCCGCATCCTGTCCTTT213
R: GACATCCTTGGCGATCTTTT
FATP5AK233227.1F: GCGAGCAGACGGAAAAGAAG199
R: TGCAGGAAGTCCACGAGTGA
CD36DQ192230.1F: GGACTCATTGCTGGTGCTGT169
R: GTCTGTAAACTTCCGTGCCTGT
CPT-1NM_001129805F: GGTGGTGTCAGCGTAGCA391
R: CCTTGTTGTCAGTTTGGGTAA
PPAR-αDQ437887.1F: CAGCGTGGCACTGAACATC144
R: CTCCGATCACATTTGTCATAGAC
FASNNM_001099930.1F: GCTTGTCCTGGGAAGAGTGTA115
R: AGGAACTCGGACATAGCGG
ACACANM_001114269.1F: ACATCCCCACGCTAAACA186
R: AGCCCATCACTTCATCAAAG
ACLNM_001105302F: AGCGAGCAGCAGACCTATGAC143
R: GGCCACGTTGGTGAAGTTTG
LPIN1NM_001130734.1F: CACATTTTGCCCACCCTT164
R: GTGCCACGCTCGTTGACC
SREBP1NM_214157.1F: AGCGGACGGCTCACAATG121
R: CGCAAGACGGCGGATTTA
PPAR-γNM_214379.1F: AGCCCTTTGGTGACTT213
R: AGGACTCTGGGTGGTT
LXRAB254405.1F: TTCCGTCGCAGTGTCATC184
R: CTTGCCGCTTCAGTTTCTTCA
GLUT1NW_003610563.1F: GATGAAGGAGGAGTGCCG106
R: CAGCACCACGGCGATGAGGAT
GLUT2NM_001097417.1F: ATTCTTTGGTGGGATGCTTG118
R: ATGAGATGGTCCCAATTTCG
GLUT4NM_0011288433F: TATGTTGCGGATGCTATGGG396
R: CTCGGGTTTCAGGCACTTTT
G6PCNM_001113445F: GGAAATGAGCAGCAAGGT176
R: TCGGTGCCACTGATAAAG
PEPCKNM_001161753F: CACAAGGGCAAAGTGATTATGC238
R: GGAACCAGTTGACGTGGAAGA
GCKXM_013985832.2F: GTGGTGGCAATGGTGAATGAC184
R: TCGGCGGTCTTCATAGTAGCA
PFKLXM_021071510.1F: GAAACGAGAAGTGCCACGAA182
R: TACCGTAGTTCCGGTCGAAG
PKLXM_021089721.1F: AGACTGCCAAGGGTCACTTT117
R: CAGCTCCTCAAAGAGTTGCC
GYS2NM_001195511F: CATCACCACCAACGACGGA193
R: ACACGGCCCAGAGAAAAGG
NDUFA1XM_003135339.5F: GCTTCCGGGGAAGGAATCAA101
R: CCGGGGAGAATTTCGAACCA
NDUFA6NM_001185178.1F: TCTCAGAGCCTTGCATGTCG85
R: AAGCCATCCAGCATCGTACC
NDUFA13NM_001244646.1F: ATGAAGGATGTGCCGGACTG125
R: CCATAGGTGGCGCTGAGAAT
NDUFB1XM_003482306.4F: TGCCTTCCGGAACAAGAGTC88
R: GCAATTCAGCCACAGCCTTT
SDHAXM_021076930.1F: CAATAAGAGGTCGTCGGCCA127
R: AGAGAGACCAAACGCAGCTC
SDHBNM_001104953.1F: TCCTATGGTGTTGGATGCGT124
R: AGTGTTGCCTCCGTTGATGT
UQCRBNM001185172.1F: CATCAGGCAACGCTTCTGTC81
R: TATACCCTCCAGCCACTTGC
CytCNM_001129970.1F: CTGGGGAGAGGAGACACTGAT158
R: AGGCGGTGGCCAACTTTTAC
COX IVXM_021093705.1F: CCAAGTGGGACTACGACAAGAAC131
R: CCTGCTCGTTTATTAGCACTGG
COX VNM_001007517.1F: ATCTGGAGGTGGTGTTCCTACTG160
R: GTTGGTGATGGAGGGGACTAAA
ATP5A1NM_001185142.1F: ACGCCATTGATGGAAAGGGT98
R: TGGTTCCCGCACAGAGATTC
ATP5B1XM_001929410.5F: CATGTTGGGCTTTGTGGGTC139
R: ATAGTCTCTGGCAGGCTGGA
SIRT1NM_001145750.2F: TTGCAACAGCATCTTGCCTG91
R: GGACATCGAGGAACCACCTG
PGC-1αNM_213963.2F: GCTTGACGAGCGTCATTCAG100
R: GGTCTTCACCAACCAGAGCA
NRF1XM_021078993.1F: GAAGCTGTCCAGGGGCTTTA116
R: ATCCATGCTCTGCTACTGGG
TFAMNM_001130211.1F: AGCGAGGTCTGAAGAGTTGC114
R: TTGCACCCGTAGACAAAGCA
POLGXM_001927064.5F: CTGTCAGATGAGGGCGAGTG133
R: ACTTCTTCCGTCGTGACTTTCT
Nrf2XM_013984303.2F: ATCCAGCGGATTGCTCGTAG155
R: TCAAATCCATGTCCTTGGCG
Keap1NM_001114671.1F: TCTGCTTAGTCATGGTGACCT158
R: GGGGTTCCAGATGACAAGGG
HO-1NM_001004027.1F: TGATGGCGTCCTTGTACCAC71
R: GACCGGGTTCTCCTTGTTGT
SOD1NM_214127.2F: CAAGAAGGGGCACCACGTT70
R: CTCAGGGGACGCAAGAACTG
GPX1NM_214201.1F: CCTCAAGTACGTCCGACCAG85
R: GTGAGCATTTGCGCCATTCA
GPX4NM_214407.1F: TGTGTGAATGGGGACGATGC135
R: CTTCACCACACAGCCGTTCT
GRAY368271.1F: GTGAGCCGACTGAACACCAT141
R: CAGGATGTGAGGAGCTGTGT
TNF-αNM_214022.1F: GCCCTTCCACCAACGTTTTC97
R: CAAGGGCTCTTGATGGCAGA
IL-1βNM_214055.1F: ATTCAGGGACCCTACCCTCTC92
R: ATCACTTCCTTGGCGGGTTC
IL-6NM_214399.1F: ACAAAGCCACCACCCCTAAC185
R: CGTGGACGGCATCAATCTCA
IL-12NC_010458.4F: CAACCCTGTGCCTTAGCAGT113
R: AGAGCCTGCATCAGCTCAGT
NF-κBNM_001114281.1F: GGGGCGATGAGATCTTCCTG110
R: CACGTCGGCTTGTGAAAAGG
ERKXM_021088019.1F: CAGTCTCTGCCCTCCAAGAC139
R: GGGTAGATCATCCAGCTCCA
JNKXM_001929166.6F: TGGATGAAAGGGAACACACA104
R: ATGATGACGATGGATGCTGA
P38XM_021091323.1F: AAGACGGGGTCCTCATCTCC230
R: TCTCATCGTAGGGCTCTGCT
Table 3. Growth performance of piglet.
ItemNormalCUGNCUGSEMp-Value
BW, kg1.388 a ± 0.0101.059 b ± 0.0351.045 b ± 0.0370.0203<0.001
WW, kg7.530 a ± 0.5267.457 a ± 0.3685.592 b ± 0.9120.1367<0.001
ADG, kg0.236 a ± 0.0170.246 a ± 0.0140.175 b ± 0.0350.0048<0.001
Note: CUG = catch-up growth; NCUG = non-catch-up growth; WW = weaning weight. All data shown as means ± SD, values with different small letter superscripts differ (p < 0.001).
Table 4. Weekly average daily gain of piglets.
ADG Per Week, kgNormalCUGNCUGSEMp-Value
1 d–7 d0.168 a ± 0.0190.163 a ± 0.0260.126 b ± 0.0420.004<0.001
7 d–14 d0.204 a ± 0.0640.241 a ± 0.0460.161 b ± 0.0690.007<0.001
14 d–21 d0.228 b ± 0.0170.264 a ± 0.0440.198 c ± 0.0450.005<0.001
21 d–26 d0.343 a ± 0.0310.346 a ± 0.0350.231 b ± 0.0770.009<0.001
Note: CUG = catch-up growth; NCUG = non-catch-up growth; WW = weaning weight. All data are shown as means ± SD, values with different small letter superscripts differ (p < 0.001).
Table 5. Organ weight of piglets.
Organ Weight, kgNormalCUGNCUGSEMp-Value
Heart0.093 a ± 0.0110.097 a ± 0.0060.057 b ± 0.0060.0070.02
Liver0.447 a ± 0.0250.397 b ± 0.0300.280 c ± 0.0170.020<0.001
Kidney0.090 a ± 0.0100.087 a ± 0.0060.067 b ± 0.0060.0060.017
Spleen0.047 a ± 0.0470.033 ab ± 0.0330.020 b ± 0.0200.0080.037
Lung0.220 a ± 0.0460.180 a ± 0.0100.120 b0.0220.011
Pancreas0.0100.013 ± 0.0060.013 ± 0.0060.0040.63
Note: CUG = catch-up growth; NCUG = non-catch-up growth; WW = weaning weight. All data are shown as means ± SD, and values with different small letter superscripts differ (p < 0.05).
Table 6. Organ index of piglets.
Organ Index, %NormalCUGNCUGSEMp-Value
Heart1.15 ± 0.171.19 ± 0.0501.18 ± 0.1500.1100.932
Liver5.49 ab ± 0.4364.86 b ± 0.3035.83 a ± 0.2120.2700.031
Kidney1.10 a ± 0.0961.07 b ± 0.0841.39 a ± 0.1590.0960.028
Spleen0.58 ± 0.2000.41 ± 0.0660.42 ± 0.0130.0100.245
Lung2.71 ± 0.6102.21 ± 0.1672.50 ± 0.0810.3000.322
Pancreas0.12 ± 0.0030.16 ± 0.0690.28 ± 0.1200.0650.123
Note: CUG = catch-up growth; NCUG = non-catch-up growth; WW = weaning weight. All data are shown as means ± SD, and values with different small letter superscripts differ (p < 0.05).
Publisher’s Note: MDPI stays neutral with regard to jurisdictional claims in published maps and institutional affiliations.

