Article

Metabolome-Wide Associations of Gestational Weight Gain in Pregnant Women with Overweight and Obesity

1
Department of Epidemiology, Fielding School of Public Health, University of California, Los Angeles, CA 90095, USA
2
Department of Epidemiology and Biostatistics, Arnold School of Public Health, University of South Carolina, Columbia, SC 29208, USA
3
Department of Exercise Science, Arnold School of Public Health, University of South Carolina, Columbia, SC 29208, USA
4
School of Computing, Clemson University, Clemson, SC 29634, USA
5
Department of Mathematical and Statistical Sciences, Clemson University, Clemson, SC 29634, USA
6
Department of Environmental Health Sciences, Fielding School of Public Health, University of California, Los Angeles, CA 90095, USA
7
School of Nursing, University of California, Los Angeles, CA 90095, USA
8
West Coast Metabolomics Center, University of California, Davis, CA 95616, USA
*
Authors to whom correspondence should be addressed.
Metabolites 2022, 12(10), 960; https://doi.org/10.3390/metabo12100960
Submission received: 3 September 2022 / Revised: 24 September 2022 / Accepted: 5 October 2022 / Published: 11 October 2022
(This article belongs to the Special Issue Metabolic Profiles and Biomarkers in Pregnancy)

Abstract

:
Excessive gestational weight gain (GWG) is associated with adverse pregnancy outcomes. This metabolome-wide association study aimed to identify metabolomic markers for GWG. This longitudinal study included 39 Black and White pregnant women with a prepregnancy body mass index (BMI) of ≥ 25 kg/m2. Untargeted metabolomic profiling was performed using fasting plasma samples collected at baseline (mean: 12.1 weeks) and 32 weeks of gestation. The associations of metabolites at each time point and changes between the two time points with GWG were examined by linear and least absolute shrinkage and selection operator (LASSO) regression analyses. Pearson correlations between the identified metabolites and cardiometabolic biomarkers were examined. Of the 769 annotated metabolites, 88 metabolites at 32 weeks were individually associated with GWG, with four (phosphatidylcholine (PC) 34:4, triacylglycerol (TAG) 52:6, arachidonic acid, isoleucine) jointly associated with GWG (area under the receiver operating characteristic curve (AUC) for excessive GWG: 0.80, 95% CI: 0.67, 0.93). No correlations were observed between the 88 metabolites and insulin, C-peptide, and high-sensitivity C-reactive protein at 32 weeks. Twelve metabolites at baseline (AUC for excessive GWG: 0.80, 95% CI: 0.62, 0.99) and three metabolite changes (AUC for excessive GWG: 0.73, 95% CI: 0.44, 1.00) were jointly associated with GWG. We identified novel metabolites in the first and third trimesters associated with GWG, which may shed light on the pathophysiology of GWG.

Graphical Abstract

1. Introduction

Gestational weight gain (GWG), the weight gained during pregnancy, is critical for the health outcomes of mothers and their offspring both immediately and long-term. Excessive GWG is associated with gestational diabetes, gestational hypertensive disorder, postpartum weight retention, and future risk of obesity for mothers, and being large for their gestational age, childhood obesity, and glycemic dysfunction for offspring [1]. To achieve optimal health, the Institute of Medicine (IOM) has recommended GWG guidelines based on the maternal prepregnancy body mass index (BMI) [2]. Unfortunately, the most recent study using national representative samples showed that more than two-thirds of pregnant women in the United States (U.S.) failed to achieve the optimal GWG (i.e., 20.9% had inadequate GWG and 47.2% had excessive GWG) [3], indicating a significant public health problem. Although the prevalence of inadequate GWG has remained stable, the prevalence of excessive GWG has increased from 43% in 2000 to 46% in 2009 in the U.S. [4], likely driven by the current obesity epidemic, unhealthy dietary intake, and inadequate physical activity among women of reproductive ages [4,5,6].
Given the profound health consequences of GWG, there is an urgent need to identify molecular biomarkers and underpinnings of GWG. Pregnancy can result in a series of dynamic physiological changes, including alternations of the maternal hormonal profile, basal metabolic rate, energy storage, partition, and placental metabolism, which are likely related to GWG [7]. This complexity presents a challenge for investigating the molecular mechanisms between GWG and adverse pregnancy and birth outcomes using traditional approaches. With advances in omics technology, metabolome-wide association studies (MWASs) provide a systematic tool for the identification of novel metabolites and metabolic pathways related to health outcomes [8,9]. Such studies are extremely important for advancing our understanding of the underlying biological mechanisms that may explain the associations between GWG and health outcomes.
Recent MWASs have identified several metabolites/metabolic classes for weight gain in non-pregnant populations, with some metabolites being replicated across studies [10]. However, only one MWAS for GWG has been conducted among 37 Canadian women with the maternal metabolome measured at one time point between 25 and 28 weeks of gestation [11]. Given the unique and dynamic metabolic and physiological changes during pregnancy, the metabolome in pregnant women is distinct from non-pregnant women and is likely to change over the course of pregnancy [12,13]. To address the current research gaps, we performed an MWAS of GWG using untargeted plasma metabolomic profiling in a longitudinal study among pregnant women in which we modeled prospective, time-specific, and changes of metabolomic profiles during pregnancy in association with the total and excessive GWG. To gain a better understanding of the underlying pathways, we further examined the relationships of GWG-associated metabolites with three cardiometabolic biomarkers, including fasting plasma insulin, C-peptide, and high-sensitivity C-reactive protein (hs-CRP).

2. Materials and Methods
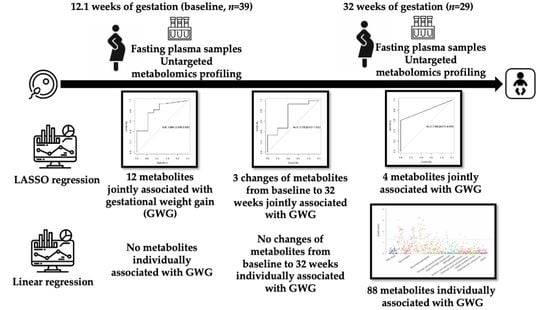
This study was ancillary to the Health in Pregnancy and Postpartum (HIPP) study, which was a randomized controlled trial conducted in South Carolina from 2015 to 2019 [14]. The original objective of the HIPP study was to investigate the efficacy of a behavioral lifestyle intervention on GWG. The study population included 219 pregnant women with prepregnancy overweight and obesity aged 18 to 44 years who self-identified as White or Black [14,15]. The ancillary study included 40 pregnant women from the HIPP study who agreed to provide their biospecimen for future research. All 40 women were recruited before 16 weeks of gestation (mean weeks at baseline = 12.1; standard deviation (SD) = 2.3). Participants included in the ancillary study and those not included had similar baseline demographics and lifestyles (Table S1). Among them, we excluded one woman without data on GWG, resulting in 39 women in the current analysis. All participants provided written informed consent. The current study was approved by the University of South Carolina Institutional Review Board.
The total GWG (in kg) was determined as the difference between the body weight at delivery on the medical chart and the self-reported prepregnancy weight at the screening visit. If the delivery room weight was unavailable, then the body weight at the last prenatal visit (average 4.8 days ahead of the delivery) was used to calculate the total GWG. A high correlation (r = 0.95) between the self-reported prepregnancy weight and the weight measured clinically was observed in our trial [15]. Excessive GWG was defined using the 2009 IOM criteria as a total GWG of over 11.5 kg for women with a prepregnancy BMI between 25 and 29.9 kg/m2 or a total GWG of over 9 kg for women with a prepregnancy BMI of 30 kg/m2 or above [2].
After the women consented to participate in the biospecimen ancillary study, trained staff collected fasting blood (EDTA tube) from the participants during their study visit at the Clinical Exercise Research Center (CERC). The samples were immediately processed and stored at −80 °C at the CERC until they were sent out for metabolomics analyses. All 39 women provided fasting blood samples in the first-trimester baseline visit (~12 weeks) and 29 of them also provided fasting blood samples in the third-trimester follow-up visit (~32 weeks). Thus, 39 fasting plasma samples were used for metabolomic profiling at 12 weeks, and 29 were used at 32 weeks. The fasting plasma concentrations of insulin, C-peptide, and hs-CRP at two time points (baseline and 32 weeks) were measured using the immunoturbidimetric and sandwich immunoassay methods, respectively, using the Roche COBAS 6000 chemistry analyzer (Roche Diagnostics, Indianapolis, IN, USA).
Untargeted metabolomic profiling of the fasting plasma samples at two time points (baseline and 32 weeks) was conducted by the West Coast Metabolomics Center, University of California Davis (UC-Davis) via combining three analytical platforms, including gas chromatography–time-of-flight mass spectrometry (GC-TOF MS, Leco, St. Joseph, MI, USA)), hydrophilic interaction chromatography–quadrupole time-of-flight tandem mass spectrometry (HILIC-QTOF MS/MS, Agilent, Santa Clara, CA), and charged-surface hybrid–quadrupole time-of-flight tandem mass spectrometry (CSH-QTOF MS/MS, Agilent, Santa Clara, CA, USA). Internal standards were employed for the identification of metabolites by matching the retention times. A total of 7514 features remained after blank filtering, including 769 structurally unique, annotated metabolites. Our calculations here focused on these 769 annotated metabolites with the classification of chemical compound classes performed using ClassyFire [16]. Provided the small percentage of missing values of the 769 annotated metabolites at baseline (0.3%) and 32 weeks (0.2%), we imputed missing values with half of the minimum value found in the dataset. Given the right-skewed distribution of metabolomics data, a natural log transformation was performed for all annotated metabolites [17]. To facilitate comparisons of the effect magnitudes across different metabolites, standardization (mean = 0, SD = 1) was also performed before performing the statistical analysis.
Maternal demographic variables, including maternal age, race/ethnicity, and parity were collected at the baseline visit at around 12 weeks using a study-specific questionnaire. The prepregnancy BMI was calculated based on the self-reported prepregnancy weight and height at the screening visit. Dietary intakes at baseline and 32 weeks were assessed using two automated self-administered 24-h dietary recalls (1 weekday and 1 weekend day) [18,19]. Physical activity (PA) at baseline and 32 weeks was assessed using the SenseWear Armband (CamNTech, Fenstanton, UK) for eight consecutive days. The SenseWear Armband is a multi-sensor accelerometer that was validated for assessing the PA of pregnant women [20]. The proprietary algorithms use the accelerometer and sensor data to classify the intensity of activity by metabolic equivalents. Only those who met the wear criteria (≥5 days, ≥1 weekend day, ≥21 h/day) were used to calculate the minutes/day spent in moderate-to-vigorous PA (MVPA). A total of 36 of 39 participants at baseline and 27 of 29 participants at 32 weeks met the wear criteria.
We compared the plasma metabolomic profiles between the intervention (n = 20) and control groups (n = 19) using principal component analysis and found no significant differences by intervention group (Figure S1). More importantly, the intervention and control groups achieved similar GWG at delivery in the HIPP study [15]. Thus, we combined the data from the two groups in the following analyses. First, we applied linear regression models to identify the metabolites at baseline that were individually associated with GWG, adjusting for age, race (White vs. Black), parity (0 vs. ≥1), and prepregnancy BMI. Then we performed least absolute shrinkage and selection operator (LASSO) regression models with 10-fold cross-validation, adjusted for the same covariates, to identify a panel of metabolites at baseline that were jointly associated with GWG [21]. Metabolites with non-zero coefficients based on the criteria of lambda.min were selected. For the metabolite panel selected in the LASSO regressions, we further estimated their predictability of excessive GWG using the area under (AUC) the receiver operating characteristic curve (ROC) in logistic regression models. The same procedures were repeated for metabolites at 32 weeks and percentage change in metabolites between baseline and 32 weeks (i.e., (metabolites32weeks − metabolitesbaseline)/metabolitesbaseline). Moreover, we estimated the Pearson correlations between the metabolites individually associated with GWG and three cardiometabolic biomarkers measured at the same visit, including hs-CRP, C-peptide, and insulin. These biomarkers were log-transformed due to their right-skewed distribution. For linear regression analyses and Pearson correlation analyses, multiple comparisons were adjusted using the Benjamini–Hochberg correction, and a false discovery rate (FDR) of < 0.05 was considered statistically significant [22]. All data analyses were performed using R software (version 4.0.2. R Foundation for Statistical Computing, Vienna, Austria).

3. Results

3.1. Demographic Characteristics

Among the 39 women, 38.5% were Black, 35.9% were nulliparous, 66.7% were married, 59.0% had a full-time job, and 30.8% were eligible for Medicaid. The mean maternal age was 30.4 (5.4) years, and the mean prepregnancy BMI was 33.3 (7.0) kg/m2, with 56.4% classified as obese (BMI ≥ 30 kg/m2). At baseline, the mean MVPA was 40.9 (23.0) minutes/day, and the mean total energy intake was 1869.1 (560.8) kcals/day (Table 1). The mean GWG was 12.4 (8.5) kg, with 27 (69.2%) females having excessive GWG. Additionally, there were no differences in the baseline characteristics, maternal pregnancy complications, or offspring conditions between the women with normal GWG and those with excessive GWG (Table S2).

3.2. Associations of Metabolites with GWG

Among the 769 annotated metabolites, there were 223 glycerophospholipids, 131 glycerolipids, 97 carboxylic acids and derivatives, 92 sphingolipids, 66 fatty acyls, 31 organooxygen compounds, 16 steroids and steroid derivatives, 13 indoles and derivatives, 13 organonitrogen compounds, 11 benzene and substituted derivatives, and 76 metabolites in classes that contained less than 10 metabolites (Figure S2).
At baseline, a total of 104 metabolites were associated with GWG with raw p-values < 0.05, but none of them were significant after FDR correction (all FDR > 0.05) (Table S3). A panel of 12 metabolites was jointly associated with the total GWG in LASSO regression with 10-fold cross-validation (Table 2). The AUC for excessive GWG of this 12-metabolite panel was 0.80 (95% CI: 0.62, 0.99; p = 0.01) (Figure 1A).
At 32 weeks, 186 metabolites were associated with GWG with raw p-values of < 0.05 (Table S4), while 88 were significantly and positively associated with GWG after adjusting for multiple comparisons (FDR < 0.05), including 42 glycerophospholipids (i.e., 35 phosphatidylcholines (PC) and 7 lysophosphatidylcholines (LPC)), 38 triglycerides (TAG), 5 sphingomyelins (SM), and one polyunsaturated fatty acid (i.e., arachidonic acid), while only two were amino acid-related (i.e., isoleucine, and Phe-Trp) (Figure 2). A panel of four metabolites at 32 weeks was jointly associated with GWG in LASSO regression with 10-fold cross-validation, including PC (34:4), TAG (52:6), arachidonic acid, and isoleucine (Table 2). The AUC for excessive GWG of this four-metabolite panel was 0.80 (95% CI: 0.67, 0.93; p = 0.02) (Figure 1B). All of them were also individually associated with total GWG (FDR < 0.05).
For changes in the metabolites from baseline to 32 weeks, 47 metabolites were associated with GWG (raw p-values < 0.05), but none of them were significant after FDR correction (FDR > 0.05) (Table S5). A panel of three metabolite changes (i.e., from baseline to 32 weeks) was jointly associated with GWG in LASSO regression with 10-fold cross-validation (Table 2). The AUC for excessive GWG of this four-metabolite panel was 0.73 (95% CI: 0.44, 1.00; p = 0.07) (Figure 1C).

3.3. Correlations between Metabolites and Cardiometabolic Biomarkers

Of the 88 metabolites individually associated with GWG around 32 weeks, seven TAGs (i.e., TAG (52:4), TAG (52:6; 14:0-18:2-20:4), TAG (48:3), TAG (48:5), TAG (50:5), TAG (54:5)B, TAG (54:6)B) were nominally correlated (p < 0.05) with both insulin and C-peptide collected at 32 weeks. However, no correlations were significant after FDR correction (FDR > 0.05) (Table 3).

4. Discussion

In this longitudinal study among Black and White pregnant women with overweight and obesity and untargeted metabolomic profiling, we identified novel blood metabolites associated with total GWG. In the third trimester (~32 weeks), 88 metabolites were individually associated with GWG in linear regressions, independent of age, race/ethnicity, parity, and prepregnancy BMI. A panel of four metabolites (i.e., PC (34:4), TAG (52:6), isoleucine, and arachidonic acid) was jointly associated with GWG in LASSO regressions, which was also consistently identified in linear regression models. These four metabolites well predicted excessive GWG with an AUC of 0.80. No significant correlation was observed for the 88 metabolites that were individually associated with GWG and three cardiometabolic biomarkers (i.e., insulin, C-peptide, and hs-CRP) at 32 weeks. We also identified a panel of 12 metabolites at baseline with an AUC of 0.80 and a panel of three changes of metabolites from baseline to 32 weeks with an AUC of 0.73, which well predicted excessive GWG, though they were not individually associated with the total GWG.
Two studies have investigated GWG-related metabolites using a targeted approach (i.e., the measurement of defined groups of chemically characterized and biochemically annotated metabolites) [23] or an untargeted approach but focusing solely on lipid metabolites (i.e., lipidomics) [24]. Hellmuth et al. performed targeted profiling on amino acids and non-esterified fatty acids (NEFA) and examined cross-sectional associations in 160 U.S. pregnant women (93 women with a normal prepregnancy BMI) [23]. Two metabolites, α -ketoglutaric acid in the first and third trimesters and SM.a.C30.1 in the first trimester, were associated with the trimester-specific GWG [23]. Lau et al., conducted lipidomic profiling using non-fasting plasma samples collected from 114 U.S. pregnant women with prepregnancy overweight or obesity at 15 and 35 weeks and found the changes of 17 lipids, mainly PCs and SMs, were associated with GWG [24]. To date, only one study, recently conducted among 37 Canadian pregnant women by Shearer et al., performed untargeted metabolomic profiling and an MWAS of GWG. Four metabolites (i.e., glutamate, lysine, pyruvate, and valine) in the second trimester (25–28 weeks) were individually associated with excessive GWG in this study [11]. In contrast to our study, the Shearer et al. study used nuclear magnetic resonance (NMR) spectroscopy for the untargeted metabolomic profiling and non-fasting blood samples and included mainly lean women (23 women (65%) with normal prepregnancy BMI) [11] who were at lower risk of excessive GWG [3]. No metabolites have been replicated across studies (including the current study), which might be explained by the different platforms for metabolomic profiling (i.e., NMR vs. GC/MS) [25], different biospecimens (i.e., fasting vs. non-fasting), and the heterogeneity of the study populations. It is noteworthy that three of the four metabolites at 32 weeks (i.e., isoleucine, arachidonic acid [26,27], and PC (34:4) [28,29]) that were both individually and jointly associated with the total GWG and excessive GWG during pregnancy in our study were also associated with obesity in previous studies in non-pregnant populations.
A large body of evidence has suggested that obesity is accompanied by an increased level of circulating branched-chain amino acids (BCAAs) [30]. Isoleucine, a BCAA, was positively associated with GWG in our study and in previous studies among non-pregnant adults and children [30]. Interestingly, another BCAA, valine, was associated with GWG in the Shearer et al. study [11]. Collectively, the available data tend to indicate the importance of BCAAs and their metabolic pathways in the etiology of obesity in both non-pregnant populations and pregnant women.
Our study observed a significant and positive association between arachidonic acid and GWG in pregnant women, which is consistent with previous studies conducted in children and adults with obesity in Europe [26,27]. As an omega-6 polyunsaturated fatty acid (PUFA), the biological functions of arachidonic acid have been studied intensively, including the initiation and resolution of inflammation, the adaption of mood and appetite, and the pathophysiology of obesity [31]. Specifically, 5-, 11-, and 15-hydroxyeicosatetraenoic acids, the derivatives of arachidonic acid, were also positively associated with BMI, waist circumference, and serum leptin, indicating a potential pathway between arachidonic acid and GWG [32].
Phosphatidylcholines (PCs) are major components of eukaryotic cell membranes and are engaged in membrane trafficking and inflammation [33]. The relationships of each subtype of PCs with health outcomes are not well understood but are likely varied by the length of the carbon chains and the number and location of the double bonds [34]. A previous study found that a higher level of plasma PC (34:4) was associated with an increased risk of obesity in adults, with the association being independent of genetic factors in a small twin study [28]. In addition, a recent study observed a decline of the plasma PC (34:4) concentration after an eight-week weight loss intervention (an average weight loss of 9.7 kg and total fat reduction of 7.2 kg) among 162 adults, suggesting that PC (34:4) may play a role in obesity development and adiposity accumulation [29].
Increased plasma levels of the total TAGs are one of the characteristics of dyslipidemia commonly occurring in obesity [35]. Long-chain fatty acids are the most common type of TAGs and are mainly used as energy sources in humans [36]. Their specific function, however, may vary by the length of carbon chains and the number and location of double bonds. For instance, TAG (48:0), TAG (48:1), and TAG (50:5) have been reported for their predictability of the future development of type 2 diabetes among individuals in the Netherlands [37]. TAG (16:0/18:1/22:5), TAG (18:1/18:1/20:4), and TAG (16:0/18:1/18:1) have been associated with calcium scores among patients with calcific coronary artery disease [38]. However, to our best knowledge, no studies have reported the association between specific long-chain TAGs and obesity.
Our study has several unique strengths, including the prospective design, a large proportion (38.5%) of Black women, untargeted metabolomic profiling using three platforms, and the availability of fasting blood samples collected at two time points across the pregnancy. Given the dynamic changes of blood metabolites after meals, fasting blood samples are less likely to be influenced by the last meals and are more likely preferred in metabolomics studies [39]. There are also several limitations to be acknowledged. First, we had a modest sample size, which may limit the study’s power to identify some GWG-related metabolites. However, most metabolomics studies have had similar sample sizes given the expenses associated with untargeted metabolomic profiling. The research field has recognized this limitation and called for establishing metabolomics consortiums (e.g., COMETS) to aggregate datasets and resources [25]. Second, although we collected fasting plasma samples in both the first and the third trimesters, no fasting plasma sample was collected in the second trimester [40]. Future studies collecting fasting blood samples in the second trimester may provide a novel perspective on the metabolic biomarkers of GWG. Third, our study included only pregnant women with overweight and obesity, which may limit the generalization of the study findings to those with under or normal prepregnancy weight. Given that about 56% of U.S women were overweight (26.7%) or obese (29.5%) in 2020 [41] and our inclusion of black and white women, the study findings could still be appropriately applied to the majority of U.S. pregnant women. Nevertheless, results from our study need to be replicated by other studies, particularly with a larger sample size. In addition, future studies can explore the medication effect of prepregnancy BMI (e.g., normal weight vs. overweight and obesity) on the associations between metabolites and GWG. Finally, as an observational study, this study may inevitably suffer from residual confounding (e.g., genetic factors), though several key confounders have been controlled.
In conclusion, our study identified some novel metabolomic markers of GWG in both the first and the third trimesters, with some of them potentially related to the pathophysiology of GWG and others as promising predictors for excessive GWG. Future studies with a larger sample size are warranted to replicate our findings and explore the molecular mechanisms of the potential pathophysiology of GWG.

Supplementary Materials

The following supporting information can be downloaded at: https://www.mdpi.com/article/10.3390/metabo12100960/s1, Table S1: Comparison of baseline characteristics among patients included in the ancillary study and those only included in the HIPP study; Table S2: Comparison of baseline characteristics, maternal pregnancy complications, and offspring conditions between participants with normal gestational weight gain versus those with excessive gestational weight gain in the current study; Table S3: Associations of 104 metabolites at baseline around 12 weeks of gestation with gestational weight gain in linear regression analyses; Table S4: Associations of 186 metabolites at 32 weeks of gestation with gestational weight gain in linear regression analyses; Table S5: Associations of 47 changes of metabolites from baseline to 32 weeks of gestation with gestational weight gain in linear regression analyses; Figure S1: Principal component analysis score plot of the first two principal components of 29 pregnant women based on their metabolites collected around 32 weeks of gestation; Figure S2: Dendrogram of the analyzed metabolites by superclass and class, for which the classification of chemical compound was performed using ClassyFire. STROBE Statement for cohort studies was included.

Author Contributions

Conceptualization, L.C. and J.L. (Jihong Liu); methodology, J.D. and L.C.; software, J.D.; validation, N.S.B.; formal analysis, J.D.; investigation, J.D. and L.C.; resources, J.L. (Jihong Liu); data curation, J.D.; writing—original draft preparation, J.D.; writing—review and editing, J.D., N.S.B., M.A.S., F.L., X.S., J.L. (Jian Li), O.F., J.L. (Jihong Liu) and L.C.; visualization, J.D.; supervision, L.C.; project administration, L.C.; funding acquisition, L.C. and J.L. (Jihong Liu). All authors have read and agreed to the published version of the manuscript.

Funding

This research was funded by the Clemson University SUCCEEDS fund (LC, FL, SX), the UCLA Provost fund (LC, JD), NIH (R01HD082311, LC), NIH (R01HD078407, JLiu (Jihong Liu)), and the ASPIRE grant at USC (NB, JLiu (Jihong Liu)).

Institutional Review Board Statement

The study was conducted in accordance with the Declaration of Helsinki, and approved by the Institutional Review Board of the University of South Carolina (protocol code: Pro00033131 and date of approval: 17 December 2014).

Informed Consent Statement

Informed consent was obtained from all subjects involved in the study. Written informed consent was obtained from the patient(s) to publish this paper.

Data Availability Statement

The datasets generated during and/or analyzed during the current study are available from the corresponding author upon reasonable request. The data are not publicly available due to the fact that study participants did not agree for their data to be shared publicly.

Conflicts of Interest

The authors declare no conflict of interest. The sponsors had no role in the design of the study; in the collection, analyses, or interpretation of data; in the writing of the manuscript; or in the decision to publish the results.

References

  1. Goldstein, R.F.; Abell, S.K.; Ranasinha, S.; Misso, M.; Boyle, J.A.; Black, M.H.; Li, N.; Hu, G.; Corrado, F.; Rode, L.; et al. Association of Gestational Weight Gain With Maternal and Infant Outcomes: A Systematic Review and Meta-Analysis. JAMA 2017, 317, 2207–2225. [Google Scholar] [CrossRef] [PubMed]
  2. Institute of Medicine; National Research Council Committee to Reexamine IOM Pregnancy Weight Guidelines. The National Academies Collection: Reports funded by National Institutes of Health. In Weight Gain During Pregnancy: Reexamining the Guidelines; Rasmussen, K.M., Yaktine, A.L., Eds.; National Academies Press (US): Washington, DC, USA, 2009. [Google Scholar]
  3. Deputy, N.P.; Sharma, A.J.; Kim, S.Y.; Hinkle, S.N. Prevalence and characteristics associated with gestational weight gain adequacy. Obstet. Gynecol. 2015, 125, 773–781. [Google Scholar] [CrossRef] [PubMed]
  4. Johnson, J.L.; Farr, S.L.; Dietz, P.M.; Sharma, A.J.; Barfield, W.D.; Robbins, C.L. Trends in gestational weight gain: The Pregnancy Risk Assessment Monitoring System, 2000–2009. Am. J. Obstet. Gynecol. 2015, 212, 806.e1–806.e8. [Google Scholar] [CrossRef] [PubMed] [Green Version]
  5. Stuebe, A.M.; Oken, E.; Gillman, M.W. Associations of diet and physical activity during pregnancy with risk for excessive gestational weight gain. Am. J. Obstet. Gynecol. 2009, 201, 58.e1–58.e8. [Google Scholar] [CrossRef] [PubMed] [Green Version]
  6. Francis, E.C.; Zhang, L.; Witrick, B.; Chen, L. Health behaviors of American pregnant women: A cross-sectional analysis of NHANES 2007–2014. J. Public Health 2021, 43, 131–138. [Google Scholar] [CrossRef]
  7. Soma-Pillay, P.; Nelson-Piercy, C.; Tolppanen, H.; Mebazaa, A. Physiological changes in pregnancy. Cardiovasc. J. Afr. 2016, 27, 89–94. [Google Scholar] [CrossRef] [Green Version]
  8. Zampieri, M.; Sekar, K.; Zamboni, N.; Sauer, U. Frontiers of high-throughput metabolomics. Curr. Opin. Chem. Biol. 2017, 36, 15–23. [Google Scholar] [CrossRef]
  9. Chadeau-Hyam, M.; Ebbels, T.M.; Brown, I.J.; Chan, Q.; Stamler, J.; Huang, C.C.; Daviglus, M.L.; Ueshima, H.; Zhao, L.; Holmes, E.; et al. Metabolic profiling and the metabolome-wide association study: Significance level for biomarker identification. J. Proteome Res. 2010, 9, 4620–4627. [Google Scholar] [CrossRef]
  10. Rangel-Huerta, O.D.; Pastor-Villaescusa, B.; Gil, A. Are we close to defining a metabolomic signature of human obesity? A systematic review of metabolomics studies. Metabolomics 2019, 15, 93. [Google Scholar] [CrossRef] [Green Version]
  11. Shearer, J.; Klein, M.S.; Vogel, H.J.; Mohammad, S.; Bainbridge, S.; Adamo, K.B. Maternal and Cord Blood Metabolite Associations with Gestational Weight Gain and Pregnancy Health Outcomes. J. Proteome Res. 2021, 20, 1630–1638. [Google Scholar] [CrossRef]
  12. Handelman, S.K.; Romero, R.; Tarca, A.L.; Pacora, P.; Ingram, B.; Maymon, E.; Chaiworapongsa, T.; Hassan, S.S.; Erez, O. The plasma metabolome of women in early pregnancy differs from that of non-pregnant women. PLoS ONE 2019, 14, e0224682. [Google Scholar] [CrossRef] [PubMed]
  13. Delplancke, T.D.; De Seymour, J.V.; Tong, C.; Sulek, K.; Xia, Y.; Zhang, H.; Han, T.-L.; Baker, P.N. Analysis of sequential hair segments reflects changes in the metabolome across the trimesters of pregnancy. Sci. Rep. 2018, 8, 36. [Google Scholar] [CrossRef] [PubMed] [Green Version]
  14. Wilcox, S.; Liu, J.; Addy, C.L.; Turner-McGrievy, G.; Burgis, J.T.; Wingard, E.; Dahl, A.A.; Whitaker, K.M.; Schneider, L.; Boutté, A.K. A randomized controlled trial to prevent excessive gestational weight gain and promote postpartum weight loss in overweight and obese women: Health In Pregnancy and Postpartum (HIPP). Contemp. Clin. Trials 2018, 66, 51–63. [Google Scholar] [CrossRef] [PubMed]
  15. Liu, J.; Wilcox, S.; Wingard, E.; Turner-McGrievy, G.; Hutto, B.; Burgis, J. A Behavioral Lifestyle Intervention to Limit Gestational Weight Gain in Pregnant Women with Overweight and Obesity. Obesity 2021, 29, 672–680. [Google Scholar] [CrossRef]
  16. Djoumbou Feunang, Y.; Eisner, R.; Knox, C.; Chepelev, L.; Hastings, J.; Owen, G.; Fahy, E.; Steinbeck, C.; Subramanian, S.; Bolton, E.; et al. ClassyFire: Automated chemical classification with a comprehensive, computable taxonomy. J. Cheminform. 2016, 8, 61. [Google Scholar] [CrossRef] [Green Version]
  17. Antonelli, J.; Claggett, B.L.; Henglin, M.; Kim, A.; Ovsak, G.; Kim, N.; Deng, K.; Rao, K.; Tyagi, O.; Watrous, J.D.; et al. Statistical Workflow for Feature Selection in Human Metabolomics Data. Metabolites 2019, 9, 143. [Google Scholar] [CrossRef] [Green Version]
  18. Kirkpatrick, S.I.; Subar, A.F.; Douglass, D.; Zimmerman, T.P.; Thompson, F.E.; Kahle, L.L.; George, S.M.; Dodd, K.W.; Potischman, N. Performance of the Automated Self-Administered 24-hour Recall relative to a measure of true intakes and to an interviewer-administered 24-h recall. Am. J. Clin. Nutr. 2014, 100, 233–240. [Google Scholar] [CrossRef] [Green Version]
  19. Krebs-Smith, S.M.; Pannucci, T.E.; Subar, A.F.; Kirkpatrick, S.I.; Lerman, J.L.; Tooze, J.A.; Wilson, M.M.; Reedy, J. Update of the Healthy Eating Index: HEI-2015. J. Acad. Nutr. Diet. 2018, 118, 1591–1602. [Google Scholar] [CrossRef] [Green Version]
  20. Smith, K.M.; Lanningham-Foster, L.M.; Welk, G.J.; Campbell, C.G. Validity of the SenseWear® Armband to predict energy expenditure in pregnant women. Med. Sci. Sports Exerc. 2012, 44, 2001–2008. [Google Scholar] [CrossRef]
  21. Friedman, J.; Hastie, T.; Tibshirani, R. Regularization Paths for Generalized Linear Models via Coordinate Descent. J. Stat. Softw. 2010, 33, 1–22. [Google Scholar] [CrossRef]
  22. Benjamini, Y.; Hochberg, Y. Controlling the False Discovery Rate: A Practical and Powerful Approach to Multiple Testing. J. R. Stat. Soc. Ser. B Methodol. 1995, 57, 289–300. [Google Scholar] [CrossRef]
  23. Hellmuth, C.; Lindsay, K.L.; Uhl, O.; Buss, C.; Wadhwa, P.D.; Koletzko, B.; Entringer, S. Association of maternal prepregnancy BMI with metabolomic profile across gestation. Int. J. Obes. 2017, 41, 159–169. [Google Scholar] [CrossRef] [PubMed] [Green Version]
  24. Lau, C.E.; Taylor-Bateman, V.; Vorkas, P.A.; Graça, G.; Vu, T.T.; Hou, L.; Chekmeneva, E.; Ebbels, T.M.D.; Chan, Q.; Van Horn, L.; et al. Metabolic Signatures of Gestational Weight Gain and Postpartum Weight Loss in a Lifestyle Intervention Study of Overweight and Obese Women. Metabolites 2020, 10, 498. [Google Scholar] [CrossRef] [PubMed]
  25. Yu, B.; Zanetti, K.A.; Temprosa, M.; Albanes, D.; Appel, N.; Barrera, C.B.; Ben-Shlomo, Y.; Boerwinkle, E.; Casas, J.P.; Clish, C.; et al. The Consortium of Metabolomics Studies (COMETS): Metabolomics in 47 Prospective Cohort Studies. Am. J. Epidemiol. 2019, 188, 991–1012. [Google Scholar] [CrossRef] [Green Version]
  26. Decsi, T.; Molnár, D.; Koletzko, B. Long-chain polyunsaturated fatty acids in plasma lipids of obese children. Lipids 1996, 31, 305–311. [Google Scholar] [CrossRef]
  27. Marco-Ramell, A.; Tulipani, S.; Palau-Rodriguez, M.; Gonzalez-Dominguez, R.; Miñarro, A.; Jauregui, O.; Sanchez-Pla, A.; Macias-Gonzalez, M.; Cardona, F.; Tinahones, F.J.; et al. Untargeted Profiling of Concordant/Discordant Phenotypes of High Insulin Resistance and Obesity To Predict the Risk of Developing Diabetes. J. Proteome Res. 2018, 17, 2307–2317. [Google Scholar] [CrossRef]
  28. Pietiläinen, K.H.; Sysi-Aho, M.; Rissanen, A.; Seppänen-Laakso, T.; Yki-Järvinen, H.; Kaprio, J.; Oresic, M. Acquired obesity is associated with changes in the serum lipidomic profile independent of genetic effects—A monozygotic twin study. PLoS ONE 2007, 2, e218. [Google Scholar] [CrossRef]
  29. Papandreou, C.; García-Gavilán, J.; Camacho-Barcia, L.; Toft Hansen, T.; Harrold, J.A.; Sjödin, A.; Halford, J.C.; Bulló, M. Changes in Circulating Metabolites During Weight Loss are Associated with Adiposity Improvement, and Body Weight and Adiposity Regain during Weight Loss Maintenance: The SATIN Study. Mol. Nutr. Food Res. 2021, 65, 2001154. [Google Scholar] [CrossRef]
  30. Liu, M.; Huang, Y.; Zhang, H.; Aitken, D.; Nevitt, M.C.; Rockel, J.S.; Pelletier, J.-P.; Lewis, C.E.; Torner, J.; Rampersaud, Y.R.; et al. Restricting Branched-Chain Amino Acids within a High-Fat Diet Prevents Obesity. Metabolites 2022, 12, 334. [Google Scholar] [CrossRef]
  31. Hanna, V.S.; Hafez, E.A.A. Synopsis of arachidonic acid metabolism: A review. J. Adv. Res. 2018, 11, 23–32. [Google Scholar] [CrossRef]
  32. Pickens, C.A.; Sordillo, L.M.; Zhang, C.; Fenton, J.I. Obesity is positively associated with arachidonic acid-derived 5- and 11-hydroxyeicosatetraenoic acid (HETE). Metabolism 2017, 70, 177–191. [Google Scholar] [CrossRef] [PubMed]
  33. Gault, C.R.; Obeid, L.M.; Hannun, Y.A. An overview of sphingolipid metabolism: From synthesis to breakdown. Adv. Exp. Med. Biol. 2010, 688, 1–23. [Google Scholar] [CrossRef] [PubMed] [Green Version]
  34. Cavus, E.; Karakas, M.; Ojeda, F.M.; Kontto, J.; Veronesi, G.; Ferrario, M.M.; Linneberg, A.; Jørgensen, T.; Meisinger, C.; Thorand, B.; et al. Association of Circulating Metabolites With Risk of Coronary Heart Disease in a European Population: Results from the Biomarkers for Cardiovascular Risk Assessment in Europe (BiomarCaRE) Consortium. JAMA Cardiol. 2019, 4, 1270–1279. [Google Scholar] [CrossRef] [PubMed]
  35. Klop, B.; Elte, J.W.; Cabezas, M.C. Dyslipidemia in obesity: Mechanisms and potential targets. Nutrients 2013, 5, 1218–1240. [Google Scholar] [CrossRef] [PubMed] [Green Version]
  36. Nakamura, M.T.; Yudell, B.E.; Loor, J.J. Regulation of energy metabolism by long-chain fatty acids. Prog. Lipid Res. 2014, 53, 124–144. [Google Scholar] [CrossRef]
  37. Liu, J.; Semiz, S.; van der Lee, S.J.; van der Spek, A.; Verhoeven, A.; van Klinken, J.B.; Sijbrands, E.; Harms, A.C.; Hankemeier, T.; van Dijk, K.W.; et al. Metabolomics based markers predict type 2 diabetes in a 14-year follow-up study. Metabolomics 2017, 13, 104. [Google Scholar] [CrossRef] [Green Version]
  38. Vorkas, P.A.; Isaac, G.; Holmgren, A.; Want, E.J.; Shockcor, J.P.; Holmes, E.; Henein, M.Y. Perturbations in fatty acid metabolism and apoptosis are manifested in calcific coronary artery disease: An exploratory lipidomic study. Int. J. Cardiol. 2015, 197, 192–199. [Google Scholar] [CrossRef]
  39. Sampson, J.N.; Boca, S.M.; Shu, X.O.; Stolzenberg-Solomon, R.Z.; Matthews, C.E.; Hsing, A.W.; Tan, Y.T.; Ji, B.T.; Chow, W.H.; Cai, Q.; et al. Metabolomics in epidemiology: Sources of variability in metabolite measurements and implications. Cancer Epidemiol. Biomark. Prev. 2013, 22, 631–640. [Google Scholar] [CrossRef] [Green Version]
  40. Masood, S.N.; Lakho, N.; Saeed, S.; Masood, Y. Non-fasting OGTT versus Fasting OGTT for screening of Hyperglycaemia in Pregnancy (HIP). Pak. J. Med. Sci. 2021, 37, 1008–1013. [Google Scholar] [CrossRef]
  41. Creanga, A.A.; Catalano, P.M.; Bateman, B.T. Obesity in Pregnancy. N. Engl. J. Med. 2022, 387, 248–259. [Google Scholar] [CrossRef]
Figure 1. Receiver operating characteristic curves for panels of metabolites to predict excessive gestational weight gain. (A) Twelve metabolites at baseline around 12 weeks of gestation jointly associated with gestational weight gain (B) Four metabolites at 32 weeks of gestation jointly associated with gestational weight gain (C) Three changes of metabolites from baseline to 32 weeks of gestation jointly associated with gestational weight gain. Participants were randomly divided into training and validation sets with a ratio of 1:2, based on which the area under the curve (AUC) was calculated using logistic regression models.
Metabolites 12 00960 g001
Figure 2. Manhattan plot for associations between metabolites at 32 weeks of gestation and total gestational weight gain (GWG) and by metabolic class in linear regression models adjusted for age, race/ethnicity, parity, and prepregnancy BMI and corrected for the multiple comparisons using the Benjamini–Hochberg procedure, with false discovery rates (FDRs) of < 0.05 as the statistically significant level. The horizontal lines represented the adjusted p values (i.e., Q value) of 0.05. “Others” included 76 metabolites in classes that contained less than 10 metabolites.
Metabolites 12 00960 g002
Table 1. Maternal demographic characteristics for the 39 pregnant women at baseline (around 12 weeks of gestation).
Characteristics 1n = 39
Demographic characteristics
Gestational age at baseline (week, mean (SD))12.09 (2.26)
Age (year, mean (SD))30.41 (5.41)
Prepregnancy BMI (kg/m2, mean (SD))33.25 (7.04)
Obese (%)22 (56.4)
Nulliparous (%)14 (35.9)
Black (%)15 (38.5)
Married (%)26 (66.7)
Full time employed (%)23 (59.0)
Medicaid use (%)12 (30.8)
Physical activity at baseline (mean (SD)) 2
Moderate physical activity (min/day)40.35 (21.99)
Vigorous physical activity (min/day)0.33 (0.87)
Moderate to vigorous physical activity (min/day)40.88 (23.00)
Steps per day5727.62 (2427.90)
Dietary intake at baseline (mean (SD))
Total energy (kcal/day)1869.05 (560.79)
Total protein (g/day)73.04 (22.46)
Total fatty acids (g/day)75.31 (26.25)
Saturated fatty acids (g/day)24.53 (10.60)
Monounsaturated fatty acids (g/day)26.33 (8.98)
Polyunsaturated fatty acids (g/day)18.41 (7.95)
Cholesterol (mg/day)269.94 (150.32)
Total HEI—2015 score 352.98 (14.31)
Maternal pregnancy complications
Gestational diabetes (%)3 (7.7)
Gestational hypertension (%)8 (20.5)
Offspring conditions
Girl (%) 19 (48)
Low birth weight (%) 42 (5.1)
Preterm birth (%)41 (2.6)
Small for gestational age (%) 44 (10.3)
Large for gestational age (%) 44 (10.3)
1 Data are presented as frequency (percentage) for categorical variables and mean (standard deviations, SD) for continuous variables. 2 Three pregnant women had missing data on physical activity. 3 The HEI–2015 scores ranged from 0 to 100, with a higher HEI score reflecting better adherence to the 2015–2020 Dietary Guidelines for Americans. 4 One offspring had missing data on low birth weight, preterm birth, small for gestational age, and large for gestational age. Abbreviations: BMI, body mass index; HEI, healthy eating index; SD, standard deviation.
Table 2. Metabolite panels associated with total gestational weight gain in LASSO regression 1.
12 Weeks of Gestation32 Weeks of GestationChanges from 12 to 32 Weeks of Gestation
MetaboliteClassDirection MetaboliteClassDirection MetaboliteClassDirection
PC (40:6) AGlycerophospholipidsPositivePC (34:4)GlycerophospholipidsPositivePC (40:7) A PhosphatidylcholineNegative
TAG (43:0) or TAG (13:0-14:0-16:0)GlycerolipidsPositiveTAG (52:6)GlycerolipidsPositiveTAG (60:4)GlycerolipidsNegative
SM (d30:1)SphingolipidsPositiveArachidonic acidOmega-6 PUFAPositiveAdenosinePurine nucleosidesPositive
SM (d32:0)SphingolipidsPositiveIsoleucineAmino acidPositive
PE (p-38:2) or PE (o-38:3)GlycerophospholipidsPositive
3-HydroxybutyrylcarnitineFatty AcylsNegative
MethyltestosteroneSteroids and steroid derivativesPositive
Aconitic acidCarboxylic acids and derivativesNegative
1-methylgalactoseOrganooxygen compoundsPositive
Trans-3’-HydroxycotininePyridines and derivativesPositive
TrigonellineAlkaloidsNegative
Adipic acidCarboxylic acids and derivativesPositive
1 LASSO regression adjusted for maternal age, race, parity, and prepregnancy BMI with 10-fold cross-validation (lambda.min). Abbreviations: BMI, body mass index; LASSO, least absolute shrinkage and selection operator; PC, phosphatidylcholine; PE, phosphatidylethanolamines; SM, sphingomyelin; TAG, triacylglycerol, PUFA: polyunsaturated fatty acids.
Table 3. Pearson correlations between 88 metabolites and three cardiometabolic biomarkers at 32 weeks of gestation.
InsulinC-PeptideHs-CRP
Metabolite 1SuperclassClassβPFDRβPFDRβPFDR
Arachidonic acidLipids and lipid-like moleculesFatty Acyls0.140.460.70−0.080.680.84−0.120.520.88
TAG 45:0 or TAG 14:0-15:0-16:0Lipids and lipid-like moleculesGlycerolipids0.150.440.680.220.260.50−0.120.540.88
TAG 45:1 or TAG 12:0-16:0-17:1Lipids and lipid-like moleculesGlycerolipids0.150.430.680.210.270.50−0.110.570.88
TAG 46:2 or TAG 12:0-16:1-18:1Lipids and lipid-like moleculesGlycerolipids0.190.330.680.210.280.50−0.300.110.88
TAG 47:1 or TAG 15:0-16:0-16:1Lipids and lipid-like moleculesGlycerolipids0.100.590.780.230.240.490.000.990.99
TAG 47:2 or TAG 14:0-15:0-18:2Lipids and lipid-like moleculesGlycerolipids0.130.510.710.240.220.47−0.130.500.88
TAG 48:3 or TAG 14:0-16:1-18:2Lipids and lipid-like moleculesGlycerolipids0.170.390.680.230.220.47−0.290.130.88
TAG 49:3 or TAG 15:0-16:1-18:2Lipids and lipid-like moleculesGlycerolipids0.090.650.820.260.170.45−0.020.910.94
TAG 50:5 or TAG 14:1-18:2-18:2Lipids and lipid-like moleculesGlycerolipids0.300.110.680.360.060.31−0.350.060.88
TAG 52:4Lipids and lipid-like moleculesGlycerolipids0.410.030.370.450.010.31−0.070.700.88
TAG 52:6 or TAG 14:0-18:2-20:4Lipids and lipid-like moleculesGlycerolipids0.380.040.370.380.040.31−0.230.230.88
TAG 58:7 or TAG 18:0-18:2-22:5Lipids and lipid-like moleculesGlycerolipids0.380.040.370.370.050.31−0.210.280.88
TAG (40:1)Lipids and lipid-like moleculesGlycerolipids0.280.140.680.300.120.39−0.080.690.88
TAG (44:0)Lipids and lipid-like moleculesGlycerolipids0.190.320.680.220.260.50−0.210.270.88
TAG (44:1)Lipids and lipid-like moleculesGlycerolipids0.130.510.710.190.330.57−0.180.340.88
TAG (44:2)Lipids and lipid-like moleculesGlycerolipids0.220.260.680.170.380.61−0.330.080.88
TAG (46:0)Lipids and lipid-like moleculesGlycerolipids0.170.390.680.210.280.50−0.190.330.88
TAG (46:1)Lipids and lipid-like moleculesGlycerolipids0.160.400.680.220.250.50−0.170.380.88
TAG (46:3) ALipids and lipid-like moleculesGlycerolipids0.220.250.680.260.170.45−0.300.110.88
TAG (48:1)Lipids and lipid-like moleculesGlycerolipids0.210.270.680.310.110.39−0.090.650.88
TAG (48:2)Lipids and lipid-like moleculesGlycerolipids0.240.220.680.310.100.39−0.170.380.88
TAG (48:3)Lipids and lipid-like moleculesGlycerolipids0.420.020.370.400.030.31−0.180.340.88
TAG (48:4) BLipids and lipid-like moleculesGlycerolipids0.370.050.400.360.060.31−0.260.180.88
TAG (48:5)Lipids and lipid-like moleculesGlycerolipids0.410.030.370.410.030.31−0.180.340.88
TAG (49:2)Lipids and lipid-like moleculesGlycerolipids0.080.670.830.250.180.450.080.680.88
TAG (49:3)Lipids and lipid-like moleculesGlycerolipids0.110.580.780.270.160.450.030.890.94
TAG (50:2)Lipids and lipid-like moleculesGlycerolipids0.260.160.680.400.030.31−0.020.900.94
TAG (50:3) ALipids and lipid-like moleculesGlycerolipids0.220.250.680.370.050.31−0.100.590.88
TAG (50:5)Lipids and lipid-like moleculesGlycerolipids0.390.030.370.370.050.31−0.190.310.88
TAG (52:5)Lipids and lipid-like moleculesGlycerolipids0.160.420.680.240.200.46−0.050.800.89
TAG (52:6)Lipids and lipid-like moleculesGlycerolipids0.190.320.680.300.110.39−0.170.370.88
TAG (53:5)Lipids and lipid-like moleculesGlycerolipids0.160.400.680.300.120.390.070.720.88
TAG (54:5) BLipids and lipid-like moleculesGlycerolipids0.400.030.370.470.010.31−0.070.740.88
TAG (54:6) BLipids and lipid-like moleculesGlycerolipids0.470.010.370.450.010.31−0.210.280.88
TAG (54:7) ALipids and lipid-like moleculesGlycerolipids0.400.030.370.360.050.31−0.320.090.88
TAG (54:7) BLipids and lipid-like moleculesGlycerolipids0.330.080.530.370.050.31−0.180.340.88
TAG (54:8)Lipids and lipid-like moleculesGlycerolipids0.180.360.680.300.110.39−0.280.150.88
TAG (56:9)Lipids and lipid-like moleculesGlycerolipids0.210.270.680.340.070.35−0.190.320.88
TAG (58:9)Lipids and lipid-like moleculesGlycerolipids0.220.260.680.200.300.53−0.080.670.88
LPC (14:0)Lipids and lipid-like moleculesGlycerophospholipids0.020.900.940.160.400.62−0.150.450.88
LPC (16:1)Lipids and lipid-like moleculesGlycerophospholipids0.090.650.820.270.160.450.110.570.88
LPC (20:3)Lipids and lipid-like moleculesGlycerophospholipids0.170.370.680.280.140.440.140.470.88
LPC (14:0)Lipids and lipid-like moleculesGlycerophospholipids0.150.430.680.270.160.45−0.250.190.88
LPC (16:1)Lipids and lipid-like moleculesGlycerophospholipids0.190.320.680.360.060.310.060.760.88
LPC (20:3)Lipids and lipid-like moleculesGlycerophospholipids0.250.200.680.350.060.310.060.760.88
LPC (22:5)Lipids and lipid-like moleculesGlycerophospholipids0.010.970.970.070.720.840.280.140.88
PC (32:1)Lipids and lipid-like moleculesGlycerophospholipids0.030.860.910.140.480.720.070.710.88
PC (32:2)Lipids and lipid-like moleculesGlycerophospholipids−0.040.830.910.020.930.95−0.270.150.88
PC (33:1)Lipids and lipid-like moleculesGlycerophospholipids−0.280.150.68−0.070.710.840.160.400.88
PC (34:3)Lipids and lipid-like moleculesGlycerophospholipids0.150.430.680.230.220.47−0.040.820.89
PC (34:4)Lipids and lipid-like moleculesGlycerophospholipids−0.010.970.970.070.700.84−0.170.370.88
PC (36:3) ALipids and lipid-like moleculesGlycerophospholipids0.100.610.790.260.170.450.050.820.89
PC (36:5) BLipids and lipid-like moleculesGlycerophospholipids−0.200.300.68−0.040.830.910.120.530.88
PC (40:6) ALipids and lipid-like moleculesGlycerophospholipids0.010.960.97−0.020.910.95−0.040.830.89
PC (28:0)Lipids and lipid-like moleculesGlycerophospholipids−0.050.790.910.020.930.95−0.190.330.88
PC (30:0)Lipids and lipid-like moleculesGlycerophospholipids0.040.840.910.110.590.77−0.100.610.88
PC (31:0)Lipids and lipid-like moleculesGlycerophospholipids−0.220.260.68−0.040.850.910.150.440.88
PC (31:1)Lipids and lipid-like moleculesGlycerophospholipids−0.110.580.780.060.770.880.140.460.88
PC (32:1)Lipids and lipid-like moleculesGlycerophospholipids0.050.780.910.170.370.600.090.640.88
PC (32:2)Lipids and lipid-like moleculesGlycerophospholipids−0.040.820.910.040.840.91−0.250.190.88
PC (33:0)Lipids and lipid-like moleculesGlycerophospholipids−0.190.310.68−0.010.970.980.180.360.88
PC (33:1)Lipids and lipid-like moleculesGlycerophospholipids−0.140.470.700.060.750.870.190.330.88
PC (34:3) ALipids and lipid-like moleculesGlycerophospholipids−0.110.570.780.090.650.820.100.590.88
PC (34:3) BLipids and lipid-like moleculesGlycerophospholipids0.200.290.680.250.180.45−0.110.560.88
PC (34:3) CLipids and lipid-like moleculesGlycerophospholipids0.230.230.680.320.090.39−0.010.950.97
PC (34:4)Lipids and lipid-like moleculesGlycerophospholipids0.040.850.910.120.530.74−0.170.380.88
PC (35:4)Lipids and lipid-like moleculesGlycerophospholipids−0.340.080.53−0.100.590.770.110.580.88
PC (36:3) BLipids and lipid-like moleculesGlycerophospholipids0.160.400.680.340.080.350.080.690.88
PC (36:4) BLipids and lipid-like moleculesGlycerophospholipids0.160.410.680.240.200.46−0.050.780.88
PC (36:5) CLipids and lipid-like moleculesGlycerophospholipids−0.050.810.910.130.510.730.140.460.88
PC (36:5) DLipids and lipid-like moleculesGlycerophospholipids−0.160.400.680.000.980.980.100.620.88
PC (36:6)Lipids and lipid-like moleculesGlycerophospholipids−0.080.680.830.090.640.81−0.140.460.88
PC (37:5)Lipids and lipid-like moleculesGlycerophospholipids−0.380.040.37−0.140.460.700.080.700.88
PC (38:3)Lipids and lipid-like moleculesGlycerophospholipids0.250.190.680.300.120.390.120.530.88
PC (38:4) BLipids and lipid-like moleculesGlycerophospholipids0.260.180.680.250.200.460.050.780.88
PC (38:6) ALipids and lipid-like moleculesGlycerophospholipids−0.050.800.91−0.070.710.84−0.080.670.88
PC (38:6) CLipids and lipid-like moleculesGlycerophospholipids0.180.340.680.380.040.310.090.630.88
PC (38:7)Lipids and lipid-like moleculesGlycerophospholipids−0.130.490.710.110.570.770.150.440.88
PC (40:7) ALipids and lipid-like moleculesGlycerophospholipids0.060.760.910.140.470.720.120.550.88
PC (40:8)Lipids and lipid-like moleculesGlycerophospholipids−0.010.950.97−0.020.930.950.070.730.88
PC (42:6)Lipids and lipid-like moleculesGlycerophospholipids0.170.370.680.210.280.500.080.690.88
SM (d30:1) ALipids and lipid-like moleculesSphingolipids−0.190.320.68−0.130.500.730.080.680.88
SM (d32:2) ALipids and lipid-like moleculesSphingolipids−0.130.500.710.040.830.910.080.690.88
SM (d30:1) BLipids and lipid-like moleculesSphingolipids−0.180.360.68−0.100.600.770.070.720.88
SM (d32:0)Lipids and lipid-like moleculesSphingolipids−0.240.200.68−0.110.590.770.130.500.88
SM (d32:2) BLipids and lipid-like moleculesSphingolipids−0.040.830.910.120.530.740.070.730.88
IsoleucineOrganic acids and derivativesCarboxylic acids and derivatives0.250.190.680.050.790.890.010.970.98
Phe-TrpOrganic acids and derivativesCarboxylic acids and derivatives0.240.200.680.180.360.600.090.640.88
1 Metabolites at 32 weeks that were individually associated with total GWG in multiple linear regression models adjusted for maternal age, race, parity, and prepregnancy BMI (FDR < 0.05). Abbreviations: BMI, body mass index; FDR, false-discovery rate; GWG, gestational weight gain; hs-CRP: high-sensitive C-reactive protein; LPC, lysophosphatidylcolines; PC, phosphatidylcholine; PE, phosphatidylethanolamine; SM, sphingomyelin; TAG, triacylglycerol.
Publisher’s Note: MDPI stays neutral with regard to jurisdictional claims in published maps and institutional affiliations.

