
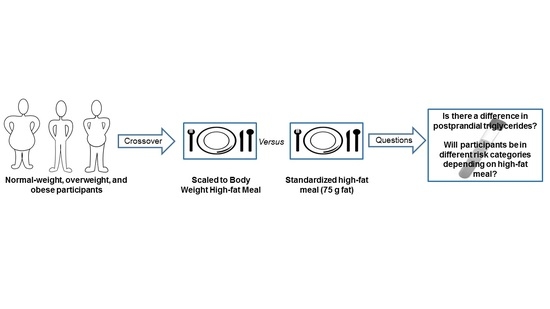
Comparison of a Standardized High-Fat Meal versus a High-Fat Meal Scaled to Body Mass for Measuring Postprandial Triglycerides: A Randomized Crossover Study


Abstract
:
1. Introduction
2. Results
3. Discussion
4. Materials and Methods
4.1. Participants
4.2. Initial Assessment
4.3. Fat Tolerance Tests
4.4. Statistical Analyses
Author Contributions
Funding
Institutional Review Board Statement
Informed Consent Statement
Data Availability Statement
Conflicts of Interest
References
- Bansal, S.; Buring, J.E.; Rifai, N.; Mora, S.; Sacks, F.M.; Ridker, P.M. Fasting compared with nonfasting triglycerides and risk of cardiovascular events in women. JAMA 2007, 298, 309–316. [Google Scholar] [CrossRef] [PubMed] [Green Version]
- Nordestgaard, B.G.; Benn, M.; Schnohr, P.; Tybjærg-Hansen, A. Nonfasting triglycerides and risk of myocardial infarction, ischemic heart disease, and death in men and women. JAMA 2007, 298, 299–308. [Google Scholar] [CrossRef] [PubMed] [Green Version]
- Keirns, B.H.; Sciarrillo, C.M.; Koemel, N.A.; Emerson, S.R. Fasting, non-fasting and postprandial triglycerides for screening cardiometabolic risk. J. Nutr. Sci. 2021, 10, e75. [Google Scholar] [CrossRef] [PubMed]
- Sciarrillo, C.M.; Koemel, N.A.; Kurti, S.P.; Emerson, S.R. Validity of an abbreviated, clinically feasible test for postprandial lipemia in healthy adults: A randomized cross-over study. Nutrients 2019, 11, 180. [Google Scholar] [CrossRef] [PubMed] [Green Version]
- Dixon, M.D.; Koemel, N.A.; Sciarrillo, C.M.; Lucas, E.A.; Jenkins, N.D.; Emerson, S.R. The Reliability of an Abbreviated Fat Tolerance Test: A Comparison to the Oral Glucose Tolerance Test. Clin. Nutr. ESPEN 2021, 43, 428–435. [Google Scholar] [CrossRef] [PubMed]
- Kolovou, G.D.; Watts, G.F.; Mikhailidis, D.P.; Pérez-Martínez, P.; Mora, S.; Bilianou, H.; Panotopoulos, G.; Katsiki, N.; Ooi, T.C.; Lopez-Miranda, J.; et al. Postprandial hypertriglyceridaemia revisited in the era of non-fasting lipid profiles: Executive summary of a 2019 expert panel statement. Curr. Vasc. Pharmacol. 2019, 17, 538–540. [Google Scholar] [CrossRef] [PubMed]
- Lim, S.; Kim, Y.J.; Khang, A.R.; Eckel, R.H. Postprandial dyslipidemia after a standardized high-fat meal in BMI-matched healthy individuals, and in subjects with prediabetes or type 2 diabetes. Clin. Nutr. 2021, 40, 5538–5546. [Google Scholar] [CrossRef] [PubMed]
- Friedrich, D.; Marschall, H.-U.; Lammert, F. Response of fibroblast growth factor 19 and bile acid synthesis after a body weight-adjusted oral fat tolerance test in overweight and obese NAFLD patients: A non-randomized controlled pilot trial. BMC Gastroenterol. 2018, 18, 1–10. [Google Scholar] [CrossRef] [PubMed] [Green Version]
- Whisner, C.M.; Angadi, S.S.; Weltman, N.Y.; Weltman, A.; Rodriguez, J.; Patrie, J.T.; Gaesser, G.A. Effects of low-fat and high-fat meals, with and without dietary fiber, on postprandial endothelial function, triglyceridemia, and glycemia in adolescents. Nutrients 2019, 11, 2626. [Google Scholar] [CrossRef] [PubMed] [Green Version]
- Klop, B.; Cohn, J.S.; van Oostrom, A.J.; van Wijk, J.P.; Birnie, E.; Cabezas, M.C. Daytime triglyceride variability in men and women with different levels of triglyceridemia. Clin. Chim. Acta 2011, 412, 2183–2189. [Google Scholar] [CrossRef] [PubMed]
- Cardello, A.V.; Schutz, H.G.; Lesher, L.L.; Merrill, E. Development and testing of a labeled magnitude scale of perceived satiety. Appetite 2005, 44, 1–13. [Google Scholar] [CrossRef] [PubMed]

| All (n = 16) | NW (n = 6) | OW (n = 5) | OB (n = 5) | |
|---|---|---|---|---|
| Participant Characteristics | ||||
| Age (years) | 28 ± 7 | 28 ± 10 | 29 ± 8 | 25 ± 6 |
| Mass (kg) | 84.5 ± 22.1 | 68.4 ± 13.8 | 81.6 ± 9.9 | 106.7 ± 21.8 |
| BMI (kg/m2) | 27.3 ± 6.2 | 21.6 ± 2.6 | 26.7 ± 0.8 | 34.7 ± 4.4 |
| WC (inches) | 34.5 ± 6.7 | 28.8 ± 4.1 | 33.8 ± 3.0 | 42.2 ± 3.8 |
| Body Fat (%) | 29.5 ± 11.4 | 19.3 ± 3.8 | 30.3 ± 9.4 | 40.8 ± 7.7 |
| Muscle mass (%) | 34.2 ± 5.5 | 38.3 ± 3.3 | 34.1 ± 5.9 | 29.4 ± 3.8 |
| Systolic BP (mmHg) | 120 ± 15 | 111 ± 10 | 122 ± 16 | 126 ± 17 |
| Diastolic BP (mmHg) | 80 ± 8 | 72 ± 3 | 83 ± 6 | 84 ± 8 |
| Fasting Glucose (mg/dL) | 101.5 ± 7.8 | 100.0 ± 9.5 | 105.0 ± 10.8 | 100.0 ± 3.4 |
| Fasting Total-C (mg/dL) | 151.3 ± 26.2 | 140.0 ± 18.3 | 153.0 ± 11.5 | 163.0 ± 40.8 |
| Fasting HDL-C (mg/dL) | 51.3 ± 11.5 | 53.0 ± 9.6 | 54.4 ± 17.5 | 46.2 ± 4.9 |
| Fasting LDL-C (mg/dL) | 83.8 ± 19.6 | 76.5 ± 7.4 | 83.6 ± 15.5 | 92.6 ± 30.9 |
| Fasting VLDL-C (mg/dL) | 16.3 ± 9.1 | 10.7 ± 2.3 | 14.8 ± 3.6 | 24.6 ± 12.5 |
| Fasting Non-HDL-C (mg/dL) | 100.1 ± 26.3 | 87.2 ± 9.1 | 98.6 ± 16.9 | 117.2 ± 39.7 |
| Fasting Triglycerides (mg/dL) | 81.4 ± 45.1 | 52.8 ± 11.7 | 74.8 ± 16.8 | 122.2 ± 61.9 |
| Fasting ALT (U/L) | 27.3 ± 6.4 | 23.8 ± 4.3 | 26.3 ± 7.6 | 31.0 ± 5.7 |
| Fasting AST (U/L) | 27.3 ± 6.3 | 25.5 ± 5.2 | 30.0 ± 10.0 | 26.6 ± 3.2 |
| Scaled High-fat Meal Characteristics | ||||
| Total energy (kcal) | 760.4 ± 198.6 | 615.6 ± 124.4 | 734.6 ± 89.2 | 959.9 ± 196.4 |
| Fat (g) | 59.2 ± 15.4 | 47.9 ± 9.7 | 57.2 ± 6.9 | 74.7 ± 15.3 |
| Carbohydrate (g) | 39.9 ± 10.4 | 32.3 ± 6.5 | 38.6 ± 4.7 | 50.4 ± 10.3 |
| Protein (g) | 19.0 ± 5.0 | 15.4 ± 3.1 | 18.4 ± 2.2 | 24.0 ± 4.9 |
| NW (n = 6) | OW (n = 5) | OB (n = 5) | |||||||
|---|---|---|---|---|---|---|---|---|---|
| Scaled | 75 g | p | Scaled | 75 g | p | Scaled | 75 g | p | |
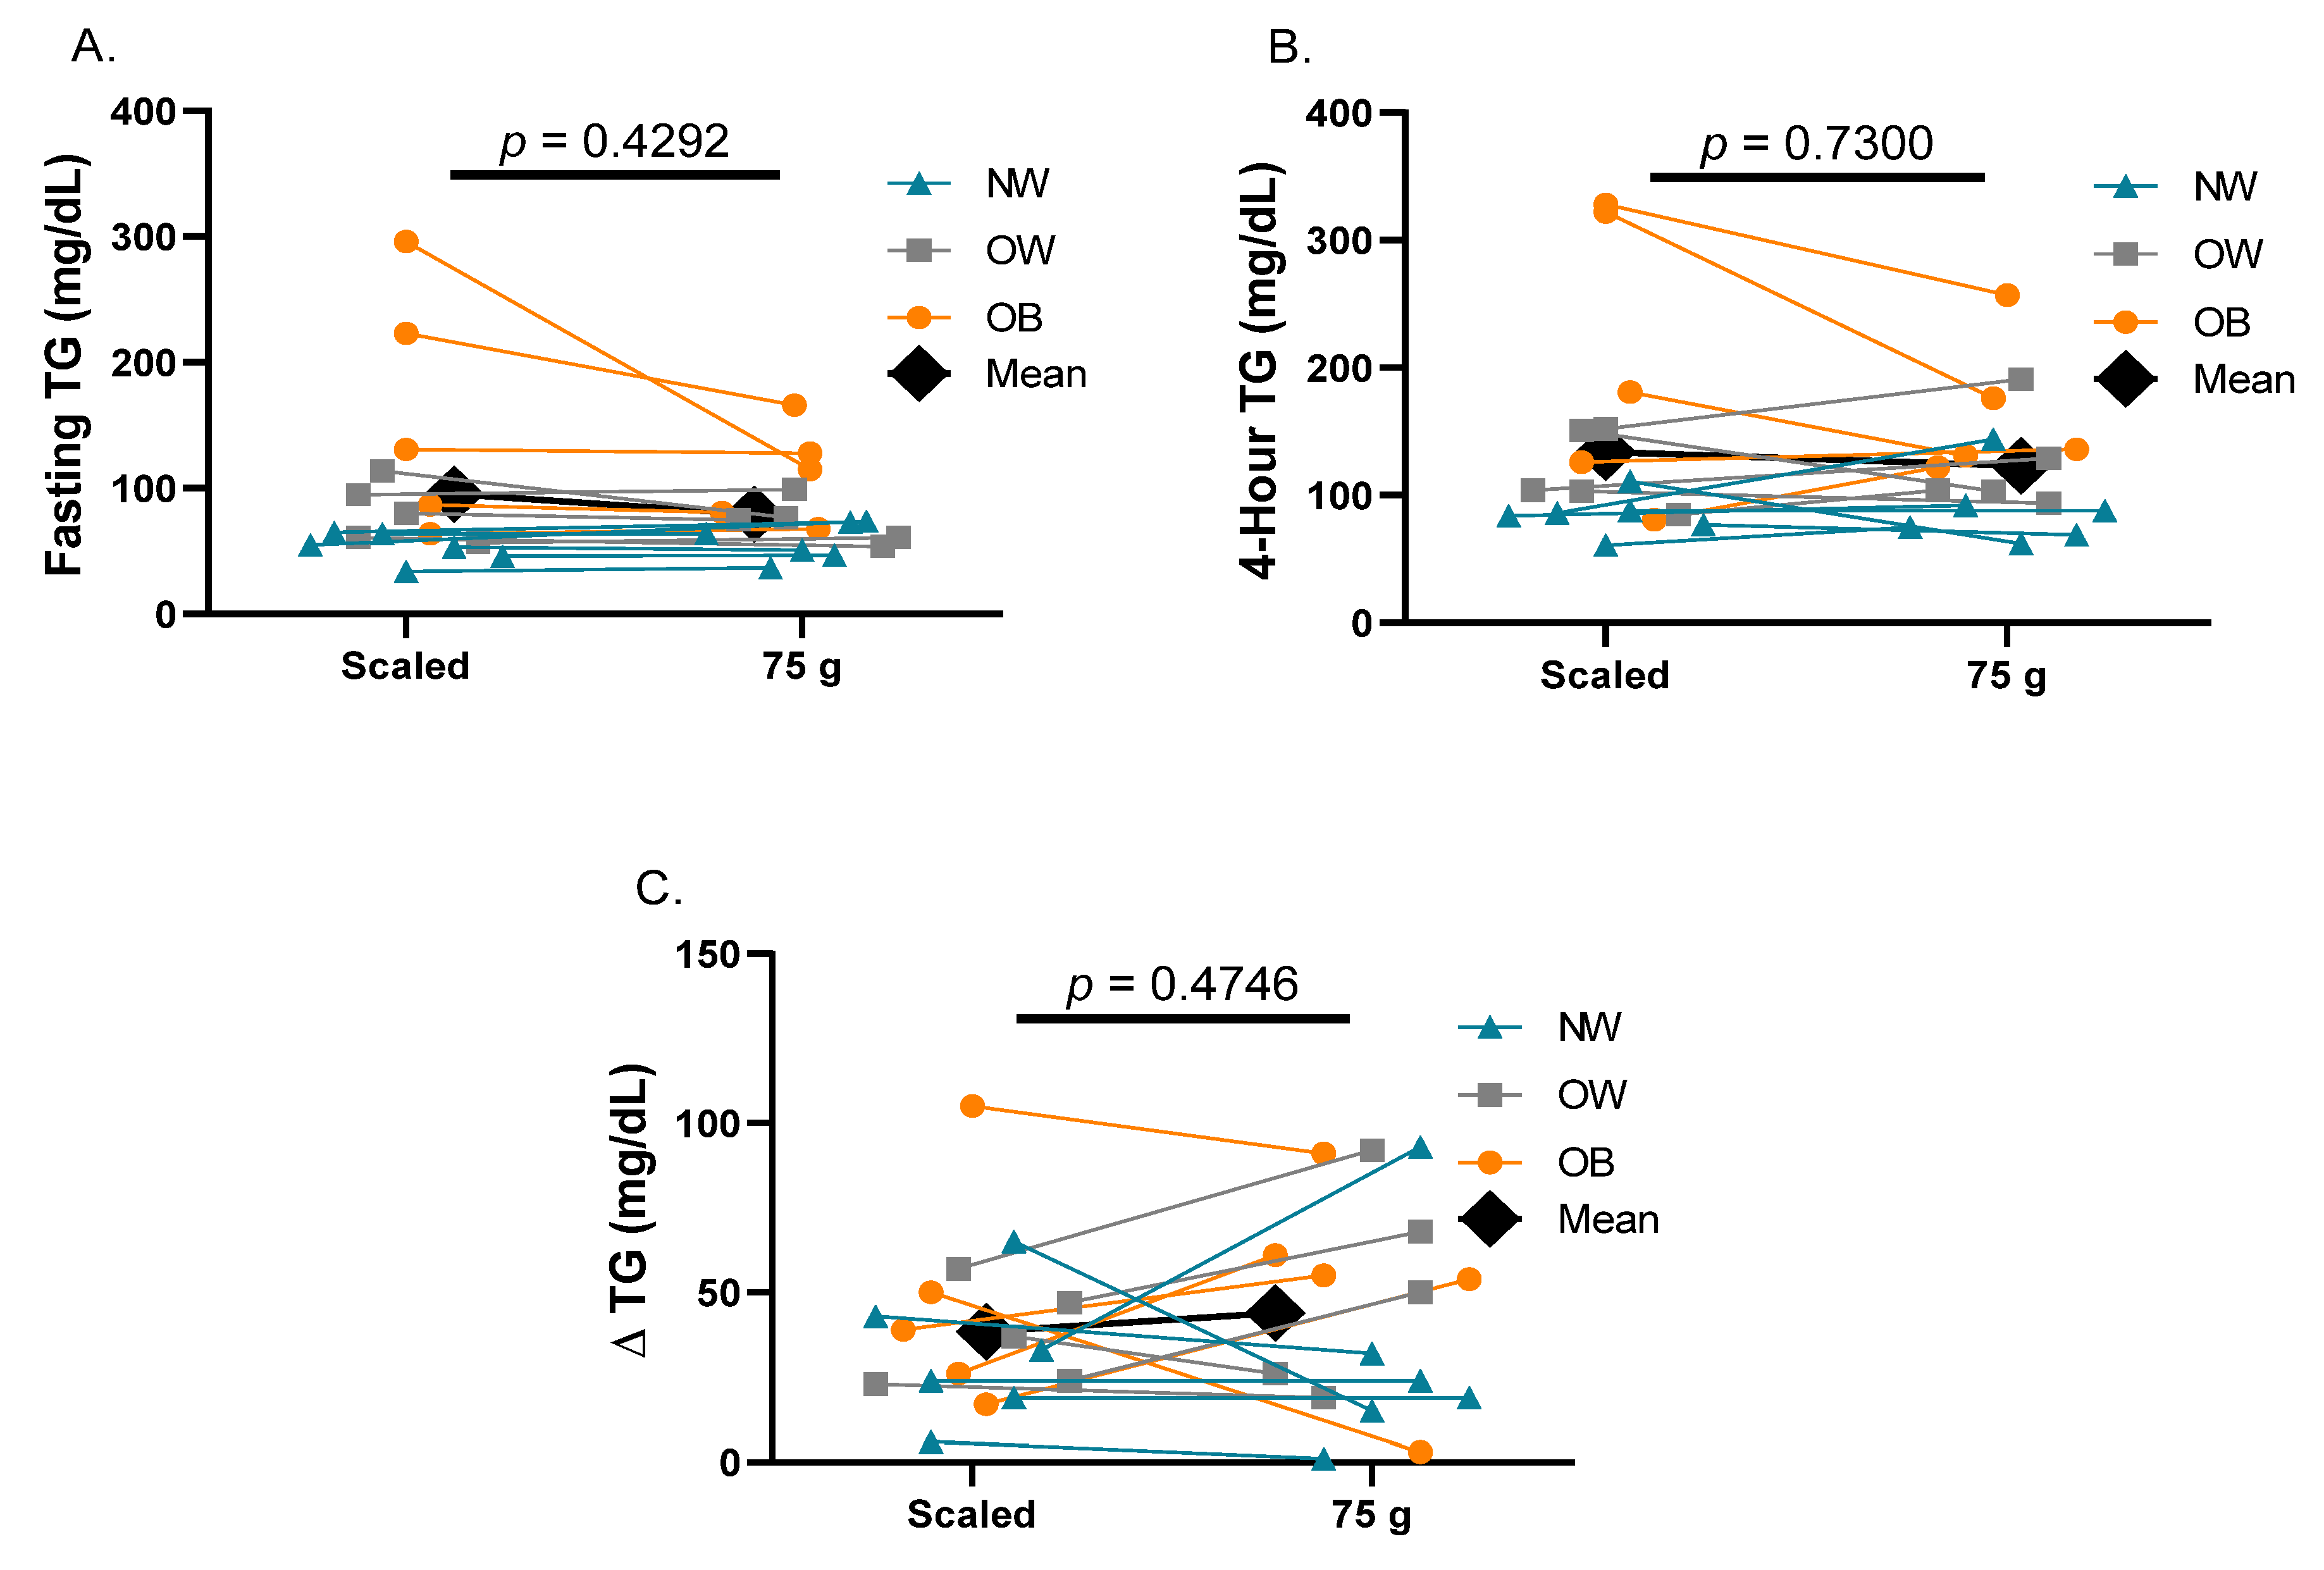
| Fasting TG (mg/dL) | 52.8 ± 11.7 | 57.7 ± 15.0 | 0.19 | 81.4 ± 23.8 | 73.2 ± 17.3 | 0.34 | 160.2 ± 97.3 | 111.6 ± 39.0 | 0.24 |
| 4 h TG (mg/dL) | 84.5 ± 16.3 | 88.3 ± 29.5 | 0.80 | 119.0 ± 30.6 | 124.2 ± 39.5 | 0.75 | 207.6 ± 112.9 | 164.4 ± 55.7 | 0.26 |
| Delta TG (mg/dL) | 31.7 ± 20.6 | 30.7 ± 32.2 | 0.95 | 37.6 ± 14.7 | 51.0 ± 30.1 | 0.21 | 47.4 ± 34.6 | 52.8 ± 31.7 | 0.75 |
Publisher’s Note: MDPI stays neutral with regard to jurisdictional claims in published maps and institutional affiliations. |
© 2022 by the authors. Licensee MDPI, Basel, Switzerland. This article is an open access article distributed under the terms and conditions of the Creative Commons Attribution (CC BY) license (https://creativecommons.org/licenses/by/4.0/).
Share and Cite
Keirns, B.H.; Sciarrillo, C.M.; Hart, S.M.; Emerson, S.R. Comparison of a Standardized High-Fat Meal versus a High-Fat Meal Scaled to Body Mass for Measuring Postprandial Triglycerides: A Randomized Crossover Study. Metabolites 2022, 12, 81. https://doi.org/10.3390/metabo12010081
Keirns BH, Sciarrillo CM, Hart SM, Emerson SR. Comparison of a Standardized High-Fat Meal versus a High-Fat Meal Scaled to Body Mass for Measuring Postprandial Triglycerides: A Randomized Crossover Study. Metabolites. 2022; 12(1):81. https://doi.org/10.3390/metabo12010081
Chicago/Turabian StyleKeirns, Bryant H., Christina M. Sciarrillo, Samantha M. Hart, and Sam R. Emerson. 2022. "Comparison of a Standardized High-Fat Meal versus a High-Fat Meal Scaled to Body Mass for Measuring Postprandial Triglycerides: A Randomized Crossover Study" Metabolites 12, no. 1: 81. https://doi.org/10.3390/metabo12010081
APA StyleKeirns, B. H., Sciarrillo, C. M., Hart, S. M., & Emerson, S. R. (2022). Comparison of a Standardized High-Fat Meal versus a High-Fat Meal Scaled to Body Mass for Measuring Postprandial Triglycerides: A Randomized Crossover Study. Metabolites, 12(1), 81. https://doi.org/10.3390/metabo12010081