Article

Different Metabolomic and Proteomic Profiles of Cerebrospinal Fluid in Ventricular and Lumbar Compartments in Relation to Leptomeningeal Metastases

1
Neuro-Oncology Clinic, National Cancer Center, Goyang 10408, Korea
2
Department of Cancer Control, Graduate School of Cancer Science and Policy, National Cancer Center, Goyang 10408, Korea
3
Cancer Diagnostics Branch, Division of Cancer Biology, Research Institute, National Cancer Center, Goyang 10408, Korea
4
Department of Cancer Biomedical Science, Graduate School of Cancer Science and Policy, National Cancer Center, Goyang 10408, Korea
5
Proteomics Core Facility, Research Core Center, Research Institute, National Cancer Center, Goyang 10408, Korea
6
Cancer Molecular Biology Branch, Division of Cancer Biology, Research Institute, National Cancer Center, Goyang 10408, Korea
*
Author to whom correspondence should be addressed.
These authors contributed equally to this work.
Metabolites 2022, 12(1), 80; https://doi.org/10.3390/metabo12010080
Submission received: 13 December 2021 / Revised: 30 December 2021 / Accepted: 13 January 2022 / Published: 14 January 2022
(This article belongs to the Special Issue Cerebrospinal Fluid Biomarkers for Understanding Disease Pathogenesis)

Abstract

:
The different molecular profiles of cerebrospinal fluid (CSF) between ventricular and lumbar compartments remain elusive, especially in the context of leptomeningeal metastasis (LM), which affects CSF flow. We evaluated CSF metabolomic and proteomic profiles based on the compartments and the diagnosis of spinal LM, proved by MRI from 20 paired ventricular and lumbar CSF samples of LM patients, including 12 spinal LM (+) samples. In metabolome analysis, 9512 low-mass ions (LMIs) were identified—7 LMIs were abundant in all lumbar versus paired ventricular CSF samples, and 3 LMIs were significantly abundant in all ventricular CSF. In comparisons between spinal LM (+) CSF and LM (−) CSF, 105 LMIs were discriminative for spinal LM (+) CSF. In proteome analysis, a total of 1536 proteins were measured. A total of 18 proteins, including complement C3, were more highly expressed in all lumbar CSF, compared with paired ventricular CSF, while 82 proteins, including coagulation factor V, were higher in the ventricular CSF. Of 37 discriminative proteins, including uteroglobin and complement component C8 gamma chain, 4 were higher in all spinal LM (+) CSF versus spinal LM (−) CSF. We further evaluated metabolic pathways associated with these discriminative proteins using the Gene Ontology database. We found that 16/17 spinal LM (+) pathways, including complement activation, were associated with lumbar discriminative proteins, whereas only 2 pathways were associated with ventricular-discriminative proteins. In conclusion, we determined that metabolite and protein profiles differed between paired lumbar and ventricular CSF samples. The protein profiles of spinal LM (+) CSF showed more similarity with the lumbar CSF than the ventricular CSF. Thus, we suggest that CSF LMIs and proteins could reflect LM disease activity and that LM-associated differences in CSF are more likely to be present in the lumbar compartment.

1. Introduction

Leptomeningeal metastasis (LM) is a devastating complication of cancer that occurs in 1–15% of solid tumor patients [1,2,3] with a median overall survival of about 8 weeks without treatment [4,5]. Recent studies have shown better prognosis of LM patients with non-small-cell lung cancer who received epidermal growth factor receptor tyrosine kinase inhibitors. In the studies, median survival times were more than 1 year [6,7]. Clinical features of LM in cancer patients, which is diagnosed by cerebrospinal fluid (CSF) cytology, include headache, cranial neuropathy, and cauda equina symptoms.
Interestingly, positive cytological results in LM patients depend on the CSF sampling compartment. For example, lumbar CSF samples were more likely to yield higher positive cytology rates compared with ventricular CSF samples in patients with LM, especially in those who had spinal symptoms [8,9]. Because CSF circulates throughout the central nervous system (CNS), the components of the CSF should not depend on the sampling site. However, the distribution of the molecules in the CSF depends not on diffusion but on the CSF flow between compartments [10], and that flow is frequently disturbed when a CNS disease, such as LM, is present [9,11,12,13]. Thus, we could assume that ventricular CSF, proximal to the leptomeningeal space where LM occurs, would not reflect LM activity, while the lumbar/cisternal CSF would inevitably include molecules from cancer cell activity in LM. This ‘innocent’ ventricular CSF has been suggested by studies that reported differences in CSF cytology or macromolecular profiles between ventricular and lumbar CSF [8,14]. In a previous study, we determined that cell counts and protein levels are significantly higher in lumbar CSF versus paired ventricular CSF in patients with LM, and those clinical profiles in lumbar CSF are increased with the presence of spinal LM [12].
Constituents of the CSF, such as metabolites, extracellular vesicles, extracellular DNA, and microRNA (miRNA), have been studied as possible biomarkers for CNS disease [15,16,17,18]. Among these, low-mass ion (LMI) metabolites, detected by mass spectrometry (MS), have revealed a characteristic profile in cancer patients reflecting cancer metabolism and interactions with the microenvironment [19]. LMI profiling may serve as a valid method for the early diagnosis of cancer development and metastasis [20]. In our previous study, CSF metabolomic profiles distinguished LM from primary brain tumors and parenchymal brain metastasis in a limited cohort of 192 patients [21]. With recent advances in proteomics technology, more than 1000 proteins were found in a small volume (<1 mL) of CSF [22], and brain-specific proteins were identified as novel biomarkers for various CNS diseases [23,24,25] using a human proteome mapping database [26].
In this study, we analyzed the metabolomic and proteomic profiles of ventricular and lumbar CSF in 20 paired samples from LM patients and compared the profiles of 12 LM (+) spinal CSF samples versus 7 LM (−) spinal CSF samples. We expected that characterization of biomolecules in lumbar CSF from patients who had spinal LM compared with lumbar CSF from patients who had not spinal LM would reveal a biomolecule that was characteristic of local LM activity. We performed Kyoto Encyclopedia of Genes and Genomes (KEGG) database metabolic pathway analysis and Gene Ontology database molecular pathway analysis with LMI and proteomic profiles and estimated causal associations between metabolic and proteomic profiles using pathways mapping. We determined whether discriminative profiles of lumbar CSF compared with ventricular CSF (based on topographic differences according to CSF compartments) were similar to profiles of spinal LM (+) samples versus spinal LM (−) samples, with the assumption that the lumbar CSF carries more LM-related biomolecules than the upstream ventricular CSF.

2. Results

2.1. Clinical Characteristics of the Patients

Our strategy to study the comparative profiling of different CSF sampling site is illustrated in Figure 1A. The clinical characteristics of the 20 patients are summarized in Table 1. There were 11 male patients and 9 female patients. The median age was 56.5 years (range 35–71). The most common primary cancer was non-small-cell lung cancer (50%), followed by breast cancer (20%) and melanoma (10%). Two patients had double primary colorectal and lung cancer and in one patient the primary cancer was unknown.
Gadolinium-enhanced brain MRI verified LM for 15 patients (75%) and was suggestive of LM for the other 5 patients. Accompanying parenchymal brain metastasis was found in 14 patients. Spine MRIs were evaluated in all but 1 patient, and 12 patients (63%) presented with diffuse/nodular enhancement of the spinal cord or cauda equina.

2.2. CSF Profiles by Comparment and by Presence of Spinal LM

Comparisons of CSF profiles between paired ventricular and lumbar CSF samples are shown in Table 2. Median total cell count was 2 cells/mm3 (range, 0–13) in ventricular CSF and was significantly lower than the lumbar CSF (median, 13 cells/mm3, range, 0–160 p < 0.001). The CSF protein level was also significantly lower in ventricular CSF (median, 11 mg/dL, range, 5–767) compared with that of lumbar CSF (median, 56 mg/dL, range, 12–294, p = 0.013). The median glucose concentration of ventricular CSF was 72 mg/dL (range, 18–129), significantly higher than the median lumbar CSF concentration of 50 mg/dL (range, 14–143) (p = 0.047).
In comparisons of CSF profiles between spinal LM (+) and LM (−) lumbar CSF, protein levels were significantly higher in spinal LM (+) samples than LM (−) samples (protein level 65 mg/dL (range, 40–294) versus 32 mg/dL (range, 12–82), Table 2), but cell counts and glucose levels did not show statistical significance, probably due to the relatively small number of samples.

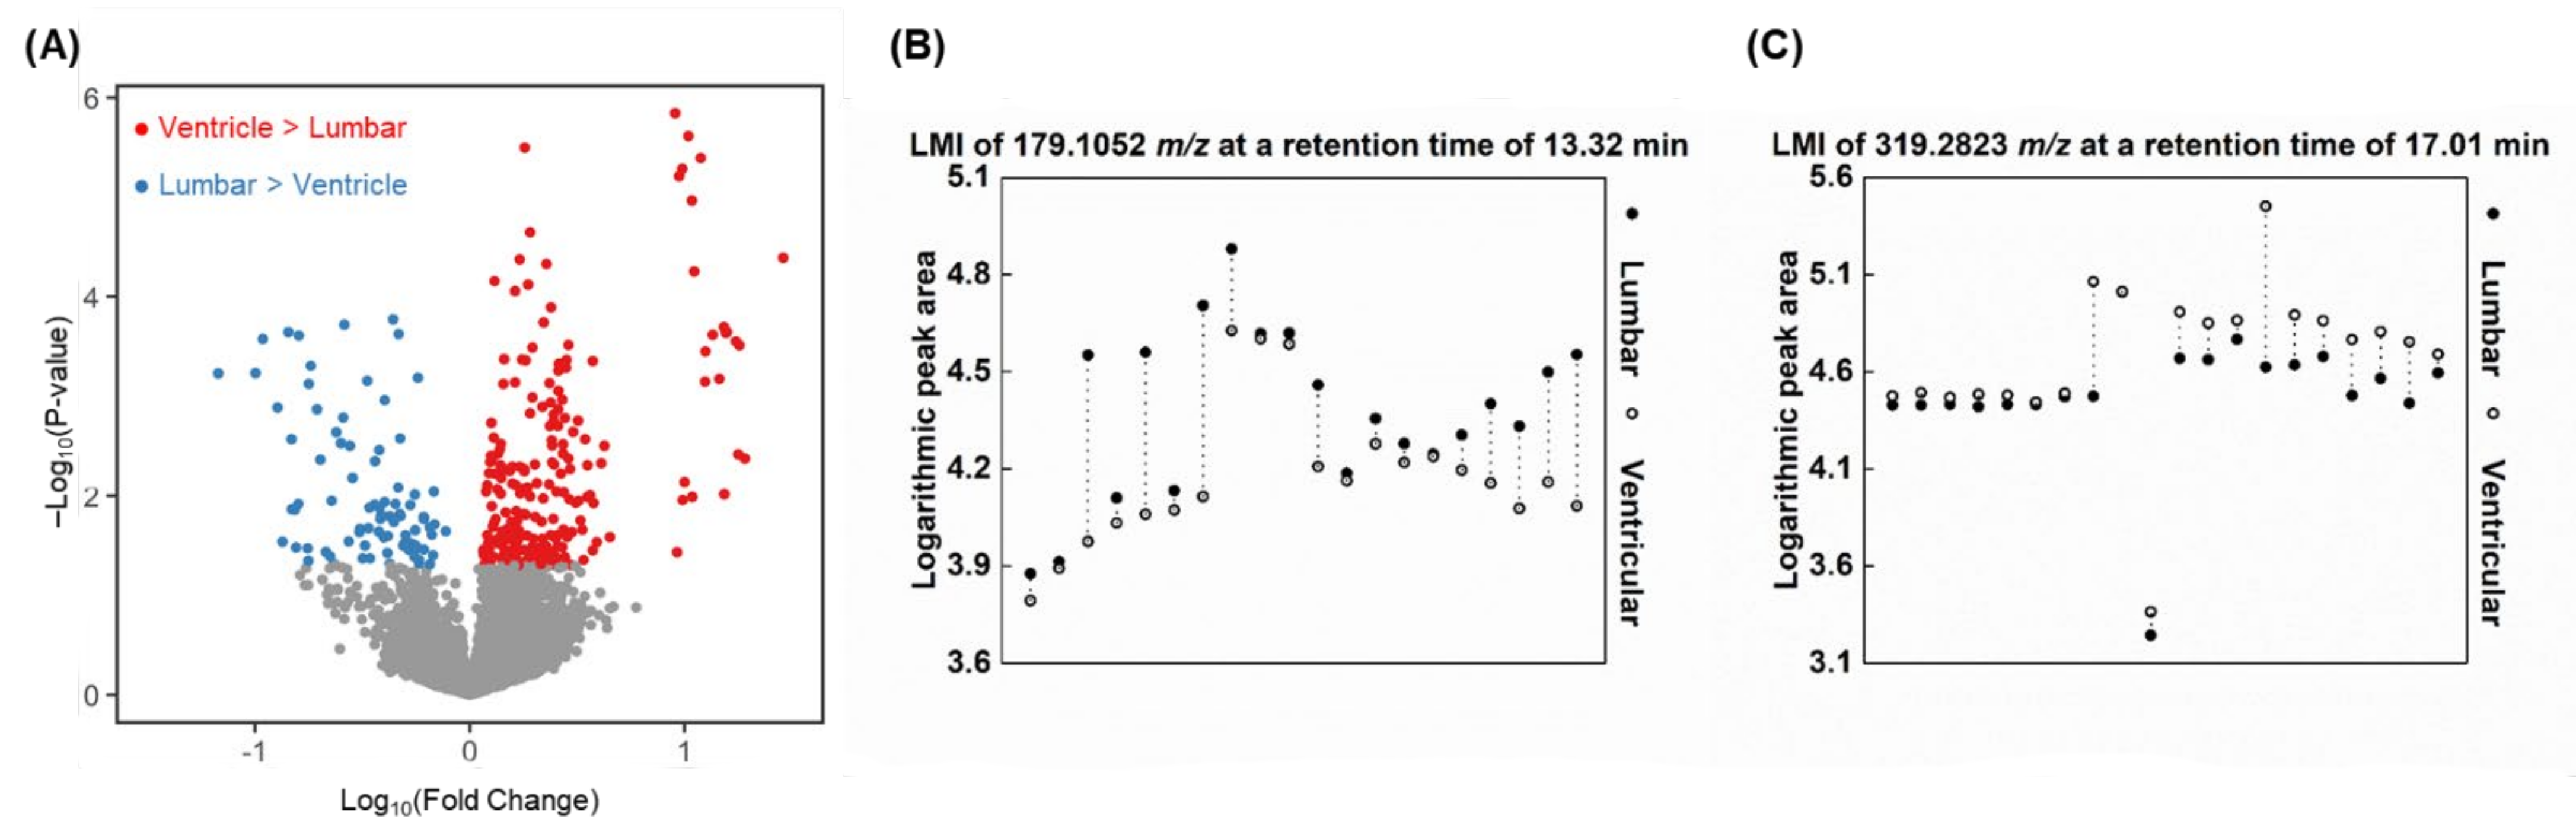
2.3. Metabolomic Profiles for Paired Ventricular and Lumbar CSF Samples

In a same CSF sample, we performed metabolomic and proteomic analyses using appropriate experimental methods (Figure 1B). In metabolites analysis, a total of 9512 LMIs were identifiable by MS in both the ventricular and lumbar CSF samples. Each LMI was identified by mass–charge ratio (m/z) and retention time (min) and the peak area of each LMI was normalized using a per-sample scaling factor (see details in the Section 4) and transformed to logarithms. We evaluated the distribution of discriminative LMIs using groupwise comparisons (lumbar versus ventricular) for each LMI peak area (Supplementary Table S1). A total of 4247 LMIs (45%) were higher abundant in the lumbar CSF than the ventricular CSF, and 86 of them (2.0%) were statistically significant (Figure 2A, p < 0.05). Conversely, a total of 5265 LMIs (55%) were higher abundant in the ventricular CSF than the lumbar CSF, and 223 LMIs (4.2%) were statistically significant (p < 0.05). However, no LMIs showed a threshold level that differentiated lumbar and ventricular CSF completely.
We then analyzed the differences in peak area between paired lumbar and ventricular CSF samples (Supplementary Table S1). A total of 7 LMIs had higher abundance in lumbar CSF compared with ventricular CSF in all 20 patients (Figure 2B), another 17 LMIs had higher abundance in lumbar CSF in 19/20 patients, and another 69 LMIs had higher abundance in lumbar CSF in 18/20 patients. The top 10 discriminative LMIs for lumbar CSF (based on the largest peak area differences) were used to search for candidate metabolites in Human Metabolite Database (HMDB) (search condition; mass tolerance ± 0.05, H+ adduct in positive mode, delta (ppm) < 100, and endogenous origin) and the results are listed in Table 3. These include a class of fatty acyl (methyl 4-phenylbutanoatem, nonate), pteridine (5-formiminotetrahydrofolic acid), carboxylic acids (alanylvaline, leucyl-glycine), and indole (indolepropionamide). When we searched LMIs that showed discriminatively higher abundance levels in ventricular CSF compared with paired lumbar samples, only 3 LMIs were higher in all 20 patients (Figure 2C), while another 31 LMIs were higher in the ventricular CSF of 19/20 patients, and another 67 LMIs were higher in 18/20 patients. The top 10 discriminative LMIs in ventricular CSF were used to search for candidate metabolites and the results are listed in Table 4. These include a class of steroids (pregnenolone, cortolone-3-glucuronide) and fatty acyls.

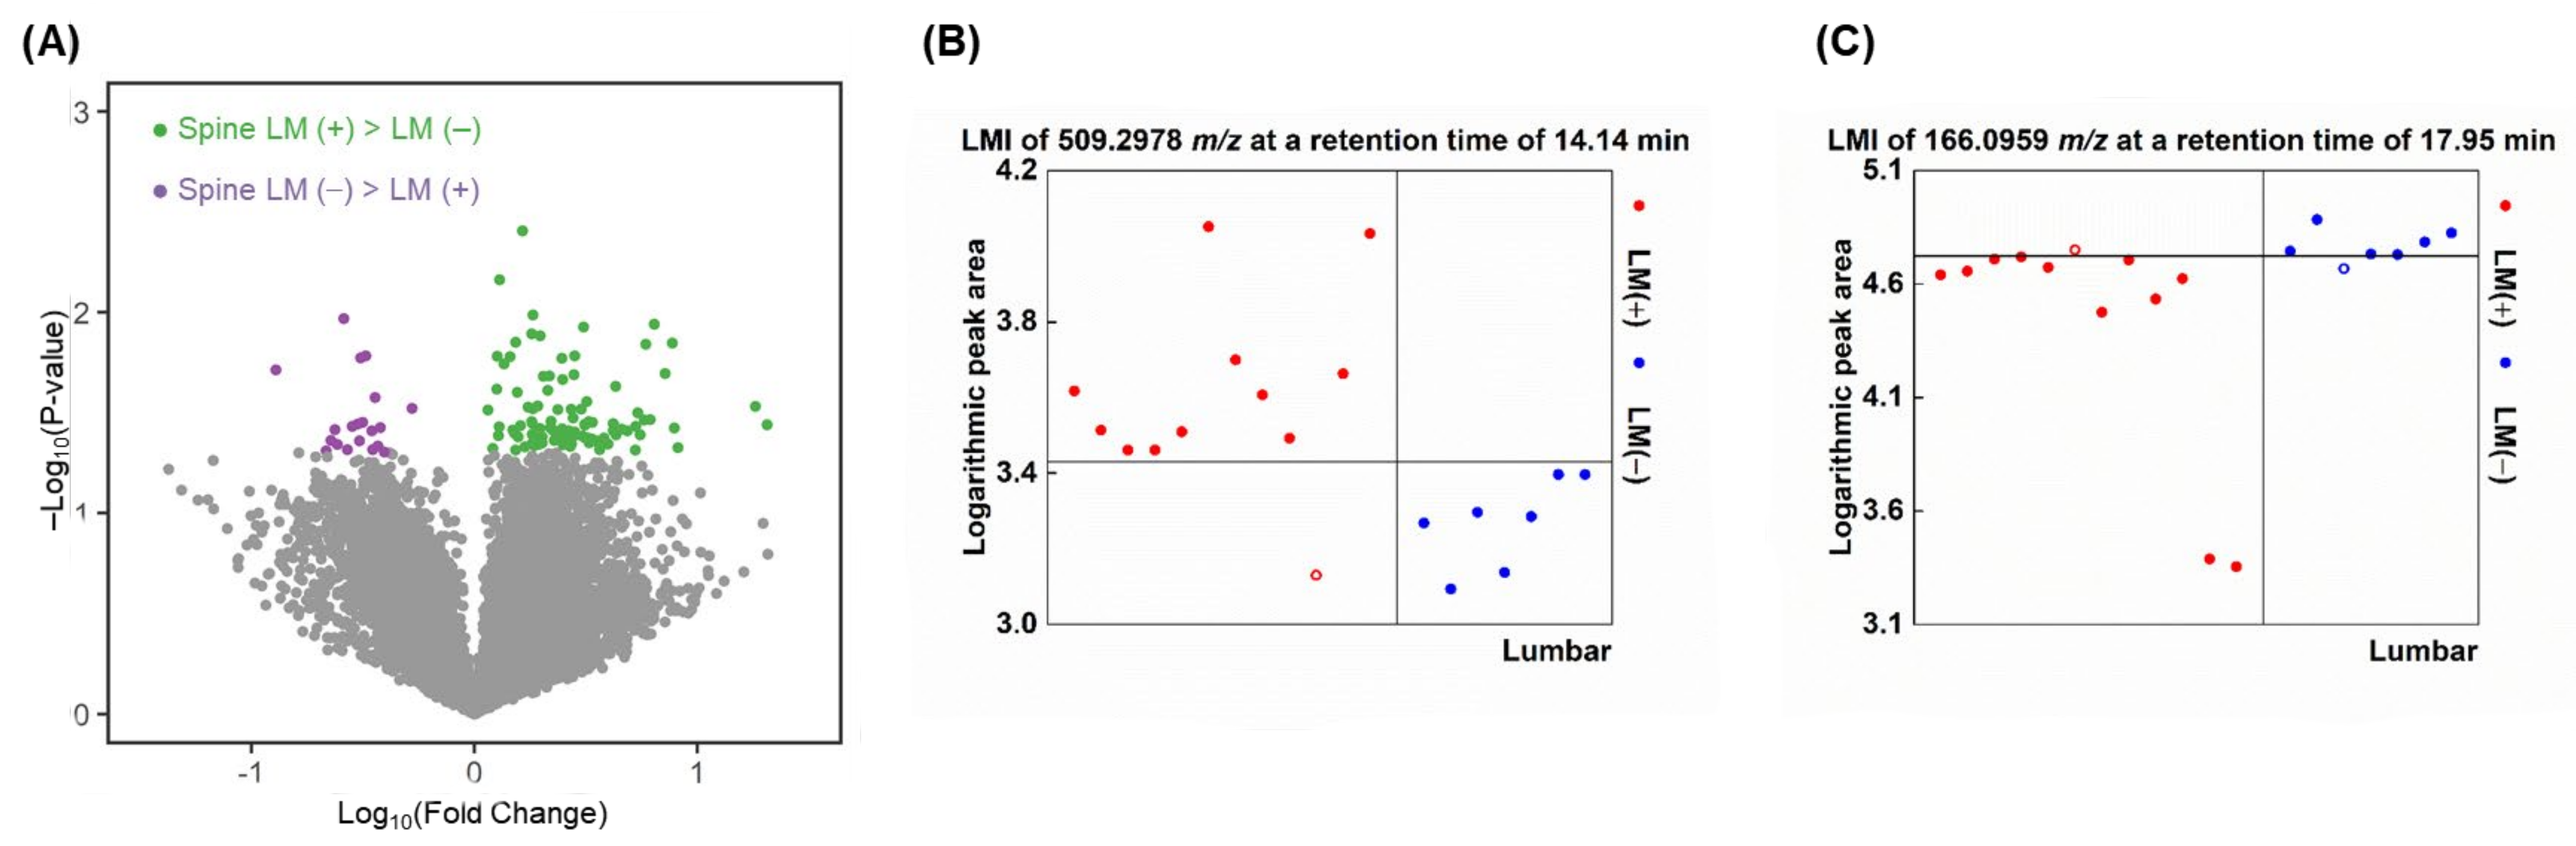
2.4. LMIs for Discriminating Spinal LM (+) from Spinal LM (−) Lumbar CSF

We searched for LMIs that distinguish spinal LM (+) lumbar CSF from spinal LM (−) lumbar CSF, which would reflect the local disease activity of LM at the lumbar spinal cord (Supplementary Table S1). In groupwise comparisons of the peak area of each, 5451 LMIs (57%) were higher in the spinal LM (+) CSF than the spinal LM (−) CSF, and 97 LMIs (1.8%) were significantly higher (p < 0.05, Figure 3A); 4061 LMIs (43%) were higher in the spinal LM (−) CSF than LM (+) CSF, but only 20 LMIs (0.5%) were significantly higher (p < 0.05, Figure 3A).
When we defined a discriminative LMI as having a summed sensitivity and specificity >160% at the threshold value for each LMIs showing the highest sum of sensitivity and specificity, a total of 105 LMIs were discriminative for the spinal LM (+) CSF. Among these, 6 LMIs were higher in the spinal LM (+) samples at a summed sensitivity and specificity >180% (Figure 3B), and another 11 LMIs showed a summed sensitivity and specificity >170%. Meanwhile, 57 LMIs were discriminative for the spinal LM (−) samples. Among these, no LMIs had a summed sensitivity and specificity >180%, and only 5 LMIs were expressed higher in the spinal LM (−) CSF at a summed sensitivity and specificity >170% (Figure 3C). The top 10 discriminative LMIs for spinal LM (+) CSF were used to identify candidate molecules that are listed in Table 5. These include phosphatidic acid, sphinganine, fatty acyls (10-hydroxy-D4-neuroprostane, palmitoylcarnitine), dipeptide (leucylproline), and carboxylic acid (methionine sulfoxide, N-stearoyl phenylalanine).

2.5. Metabolic Pathways That Involve the Discriminative LMIs

Using the MetaboAnalyst online platform, we searched for metabolic pathways involving the discriminative LMIs that had an identifiable KEGG ID to determine the types of metabolic pathways that could be unique to a CSF compartment and LM disease state (Supplementary Table S2). A total of 69 discriminative lumbar LMIs were involved in 53 metabolic pathways (Supplementary Table S2). The top 10 pathways (in order of p-value) involving the lumbar discriminative LMIs were as follows: 1-carbon metabolism, mediated by folate; sphingolipid metabolism; alanine, aspartate, and glutamate metabolism; histidine metabolism; arginine and proline metabolism; arginine biosynthesis; aminoacyl-tRNA biosynthesis; ubiquinone and other terpenoid-quinone biosynthesis; vitamin B6 metabolism; and tyrosine metabolism (Supplementary Figure S1A). A total of 63 discriminative ventricular LMIs were involved in 39 metabolic pathways (Supplementary Table S2). The top 10 pathways involving the ventricular-discriminative LMIs were as follows: arachidonic acid metabolism, sphingolipid metabolism, steroid biosynthesis, folate biosynthesis, caffeine metabolism, ether lipid metabolism, linoleic acid metabolism, arginine biosynthesis, nitrogen metabolism, and phosphonate and phosphinate metabolism (Supplementary Figure S1B). A total of 86 LMIs discriminative for spinal LM (+) CSF were involved in 39 metabolic pathways (Supplementary Table S2). The top 10 pathways involving the spinal LM (+)-discriminative LMIs were as follows: linoleic acid metabolism, arachidonic acid metabolism, sphingolipid metabolism, one-carbon metabolism mediated by folate, arginine and proline metabolism, steroid biosynthesis, riboflavin metabolism, glycerophospholipid metabolism, folate biosynthesis, and nitrogen metabolism (Supplementary Figure S1C).

2.6. Similarities of LMIs between Spinal LM and CSF Compartments

To explore possible associations of metabolomic profiles between CSF compartments and spinal LM infiltration, we plotted fold change (FC) differences for ventricular versus lumbar and spinal LM (+) samples versus spinal LM (−) (Supplementary Figure S2A). In this plot, each quadrant represents the similarity of LMIs with the X-axis representing the FC of spinal LM (+) versus LM (−) and the Y-axis representing the FC of ventricular versus lumbar. For example, LMIs in the lower right quadrant were more abundant in lumbar than ventricular CSF and in spinal LM (+) samples than spinal LM (−) samples. In the scatter plot, the correlation coefficient r was 0.272249, indicating a low correlation between the CSF sample site and the spinal LM metabolic profile.
We determined which metabolic pathways were shared among CSF compartments (Supplementary Figure S2B). Thirty-one metabolic pathways, including sphingolipid metabolism, were common to discriminative LMIs for both lumbar and ventricular CSF samples. A total of 8 out of 39 (21%) metabolic pathways, including steroid biosynthesis, had unique discriminative LMIs for ventricular CSF, and 22 out of 53 (42%) pathways, including pyruvate metabolism, were unique to discriminative LMIs for lumbar CSF. We also investigated pathways shared between the CSF compartments and spinal LM (+) samples (Supplementary Figure S2C,D). Twenty-four metabolic pathways, including one-carbon metabolism mediated by folate and glycerophospholipid metabolism, were common to all three groups. A total of 28 metabolic pathways, including biosynthesis of unsaturated fatty acids, were common between the ventricular and spinal LM (+) samples, and 33 metabolic pathways, including histidine metabolism, were common to both the lumbar and spinal LM (+) metabolic pathways. The proportion of either ventricular or lumbar pathways that were shared with spinal LM (+) pathways were not significantly different (p = 0.34).

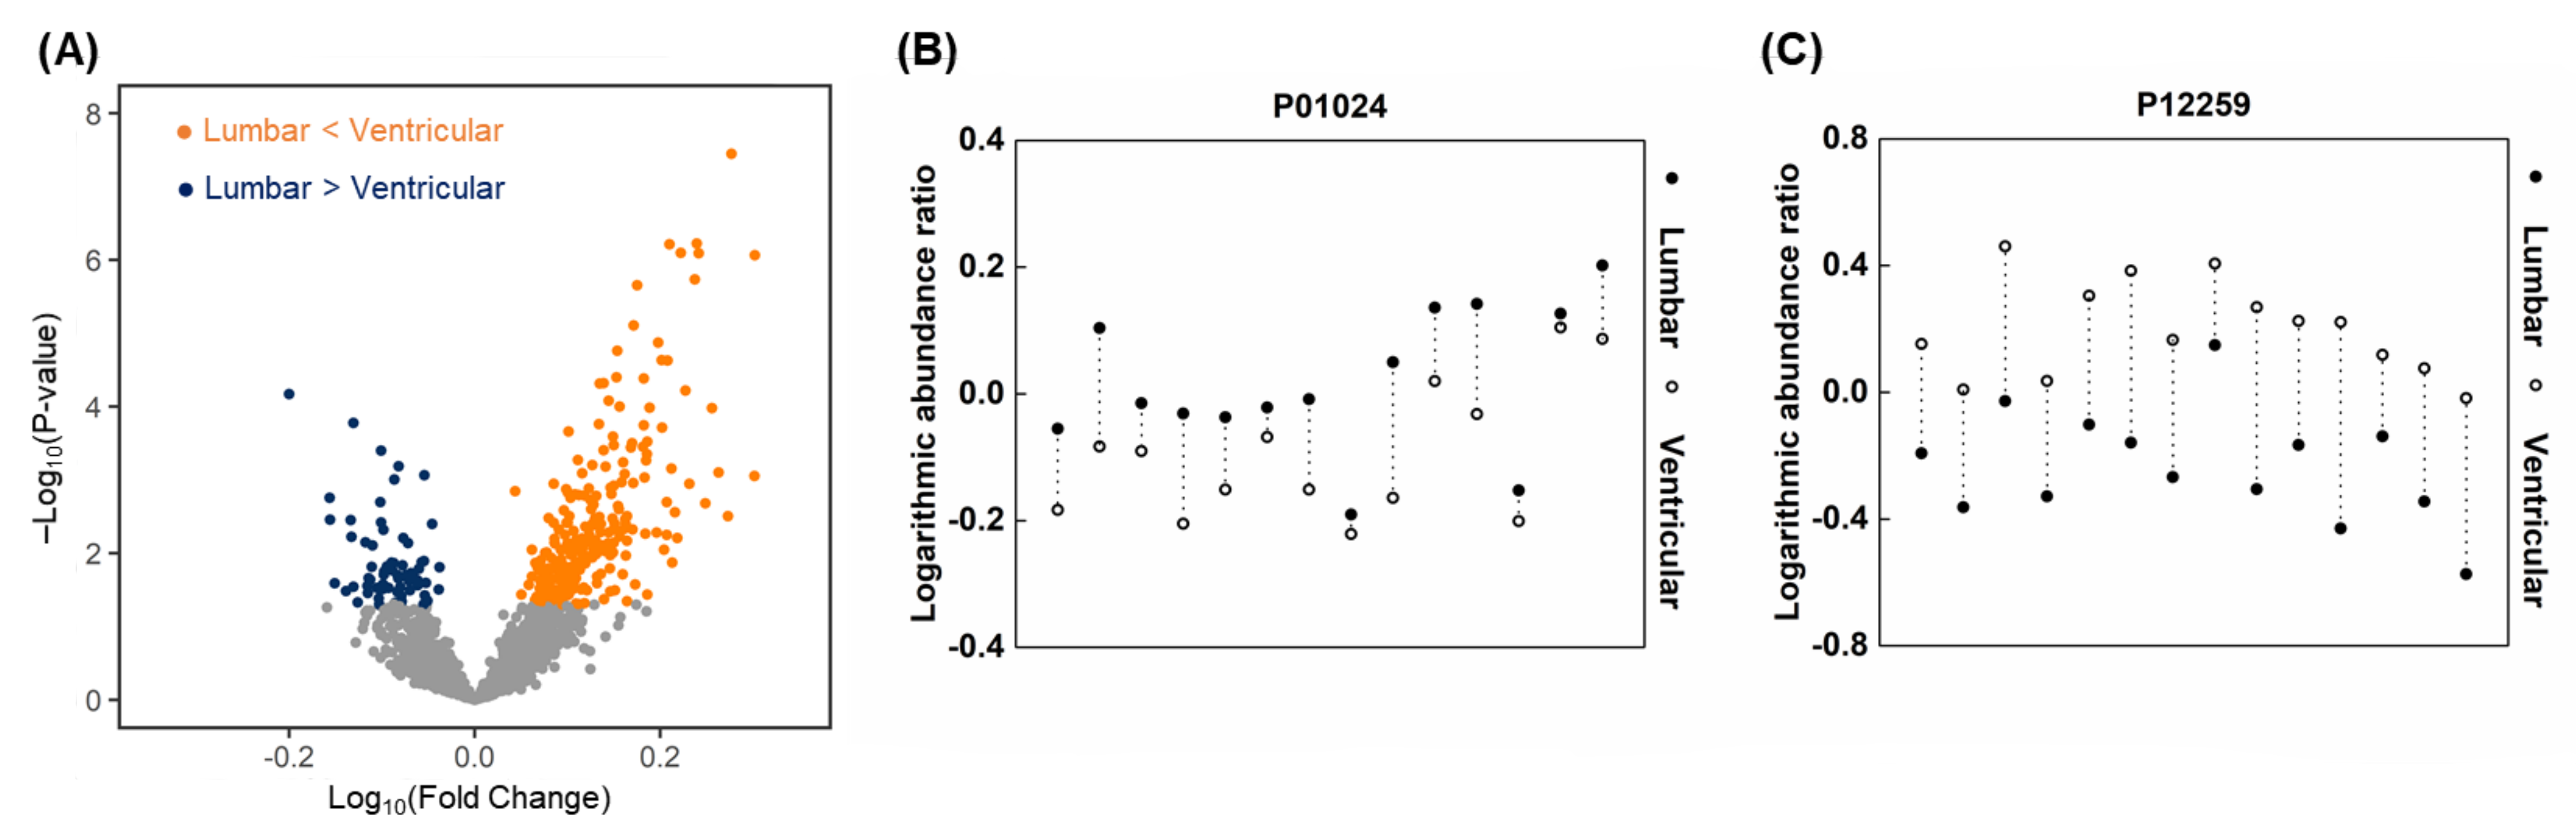
2.7. Proteomic Profiles in Paired Ventricular and Lumbar CSF Samples

A total of 1536 proteins were measured, and their abundance ratios were calculated in 14 out of the 20 paired ventricular and lumbar CSF samples available for proteomics (see Methods and Supplementary Table S3). In groupwise comparisons, there was no single protein above a threshold level that differentiated lumbar CSF from ventricular CSF completely with a pattern of lumbar CSF > ventricular CSF. However, one protein (P51674, GPM6A, neuronal membrane glycoprotein M6-α) had a higher peak area in all ventricular CSF samples than lumbar samples. In this comparison of protein abundance ratios, 532 proteins (35%) were higher in the lumbar CSF than the ventricular CSF, and 97 of them (18%) were significantly higher (Figure 4A). In contrast, 1004 proteins (65%) were higher in the ventricular than the lumbar CSF, and 342 of those proteins (34%) were significantly higher.
We compared the relative abundance of each protein in paired lumbar and ventricular CSF. A total of 18 proteins, including complement C3 (P01024), were more highly expressed in all lumbar CSF samples compared with ventricular CSF (Table 6, Figure 4B), 41 proteins were more highly expressed in 13/14 pairs, and another 52 proteins were more highly expressed in 12/14 pairs (Supplementary Table S3). As in a groupwise comparison, more proteins were more highly expressed in ventricular CSF than their lumbar CSF samples. A total of 82 proteins, including coagulation factor V (P12259), were more highly expressed in ventricular CSF than in lumbar CSF samples in all 14 pairs (Table 6, Figure 4C), 120 proteins were higher in 13/14 pairs, and another 145 proteins were higher in 12/14 pairs (Supplementary Table S3).

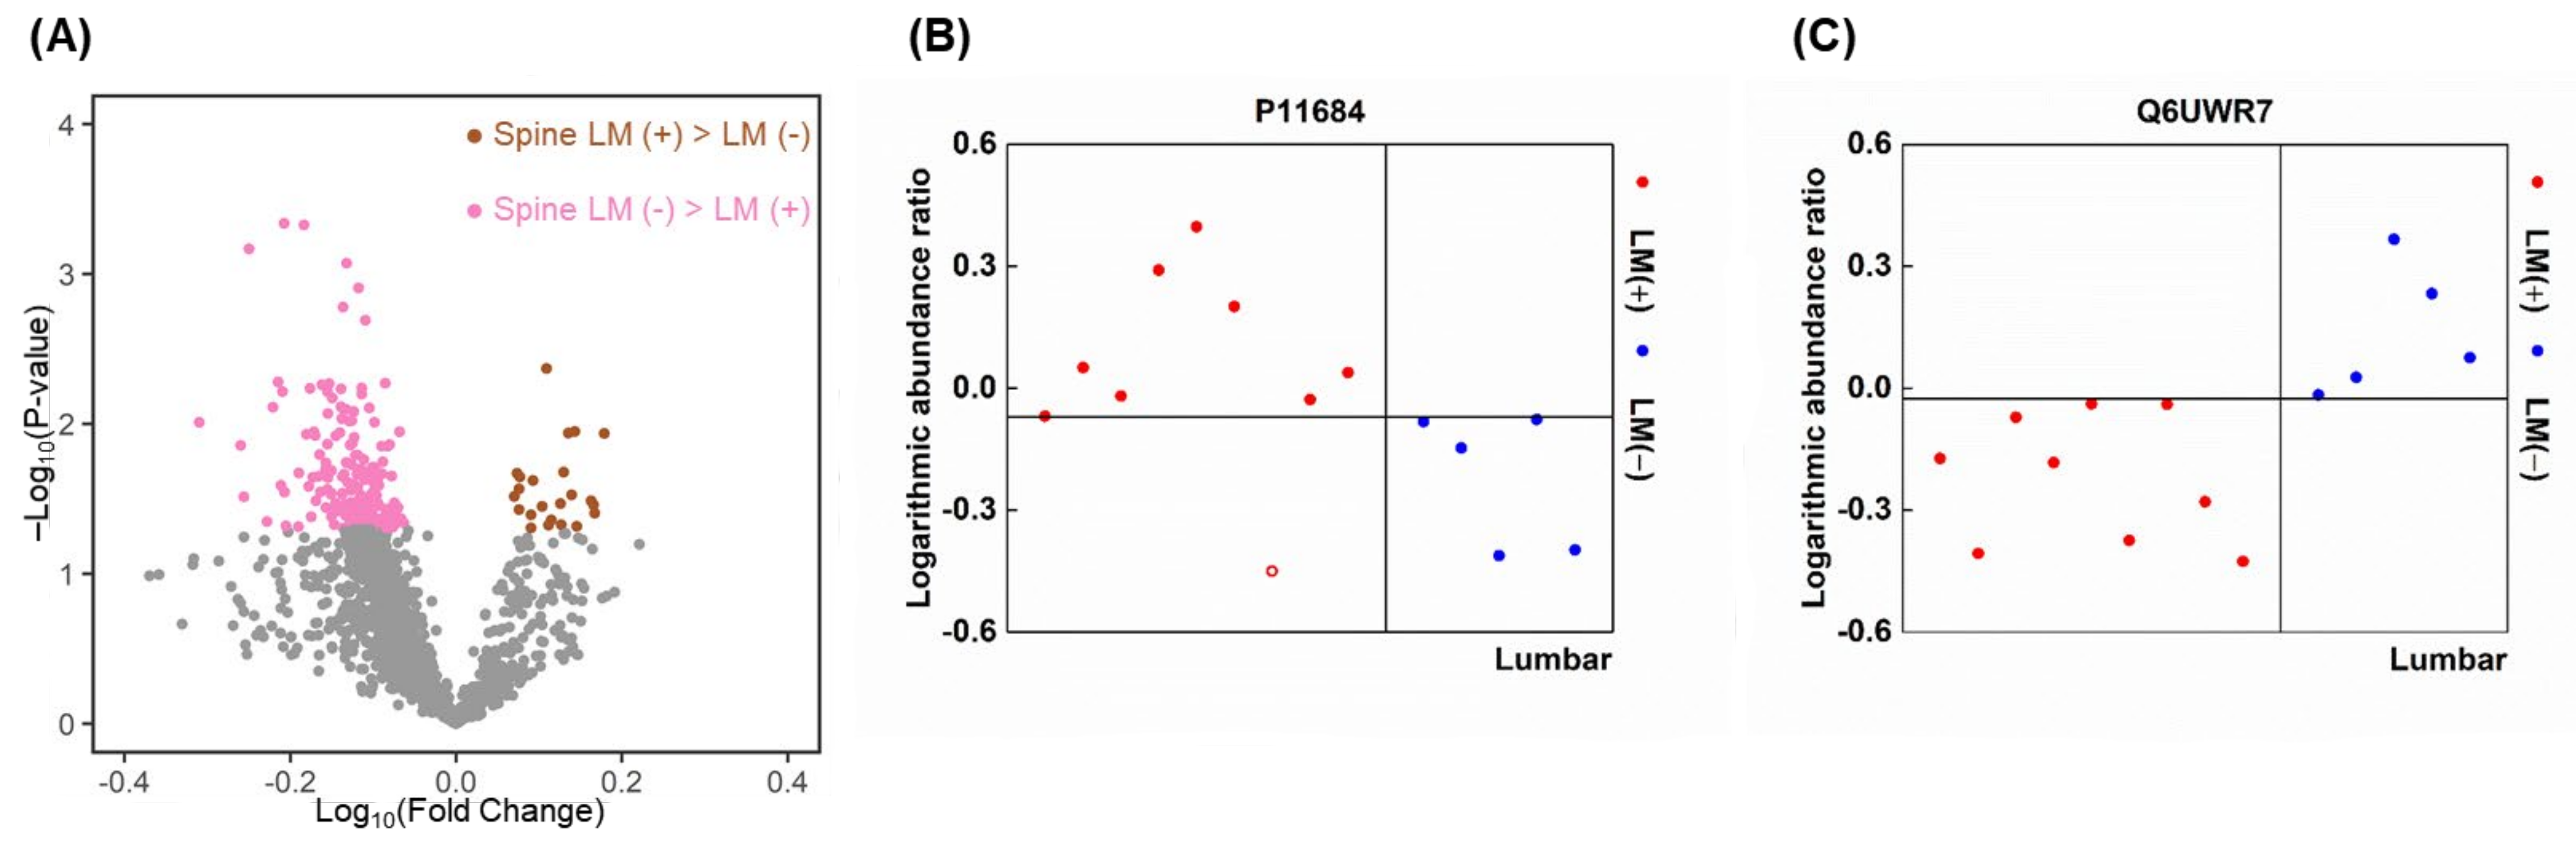
2.8. Proteins That Were Highly Expressed in Spinal LM (+) CSF Compared with Spinal LM (−) CSF

The proteins that were discriminative for spinal LM (+) lumbar CSF versus spinal LM (−) lumbar CSF were evaluated by groupwise comparisons based on the abundance ratio (Supplementary Table S3). In this groupwise comparison of proteins, 1186 proteins (77%) were higher in spinal LM (+) CSF than spinal LM (−) CSF, and 171 (14%) were significantly higher (Figure 5A), whereas 350 proteins (23%) were higher in spinal LM (−) than spinal LM (+) CSF, and 23 of them (6.6%) were significantly higher.
Next, we selected discriminative proteins using the same criteria as used for discriminative LMIs (a summed sensitivity and specificity >160%). Thirty-seven proteins were discriminatively higher in spinal LM (+) CSF compared with LM (−) CSF samples. Among these, 4 proteins, including uteroglobin (P11684) and complement component C8 gamma chain (P07360), were higher in the spinal LM (+) samples at a summed sensitivity and specificity ≥180% (Figure 5B), and another 6 proteins, including coagulation factor XII (P00748), were higher at a summed sensitivity and specificity >170% (Table 6). There was 1 ectonucleotide pyrophosphatase/phosphodiesterase family member 6 (Q6UWR7, Figure 5C) which showed higher abundance in all spinal LM (−) CSF versus spinal LM (+) CSF samples, 48 proteins were higher at a summed sensitivity and specificity ≥180%, and another 25 proteins were higher at a summed sensitivity and specificity ≥170% (Supplementary Table S3).

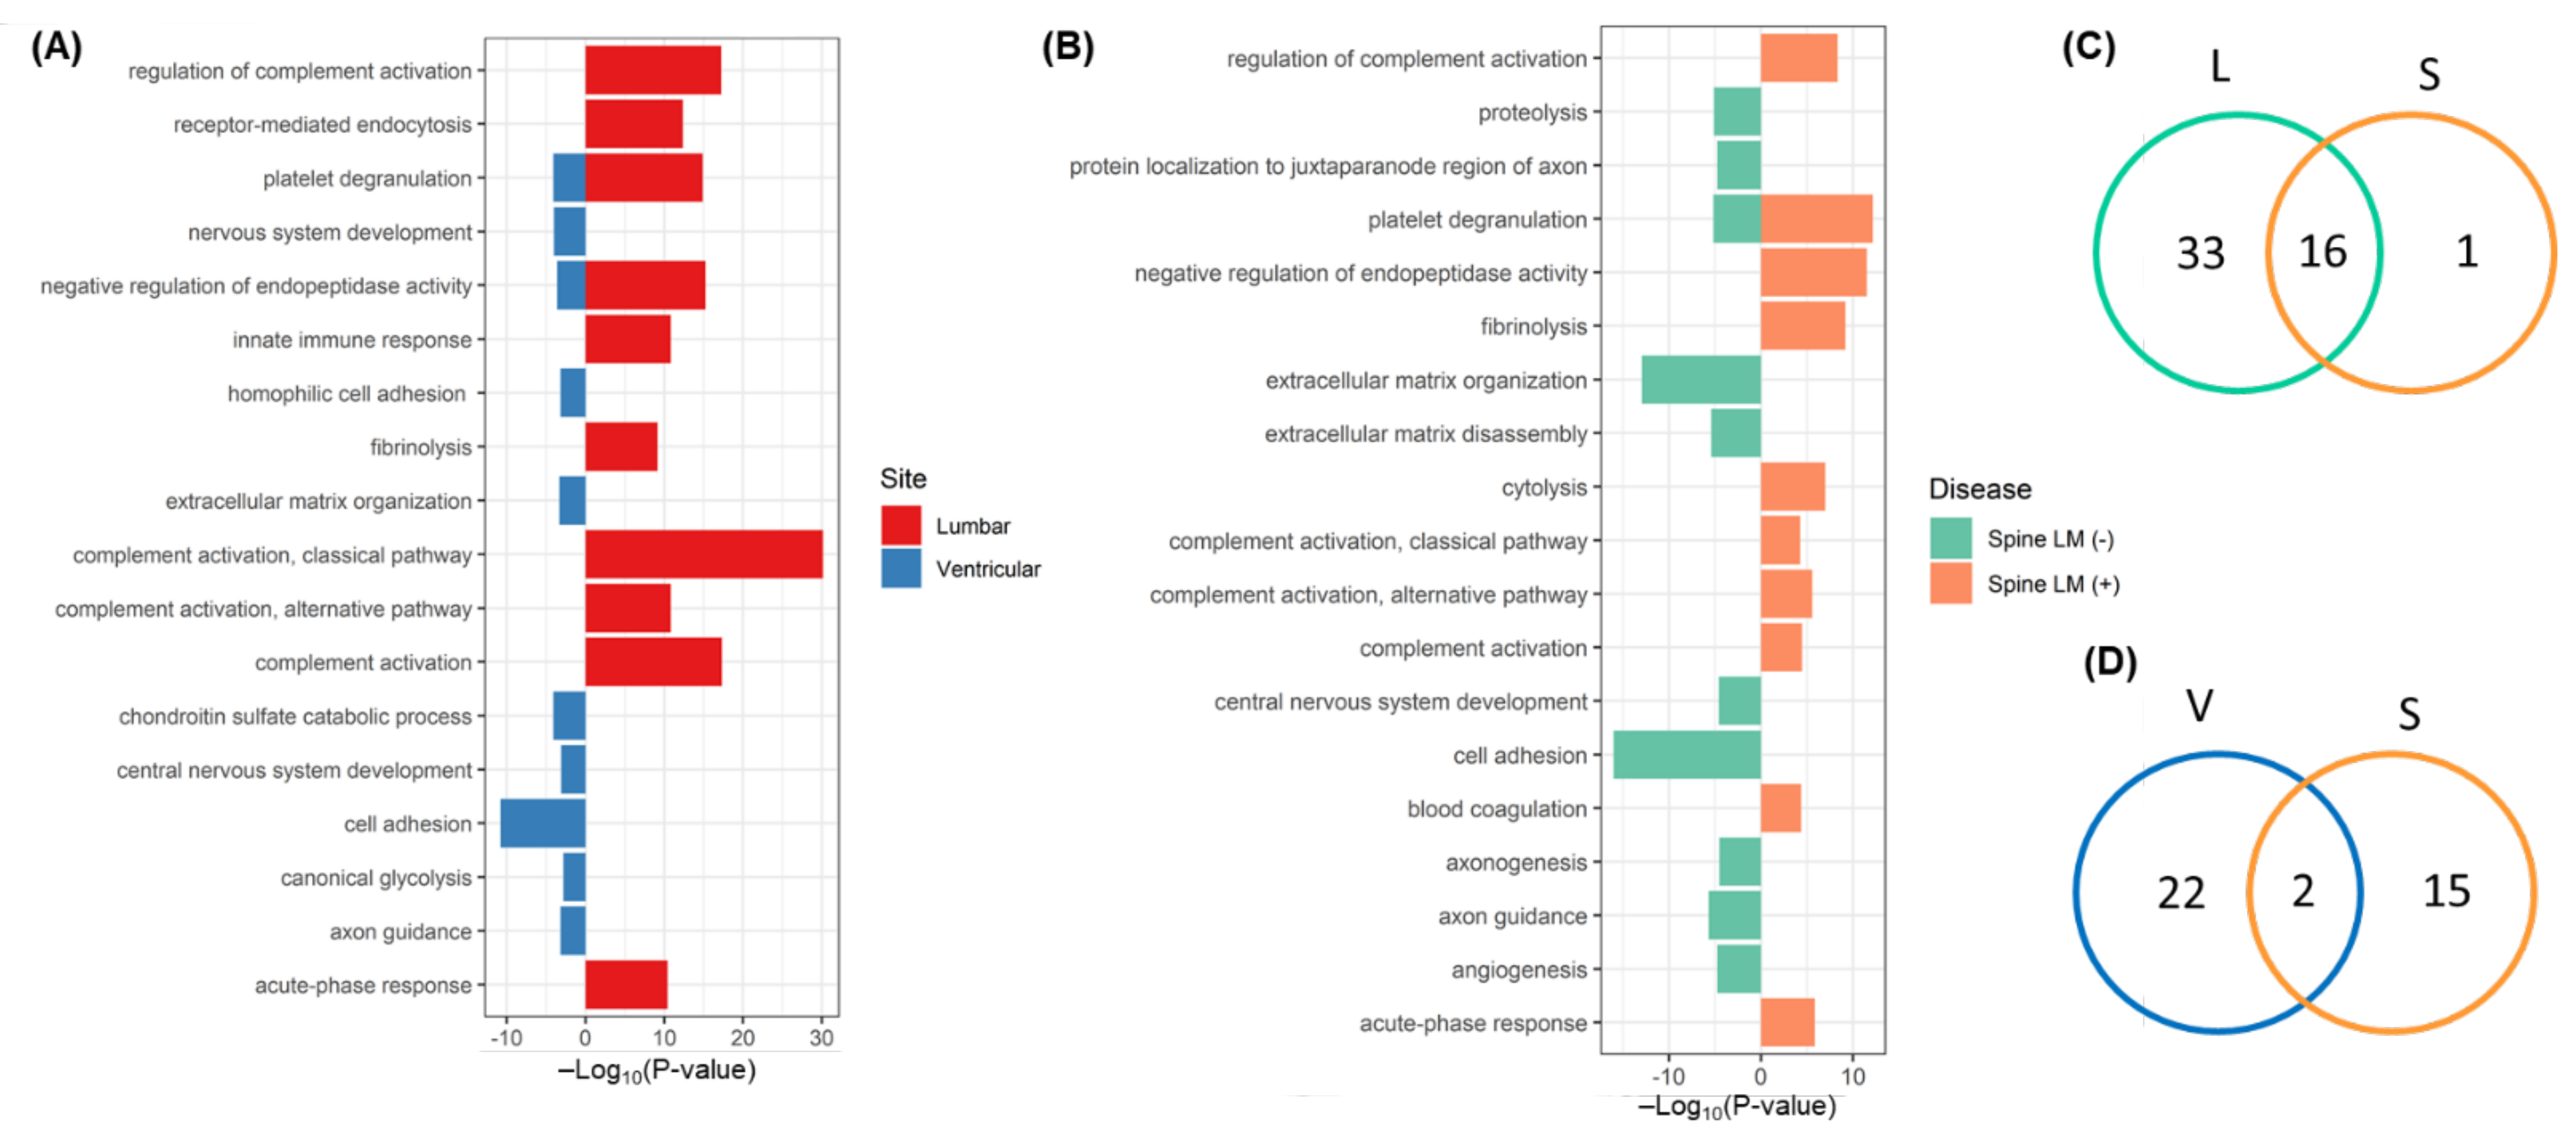
2.9. Pathways Associated with Discriminative CSF Proteins

We evaluated metabolic pathways that were associated with these discriminative proteins using the Gene Ontology database to determine which pathways were associated with the CSF compartment or with spinal LM. We selected discriminative proteins that showed differential expression in ≥12 out of 14 paired samples for lumbar and ventricular compartments using the summed sensitivity and specificity ≥160% for spinal LM (+) CSF (Supplementary Table S3).
A total of 111 discriminative lumbar proteins were associated with 49 cellular pathways at an FDR <0.05 (Supplementary Table S4). The top 10 pathways (in order of p-value) associated with the lumbar discriminative proteins were the following: the complement activation classical pathway, complement activation, regulation of complement activation, negative regulation of endopeptidase activity, platelet degranulation, receptor-mediated endocytosis, innate immune response, complement activation alternative pathway, acute-phase response, and fibrinolysis (Figure 6A). A total of 24 pathways were associated with 347 discriminative ventricular proteins (Supplementary Table S4). The top 10 pathways associated with the ventricular-discriminative proteins were as follows: cell adhesion, platelet degranulation, chondroitin sulfate catabolic process, nervous system development, negative regulation of endopeptidase activity, extracellular matrix organization, homophilic cell adhesion via plasma membrane adhesion molecules, axon guidance, central nervous system development, and canonical glycolysis (Figure 6A). For spinal LM (+) CSF, 37 discriminative proteins were associated with 17 pathways, whereas 297 spinal LM (−)-discriminative proteins were associated with 18 pathways, including platelet degranulation (Supplementary Table S4). The top 10 pathways associated with spinal LM (+)-discriminative proteins were as follows: platelet degranulation, negative regulation of endopeptidase activity, fibrinolysis, regulation of complement activation, cytolysis, acute-phase response, complement activation, alternative pathway, complement activation, blood coagulation, and complement activation classical pathway (Figure 6B).
Comparing spinal LM (+) pathways with each CSF compartment, we found that 16/17 (94%) of spinal LM (+) pathways, including complement activation and hyaluronan metabolic process, were also associated with the lumbar discriminative proteins (Supplementary Table S4, Figure 6C), whereas only 2 pathways of platelet degranulation and negative regulation of endopeptidase activity were shared by the ventricular and spinal LM (+)-discriminative proteins (Figure 6D). Thus, the pathways associated with spinal LM (+)-discriminative proteins were more similar to the lumbar pathways than the ventricular pathways (p < 0.00001). We also determined whether this association applied for the spinal LM (−) pathways for each CSF compartment. Among 18 spinal LM (−) pathways, 7 pathways, including central nervous system development, were shared with the ventricular-discriminative protein associated pathways, and 6 pathways, including extracellular matrix disassembly, were common to the lumbar discriminative protein associated pathways. Among these pathways, five pathways (cell adhesion, extracellular matrix organization, axon guidance, extracellular matrix disassembly, platelet degranulation, and proteolysis) were common to spinal LM (−) and both CSF compartment pathways. Thus, the spinal LM (−)-associated pathways did not show any bias based on the CSF compartment.
Analysis of these discriminative proteins in the KEGG metabolic database and annotated metabolic pathways (Supplementary Table S5) indicated that all 4 pathways—including complement and coagulation cascades—associated with spinal LM (+)-discriminative proteins were common to 8 metabolic pathways associated with lumbar discriminative proteins; meanwhile, only prion disease was shared among 13 metabolic pathways associated with ventricular-discriminative proteins (Supplementary Table S5). The similarities in pathways between spinal LM (+) and the lumbar CSF were also supported by KEGG pathway analysis.

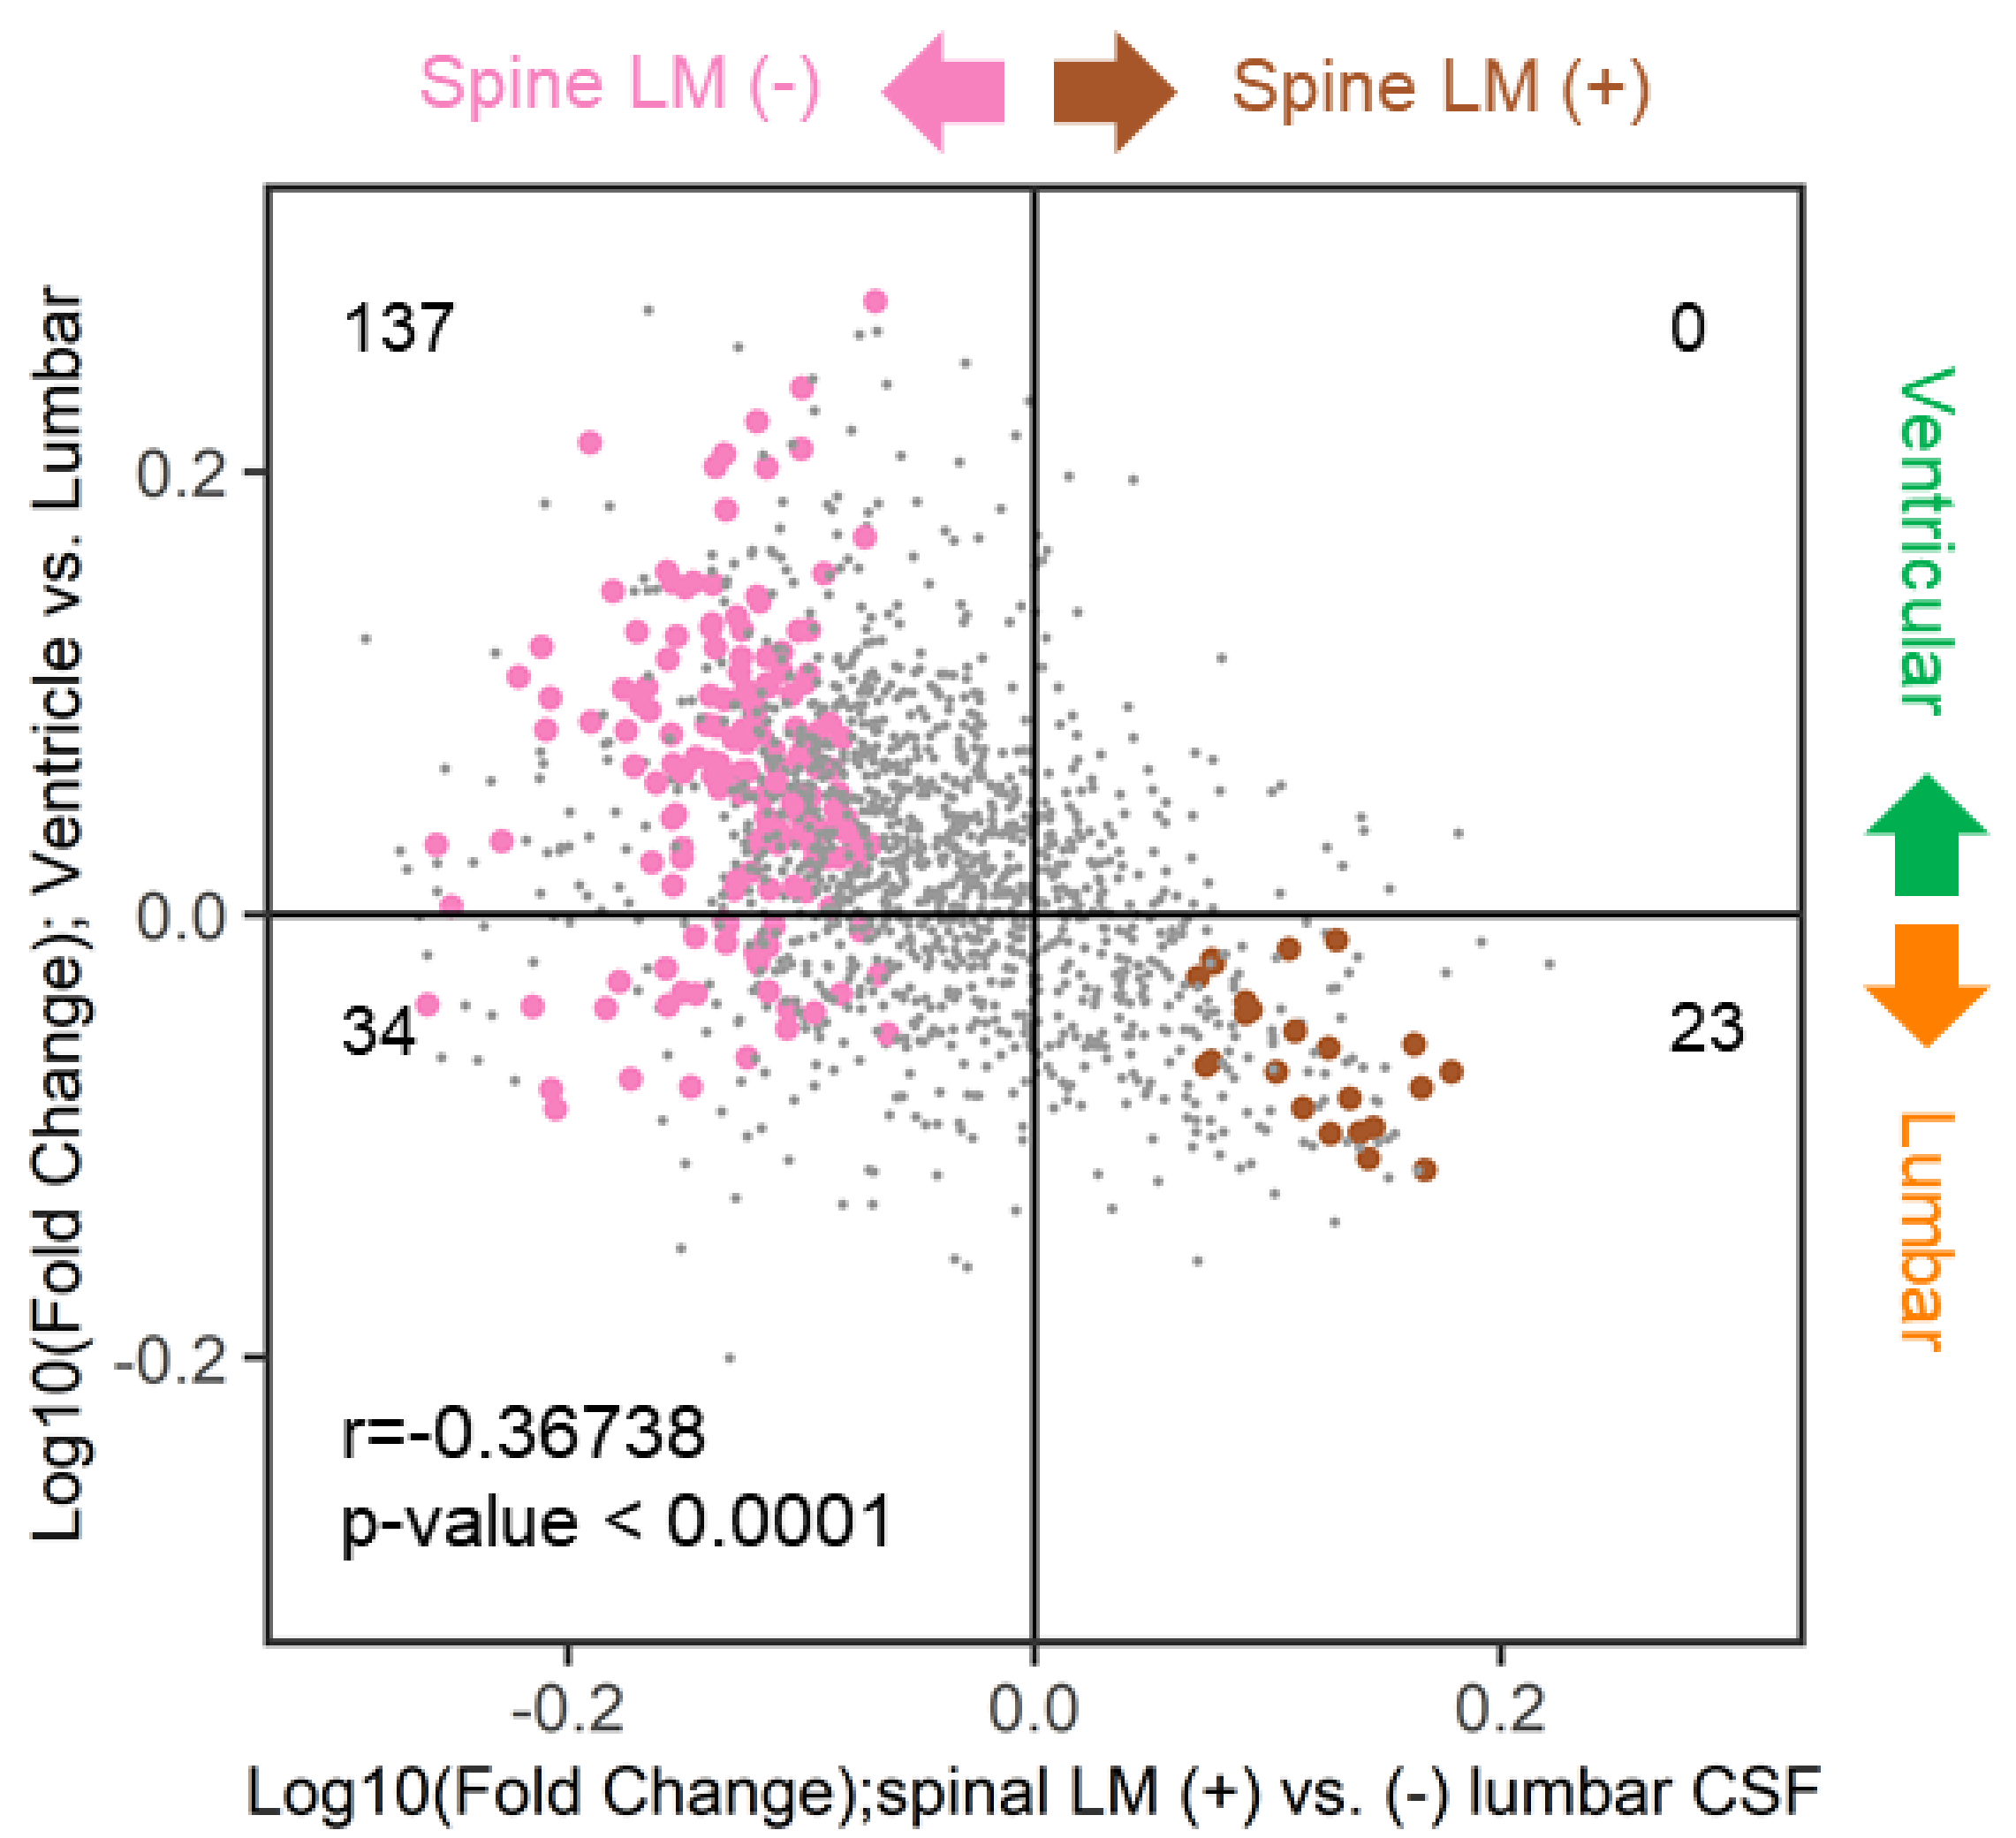
2.10. Similarities of Discriminative Proteins between Spinal LM and CSF Compartments

We determined whether discriminative proteins of spinal LM (+) CSF, which reflects local LM disease activity, were preferentially expressed in either lumbar or ventricular CSF. We determined the distribution of significantly expressed spinal LM (+) and LM (−) proteins for each CSF compartment (Figure 7). A total of 137 (80%) out of 171 spinal LM (−) proteins were found in the ventricular high quadrant, whereas all 23 spinal LM (+) proteins were found to be high in the lumbar quadrant. This suggests that proteins that are markers of LM activity are more likely to be found in the lumbar compartment than the ventricular compartment. This association of spinal LM (−) proteins with the ventricular compartment and spinal LM (+) proteins with the lumbar compartment was statistically significant (r = 0.36738, p < 0.0001).
We determined the distribution of significantly expressed proteins that were shared by the CSF compartment and spinal LM (+) proteins (Table 6, asterisk). Among 37 spinal LM (+)-discriminative proteins, five proteins, including complement C8-α, C8-β, C8-γ (P07357, P07358, P07360), N-acetylmuramyl-L-alanine amidase (Q96PD5), and inter-alpha-trypsin inhibitor heavy chain H4 (Q14624-1), were found in the lumbar discriminative proteins. No spinal LM (+)-discriminative proteins were shared with the ventricular-discriminative proteins.

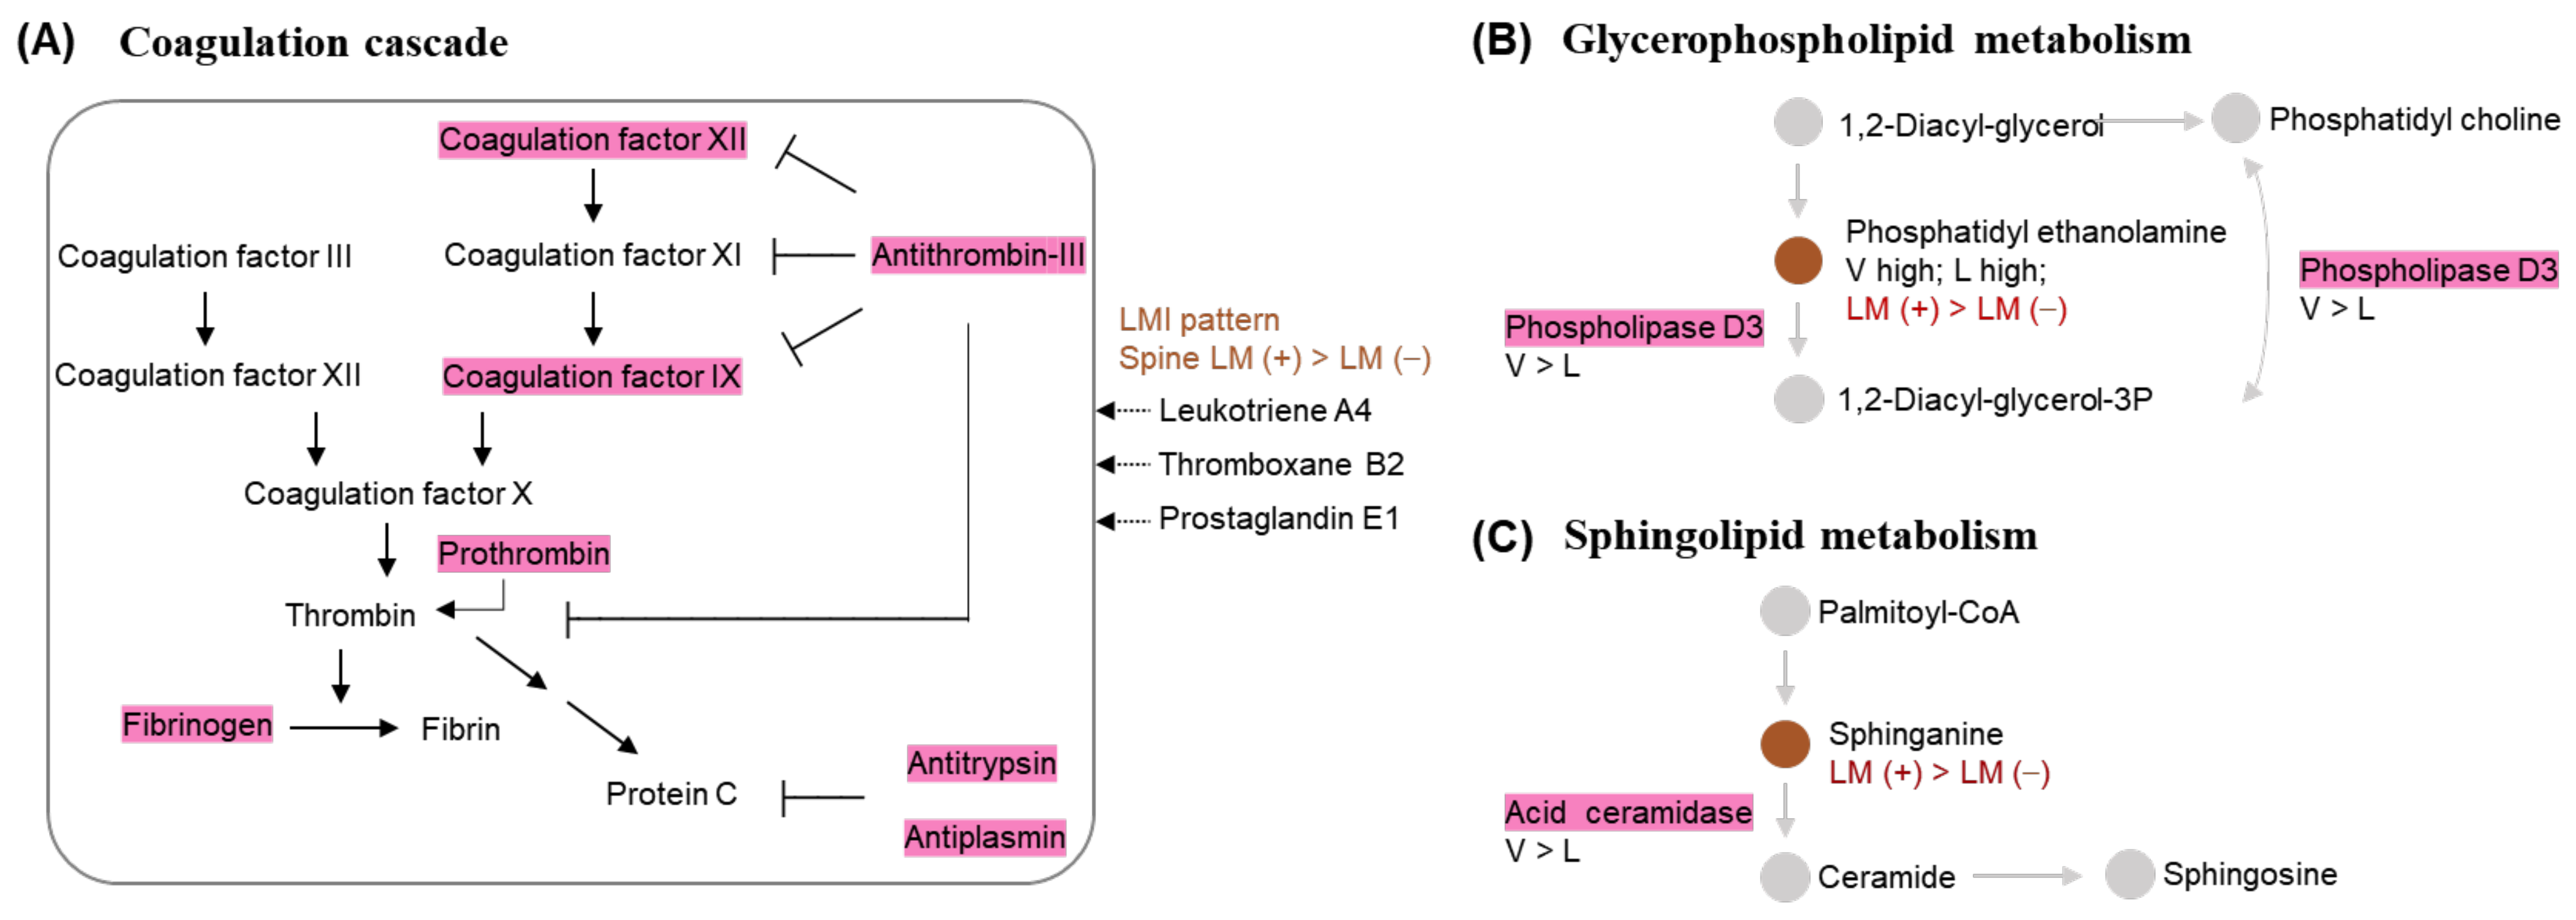
2.11. Associations between Discriminative LMIs and Proteins

We explored a possible correlation between discriminative metabolites and proteins in LM CSF to determine whether they could be analyzed together as a multi-omics study. We selected metabolites and proteins as nodes to construct a metabolite-protein interaction network (See Section 4). We found metabolites derived from leukotriene, thromboxane, and prostaglandin families, which are known to activate coagulation reactions, in the cellular pathways associated with discriminative proteins (Figure 8A). Two metabolic pathways connecting discriminative metabolites and proteins were identified (Figure 8B,C). In the glycerophospholipid metabolism pathway, phosphatidylethanolamine (PE) was catalyzed by phospholipase D3. In the sphingolipid metabolism pathway, acid ceramidase turns sphinganine into ceramide.

3. Discussion

This is the first report of the metabolomic and proteomic profiles comparing paired lumbar and ventricular CSF from the same patient with LM. We also compared profiles of patients with spinal LM versus spinal LM (−) and verified the similarity of profiles of spinal LM (+) samples of CSF from the lumbar and the ventricular compartments.

3.1. CSF Profiles by Compartment

Although CSF circulates throughout the CNS, CSF profiles differ by site, especially in the case of CNS diseases [9,11,12]. Using immunological and neurological panels, Bergman et al. found different levels of selected proteins in CSF from the ventricular, lumbar, or interstitial fluid compartments in patients with multiple sclerosis [27]. They suggested that these differences in protein levels between CSF compartments did not indicate a gradual shift of proteins by the flow of CSF, and that differences in the lumbar CSF, which is far from the disease activity and affected by local protein secretion, are unlikely. Minta et al. measured expression levels of the CNS-specific proteins brevican and neurocan in paired lumbar and ventricular CSF from patients with normal pressure hydrocephalus, in which CSF flow is disturbed but brain parenchyma is not diseased but is compressed [28]. They determined that the CNS-specific proteins did not differ between the lumbar and ventricular compartments, whereas extracellular matrix proteins increased in the lumbar CSF. They suggested that this discrepancy might result from peripheral tissue activity.
In LM, where CSF flow is frequently disturbed, there are large differences in both the cellular and extracellular components of CSF between the ventricular and lumbar compartments. Two studies reported false-negative CSF cytology results when the sampling site was not associated with LM-related symptoms and recommended sampling the CSF at the compartment nearest to the location of LM. For example, lumbar CSF showed higher positive rate if the patients presented with symptoms of conus involvement versus ventricular CSF when patients had cranial neuropathy in LM [9,29]. Gajjar et al. reported conflicting negative CSF cytology results for ventricular CSF after a ventriculoperitoneal shunt compared with paired lumbar CSF in pediatric LM from brain tumors [8]. In our previous study, we found that lumbar CSF showed significantly higher levels of protein and cell counts than ventricular CSF in patients with LM, and patients presenting with hydrocephalus or cauda equina syndrome showed higher lumbar CSF protein levels compared with patients without those symptoms [12]. Those findings suggested that not only anatomical location of CSF but also disease status could affect the CSF profiles of LM patients. CSF is produced by choroid plexus and ependymal cells in the ventricle. LM involves more commonly the surface of brain and spinal cord rather than ventricular wall. The disturbance of CSF flow could accentuate the differences of CSF profile between ventricular and lumbar samples by restricting distribution of CSF molecules along CSF compartments. In clinical practice, once we installed the intraventricular Ommaya reservoir, it is forced to sample CSF from the ventricle via Ommaya and to avoid painful lumbar puncture. Our concern is the ventricular CSF, which is proximal to normal CSF flow, might fail to reflect LM activity. Considering these facts, it could be interpreted that our lumbar CSF samples were more likely to have molecules related to local disease activity of LM. Thus, for disease activity monitoring or developing LM target protein beyond the diagnosis, we suggest that sampling CSF closer to local LM activity should be considered. Whereas CSF could show more discriminative LMIs and proteins reflecting the varied secretory activity of brain cells.

3.2. CSF Micromolecules as Biomarkers of CNS Disease Activity

Recently, cancer cell-derived components, such as microRNAs, exosomes, and extracellular DNA, have been analyzed to monitor cancer metastasis [30,31,32]. We showed previously that changes in extracellular vesicle (EV) concentration and onco-miR (microRNA-21) are prognostic for LM patients who received intra-CSF methotrexate chemotherapy [33]. In this study, we did not evaluate longitudinal changes in CSF profiles but evaluated whether CSF compartments may represent disease activity in LM, especially in patients with disturbed CSF flow. Consistent with our assumption that spinal LM (+) CSF more likely reflects LM activity than spinal LM (−) CSF, spinal LM (+) CSF revealed significantly more discriminative LMIs in comparison to spinal LM (−) CSF. In contrast, discriminative proteins were more abundant in the spinal LM (−) CSF than the LM (+) CSF. This might reflect the fact that the densely pia-attached cancer cells could suppress normal protein secretion from the spinal cord; however, we did not differentiate proteins originating in the spinal cord from proteins secreted from LM cancer cells in this study. In analyzing discriminative protein profiles, we found that discriminative proteins of the spinal LM (+) CSF were not shared with those from the ventricular CSF but were found among those in the lumbar CSF. Among these, the complement component C8 should be analyzed further for a possible role in LM. Complement components are involved vascular permeability [34] and Boire et al., has sought to complement component 3 as a marker of LM relapse [35]. Their study demonstrated that the role of C3 in LM was to disrupt the blood–CSF barrier resulting in an increased flux of plasma components that promote cell growth in the relatively mitogen-poor CSF microenvironment.

3.3. Comparison of CSF Protein Expression between Groups

CSF is produced by filtering blood through a specialized capillary, the so-called ‘blood–CSF barrier’, which naturally blocks the passage of cells and reduces plasma content at a scale of 1/103 to 1/106 depending on the active transport system and molecular characteristics, such as size and lipid solubility [36]. As CSF provides only a limited sample volume (less than 5–10 mL at a time), it has been difficult to analyze micro-molecules present at ppm concentrations. Since CSF should be acellular, the lack of housekeeping molecules and difficulties in standardization of LMI and protein expression are often unavoidable.
To minimize the bias of protein expression levels based on normalization methods, it is essential to define brain-specific proteins that are consistently present at enriched levels. However, we found no housekeeping proteins, such as cellular β-actin or GAPDH, in the extracellular compartment of the CSF. Begcevic et al. [24] performed LC–MS/MS on 6 CSF samples from healthy donors and quantified 30 brain tissue-enriched proteins filtered for secreted or membrane-bound proteins using the Human Protein Atlas database [26]. Despite the healthy status of the donors, only 21% of CSF proteins were shared among all 6 samples. The absolute expression level of 52 brain tissue-derived proteins was assessed using the parallel reaction monitoring technique [25]. This revealed that the retention time window and mass tolerance used for the inclusion of peptides to identify proteins greatly affected the brain-enriched proteins in this MS-based proteome analysis. A total of 41 (79%) out of the 52 proteins of brain origin were found in our CSF proteins and were common to all samples of LM (data not shown). Batruch et al. stated that obtaining the absolute protein concentration from the peptide concentration poses problems for several reasons, including the peptide digestion method [23].
In a comprehensive analysis of the proteome of the CSF extracellular compartment by Chiasseri et al., they found that extracellular vesicle (EV) proteins were more abundant than soluble (supernatant) fraction proteins [22]. Although there is the limitation that they used pooled CSF samples from individuals with unknown disease status, they found that several proteins associated with neurodegenerative diseases, such as amyloid precursors, were enriched in the CSF EV fraction; they suggested that proteins enriched in the CSF EV fraction could be constitutively expressed secretory proteins from the brain parenchyma. In terms of both the number of proteins identified in CSF (1315 in their study versus 1536 in ours) and the top-ranked proteins (we identified 41/50 of their top 50 EV proteins), their profiles were similar to ours (Supplementary Table S3, protein abundance ratio). Interestingly, we found more EV-enriched proteins in the ventricular than the lumbar CSF (11 versus 5) and in spinal LM (−) CSF than LM (+) CSF (4 versus 1). Although the statistical significance was not determined, these results are consistent with our assumption that proteins associated with brain cell activity are preferentially associated with the ventricular versus the lumbar CSF, and pial-attached cancer cells block the secretory activity of the normal spinal cord in the spinal LM (+) CSF.

3.4. Limitations of Comparisons of CSF LMIs between Groups and Correlation with CSF Protein Expression

Major limitations of our LMI study are that non-targeted LMIs were not verified by targeted MS using standards for candidate molecules and the extracted profiles were without external validation of large number of CSF samples. Previously, we used an advanced MS technique to identify thousands of LMIs in CSF and designated LMI profiles to differentiate LM from parenchymal brain metastasis and primary brain tumors [21]. We are working on proving candidate LMIs in our samples by LC–MS/MS; however, there are several candidate molecules for each LMI, the technique is expensive and time-consuming, and some materials are difficult to purchase. However, some of these molecules were also found in this study and were enriched in spinal LM (+) CSF versus spinal LM (−) CSF and lumbar CSF versus ventricular CSF. Phosphatidic acid was a discriminative LMIs in spinal LM (+) CSF and was also an LMI marker for LM in our previous study [21]. Moreover, several metabolites also have considered as promising CSF biomarkers, e.g., phosphatidic acid [37] and 5-formiminotetrahydrofolic acid [38].
Integrate discriminative proteomics and metabolomics without a validation method can be seen as a fragile approach. Thus, although our metabolite–protein interaction network is somewhat speculative, it provides a starting point for understanding metabolite–protein interactions. In this study, we identified three interaction nodes, including the coagulation cascade, glycerophospholipid metabolism, and sphingolipids metabolism. In our metabolic pathway analysis of spinal LM (+) CSF in comparison with spinal LM (−) CSF, platelet degranulation and blood coagulation were among the top 10 enriched pathways, and coagulation factors IX and XII were discriminative proteins in spinal LM (+) CSF. Many glycerophospholipids have been suggested as markers of cancer [39] since they are involved in cell membrane turnover, which also occurs in LM. Additionally, glycerophospholipids, including phosphatidic acid, phosphatidylcholine, and phosphatidylethanolamine, were also LMI markers for LM in our previous study [21]. Sphingolipids are important in brain homeostasis, and acid ceramidase is a drug target in cancer therapy [40].

4. Materials and Methods
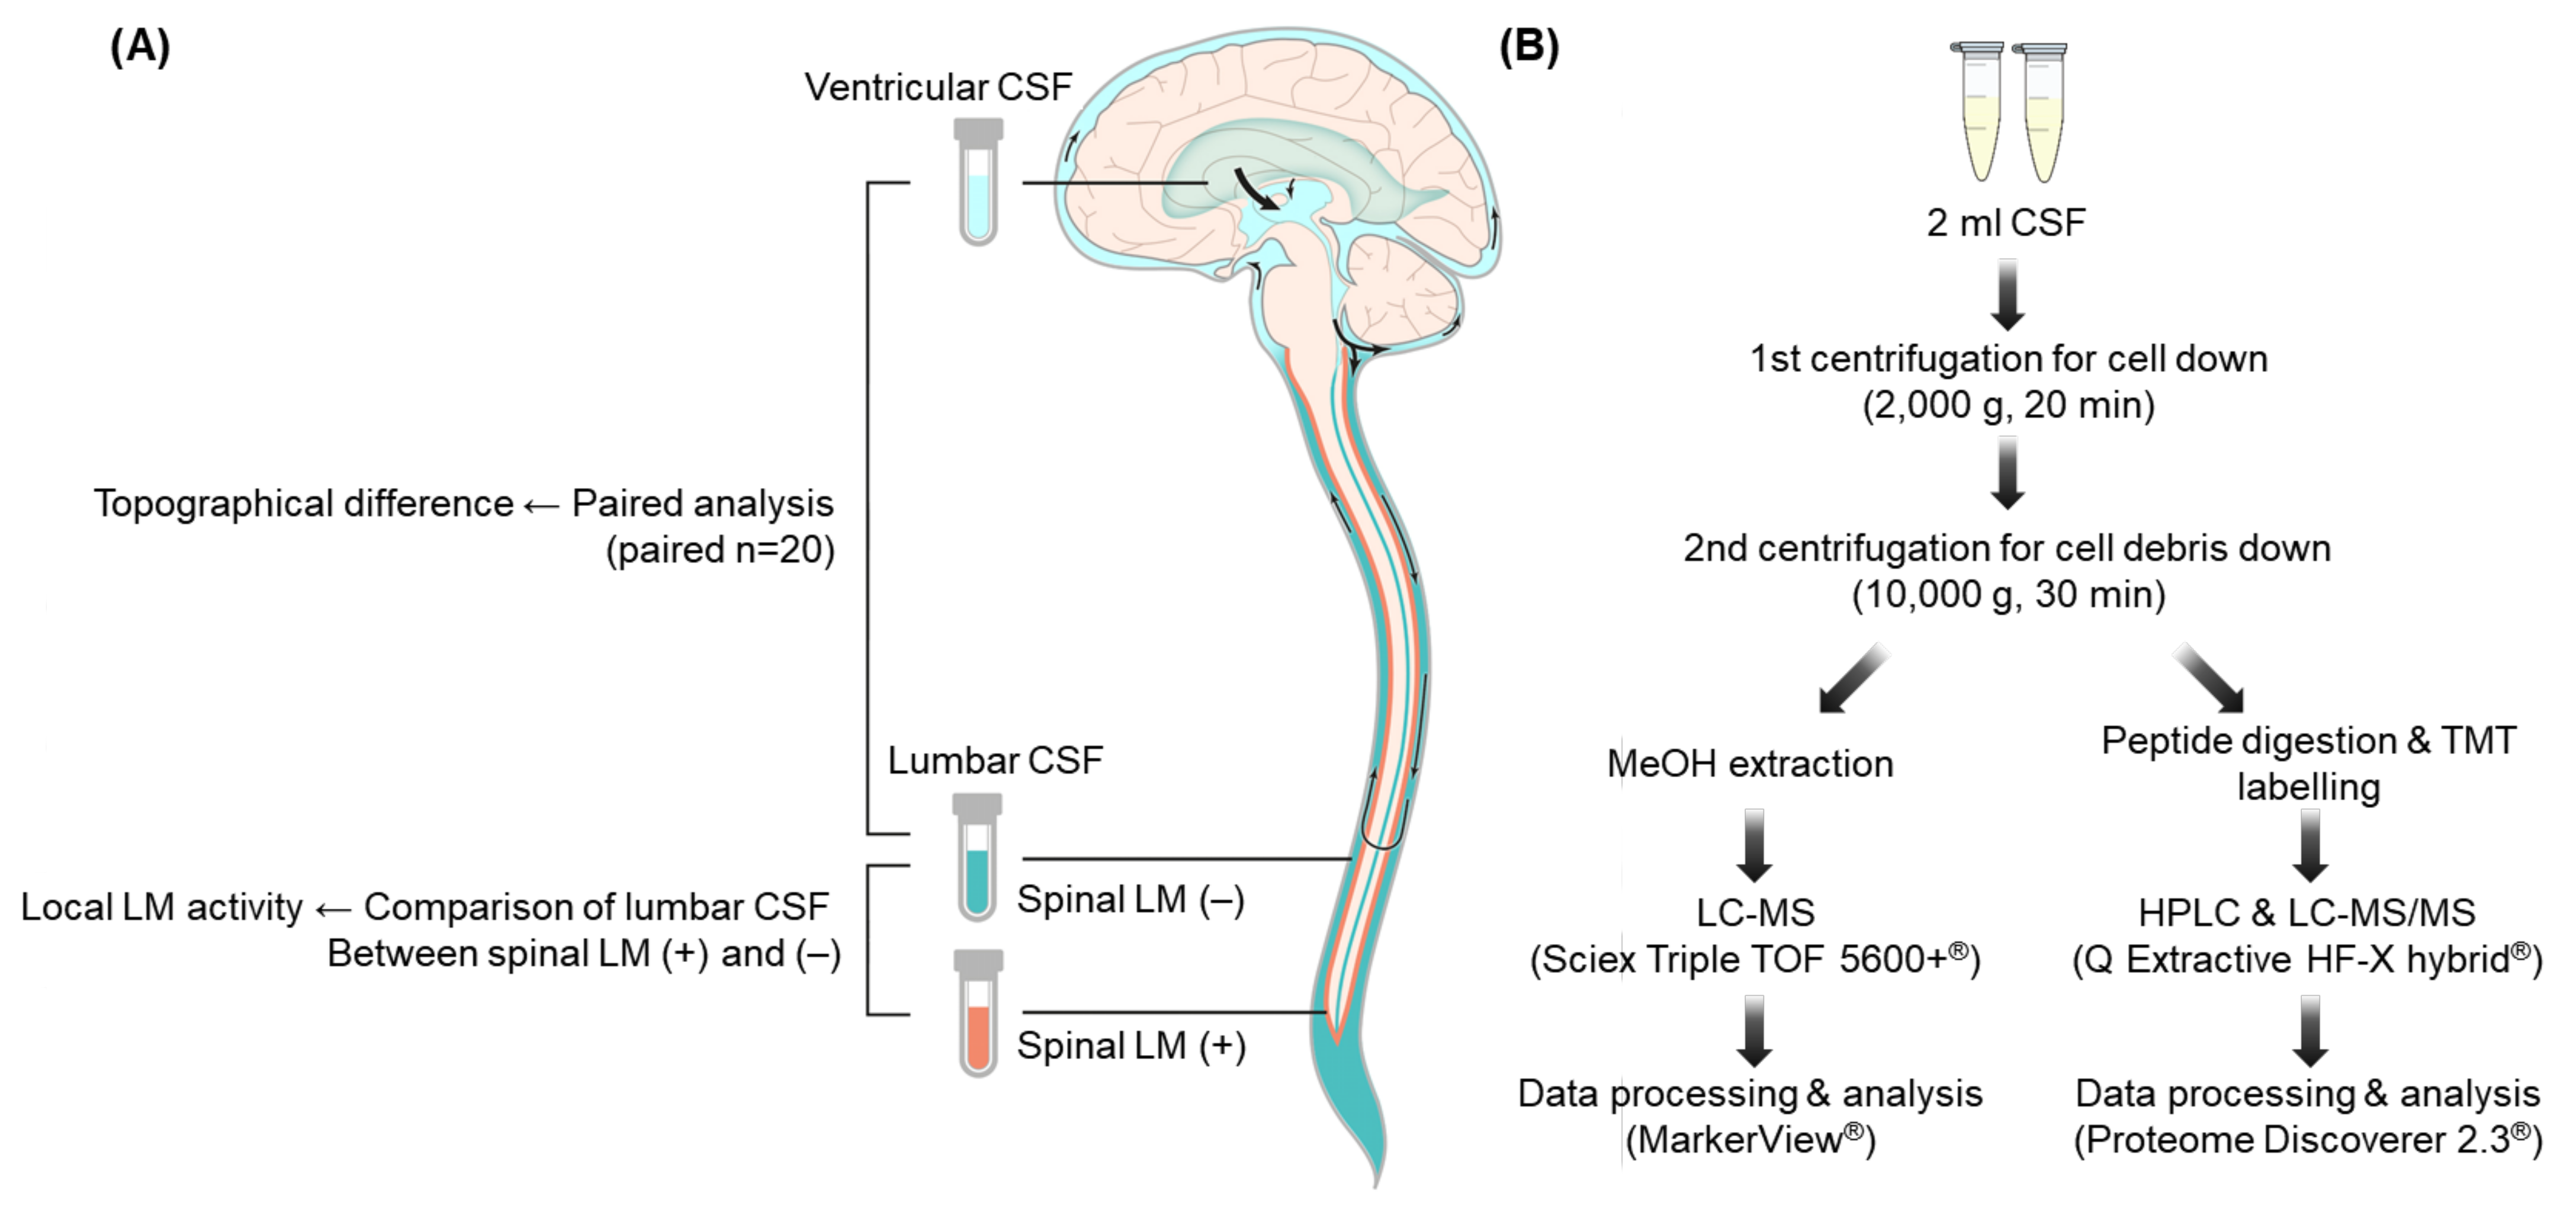
4.1. CSF Samples

We collected 20 ventricular/lumbar CSF-paired samples from 20 LM patients from our archives of CSF for biomarker studies (permission from the Institutional Review Board. NCC2014-0135). For sampling, (1) lumbar CSF was sampled via lumbar puncture at the time of diagnosis or from lumbar drainage just before starting ventriculolumbar perfusion chemotherapy [41], and (2) ventricular CSF was sampled via Ommaya reservoir tapping at the time of reservoir installation or before starting ventriculolumbar perfusion chemotherapy (Figure 1A). All CSF samples were collected before intra-CSF chemotherapy to minimize bias from the treatment, and clinically they had a history of increased intracranial pressure from LM as an indication of ventriculolumbar perfusion chemotherapy.
The CSF sample was centrifuged (2000× g, 20 min) within 1 h of collection, and the supernatant was aliquoted. A 50 µL sample of each supernatant was used for MS analysis. The remaining samples were centrifuged again at 10,000× g for 30 min and kept frozen at –80 °C for further study (Figure 1B).

4.2. Diagnosis of LM

All patients had both positive CSF cytology and either a suggestive or definite finding of LM on a T1-weighted gadolinium-enhanced brain MRI [42]. In detail, definite sulci enhancement was observed in 15 patients (75%), and both ventricle wall and sulci enhancement were observed in 1 patient (5%). Spinal MRI was done for evaluating spinal symptoms or estimating the extent of the disease after LM diagnosis. Patients in this cohort received intra-CSF chemotherapy and care for their LM-related symptoms after the sampling.

4.3. CSF Metabolite Profiling Using LC–MS

The metabolites in the CSF were extracted using a modified Bligh and Dyer method [10]. In brief, 50 µL CSF was added to 1 mL of water. After vortexing, 2 mL MeOH and 0.9 mL dichloromethane were added. After vortexing and incubating on ice for 30 min, 1 mL water and 0.9 mL dichloromethane were added again and the mixture was centrifuged (1000× g, 10 min, at room temperature). Nitrogen gas was used to dry the supernatant for MS analysis. The extracted metabolites were dried and then reconstituted in 0.1% formic acid and subjected to LC–MS/MS analysis. We used a Shimadzu Nexera X2 system (Shimadzu, Kyoto, Japan) coupled to a Sciex Triple TOF 5600+ system (Sciex, Framingham, MA, USA); the front end was equipped with a DuoSpray ion source. For the ultraLC separation, the sample was loaded into an Atlantis T3 sentry guard cartridge (3 µm, 2.1 × 10 mm; Waters, Milford, MA, USA). Separation was performed in an Atlantis T3 column (3 µm, 2.1 × 100 mm; Waters). The MS system was set to perform one full scan (50 to 1200 m/z range) followed by LC–MS/MS of the 10 most abundant parent ions (mass tolerance, 50 mDa; collision energy, 35%).
Peaks Table Using the MarkerView Software: A list of LC–MS peaks (.peaks file) was created from a measurement file (.wiff file) for every sample using the MarkerView software (Sciex, Framingham, MA, USA). The parameters for this process were as follows: minimum retention time (RT), 0.00 min; subtraction offset, 10 scans; subtraction multiplication factor, 1.3; noise threshold, 10; minimum spectral peak width, 10 ppm, and minimum RT peak width, 5 scans. Next, a table of peaks was created by importing the .peaks files into the MarkerView software, for all samples simultaneously, using the following parameters: RT tolerance, 0.01 min; mass tolerance, 10.0 ppm; intensity threshold, 10; maximum number of peaks, 20,000; and area reporting using the option of ‘area integrated from raw data, not from original peak finding.’ The peaks table (aligned mass spectra) consisted of one peak area column per sample, and a mass value (m/z, mass–charge ratio) and RT (min) column common to all samples.
LMI level normalization: The peak areas in the table were normalized using the option of ‘total area sums.’ In detail, all LMI peaks common to all CSF samples were summed to yield ‘total area sum’ for each sample. Then, we obtained the mean of ‘total area sums’ for all samples, and a scaling factor for each sample was calculated from the mean of ‘total area sums’ divided by each ‘total area sum’. The normalization yielded the same total area sum for every sample in the peaks table via multiplication of a raw peak area by a per-sample scaling factor.
Using metabolite databases from the Human Metabolome Database (HMDB, http://hmdb.ca, accessed on 13 September 2021), specific compounds were found for the given m/z, listed in rank order based on the MS and MS/MS data.

4.4. CSF Proteomic Profiling Using LC–MS/MS

Peptide digestion: A total of 28 CSF samples (14 pairs) were precipitated using cold acetone. Precipitated samples were reduced with 10 mM DTT, alkylated by iodoacetamide (IAA), and digested with mass spec grade trypsin for 12 h at 37 °C. Digested peptides were desalted using C18 spin columns (Thermo Fisher Scientific, San Jose, CA, USA) according to the manufacturer’s instructions.
TMT labeling: Peptide samples were reconstituted in 100 mM triethylammonium bicarbonate (TEAB), labeled using TMT11plex reagents (Thermo Fisher Scientific) according to the manufacturer’s instructions. Briefly, each prepared TMT reagent was transferred to the peptide sample, the mixture was incubated for 1 h, quenched by the addition of 8 μL of 5% hydroxylamine, and incubated for 15 min at room temperature. Each set of 11 TMT-labeled peptide samples was pooled and dried using a vacuum concentrator.
Mid-pH reverse-phase liquid chromatography fractionation: The pooled 11 plex TMT-labeled sample was separated using Agilent 1260 Infinity HPLC system (Agilent, Palo Alto, CA, USA). An Xbridge C18 analytical column (4.6 mm × 250 mm, 130 Å, 5 μm) and a guard column (4.6 mm × 20 mm, 130 Å, 5 μm) were used for peptide separation. Solvents A and B were 10 mM TEAB in water (pH 7.5) and 10 mM TEAB in 90% acetonitrile (ACN, pH 7.5), respectively. Peptide fractionation was performed using a 115 min gradient at a flow rate of 500 μL/min, as follows: 0% solvent B (10 mM TEAB in 90% acetonitrile) for 10 min, from 0 to 5% solvent B over 10 min, from 5% to 35% solvent B over 60 min, from 35% to 70% solvent B over 15 min, 70% solvent B for 10 min, from 70% to 0% solvent B over 10 min. A total of 96 fractions were collected every minute from 15 to 110 min and were pooled into 24 non-continuous peptide fractions (i.e., #1–#25–#49–#73, #2–#26–#50–#74, …, #24–#48–#72–#96). For each pooled fraction, 5% was dried for global proteome analysis, and 95% of 24 peptide fractions were further combined into 12 fractions, dried using a vacuum concentrator, and stored at −80 °C.
Phosphopeptide enrichment: Each TMT-labeled 12-peptide fraction was resuspended in 500 μL binding buffer (80% ACN/0.1% TFA). The Ni-NTA magnetic agarose beads (Qiagen, Hilden, Germany) were washed with deionized water, reacted with 100 mM EDTA (pH 8.0), and reacted with freshly prepared 10 mM aqueous FeCl3 solution. The Fe3+-NTA beads were washed, resuspended in 1:1:1 ACN/MeOH/0.01% acetic, and aliquoted into 12 microcentrifuge tubes, and washed with 500 μL binding buffer. Resuspended peptide samples were transferred to tubes of Fe3+-NTA beads, incubated for 30 min, washed, eluted using 1:1 ACN/2.5% ammonia in 2 mM phosphate buffer (pH 10), and acidified with 10% TFA to pH 3.5–4.0 before vacuum drying.
LC–MS/MS analysis (Proteomics): A total of 12 TMT-labeled 12 phosphopeptide fractions and 24 global peptide fractions were analyzed by a Q Exactive HF-X hybrid quadrupole-orbitrap mass spectrometer (Thermo Scientific, Rockford, IL, USA) coupled with an Ultimate 3000 RSLCnano system (Thermo Scientific). The peptides were loaded onto a trap column (100 μm × 2 cm) packed with Acclaim PepMap100 C18 resin and peptides were eluted with a gradient from 5% to 36% solvent B (0.1% formic acid in ACN) for 180 min at a flow rate 300 nL/min. The eluted peptides, separated by the analytical column (EASY-Spray column, 75μm × 50cm, Thermo Fisher Scientific), were sprayed into the nano-ESI source with an electrospray voltage of 2.3 kV. The Q Exactive HF-X Orbitrap mass analyzer was operated using a top 10 data-dependent method. Full MS scans were acquired over the range of 350–2000 m/z with a mass resolution of 120,000 (m/z 200). The AGC target value was 3 × 10⁶. The 10 most intense peaks with charge state ≥2 were fragmented in the higher energy collisional dissociation (HCD) collision cell with a normalized collision energy of 32 and tandem mass spectra were acquired in the Orbitrap mass analyzer with a mass resolution of 45,000 at m/z 200.
Protein abundance ratio: From 14 paired (lumbar and ventricular) CSF samples with a pooled mixture comprising all 14 paired samples, quantitative proteomes were measured using the Q Exactive HF-X Hybrid Quadrupole-Orbitrap mass spectrometer (Thermo Fisher Scientific). The abundance of each protein was expressed as a ratio (abundance ratio = abundance in each sample/average of abundance in the pooled mixture). The range of abundance ratios was 0.01–100. An abundance ratio of more than 100 was recorded as 100. An abundance ratio of 0.01 was used for no abundance or an abundance ratio of less than 0.01. The abundance ratio was then converted to common logarithms; thus, the range of logarithmic abundance ratios was −2–~2.
Database search: Database searching of all raw data files was performed in Proteome Discoverer 2.3 software (Thermo Fisher Scientific). SEQUEST-HT and MS Amanda 2.0 were used for database searching against the Swiss-Prot Human database. Database searching against the corresponding reversed database was also performed to evaluate the false discovery rate (FDR) of peptide identification. The database searching parameters included precursor ion mass tolerance 10 ppm, fragment ion mass tolerance 0.08 Da, fixed modification for carbamidomethyl cysteine (+57.021 Da/C) and TMT tags (+229.163 Da/K and N-terminal), and variable modifications for oxidation (+15.995 Da/M) and phosphorylation (+79.966 Da/S, T, and Y). We obtained an FDR of less than 1% on the peptide level and filtered with the high peptide confidence.

4.5. Extraction of Discriminating LMIs and Proteins in Pairwise Comparisons of Lumbar and Ventricular CSF Samples

To obtain information on LMIs, non-targeted LC–MS measurements using the TripleTOF 5600+ system (Sciex, Framingham, MA, USA) were performed on 20 paired samples of lumbar and ventricular CSF. Then, a table of metabolite peaks was made. The peaks table contained data on the mass value (m/z, mass–charge ratio), retention time (min), and peak area. The non-zero peak areas in the table were converted to common logarithms. Metabolites showing a topographical difference between the paired (lumbar and ventricular) samples were identified using their logarithmic peak area. The steps for assessing an individual metabolite were as follows: (1) for each metabolite, the number of samples whose peak area in lumbar CSF was higher (or lower) than in ventricular CSF was counted; (2) individual metabolites showing consistency of 80% or greater (16 or greater of the 20 paired samples) in the topographical difference were set aside for subsequent analysis. Additionally, to obtain information on proteins, quantitative measurements using the Q Exactive HF-X Hybrid Quadrupole-Orbitrap mass spectrometer (Thermo Fisher Scientific) were performed on 14 paired samples of lumbar and ventricular CSF. Proteins showing a topographical difference between the paired (lumbar and ventricular) samples were identified using the logarithmic abundance ratio. The same steps as above were applied to discover individual protein candidates.

4.6. Extraction of Discriminating LMIs and Proteins in Groupwise Comparisons of Spinal LM (+) and LM (−) Lumbar CSF Samples

Good discriminative metabolites (i.e., distinguishing LM (+) from LM (−) groups) were identified using the logarithmic peak area in lumbar CSF. The steps for assessing an individual metabolite were as follows: (1) for each metabolite, a discrimination threshold was determined, with an increment of 0.01, such that the sum of the sensitivity and specificity was highest— when more than one adjacent threshold showed the same discrimination performance, the thresholds were averaged; (2) individual metabolites showing good discrimination (a summed sensitivity and specificity of 160% or higher) were set aside for subsequent analysis. Additionally, proteins having good discriminative ability were identified using the logarithmic abundance ratio in lumbar CSF. The same steps as above were applied to discover individual protein candidates by replacing metabolite peak area with protein abundance ratio.

4.7. Metabolite and Protein Functional Enrichment Analysis

Metabolite enrichment analysis was performed in Metaboanalyst 5.0 (https://www.metaboanalyst.ca/, accessed on 13 September 2021). Sets of discriminative metabolites were used as input data for the enrichment analysis module. We obtained KEGG pathways for the analyzed data and GlobalTest’s p-values. Protein enrichment analysis was performed in DAVID Bioinformatics Resources 6.8 (https://david.ncifcrf.gov/, accessed on 13 September 2021). Sets of discriminative proteins were used as input data for functional annotations analysis. We obtained KEGG pathway annotations among several annotation results and provided Fisher’s exact p-values.

4.8. Metabolite and Protein Interaction Analysis

To construct metabolite and protein interaction networks, we selected metabolites and proteins as network nodes, which were annotated from functional enrichment analysis. First, biochemical reactions involving the metabolites and proteins identified from metabolomics and proteomics were searched in the KEGG database. Next, we constructed an interaction network of metabolites–proteins that share the same KEGG reaction and labeled the metabolites and proteins in the same pathway.

4.9. Statistical Analysis

CSF profiles, including cell count, chemistry, metabolites, and proteins, were compared in two ways. For paired samples analysis, the paired ventricular and lumbar samples were compared using Wilcoxon signed rank-sum test. Second, the CSF profiles were compared between groups of different compartments (ventricular versus lumbar) or those with or without spinal LM findings on spinal MRI using Mann–Whitney U test. A p-value less than 0.05 was considered statistically significant. All statistical analyses were performed using R software (version 3.3.2) or SPSS 18.0 (SPSS, Chicago, IL, USA). Prism 6 (GraphPad Software, La Jolla, CA, USA) was used to analyze data and generate figures.

5. Conclusions

We determined that profiles of metabolites and proteins differed between paired lumbar and ventricular CSF. We also identified LMIs and proteins that were significantly increased in spinal LM (+) CSF compared with spinal LM (−) CSF. The profiles of spinal LM (+) CSF showed similarity with lumbar CSF compared to ventricular CSF. Based on these results, we suggest that CSF LMI and proteins could reflect both different CSF compartments and localized LM disease activity, and differences in CSF associated with LM were more likely be present in the lumbar compartment. Further studies with larger numbers of samples and targeted MS are needed to validate these findings.

Supplementary Materials

The following are available online at https://www.mdpi.com/article/10.3390/metabo12010080/s1, Figure S1: Kyoto Encyclopedia of Genes and Genomes-based metabolite enrichment analysis at MetaboAnalylst online platform (ver.4.0) using discriminative LMIs, Figure S2: Volcano plot illustrating the similarity of LMIs distribution, Supplementary Table S1: Cerebrospinal fluid Low-mass ion analyses, Supplementary Table S2: Low-mass ion candidate search result, Supplementary Table S3: Cerebrospinal fluid Protein analyses, Supplementary Table S4: Cerebrospinal fluid Protein enrichment pathway (GO), Supplementary Table S5: Cerebrospinal fluid Protein enrichment pathway (KEGG), Supplementary Table S6: The original raw data of LMIs peak area, Supplementary Table S7: The original raw data of proteomics.

Author Contributions

J.-W.K. and J.H.I. have contributed equally to this work. Conceptualization, J.-W.K. and H.-S.G.; methodology, B.C.Y. and J.H.K.; formal analysis, J.H.L. and K.-H.K.; resources, K.-Y.L., S.H.S., and H.Y.; data curation, J.H.I. and J.H.L.; writing—original draft preparation, J.-W.K. and H.-S.G.; writing—review and editing, all authors; visualization, J.H.I. and J.H.L.; supervision, J.-W.K., B.C.Y., and H.-S.G. All authors have read and agreed to the published version of the manuscript.

Funding

This work was supported by grants from the National Cancer Center, Korea (NCC-1841110 and 2110531).

Institutional Review Board Statement

All patients were signed informed consent and the study was approved by Institutional Review Board (Identifier: 2014-0135) of the National Cancer Center, Goyang-si, Republic of Korea, according to the ethical guidelines outlined in the Declaration of Helsinki. The informed consent was obtained from all patients and legal representatives for patients below 18 years.

Informed Consent Statement

Informed consent was obtained from all subjects involved in the study.

Data Availability Statement

The datasets generated during and/or analyzed during the current study are available from the corresponding author on reasonable request. The data are not publicly available due to the information that could compromise research participant consent.

Conflicts of Interest

No potential conflicts of interest were disclosed.

References

  1. Chamberlain, M.C. Leptomeningeal metastasis. Curr. Opin. Oncol. 2010, 22, 627–635. [Google Scholar] [CrossRef]
  2. Taillibert, S.; Laigle-Donadey, F.; Chodkiewicz, C.; Sanson, M.; Hoang-Xuan, K.; Delattre, J.Y. Leptomeningeal metastases from solid malignancy: A review. J. Neurooncol. 2005, 75, 85–99. [Google Scholar] [CrossRef] [PubMed]
  3. Bruna, J.; Gonzalez, L.; Miro, J.; Velasco, R.; Gil, M.; Tortosa, A. Neuro-Oncology Unit of the Institute of Biomedical Investigation of B: Leptomeningeal carcinomatosis: Prognostic implications of clinical and cerebrospinal fluid features. Cancer 2009, 115, 381–389. [Google Scholar] [CrossRef]
  4. Grossman, S.A.; Krabak, M.J. Leptomeningeal carcinomatosis. Cancer Treat Rev. 1999, 25, 103–119. [Google Scholar] [CrossRef]
  5. Jayson, G.C.; Howell, A. Carcinomatous meningitis in solid tumours. Ann. Oncol. 1996, 7, 773–786. [Google Scholar] [CrossRef] [PubMed]
  6. Morris, P.G.; Reiner, A.S.; Szenberg, O.R.; Clarke, J.L.; Panageas, K.S.; Perez, H.R.; Kris, M.G.; Chan, T.A.; DeAngelis, L.M.; Omuro, A.M. Leptomeningeal metastasis from non-small-cell lung cancer: Survival and the impact of whole brain radiotherapy. J. Thorac. Oncol. 2012, 7, 382–385. [Google Scholar] [CrossRef] [Green Version]
  7. Park, J.H.; Kim, Y.J.; Lee, J.O.; Lee, K.W.; Kim, J.H.; Bang, S.M.; Chung, J.H.; Kim, J.S.; Lee, J.S. Clinical outcomes of leptomeningeal metastasis in patients with non-small-cell lung cancer in the modern chemotherapy era. Lung Cancer 2012, 76, 387–392. [Google Scholar] [CrossRef] [PubMed]
  8. Gajjar, A.; Fouladi, M.; Walter, A.W.; Thompson, S.J.; Reardon, D.A.; Merchant, T.E.; Jenkins, J.J.; Liu, A.; Boyett, J.M.; Kun, L.E.; et al. Comparison of lumbar and shunt cerebrospinal fluid specimens for cytologic detection of leptomeningeal disease in pediatric patients with brain tumors. J. Clin. Oncol. 1999, 17, 1825–1828. [Google Scholar] [CrossRef] [PubMed]
  9. Chamberlain, M.C.; Kormanik, P.A.; Glantz, M.J. A comparison between ventricular and lumbar cerebrospinal fluid cytology in adult patients with leptomeningeal metastases. Neuro-Oncol. 2001, 3, 42–45. [Google Scholar] [CrossRef]
  10. Agnihotri, S.; Zadeh, G. Metabolic reprogramming in glioblastoma: The influence of cancer metabolism on epigenetics and unanswered questions. Neuro-Oncol. 2016, 18, 160–172. [Google Scholar] [CrossRef] [Green Version]
  11. Brandner, S.; Thaler, C.; Lewczuk, P.; Lelental, N.; Buchfelder, M.; Kleindienst, A. Neuroprotein dynamics in the cerebrospinal fluid: Intraindividual concomitant ventricular and lumbar measurements. Eur. Neurol. 2013, 70, 189–194. [Google Scholar] [CrossRef] [PubMed] [Green Version]
  12. Shim, Y.; Gwak, H.S.; Kim, S.; Joo, J.; Shin, S.H.; Yoo, H. Retrospective Analysis of Cerebrospinal Fluid Profiles in 228 Patients with Leptomeningeal Carcinomatosis: Differences According to the Sampling Site, Symptoms, and Systemic Factors. J. Korean Neurosurg. Soc. 2016, 59, 570–576. [Google Scholar] [CrossRef]
  13. Chamberlain, M.C. Radioisotope CSF flow studies in leptomeningeal metastases. J. Neurooncol. 1998, 38, 135–140. [Google Scholar] [CrossRef] [PubMed]
  14. Schiff, D.; Feske, S.K.; Wen, P.Y. Deceptively normal ventricular fluid in lymphomatous meningitis. Arch. Intern. Med. 1993, 153, 389–390. [Google Scholar] [CrossRef] [PubMed]
  15. Street, J.M.; Barran, P.E.; Mackay, C.L.; Weidt, S.; Balmforth, C.; Walsh, T.S.; Chalmers, R.T.; Webb, D.J.; Dear, J.W. Identification and proteomic profiling of exosomes in human cerebrospinal fluid. J. Transl. Med. 2012, 10, 5. [Google Scholar] [CrossRef] [PubMed] [Green Version]
  16. Teplyuk, N.M.; Mollenhauer, B.; Gabriely, G.; Giese, A.; Kim, E.; Smolsky, M.; Kim, R.Y.; Saria, M.G.; Pastorino, S.; Kesari, S.; et al. MicroRNAs in cerebrospinal fluid identify glioblastoma and metastatic brain cancers and reflect disease activity. Neuro-Oncol. 2012, 14, 689–700. [Google Scholar] [CrossRef] [Green Version]
  17. Dekker, L.J.; Boogerd, W.; Stockhammer, G.; Dalebout, J.C.; Siccama, I.; Zheng, P.; Bonfrer, J.M.; Verschuuren, J.J.; Jenster, G.; Verbeek, M.M.; et al. MALDI-TOF mass spectrometry analysis of cerebrospinal fluid tryptic peptide profiles to diagnose leptomeningeal metastases in patients with breast cancer. Mol. Cell Proteom. 2005, 4, 1341–1349. [Google Scholar] [CrossRef] [Green Version]
  18. Ballester, L.Y.; Lu, G.; Zorofchian, S.; Vantaku, V.; Putluri, V.; Yan, Y.; Arevalo, O.; Zhu, P.; Riascos, R.F.; Sreekumar, A.; et al. Analysis of cerebrospinal fluid metabolites in patients with primary or metastatic central nervous system tumors. Acta Neuropathol. Commun. 2018, 6, r85. [Google Scholar] [CrossRef] [PubMed] [Green Version]
  19. Nakamizo, S.; Sasayama, T.; Shinohara, M.; Irino, Y.; Nishiumi, S.; Nishihara, M.; Tanaka, H.; Tanaka, K.; Mizukawa, K.; Itoh, T.; et al. GC/MS-based metabolomic analysis of cerebrospinal fluid (CSF) from glioma patients. J. Neurooncol. 2013, 113, r65–r74. [Google Scholar] [CrossRef] [Green Version]
  20. Lee, J.H.; Kim, K.H.; Park, J.W.; Chang, H.J.; Kim, B.C.; Kim, S.Y.; Kim, K.G.; Lee, E.S.; Kim, D.Y.; Oh, J.H.; et al. Low-mass-ion discriminant equation: A new concept for colorectal cancer screening. Int. J. Cancer 2014, 134, r1844–r1853. [Google Scholar] [CrossRef] [Green Version]
  21. Yoo, B.C.; Lee, J.H.; Kim, K.H.; Lin, W.; Kim, J.H.; Park, J.B.; Park, H.J.; Shin, S.H.; Yoo, H.; Kwon, J.W.; et al. Cerebrospinal fluid metabolomic profiles can discriminate patients with leptomeningeal carcinomatosis from patients at high risk for leptomeningeal metastasis. Oncotarget 2017, 8, r101203–r101214. [Google Scholar] [CrossRef] [Green Version]
  22. Chiasserini, D.; van Weering, J.R.; Piersma, S.R.; Pham, T.V.; Malekzadeh, A.; Teunissen, C.E.; de Wit, H.; Jimenez, C.R. Proteomic analysis of cerebrospinal fluid extracellular vesicles: A comprehensive dataset. J. Proteom. 2014, 106, 191–204. [Google Scholar] [CrossRef] [PubMed]
  23. Begcevic, I.; Brinc, D.; Brown, M.; Martinez-Morillo, E.; Goldhardt, O.; Grimmer, T.; Magdolen, V.; Batruch, I.; Diamandis, E.P. Brain-related proteins as potential CSF biomarkers of Alzheimer’s disease: A targeted mass spectrometry approach. J. Proteom. 2018, 182, 12–20. [Google Scholar] [CrossRef]
  24. Begcevic, I.; Brinc, D.; Dukic, L.; Simundic, A.M.; Zavoreo, I.; Basic Kes, V.; Martinez-Morillo, E.; Batruch, I.; Drabovich, A.P.; Diamandis, E.P. Targeted Mass Spectrometry-Based Assays for Relative Quantification of 30 Brain-Related Proteins and Their Clinical Applications. J. Proteome Res. 2018, 17, r2282–r2292. [Google Scholar] [CrossRef] [PubMed]
  25. Batruch, I.; Lim, B.; Soosaipillai, A.; Brinc, D.; Fiala, C.; Diamandis, E.P. Mass Spectrometry-Based Assay for Targeting Fifty-Two Proteins of Brain Origin in Cerebrospinal Fluid. J. Proteome Res. 2020, 19, r3060–r3071. [Google Scholar] [CrossRef] [PubMed]
  26. Uhlen, M.; Fagerberg, L.; Hallstrom, B.M.; Lindskog, C.; Oksvold, P.; Mardinoglu, A.; Sivertsson, A.; Kampf, C.; Sjostedt, E.; Asplund, A.; et al. Proteomics. Tissue-based map of the human proteome. Science 2015, 347, r1260419. [Google Scholar] [CrossRef] [PubMed]
  27. Bergman, J.; Svenningsson, A.; Liv, P.; Bergenheim, T.; Burman, J. Location matters: Highly divergent protein levels in samples from different CNS compartments in a clinical trial of rituximab for progressive MS. Fluids. Barriers CNS 2020, 17, r49. [Google Scholar] [CrossRef]
  28. Minta, K.; Jeppsson, A.; Brinkmalm, G.; Portelius, E.; Zetterberg, H.; Blennow, K.; Tullberg, M.; Andreasson, U. Lumbar and ventricular CSF concentrations of extracellular matrix proteins before and after shunt surgery in idiopathic normal pressure hydrocephalus. Fluids Barriers CNS 2021, 18, r23. [Google Scholar] [CrossRef]
  29. Glantz, M.J.; Cole, B.F.; Glantz, L.K.; Cobb, J.; Mills, P.; Lekos, A.; Walters, B.C.; Recht, L.D. Cerebrospinal fluid cytology in patients with cancer: Minimizing false-negative results. Cancer 1998, 82, r733–r739. [Google Scholar] [CrossRef]
  30. Cheok, S.K.; Narayan, A.; Arnal-Estape, A.; Gettinger, S.; Goldberg, S.B.; Kluger, H.M.; Nguyen, D.; Patel, A.; Chiang, V. Tumor DNA Mutations from Intraparenchymal Brain Metastases are Detectable in CSF. JCO Precis Oncol. 2021, 5, 163–172. [Google Scholar] [CrossRef]
  31. Pan, Z.; Yang, G.; He, H.; Gao, P.; Jiang, T.; Chen, Y.; Zhao, G. Identification of Cerebrospinal Fluid MicroRNAs Associated with Leptomeningeal Metastasis from Lung Adenocarcinoma. Front. Oncol. 2020, 10, 387. [Google Scholar] [CrossRef]
  32. Schmid, D.; Warnken, U.; Latzer, P.; Hoffmann, D.C.; Roth, J.; Kutschmann, S.; Jaschonek, H.; Rubmann, P.; Foltyn, M.; Vollmuth, P.; et al. Diagnostic biomarkers from proteomic characterization of cerebrospinal fluid in patients with brain malignancies. J. Neurochem. 2021, 158, r522–r538. [Google Scholar] [CrossRef] [PubMed]
  33. Lee, K.Y.; Im, J.H.; Lin, W.; Gwak, H.S.; Kim, J.H.; Yoo, B.C.; Kim, T.H.; Park, J.B.; Park, H.J.; Kim, H.J.; et al. Nanoparticles in 472 Human Cerebrospinal Fluid: Changes in Extracellular Vesicle Concentration and miR-21 Expression as a Biomarker for Leptomeningeal Metastasis. Cancers 2020, 12, 2745. [Google Scholar] [CrossRef] [PubMed]
  34. West, E.E.; Kolev, M.; Kemper, C. Complement and the Regulation of T Cell Responses. Annu. Rev. Immunol. 2018, 36, 309–338. [Google Scholar] [CrossRef] [PubMed]
  35. Boire, A.; Zou, Y.; Shieh, J.; Macalinao, D.G.; Pentsova, E.; Massague, J. Complement Component 3 Adapts the Cerebrospinal Fluid for Leptomeningeal Metastasis. Cell 2017, 168, r1101–r1113.e1113. [Google Scholar] [CrossRef] [PubMed] [Green Version]
  36. Hladky, S.B.; Barrand, M.A. Mechanisms of fluid movement into, through and out of the brain: Evaluation of the evidence. Fluids Barriers CNS 2014, 11, r26. [Google Scholar] [CrossRef] [Green Version]
  37. Foster, D.A. Phosphatidic acid signaling to mTOR: Signals for the survival of human cancer cells. Biochim. Biophys Acta 2009, 1791, r949–r955. [Google Scholar] [CrossRef] [Green Version]
  38. Goodsell, D.S. The molecular perspective: Methotrexate. Oncologist 1999, 4, r340–r341. [Google Scholar] [CrossRef] [Green Version]
  39. Koundouros, N.; Poulogiannis, G. Reprogramming of fatty acid metabolism in cancer. Br. J. Cancer 2020, 122, r4–r22. [Google Scholar] [CrossRef] [Green Version]
  40. Ogretmen, B. Sphingolipid metabolism in cancer signalling and therapy. Nat. Rev. Cancer 2018, 18, r33–r50. [Google Scholar] [CrossRef]
  41. Gwak, H.S.; Joo, J.; Shin, S.H.; Yoo, H.; Han, J.Y.; Kim, H.T.; Yun, T.; Ro, J.; Lee, J.S.; Lee, S.H. Ventriculolumbar perfusion chemotherapy with methotrexate for treating leptomeningeal carcinomatosis: A Phase II Study. Oncologist 2014, 19, r1044–r1045. [Google Scholar] [CrossRef] [PubMed] [Green Version]
  42. Freilich, R.J.; Krol, G.; DeAngelis, L.M. Neuroimaging and cerebrospinal fluid cytology in the diagnosis of leptomeningeal metastasis. Ann. Neurol. 1995, 38, r51–r57. [Google Scholar] [CrossRef] [PubMed]
Figure 1. Schematic diagram of the comparative profiling and workflow. (A) Illustration of comparative profiling of CSF metabolites and proteins according to the compartment and local leptomeningeal metastasis (LM) activity; (B) workflow of CSF processing for acquiring extracellular metabolome and proteome. Abbreviations: CSF—cerebrospinal fluid; LM—leptomeningeal metastasis; (+)—positive; (−)—negative; MeOH—methanol; LC–MS—liquid chromatography–mass spectrometry; TOF—time-of-flight; TMT—tandem mass tags; HPLC—high-performance liquid chromatography.
Metabolites 12 00080 g001
Figure 2. Evaluation of discriminative low mass ions (LMIs) between lumbar and ventricular CSF. (A) Volcano plot illustrating significantly discriminative LMIs for each compartment. X-axis: Log10(mean abundance of ventricular/mean abundance of lumbar). Y-axis: −Log10(paired t-test p-value). LMIs with 2-group t-test p-value < 0.05 are presented in blue or red color dots. An example of highly expressed LMIs in (B) lumbar and (C) ventricular CSF by comparing paired samples from each patient (n = 20).
Metabolites 12 00080 g002
Figure 3. Evaluation of discriminative LMIs between spinal LM (+) CSF and (−) lumbar CSF. (A) Volcano plot illustrating significantly discriminative LMIs for each group. X-axis: Log10(mean abundance of spinal LM (+) samples/mean abundance of spinal LM (−) samples). Y-axis: –Log10(independent t-test p-value). LMIs with 2-group t-test p-value < 0.05 are presented in purple or green color dots. An example of highly expressed LMIs in (B) spinal LM (+) samples compared with, and (C) spinal LM (−) samples.
Metabolites 12 00080 g003
Figure 4. Evaluation of differentially expressed proteins between lumbar and ventricular CSF. (A) Volcano plot illustrating significantly discriminative proteins for each compartment. X-axis: Log10(mean abundance of ventricular/mean abundance of lumbar). Y-axis: −Log10(paired t-test p-value). Proteins with 2-group t-test p-value < 0.05 are presented in navy or orange color dots. An example of proteins ion highly expressed in (B) lumbar and (C) ventricular CSF by paired comparisons from each patient (n = 14).
Metabolites 12 00080 g004
Figure 5. Evaluation of discriminative proteins between spinal LM (+) CSF and (−) lumbar CSF. (A) Volcano plot illustrating significantly discriminative proteins of each group. X-axis: Log10(mean abundance of spinal LM (+) samples/mean abundance of spinal LM (−) samples). Y-axis: –Log10(independent t-test p-value). Proteins with 2-group t-test p-value < 0.05 are presented in pink or brown color dots. An example of highly expressed protein in (B) spinal LM (+) samples and (C) spinal LM (−) samples.
Metabolites 12 00080 g005
Figure 6. Protein enrichment analysis for the Gene Ontology database biological processes using the top 10 pathways for (A) lumbar and ventricular CSF, and (B) spinal LM (+) and LM (−) CSF. Venn diagram illustrating the number of differentially expressed proteins comparing (C) ventricular and spinal LM (+) CSF and (D) lumbar and spinal LM (+) CSF.
Metabolites 12 00080 g006
Figure 7. Volcano plot illustrating the similarity of proteins distribution between discriminative lumbar (over ventricular) and spinal LM (+) (over spinal LM (−)) CSF samples. A single dot presents a single protein. X-axis: Log10(mean abundance of spinal LM (+) group/mean abundance of spinal LM (−) group). Y-axis: Log10(mean abundance of ventricle group/mean abundance of lumbar group). Proteins with 2-group t-test p-value < 0.05 are presented in pink or brown color dots. Pearson’s correlation coefficient was obtained using R (ver. 4.0.4). Pearson’s correlation coefficient r was calculated in R (ver. 3.6.0).
Metabolites 12 00080 g007
Figure 8. Metabolite–protein interaction network from LM CSF. Shaded proteins are relatively abundant in spinal LM (+) samples over LM (−) samples (pink) or in the ventricular CSF over lumbar CSF (grey). (A) Proinflammatory cytokines were abundant in discriminative LMIs of spinal LM (+) samples and coagulation cascade proteins were relatively abundant in the inhibition of coagulation activation. (B,C) Enzymes with relatively low expression levels in lumbar CSF were connected to discriminative LMIs in spinal LM (+) samples.
Metabolites 12 00080 g008
Table 1. Clinical characteristics of patients (n = 20).
CharacteristicsNo. of Patients (%)
Gender
Male11 (55)
Female9 (45)
Median age (range)56.5 (35–71)
Primary cancer
Lung10 (50)
Breast4 (20)
Melanoma2 (10)
Ovary1 (5)
Colorectal and Lung2 (10)
Unknown1 (5)
MRI finding at LM diagnosis
Accompanying brain metastasis14 (70)
Sulci enhancement15 (75)
Both ventricle wall and sulci enhancment1 (5%)
Spinal cord enhancement12 (63) a
a: Spine MRI was not taken in 1 patient. Abbreviations: LM—leptomeningeal metastasis.
Table 2. Differences of CSF profiles according to the sampling site and spine MRI finding of LM (n = 20).
CSF Profiles (Median (Range))
Cell Count (cells/mm3)Protein
(mg/dL)
Glucose
(mg/dL)
Sampling site
Lumbar13 (0–160)56 (12–294)50 (14–143)
Ventricular2 (0–13)11 (5–767)72 (18–129)
p value<0.0010.0130.047
Spinal LM
(+) (n = 12)12 (0–160)65 (40–294)50 (14–143)
(−) (n = 7)5 (2–60)32 (12–82)65 (34–115)
p value0.2390.0130.526
Table 3. Top 10 low mass ions increased in the lumbar CSF compared with the paired ventricular CSF.
Selected LMI (m/z a)Compound bMetabolite NameChemical FormulaClass
179.1052HMDB0036385
HMDB0040411
Methyl 4-phenylbutanoate
Ethyl 3-phenylpropanoate
C11H14O2
C11H14O2
Fatty Acyls
Fatty Acyls
213.8876 No matched results
241.8833 No matched results
378.9042 No matched results
446.8877 No matched results
473.2008HMDB00015345-Formiminotetrahydrofolic acidC20H24N8O6Pteridines
650.8546 No matched results
189.1129/189.1118HMDB0011717
HMDB0059814
HMDB0059783
HMDB0059879
HMDB0059760
HMDB0028700
HMDB0240640
Nonate
Diethyl methylsuccinate
3-Methylsuberic acid
Diethyl glutarate
2,4-Dimethylpimelic acid
Alanylvaline
Indolepropionamide
C9H16O4
C9H16O4
C9H16O4
C9H16O4
C9H16O4
C8H16N2O3
C11H12N2O
Fatty Acyls
Fatty Acyls
Fatty Acyls
Fatty Acyls
Fatty Acyls
Carboxylic acids
Indoles
156.8886 No matched results
a—mass–charge ratio; b—information used in searching candidate metabolite in the Human Metabolome Database (HMDB, http://www.hmdb.ca, accessed on 13 September 2021). Search condition: mass tolerance ± 0.05, H+ adduct in positive mode, delta (ppm) < 100 and endogenous origin.
Table 4. Top 10 low mass ions increased in the ventricular CSF compared with the paired lumbar CSF.
Selected LMI (m/z a)Compound bMetabolite NameChemical FormulaClass
319.2823HMDB0001449
HMDB0001455
HMDB0001471
HMDB0006759
HMDB0036740
HMDB0060408
HMDB0062782
HMDB0062594
Allopregnanolone
Alloepipregnanolone
Epipregnanolone
3a-Hydroxy-5b-pregnane-20-one
1-Hydroxy-2,5,12,15-heneicosatetraen-4-one
5alpha-Pregnan-20alpha-ol-3-one
Pregnanolone
Methyl Arachidonate
C21H34O2
C21H34O2
C21H34O2
C21H34O2
C21H34O2
C21H34O2
C21H34O2
C21H34O2
Steroids
Steroids
Steroids
Steroids
Fatty Acyls
Steroids
Steroids
Not classified
394.3519 No matched results
545.2581 No matched results
543.2650/543.2579HMDB0010320Cortolone-3-glucuronideC27H42O11Steroids
544.2640/544.2631HMDB0242178Glycocholenate sulfateC26H41NO9SSteroids
663.4039 No matched results
556.3920 No matched results
512.4137 No matched results
a—mass–charge ratio; b—information used in searching candidate metabolite in the Human Metabolome Database (HMDB, http://www.hmdb.ca, accessed on 13 September 2021). Search condition: mass tolerance ± 0.05, H+ adduct in positive mode, delta (ppm) < 100 and endogenous origin.
Table 5. Top 10 low mass ions in lumbar CSF, which were increased in spinal LM (+) than spinal LM (−).
Selected LMI (m/z a)Compound bMetabolite NameChemical FormulaClass
509.2978HMDB0240600
HMDB0115485
Lysophosphatidylglycerol (18:2(9Z,12Z)/0:0)
Phosphatidic acid (8:0/14:0)
C24H45O9P
C25H49O8P
Glycerophospholipids
836.4035 No matched results
302.3049HMDB0000269SphinganineC18H39NO2Organonitrogen
376.0097 No matched results
377.2650HMDB0012868
HMDB0011580
HMDB0012580
HMDB0003733
HMDB0062284
HMDB0011652
9′-Carboxy-gamma-chromanol
Monoacylgliceride(20:5/0:0/0:0)
14-Hydroxy-E4-neuroprostane
Resolvin D1
11-Hydroxy-E4-neuroprostane
11beta-Hydroxy-3,20-dioxopregn-4-en-21-oic acid
C23H36O4
C23H36O4
C22H32O5
C22H32O5
C22H32O5
C22H32O5
Benzopyrans
Glycerolipids
Fatty Acryls
Fatty Acryls
Fatty Acryls
Steroids
525.3722 No matched results
166.0553HMDB0002005
HMDB0003454
HMDB0004089
Methionine sulfoxide
4-Pyridoxolactone
Formylanthranilic acid
C5H11NO3S
C8H7NO3
C8H7NO3
Carboxylic acids
Pyridines
Benzene
229.1560HMDB0011174
HMDB0011175
HMDB0241042
Isoleucylproline
Leucylproline
4-Methylheptanoylcarnitine
C11H20N2O3
C11H20N2O3 C15H29NO4
Carboxylic acids
Carboxylic acids
Not classified
241.1057HMDB0000745
HMDB0005769
Homocarnosine
Balenine
C10H16N4O3
C10H16N4O3
Peptidomimetics
Peptidomimetics
400.3389HMDB0000222PalmitoylcarnitineC23H46NO4Fatty acyl
a mass–charge ratio; b information used in searching candidate metabolite in the Human Metabolome Database (HMDB, http://www.hmdb.ca, accessed on 13 September 2021). Search condition: mass tolerance ± 0.05, H+ adduct in positive mode, delta (ppm) < 100 and endogenous origin.
Table 6. Discriminative proteins that expressed higher in all lumbar CSF compared with paired ventricular CSF and that expressed higher in spinal LM (+) CSF compared with LM (−) CSF.
Lumbar > Ventriculara Ventricular > LumbarSpinal LM (+) > LM (−)
AccessionDescriptionAccessionDescriptionAccessionDescription
P01024Complement C3P12259Coagulation factor VP11684Uteroglobin
P01009-1Alpha-1-antitrypsinP02766TransthyretinP43652Afamin
*Q14624-1Inter-alpha-trypsin inhibitor heavy chain H4Q14515SPARC-like protein 1P04217-2Isoform 2 of Alpha-1B-glycoprotein
P19827-1Inter-alpha-trypsin inhibitor heavy chainQ13822-3Isoform 3 of Ectonucleotide pyrophosphatase/phosphodiesterase family member 2*P07360Complement component C8 gamma chain
P01042-2Isoform LMW of Kininogen-1P13591-2Neural cell adhesion molecule 1Q9NPH3Interleukin-1 receptor accessory protein
P19823Inter-alpha-trypsin inhibitor heavy chain H2P02788LactotransferrinP19823Inter-alpha-trypsin inhibitor heavy chain H2
P02748Complement component C9P36955Pigment epithelium-derived factorP02774vitamin D-binding protein
P01834Immunoglobulin kappa constantO94985-2Isoform 2 of Calsyntenin-1Q15063-1Periostin
*Q96PD5N-acetylmuramoyl-L-alanine amidaseO94985-1Calsyntenin-1P00748Coagulation factor XII
*P07357Complement component C8 alpha chainP05067-1Amyloid-beta A4 proteinQ13231-1Chitotriosidase-1
*P07358Complement component C8 beta chainP13521Secretogranin-2*Q14624-1Inter-alpha-trypsin inhibitor heavy chain H4
*P07360Complement component C8 gamma chainQ02246Contactin-2*Q96PD5N-acetylmuramoyl-L-alanine amidase
P35542Serum amyloid A-4 proteinQ16270-1Insulin-like growth factor-binding protein 7P08185Corticosteroid-binding globulin
Q4LDE5Sushi, von Willebrand factor type A, EGF, and pentraxin domain-containing protein 1P23471-1Receptor-type tyrosine-protein phosphatase zetaP02768-1Serum albumin
P01700Immunoglobulin lambda variable 1–47Q92876-1Kallikrein-6P00734Prothrombin
Q9HDC9Adipocyte plasma membrane-associatedQ8TEU8WAP, kazal, immunoglobulin, kunitz, and NTR domain-containing protein 2P00740Coagulation factor IX
A0A0C4DH68Immunoglobulin kappa variable 2–24Q96GW7Brevican core proteinP01009-1Alpha-1-antitrypsin
A0A0B4J1Y8Immunoglobulin lambda variable 9-P09486SparcP21741Midkine
Q8NFZ8Cell adhesion molecule 4P08697-1Alpha-2-antiplasmin
O94919Endonuclease domain-containing 1 proteinP01031Complement C5
P31150Rab GDP dissociation inhibitor alpha*P07358Complement component C8 beta chain
P00441Superoxide dismutase [Cu-Zn]*P07357Complement component C8 alpha chain
P05023Sodium/potassium-transporting ATPase subunit alpha-1P02671-1Fibrinogen alpha chain
P07686Beta-hexosaminidase subunit betaQ14520-1Hyaluronan-binding protein 2
P05408-2Isoform 2 of Neuroendocrine protein 7B2P00450Ceruloplasmin
O00584Ribonuclease T2O75636-1Ficolin-3
P30086Phosphatidylethanolamine-binding protein 1P17813Endoglin
Q9P121-4Isoform 4 of NeurotriminP04114Apolipoprotein B-100
Q08629Testican-1Q06033-1Inter-alpha-trypsin inhibitor heavy chain H3
P62987Ubiquitin-60S ribosomal protein L40P02655Apolipoprotein C-II
Q9H3G5Probable serine carboxypeptidase CPVLP26927Hepatocyte growth factor-like protein
Q9UHL4Dipeptidyl peptidase 2P13671Complement component c6
Q92563Testican-2P04004Vitronectin
P12277Creatine kinase B-typeP19652Alpha-1-acid glycoprotein 2
Q9BQT9Calsyntenin-3P01008Antithrombin-III
P01210Proenkephalin-AP02675Fibrinogen beta chain
Q96S96Phosphatidylethanolamine-binding protein 4P04196Histidine-rich glycoprotein
* Proteins are common to lumbar and spinal LM (+) CSF, and no proteins are shared between ventricular and spinal LM (+). a—38/82 discriminative ventricular proteins are listed for page edition (See Supplementary Table S3).
Publisher’s Note: MDPI stays neutral with regard to jurisdictional claims in published maps and institutional affiliations.

