
Unravelling the Puzzle of Anthranoid Metabolism in Living Plant Cells Using Spectral Imaging Coupled to Mass Spectrometry

 , ,
, ,  , ,
, , 
 , and
, and
Abstract
:1. Introduction
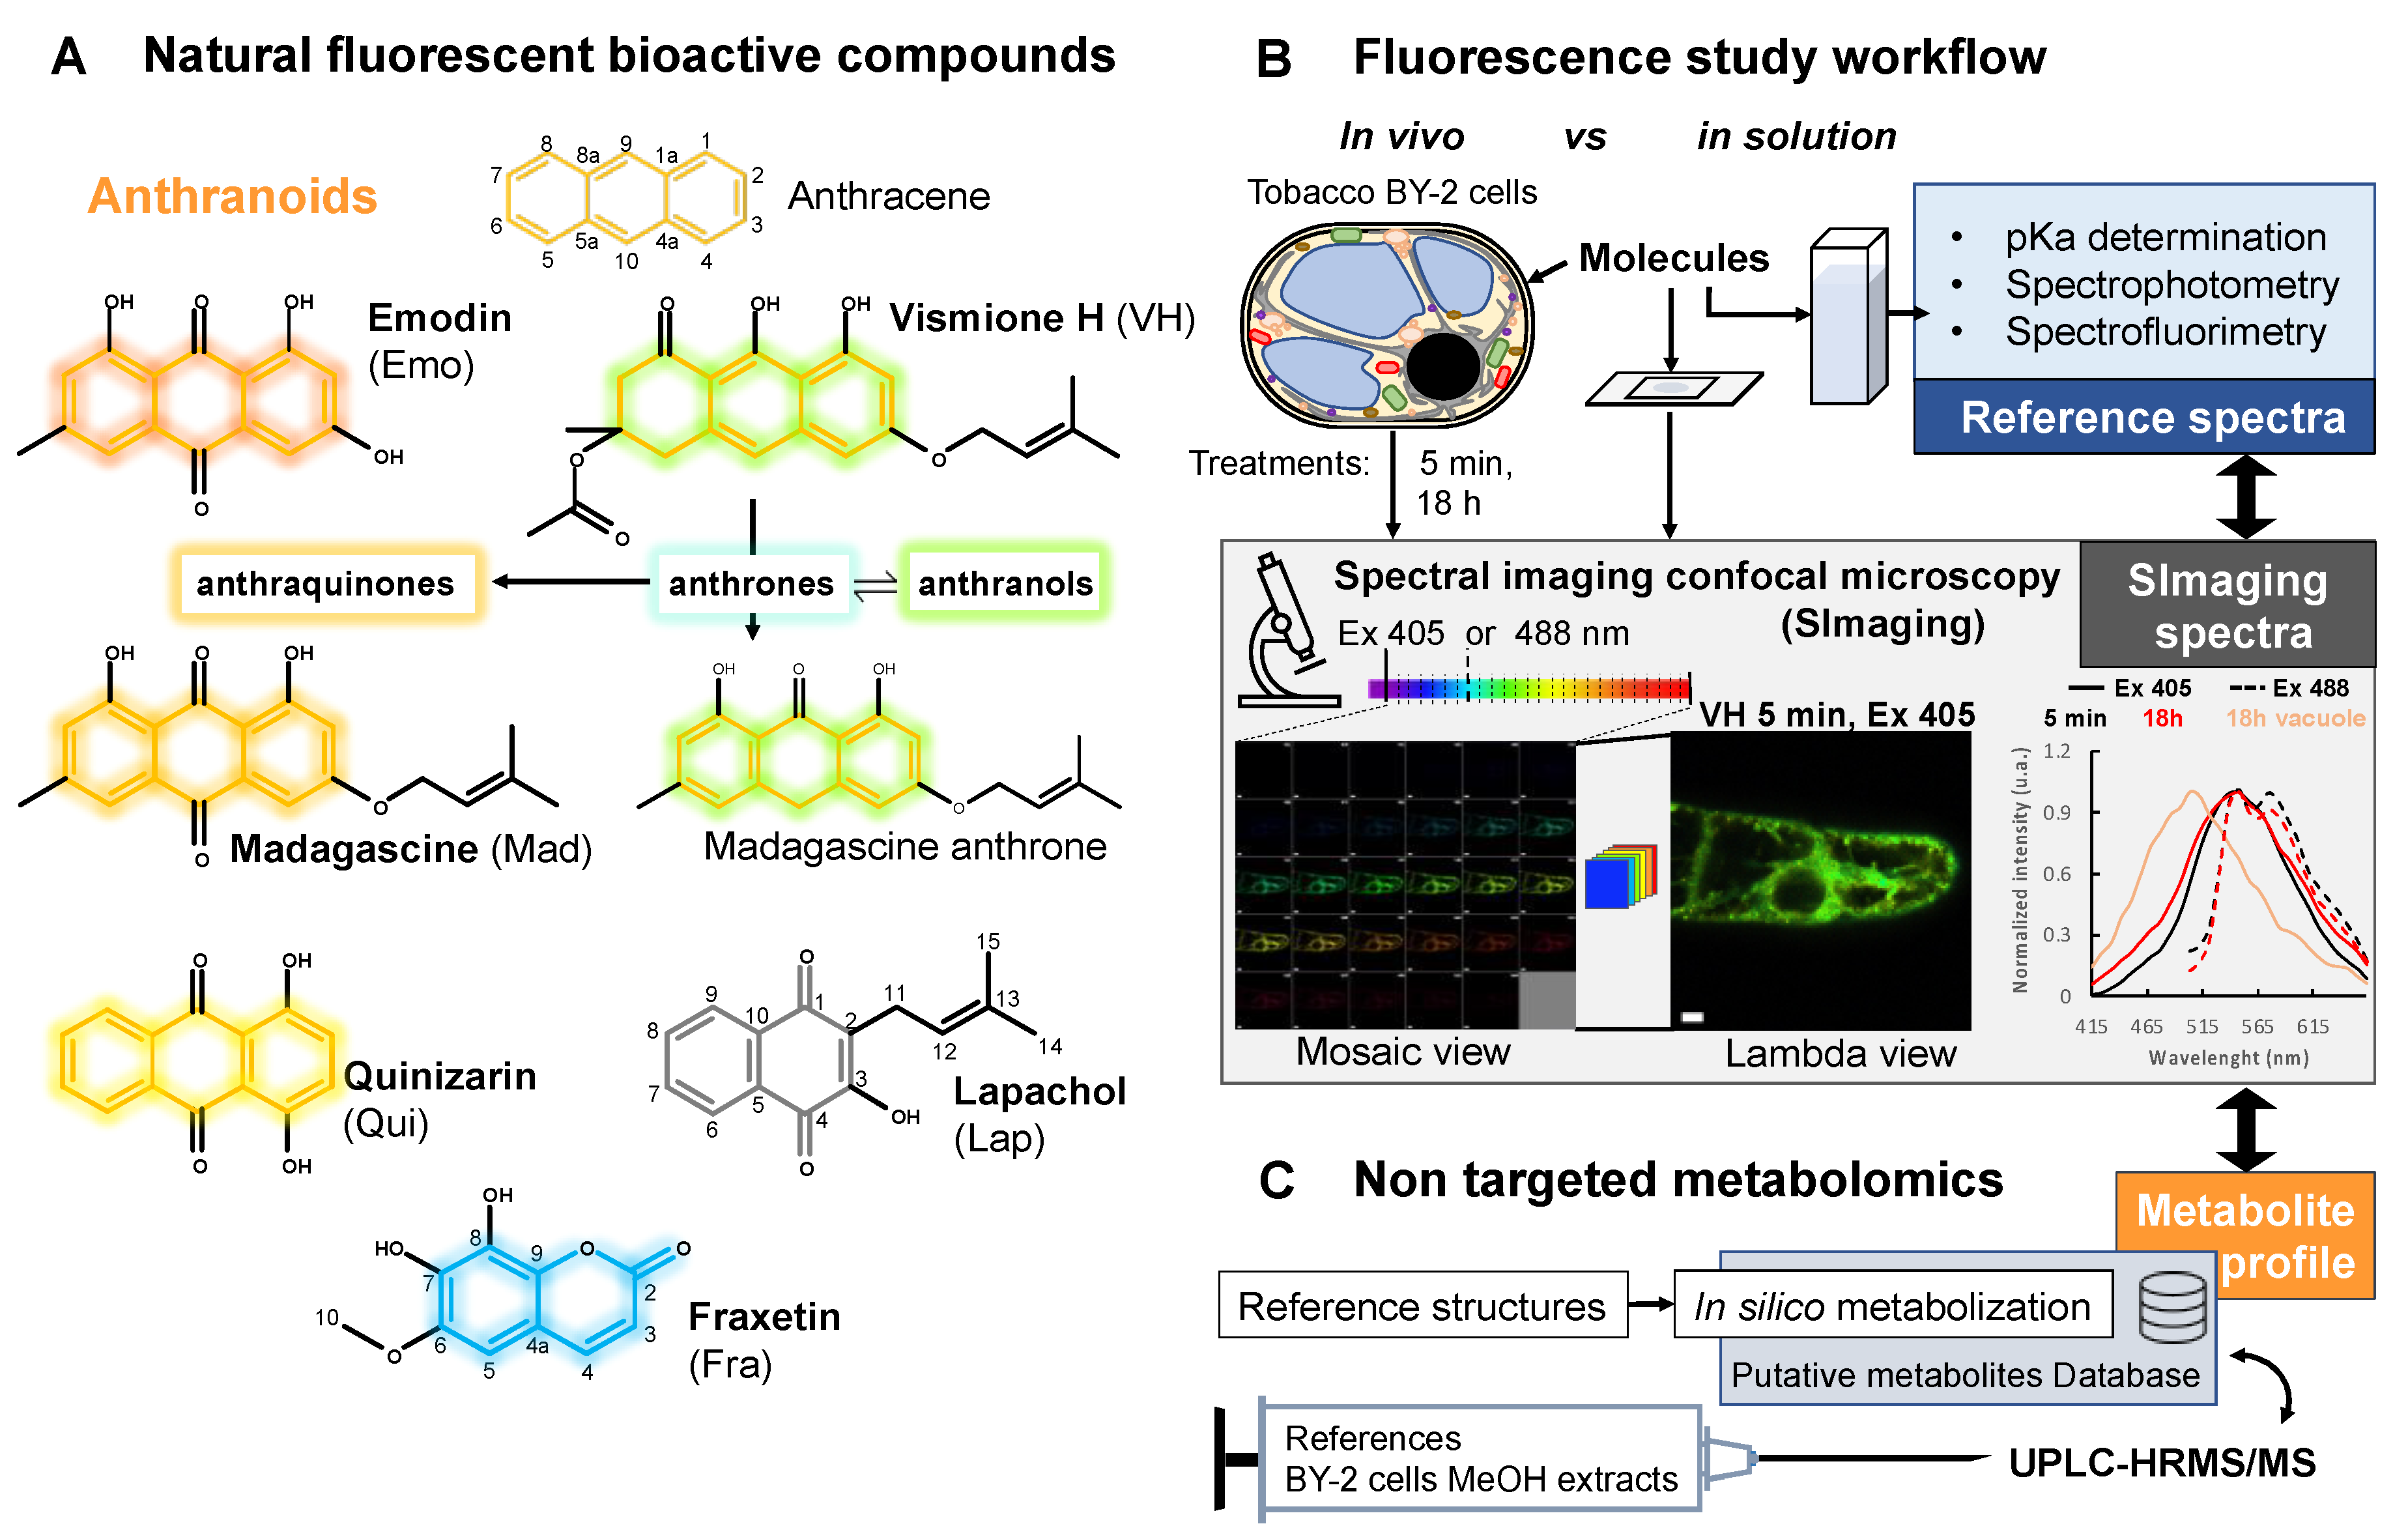
2. Results
2.1. PH Influences the Spectral Properties of Compounds in Solution
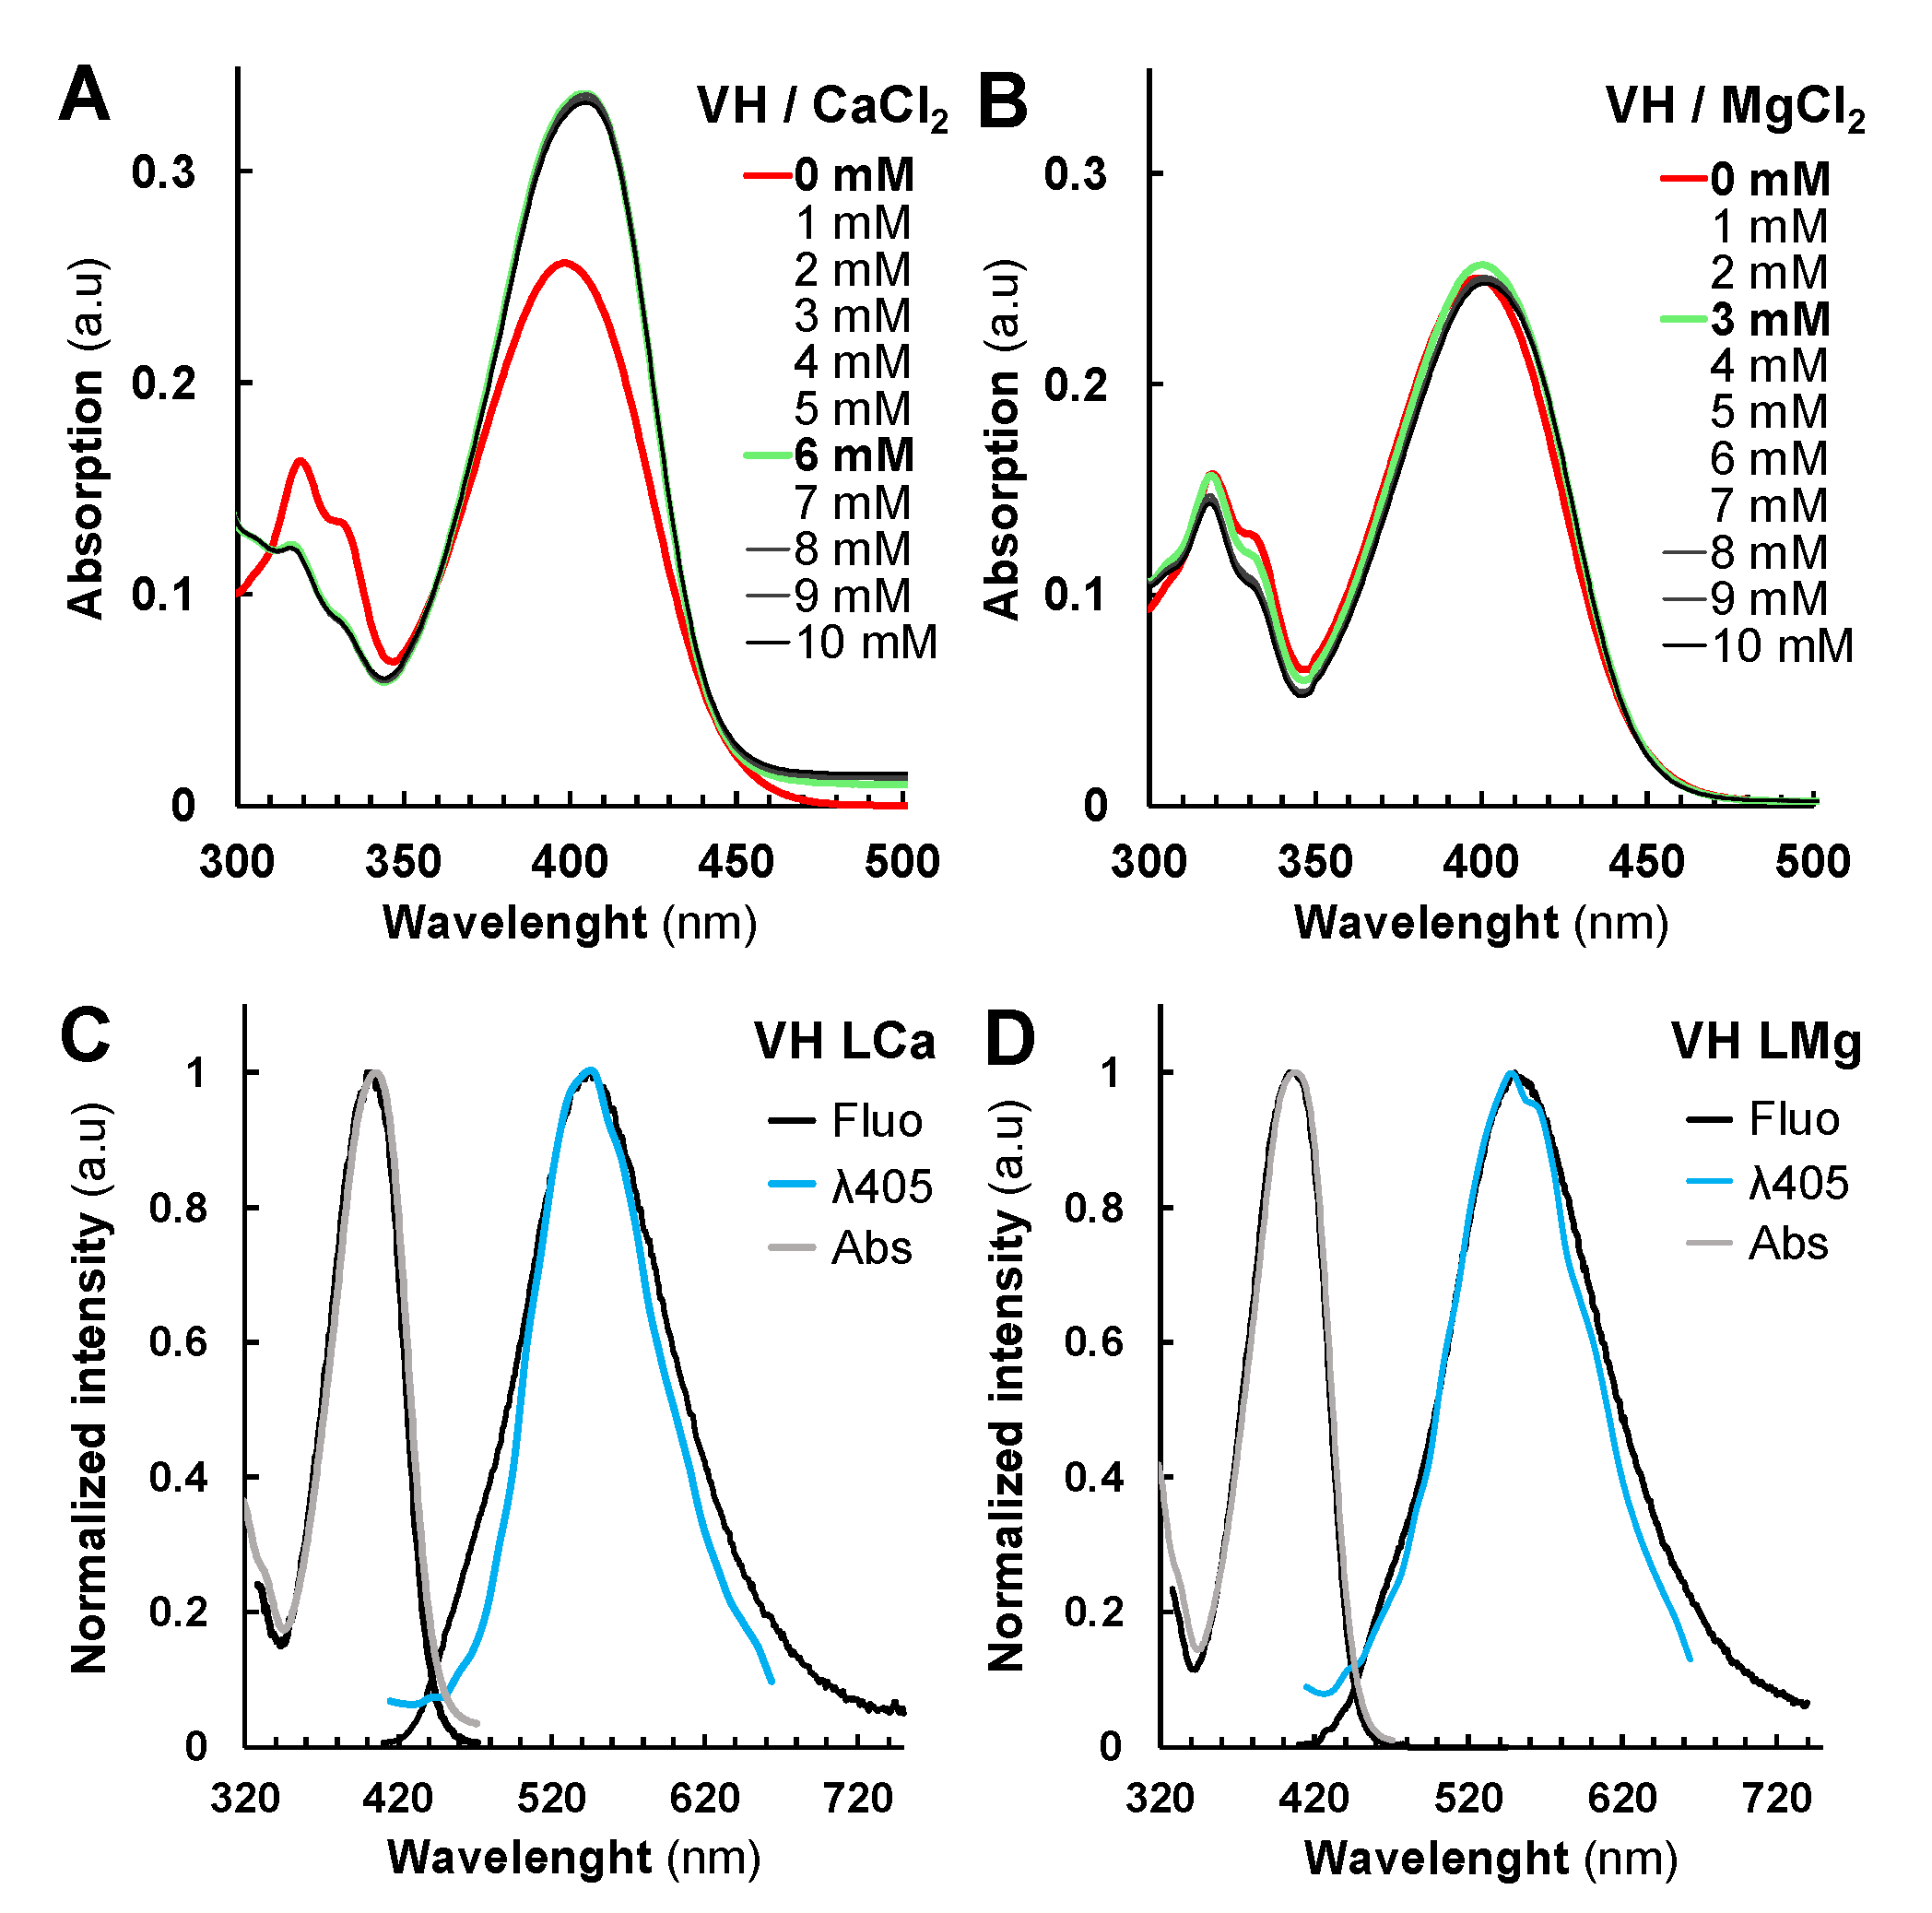
2.2. Metal and Protein Chelations Influence VH Fluorescence Properties
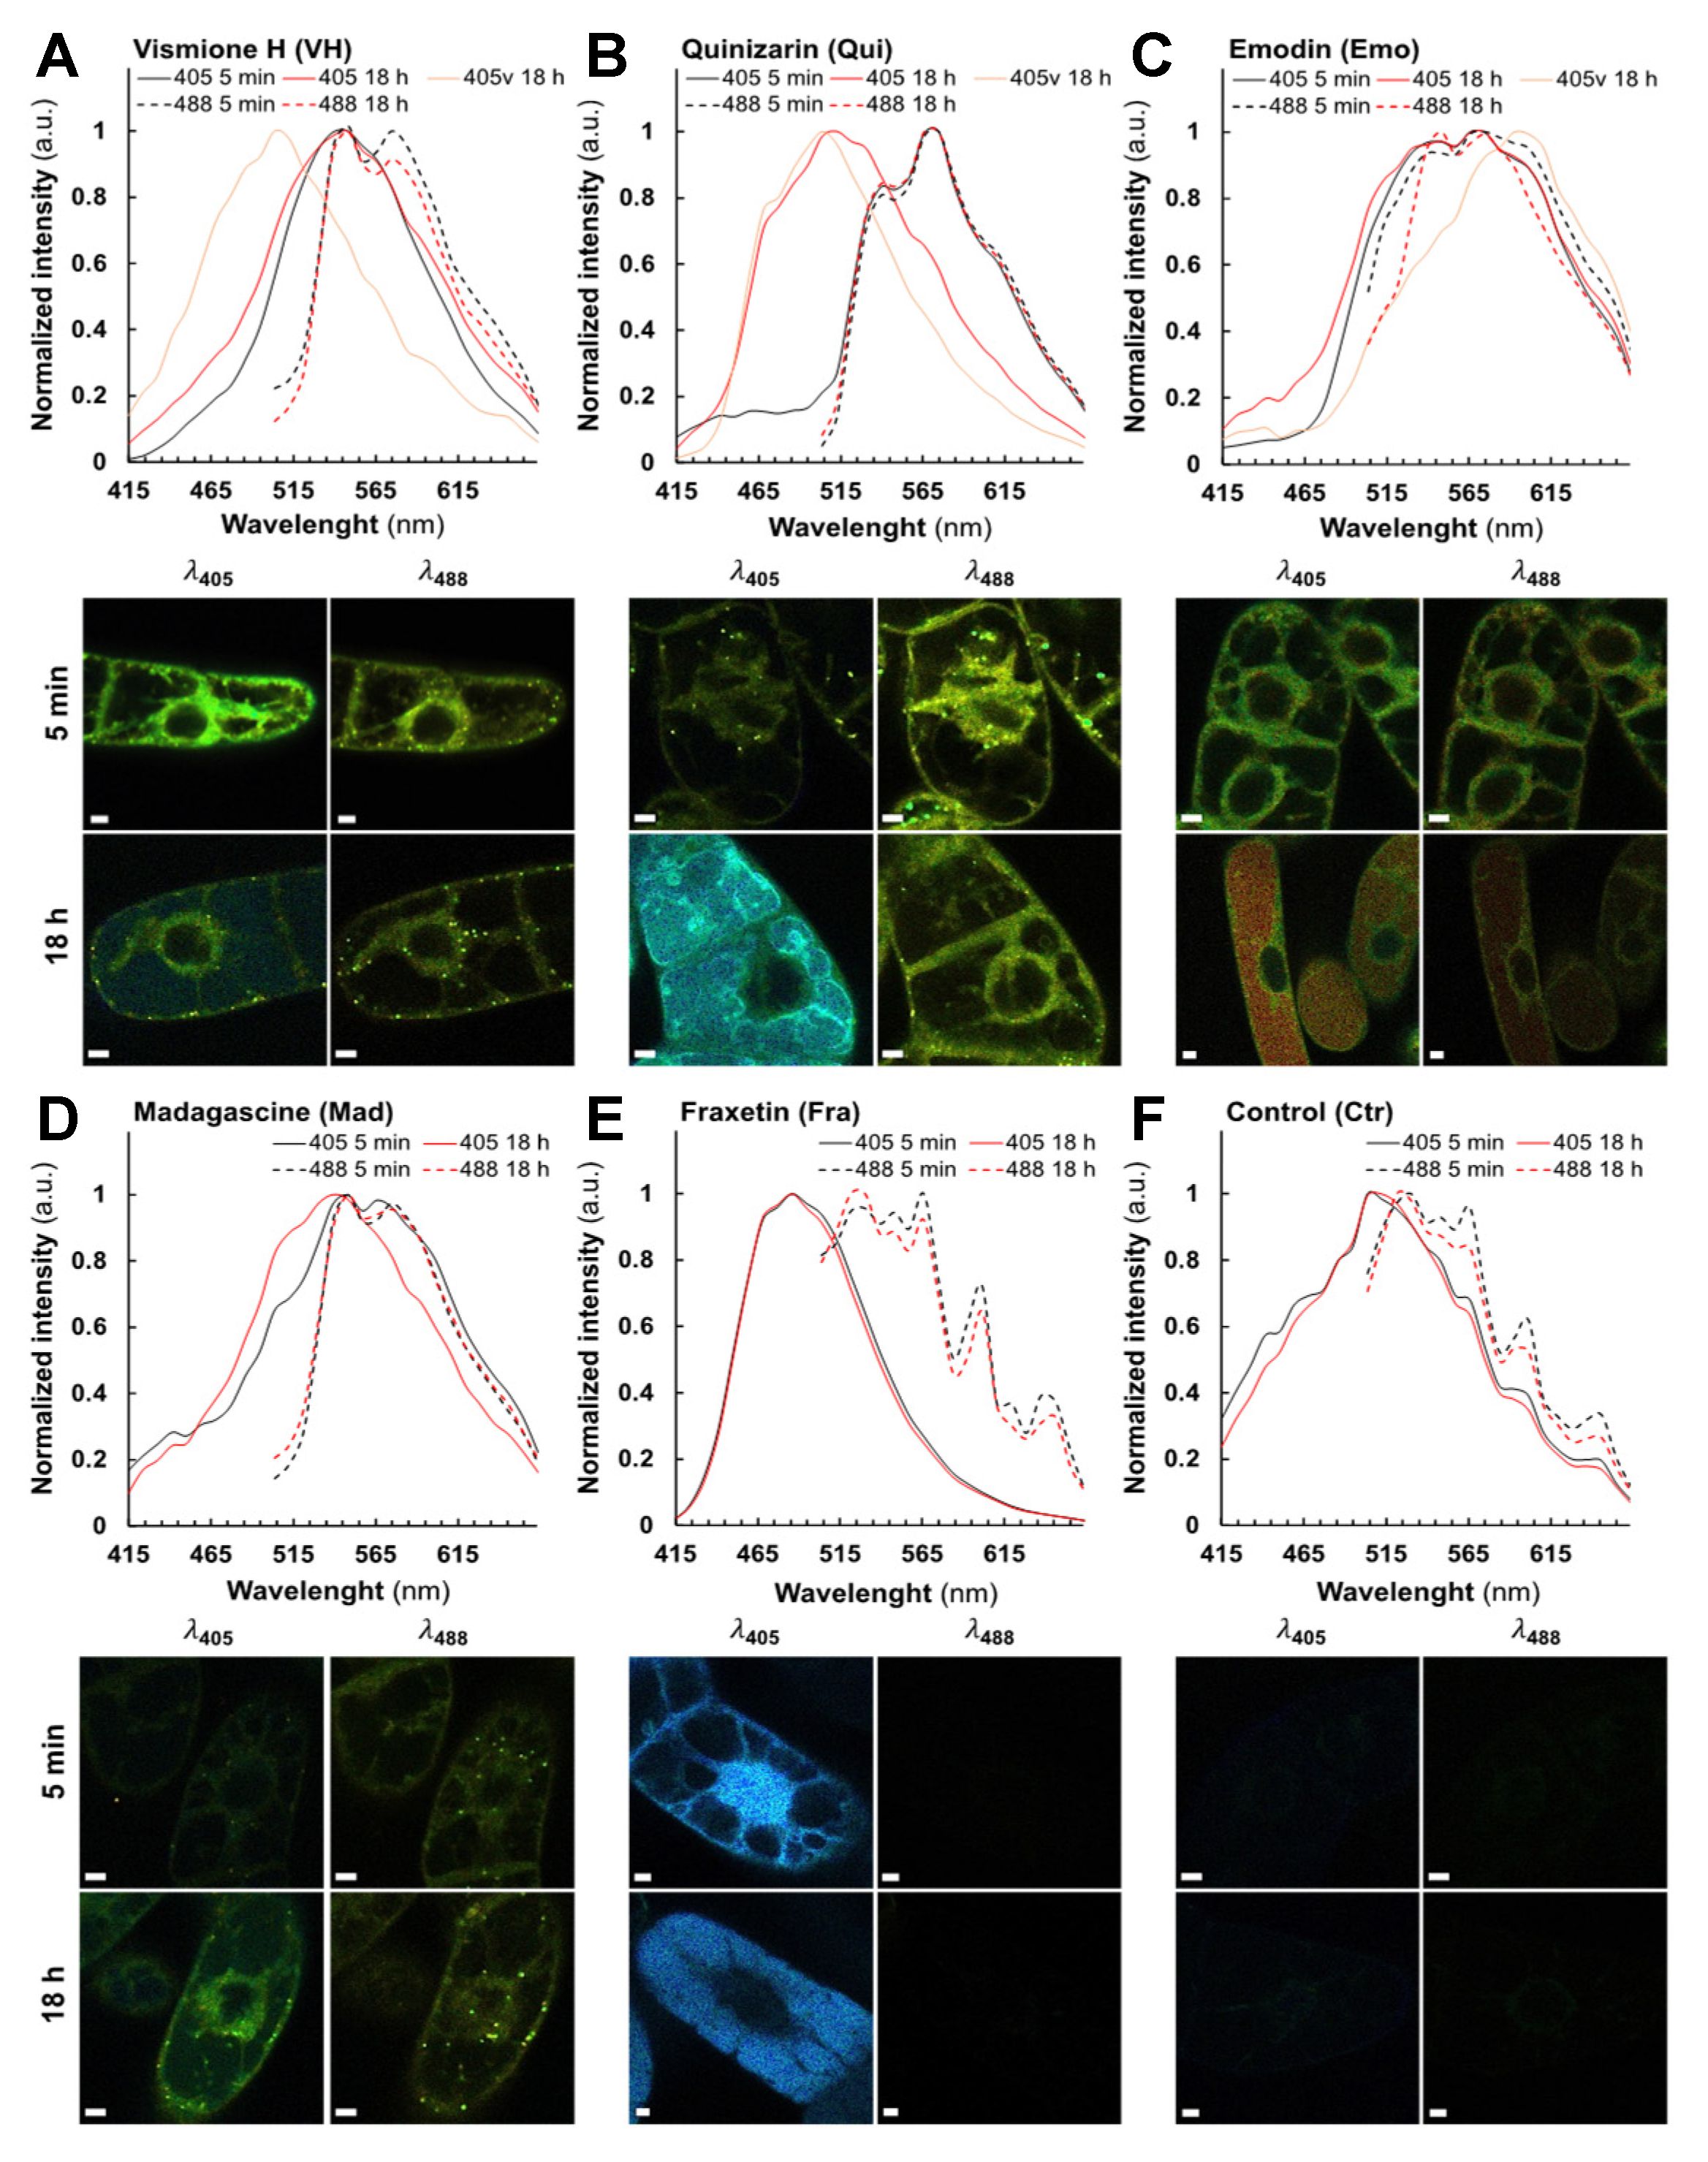
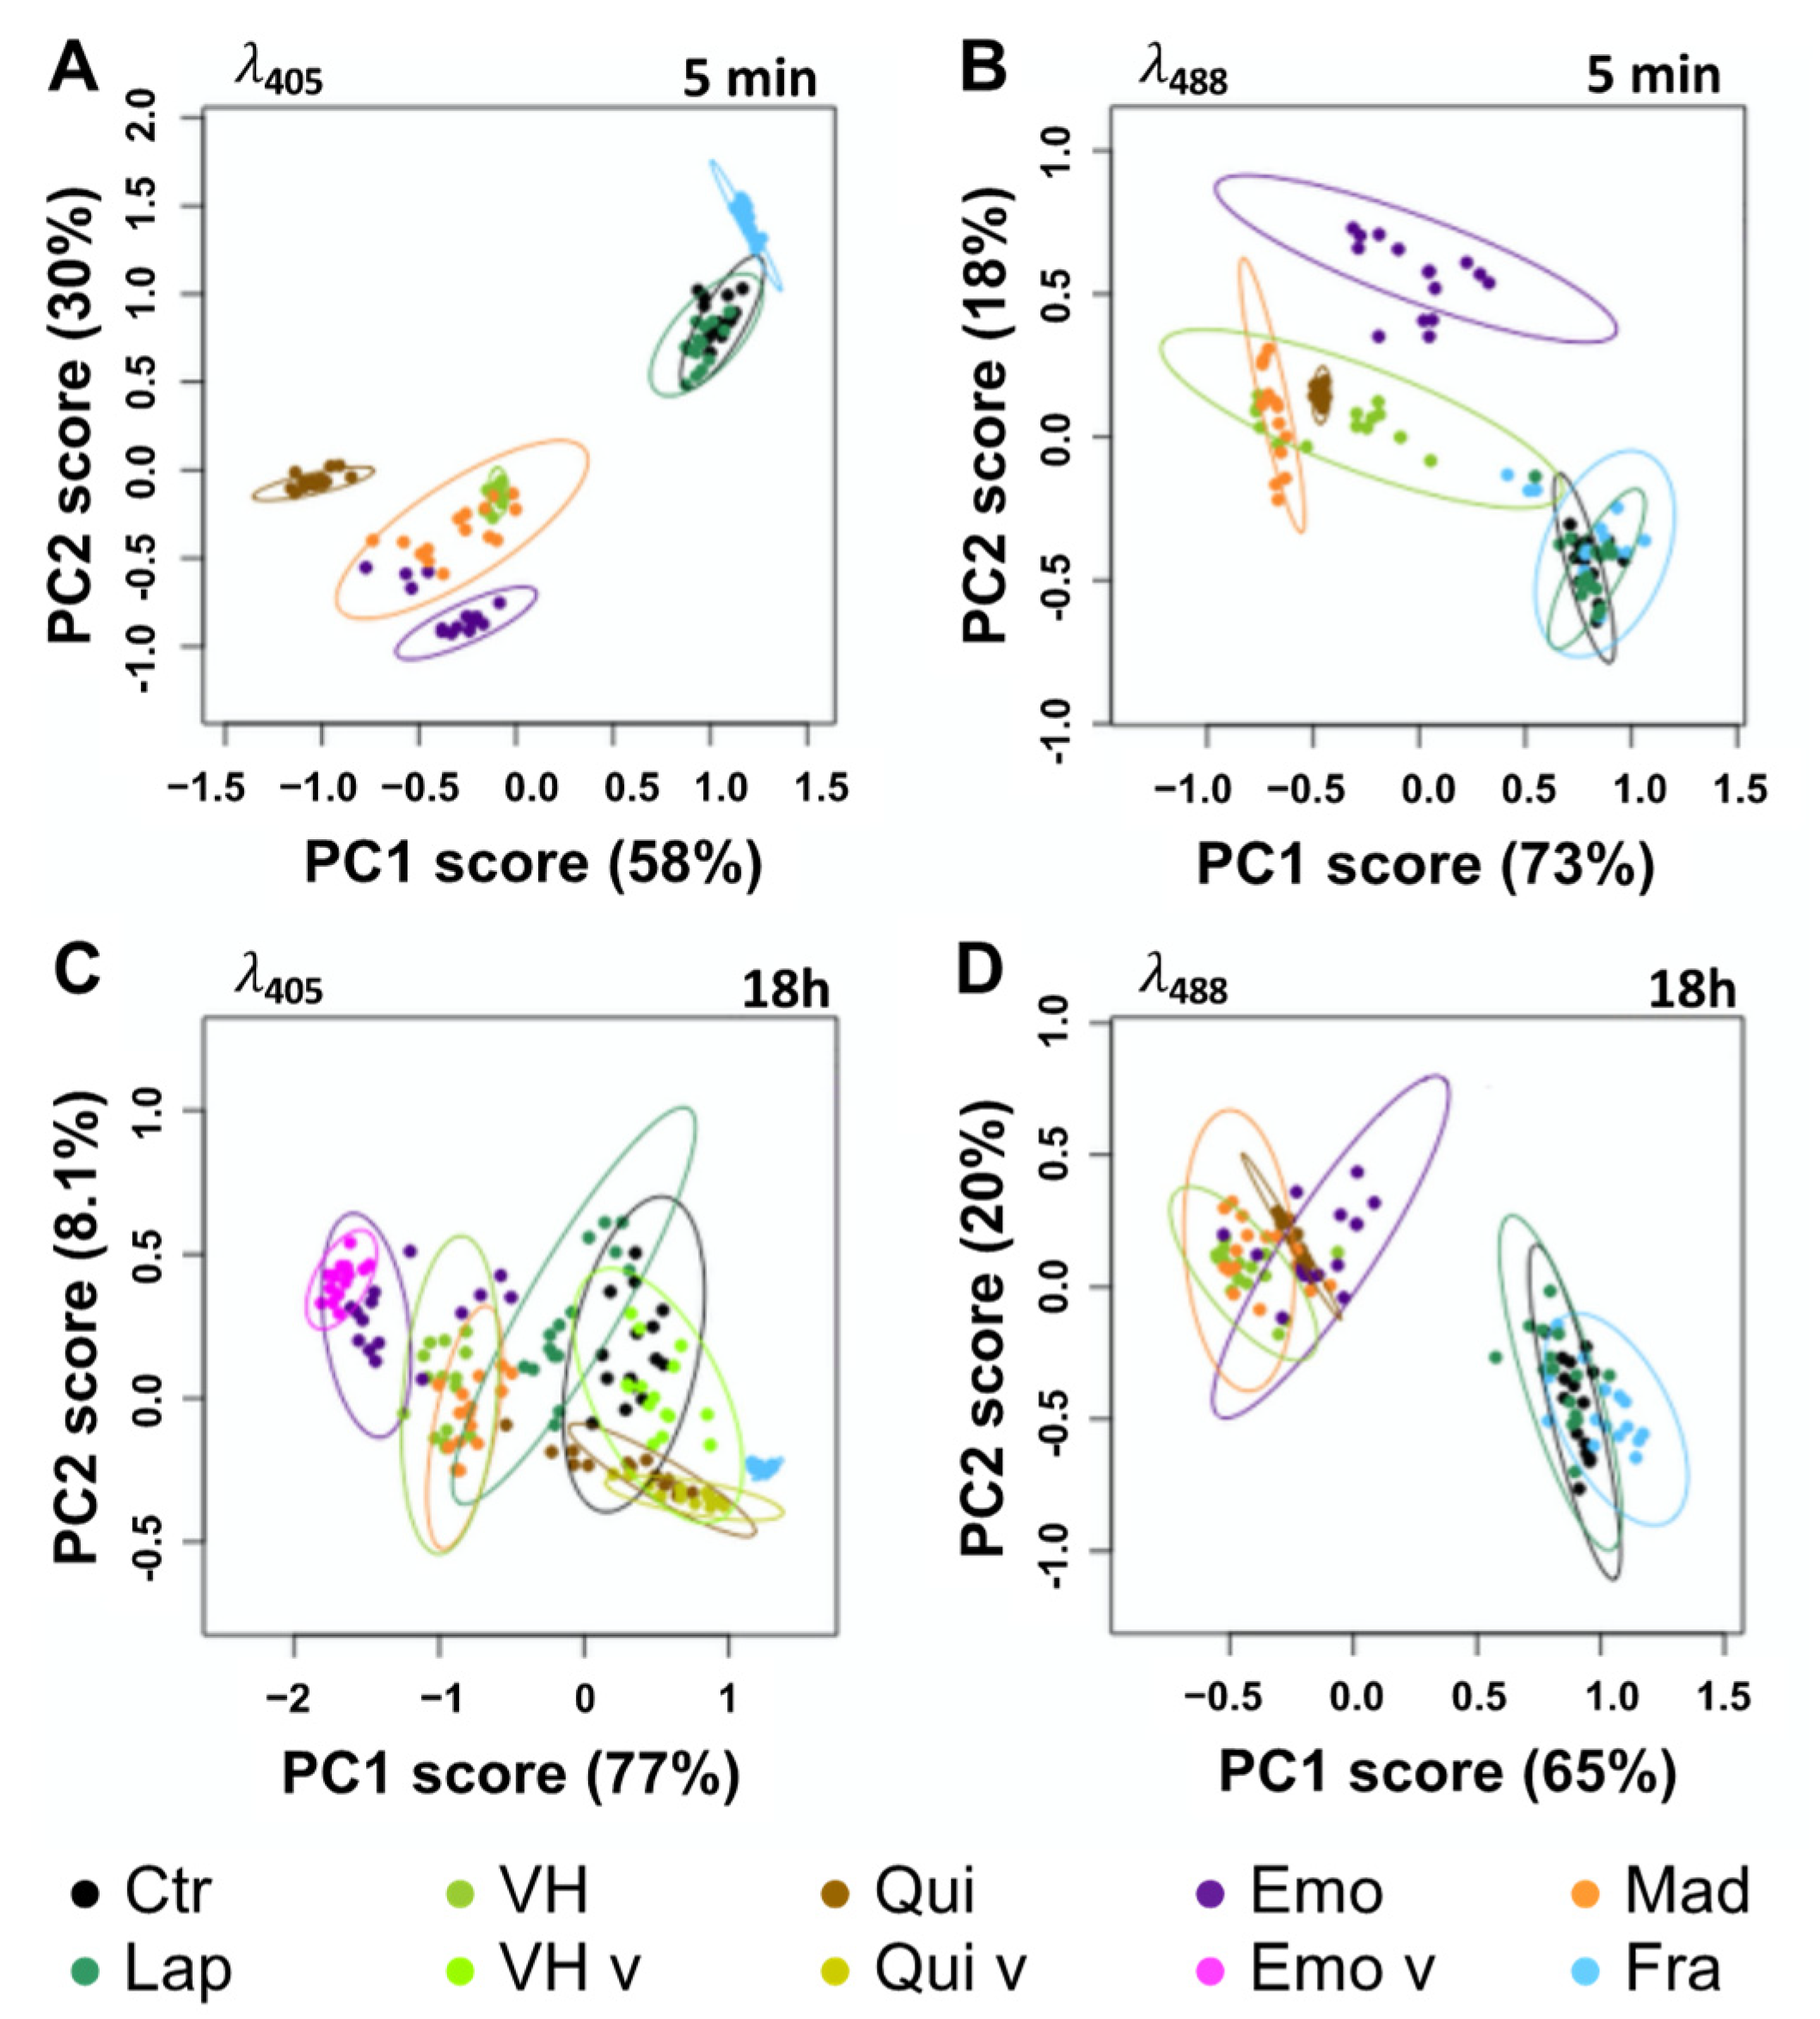
2.3. Fluorescent Anthranoids Metabolization and Transport in Cellula by Spectral Imaging
2.4. Fra and Methyl-Fra Derivatives Prevail to Fra-Glycosylated Forms
2.5. Metabolization of VH into Anthrones and Anthraquinones
3. Discussion
4. Materials and Methods
4.1. Chemicals
4.2. Spectrofluorimetric Analyses
4.3. Ca2+ and Mg2+ Chelating Assay
4.4. Plant Material and Treatment
4.5. Spectral Imaging (Simaging) Microscopy
4.6. Spectral Data Analysis
4.7. Non-Targeted Metabolomic Analysis
Supplementary Materials
Author Contributions
Funding
Institutional Review Board Statement
Informed Consent Statement
Data Availability Statement
Acknowledgments
Conflicts of Interest
References
- Tissier, A.; Ziegler, J.; Vogt, T. Specialized Plant Metabolites: Diversity and Biosynthesis. In Ecological Biochemistry; Krauss, G.-J., Nies, D.H., Eds.; Wiley-VCH Verlag GmbH & Co. KGaA: Weinheim, Germany, 2014; pp. 14–37. ISBN 978-3-527-68606-3. [Google Scholar]
- Mazimba, O.; Nana, F.; Singh, G.S. Xanthones and Anthranoids from the Medicinal Plants of Africa. In Medicinal Plant Research in Africa; Kuete, V., Ed.; Elsevier: Amsterdam, The Netherlands, 2013; pp. 393–434. ISBN 978-0-12-405927-6. [Google Scholar]
- Dong, X.; Fu, J.; Yin, X.; Cao, S.; Li, X.; Lin, L.; Huyiligeqi Ni, J. Emodin: A Review of Its Pharmacology, Toxicity and Pharmacokinetics: Emodin: Pharmacology, Toxicity and Pharmacokinetics. Phytother. Res. 2016, 30, 1207–1218. [Google Scholar] [CrossRef]
- Srinivas, G.; Babykutty, S.; Sathiadevan, P.P.; Srinivas, P. Molecular mechanism of emodin action: Transition from laxative ingredient to an antitumor agent. Med. Res. Rev. 2007, 27, 591–608. [Google Scholar] [CrossRef] [PubMed]
- François, G.; Steenackers, T.; Assi, L.A.; Steglich, W.; Lamottke, K.; Holenz, J.; Bringmann, G. Vismione H and structurally related anthranoid compounds of natural and synthetic origin as promising drugs against the human malaria parasite Plasmodium falciparum: Structure-activity relationships. Parasitol. Res. 1999, 85, 582–588. [Google Scholar] [CrossRef] [PubMed]
- Gallé, J.-B. Pharmacochimie d’anthranoïdes Issus Du Genre Psorospermum (Hypericaceae): Isolement, Activités Antipara-sitaires et Synthèse d’analogues Structuraux Jean-Baptiste Galle. Ph.D. Thesis, Université de Strasbourg, Strasbourg, France, 2015. [Google Scholar]
- Han, Y.-S.; Van Der Heijden, R.; Verpoorte, R. Biosynthesis of anthraquinones in cell cultures of the Rubiaceae. Plant Cell, Tissue Organ Cult. 2001, 67, 201–220. [Google Scholar] [CrossRef]
- Kang, S.-H.; Pandey, R.P.; Lee, C.-M.; Sim, J.-S.; Jeong, J.-T.; Choi, B.-S.; Jung, M.; Ginzburg, D.; Zhao, K.; Won, S.Y.; et al. Genome-enabled discovery of anthraquinone biosynthesis in Senna tora. Nat. Commun. 2020, 11, 5875. [Google Scholar] [CrossRef]
- Gill, M. The Biosynthesis of Pigments in Basidiomycetes. Aust. J. Chem. 2001, 54, 721. [Google Scholar] [CrossRef]
- Chiang, Y.-M.; Szewczyk, E.; Davidson, A.D.; Entwistle, R.; Keller, N.P.; Wang, C.C.C.; Oakley, B.R. Characterization of the Aspergillus nidulans Monodictyphenone Gene Cluster. Appl. Environ. Microbiol. 2010, 76, 2067–2074. [Google Scholar] [CrossRef] [Green Version]
- Fain, V.Y.; Zaitsev, B.E.; Ryabov, M.A. Tautomerism of anthraquinones: V. 1,5-Dihydroxy-9,10-anthraquinone and its substituted derivatives. Russ. J. Org. Chem. 2006, 42, 1662–1667. [Google Scholar] [CrossRef]
- Furumoto, T.; Jindai, A. Isolation and Photoisomerization of a New Anthraquinone from Hairy Root Cultures ofSesamum indicum. Biosci. Biotechnol. Biochem. 2008, 72, 2788–2790. [Google Scholar] [CrossRef] [Green Version]
- Elkazaz, S.; Jones, P.B. Photochemical Hydroxylation of 1-Methyl-9,10-anthraquinones: Synthesis of 9′-Hydroxyaloesaponarin II. J. Org. Chem. 2010, 75, 412–416. [Google Scholar] [CrossRef]
- Duval, R.; Duplais, C. Fluorescent natural products as probes and tracers in biology. Nat. Prod. Rep. 2017, 34, 161–193. [Google Scholar] [CrossRef]
- Fujii, T.; Mishima, S.; Tanaka, N.; Kawauchi, O.; Kodaira, K.; Nishikiori, H.; Kawai, Y. Absorption and fluorescence spectra of 9-anthrol and its chemical species in solution. Res. Chem. Intermed. 1997, 23, 829–839. [Google Scholar] [CrossRef]
- Rossi, S.; Tabolacci, C.; Lentini, A.; Provenzano, B.; Carlomosti, F.; Frezzotti, S.; Beninati, S. Anthraquinones danthron and quinizarin exert antiproliferative and antimetastatic activity on murine B16-F10 melanoma cells. Anticancer Res. 2010, 30, 445–449. [Google Scholar]
- Verebova, V.; Belej, D.; Joniova, J.; Jurasekova, Z.; Miskovsky, P.; Kozar, T.; Horvath, D.; Stanicova, J.; Huntosova, V. Deeper insights into the drug defense of glioma cells against hydrophobic molecules. Int. J. Pharm. 2016, 503, 56–67. [Google Scholar] [CrossRef]
- Conéjéro, G.; Noirot, M.; Talamond, P.; Verdeil, J.-L. Spectral analysis combined with advanced linear unmixing allows for histolocalization of phenolics in leaves of coffee trees. Front. Plant Sci. 2014, 5, 39. [Google Scholar] [CrossRef]
- Talamond, P.; Verdeil, J.-L.; Conéjéro, G. Secondary Metabolite Localization by Autofluorescence in Living Plant Cells. Molecules 2015, 20, 5024–5037. [Google Scholar] [CrossRef] [Green Version]
- Nagata, T.; Nemoto, Y.; Hasezawa, S. Tobacco BY-2 Cell Line as the “HeLa” Cell in the Cell Biology of Higher Plants. In In-ternational Review of Cytology; Elsevier: Amsterdam, The Netherlands, 1992; Volume 132, pp. 1–30. ISBN 978-0-12-364532-6. [Google Scholar]
- Tsai, H.-H.; Rodríguez-Celma, J.; Lan, P.; Wu, Y.-C.; Vélez-Bermúdez, I.C.; Schmidt, W. Scopoletin 8-Hydroxylase-Mediated Fraxetin Production Is Crucial for Iron Mobilization. Plant Physiol. 2018, 177, 194–207. [Google Scholar] [CrossRef] [PubMed] [Green Version]
- Lefèvre, F.; Fourmeau, J.; Pottier, M.; Baijot, A.; Cornet, T.; Abadia, J.; Álvarez-Fernández, A.; Boutry, M. The Nicotiana tabacum ABC transporter NtPDR3 secretes O-methylated coumarins in response to iron deficiency. J. Exp. Bot. 2018, 69, 4419–4431. [Google Scholar] [CrossRef] [Green Version]
- Binzel, M.L.; Hess, F.D.; Bressan, R.A.; Hasegawa, P.M. Intracellular Compartmentation of Ions in Salt Adapted Tobacco Cells. Plant Physiol. 1988, 86, 607–614. [Google Scholar] [CrossRef] [Green Version]
- Carden, D.E.; Walker, D.J.; Flowers, T.J.; Miller, A.J. Single-Cell Measurements of the Contributions of Cytosolic Na+ and K+ to Salt Tolerance. Plant Physiol. 2003, 131, 676–683. [Google Scholar] [CrossRef] [Green Version]
- Shen, J.; Zeng, Y.; Zhuang, X.; Sun, L.; Yao, X.; Pimpl, P.; Jiang, L. Organelle pH in the Arabidopsis Endomembrane System. Mol. Plant 2013, 6, 1419–1437. [Google Scholar] [CrossRef] [Green Version]
- Martinière, A.; Bassil, E.; Jublanc, E.; Alcon, C.; Reguera, M.; Sentenac, H.; Blumwald, E.; Paris, N. In Vivo Intracellular pH Measurements in Tobacco and Arabidopsis Reveal an Unexpected pH Gradient in the Endomembrane System. Plant Cell 2013, 25, 4028–4043. [Google Scholar] [CrossRef] [Green Version]
- Friedman, M.; Jürgens, H.S. Effect of pH on the Stability of Plant Phenolic Compounds. J. Agric. Food Chem. 2000, 48, 2101–2110. [Google Scholar] [CrossRef]
- Giusti, M.M.; Wrolstad, R.E. Characterization and Measurement of Anthocyanins by UV-Visible Spectroscopy. Curr. Protoc. Food Anal. Chem. 2001, 1, F1.2.1–F1.2.13. [Google Scholar] [CrossRef]
- Hlasiwetz, H.; Grabowski, A. Mittheilungen aus dem chemischen Laboratorium in Innsbruck. I. Ueber die Carminsäure. Ann. Chem. Pharm. 1867, 141, 329–345. [Google Scholar] [CrossRef]
- Cameron, D.; Edmonds, J.; Raverty, W. Oxidation of emodin anthrone and stereochemistry of emodin bianthrone. Ann. Chem. Pharm. 1976, 29, 1535–1548. [Google Scholar] [CrossRef]
- Sedaira, H.; Idriss, K.A.; Seleim, M.M.; Abdel-Aziz, M.S. Use of Quinizarin as a Spectrophotometric Reagent for MgO Content Analysis of Portland Cement and Cement Clinker. Monatshefte Für Chem. Chem. Mon. 1998, 129, 49–58. [Google Scholar] [CrossRef]
- Hepler, P.K. Calcium: A Central Regulator of Plant Growth and Development. Plant Cell 2005, 17, 2142–2155. [Google Scholar] [CrossRef]
- Waters, B.M. Moving magnesium in plant cells: Commentary. New Phytol. 2011, 190, 510–513. [Google Scholar] [CrossRef] [Green Version]
- Guo, W.; Chen, S.; Hussain, N.; Cong, Y.; Liang, Z.; Chen, K. Magnesium stress signaling in plant: Just a beginning. Plant Signal. Behav. 2015, 10, e992287. [Google Scholar] [CrossRef]
- Duval, R.; Cottet, K.; Blaud, M.; Merckx, A.; Houzé, S.; Grellier, P.; Lallemand, M.-C.; Michel, S. A Photoalkylative Fluorogenic Probe of Guttiferone A for Live Cell Imaging and Proteome Labeling in Plasmodium falciparum. Molecules 2020, 25, 5139. [Google Scholar] [CrossRef] [PubMed]
- Dudev, T.; Lim, C. Monodentate versus Bidentate Carboxylate Binding in Magnesium and Calcium Proteins: What Are the Basic Principles? J. Phys. Chem. B 2004, 108, 4546–4557. [Google Scholar] [CrossRef]
- Stringlis, I.A.; De Jonge, R.; Pieterse, C.M.J. The Age of Coumarins in Plant–Microbe Interactions. Plant Cell Physiol. 2019, 60, 1405–1419. [Google Scholar] [CrossRef] [Green Version]
- Osoba, O.A.; Roberts, M.F. Methyltransferase activity in Ailanthus Altissima cell suspension cultures. Plant Cell Rep. 1994, 13, 277–281. [Google Scholar] [CrossRef] [PubMed]
- Batchelor-McAuley, C.; Dimov, I.B.; Aldous, L.; Compton, R.G. The electrochemistry of quinizarin revealed through its mediated reduction of oxygen. Proc. Natl. Acad. Sci. USA 2011, 108, 19891–19895. [Google Scholar] [CrossRef] [PubMed] [Green Version]
- Robe, K.; Conejero, G.; Gao, F.; Lefebvre-Legendre, L.; Sylvestre-Gonon, E.; Rofidal, V.; Hem, S.; Rouhier, N.; Barberon, M.; Hecker, A.; et al. Coumarin accumulation and trafficking in Arabidopsis thaliana: A complex and dynamic process. New Phytol. 2021, 229, 2062–2079. [Google Scholar] [CrossRef]
- Yamamoto, H.; Tabata, M.; Leistner, E. Cytological changes associated with induction of anthraquinone synthesis in photoautotrophic cell suspension cultures of Morinda lucida. Plant Cell Rep. 1987, 6, 187–190. [Google Scholar] [CrossRef]
- Hemmerlin, A.; Bach, T.J. Farnesol-Induced Cell Death and Stimulation of 3-Hydroxy-3-Methylglutaryl-Coenzyme A Reduc-tase Activity in Tobacco Cv Bright Yellow-2 Cells. Plant Physiol. 2000, 123, 1257–1268. [Google Scholar] [CrossRef] [Green Version]
- Villette, C.; Zumsteg, J.; Schaller, H.; Heintz, D. Non-targeted metabolic profiling of BW312 Hordeum vulgare semi dwarf mutant using UHPLC coupled to QTOF high resolution mass spectrometry. Sci. Rep. 2018, 8, 13178. [Google Scholar] [CrossRef]
- Villette, C.; Maurer, L.; Wanko, A.; Heintz, D. Xenobiotics metabolization in Salix alba leaves uncovered by mass spectrometry imaging. Metabolomics 2019, 15, 122. [Google Scholar] [CrossRef]


| Compounds Name | [C] (µM) | λabs (nm) | ε (104 M−1 cm−1) | λEx (nm) | λEm (nm) | ΦF (%) | SI λEm (nm) |
|---|---|---|---|---|---|---|---|
| Vismione H (LH2) a | 2.6 | 398 | 1.1 | 396 | 481 | 3.9 | 503 |
| Vismione H (LB) b | 403 | 1.40 | 402 | 532 | 31.0 | 530 | |
| Vismione H (LNH4+) c | 403 | 1.93 | 403 | 533 | 24.0 | 530 | |
| Vismione H-Ca (LCa) d | 404 | 1.36 | 404 | 549 | 19.8 | 548 | |
| Vismione H-Mg (LMg) e | 407 | 1.40 | 404 | 550 | 18.6 | 548 | |
| Vismione H-BSA (LBSA) f | 404 | 1.21 | 404 | 517 | 23.5 | 530 | |
| Emodin (LH3) a | 5.55 | 443 | 1.68 | 442 | 575 | 0.7 | 565 |
| Madagascine (LH2) a | 2.96 | 437 | 0.64 | 446 | 544 | 4.8 | 565 |
| Quinizarin (LH2) a | 4.16 | 480 | 0.38 | 479 | 569 | 15.1 | 565 |
| Fraxetin (LB) b | 4.8 | 366 | 1.05 | 367 | 492 | 1.1 | 521 |
| Fraxetin (LNH4+) c | 399 | 0.87 | 382 | 481 | 0.8 | 521 | |
| Fraxetin-BSA (LBSA) f | 410 | 2.04 | 410 | 490 | 8.4 | 503 |
Publisher’s Note: MDPI stays neutral with regard to jurisdictional claims in published maps and institutional affiliations. |
© 2021 by the authors. Licensee MDPI, Basel, Switzerland. This article is an open access article distributed under the terms and conditions of the Creative Commons Attribution (CC BY) license (https://creativecommons.org/licenses/by/4.0/).
Share and Cite
Chevalier, Q.; Gallé, J.-B.; Wasser, N.; Mazan, V.; Villette, C.; Mutterer, J.; Elustondo, M.M.; Girard, N.; Elhabiri, M.; Schaller, H.; et al. Unravelling the Puzzle of Anthranoid Metabolism in Living Plant Cells Using Spectral Imaging Coupled to Mass Spectrometry. Metabolites 2021, 11, 571. https://doi.org/10.3390/metabo11090571
Chevalier Q, Gallé J-B, Wasser N, Mazan V, Villette C, Mutterer J, Elustondo MM, Girard N, Elhabiri M, Schaller H, et al. Unravelling the Puzzle of Anthranoid Metabolism in Living Plant Cells Using Spectral Imaging Coupled to Mass Spectrometry. Metabolites. 2021; 11(9):571. https://doi.org/10.3390/metabo11090571
Chicago/Turabian StyleChevalier, Quentin, Jean-Baptiste Gallé, Nicolas Wasser, Valérie Mazan, Claire Villette, Jérôme Mutterer, Maria Mercedes Elustondo, Nicolas Girard, Mourad Elhabiri, Hubert Schaller, and et al. 2021. "Unravelling the Puzzle of Anthranoid Metabolism in Living Plant Cells Using Spectral Imaging Coupled to Mass Spectrometry" Metabolites 11, no. 9: 571. https://doi.org/10.3390/metabo11090571
APA StyleChevalier, Q., Gallé, J.-B., Wasser, N., Mazan, V., Villette, C., Mutterer, J., Elustondo, M. M., Girard, N., Elhabiri, M., Schaller, H., Hemmerlin, A., & Vonthron-Sénécheau, C. (2021). Unravelling the Puzzle of Anthranoid Metabolism in Living Plant Cells Using Spectral Imaging Coupled to Mass Spectrometry. Metabolites, 11(9), 571. https://doi.org/10.3390/metabo11090571