
Deuterium Metabolic Imaging—Rediscovery of a Spectroscopic Tool

 , , , and
Abstract

1. Introduction
2. DMI-Companion Metabolic Imaging Tools
3. DMI Methodology
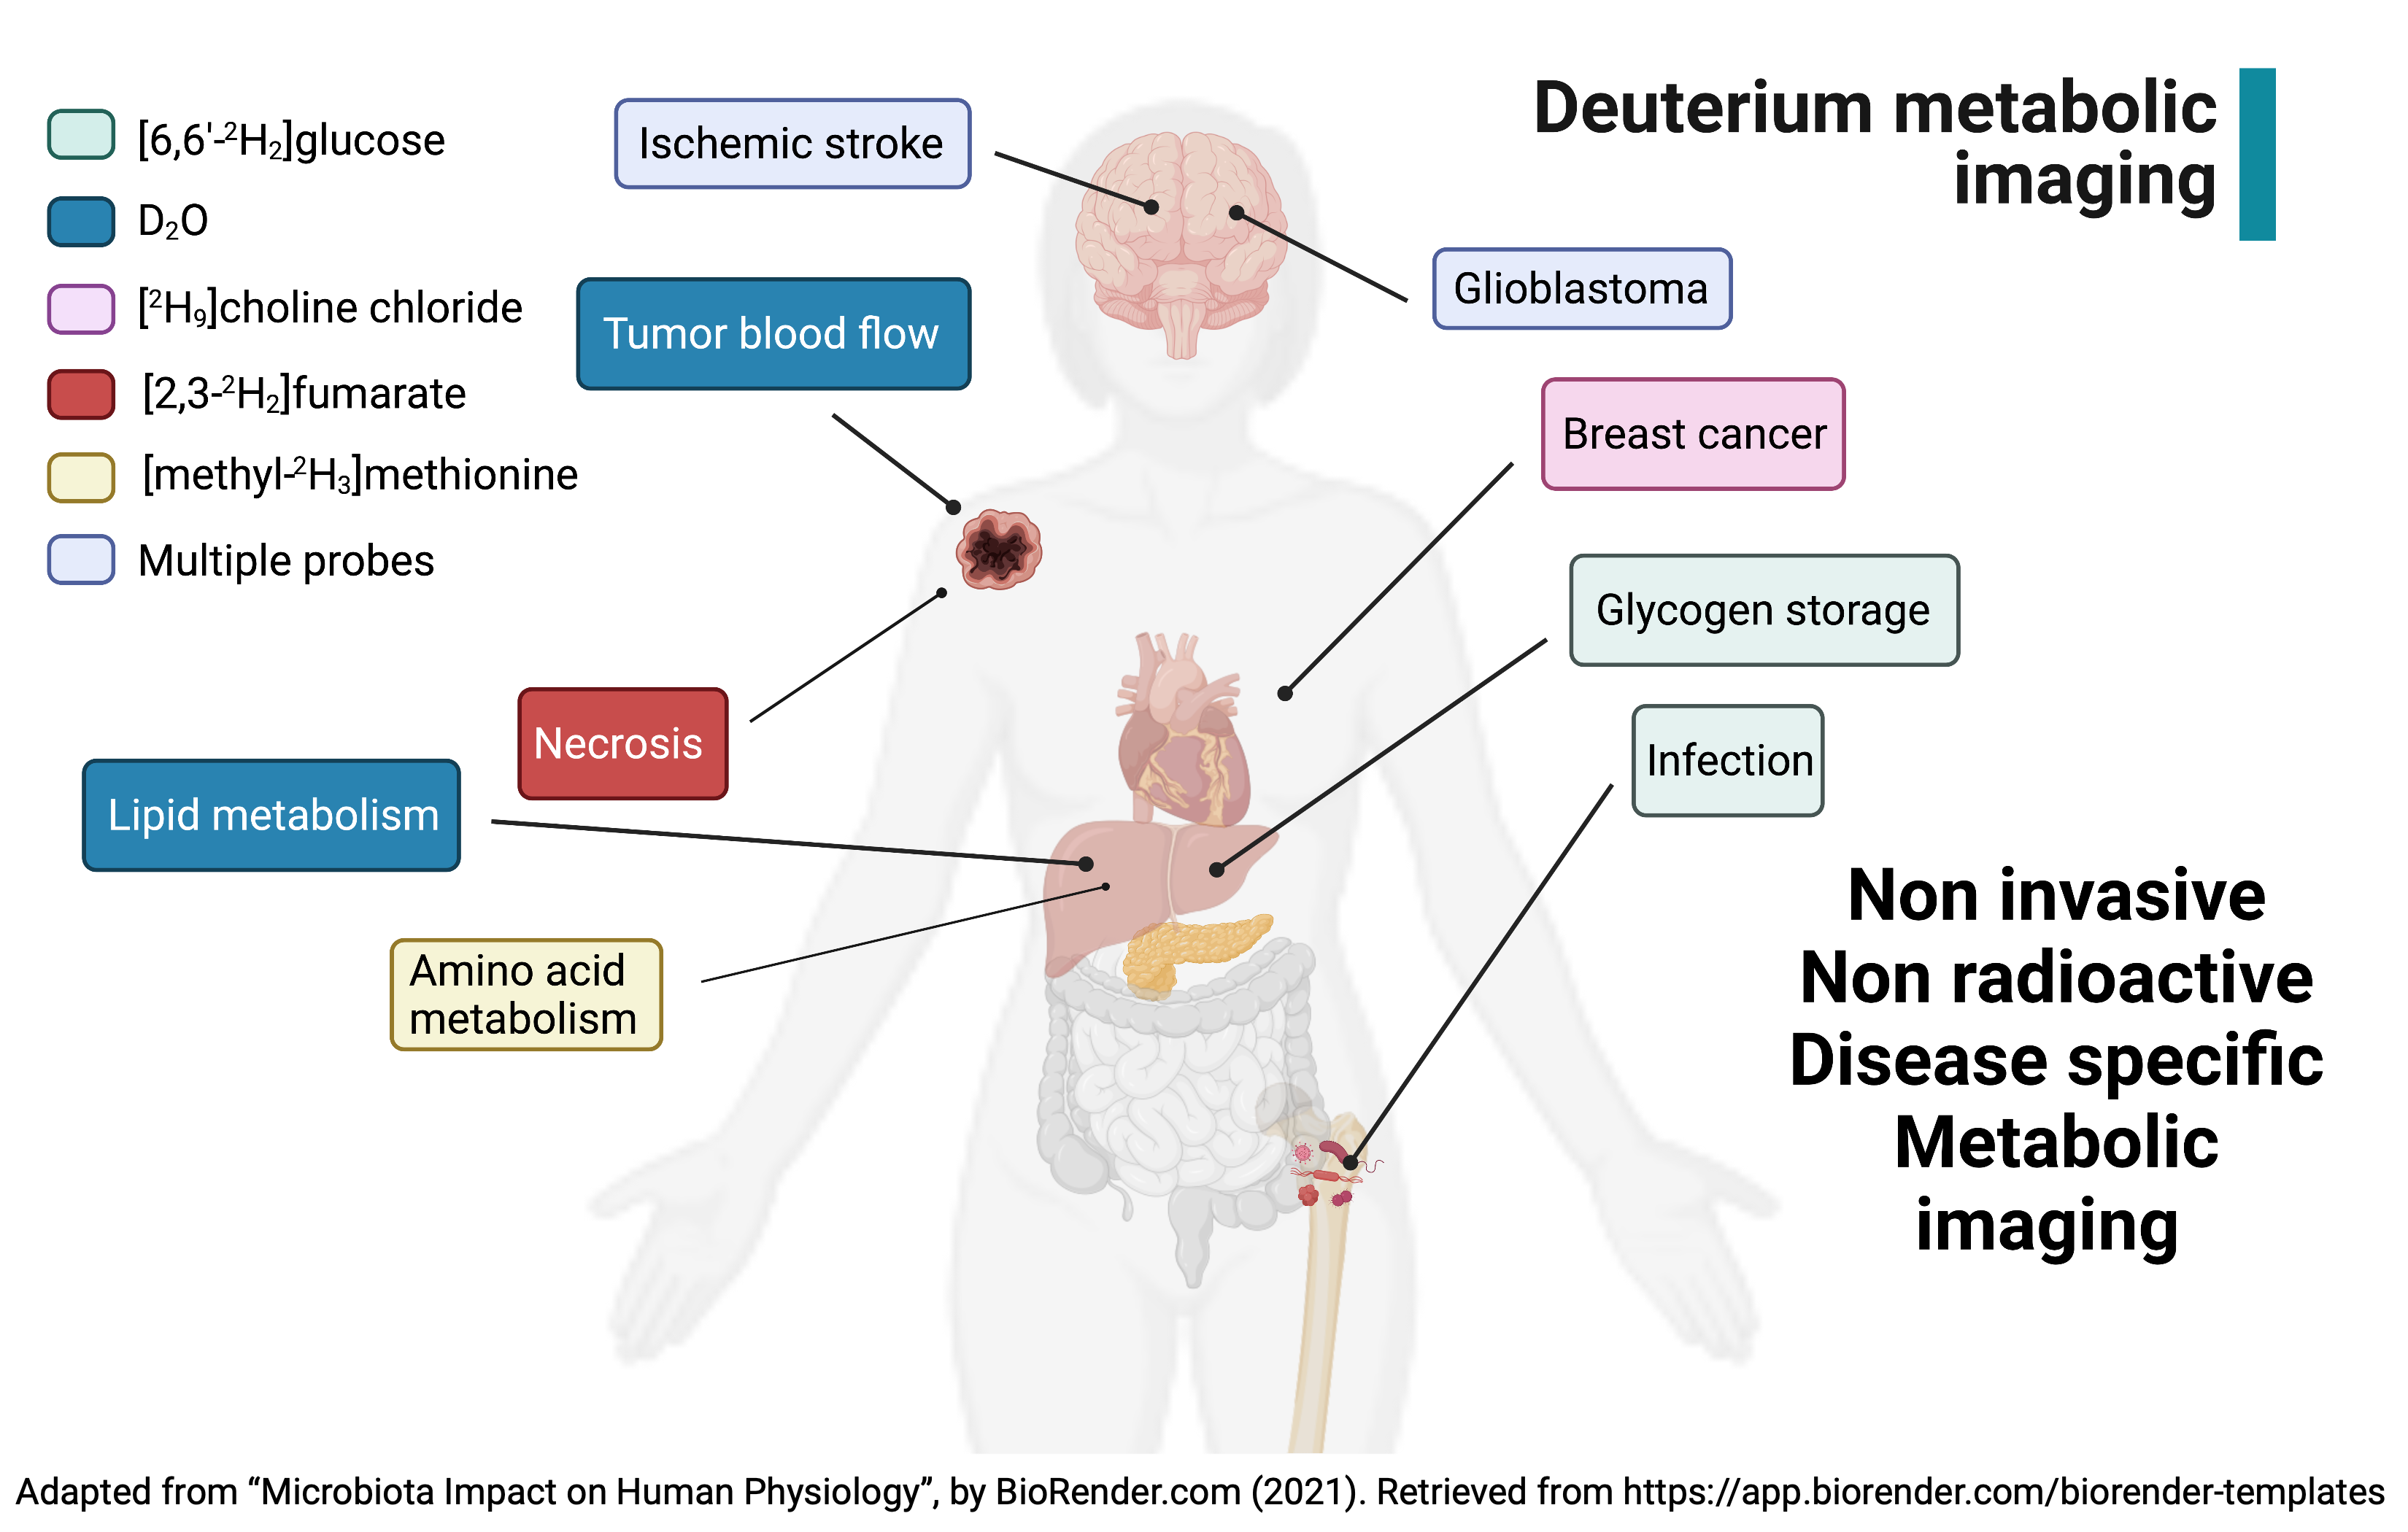
4. Probes for DMI
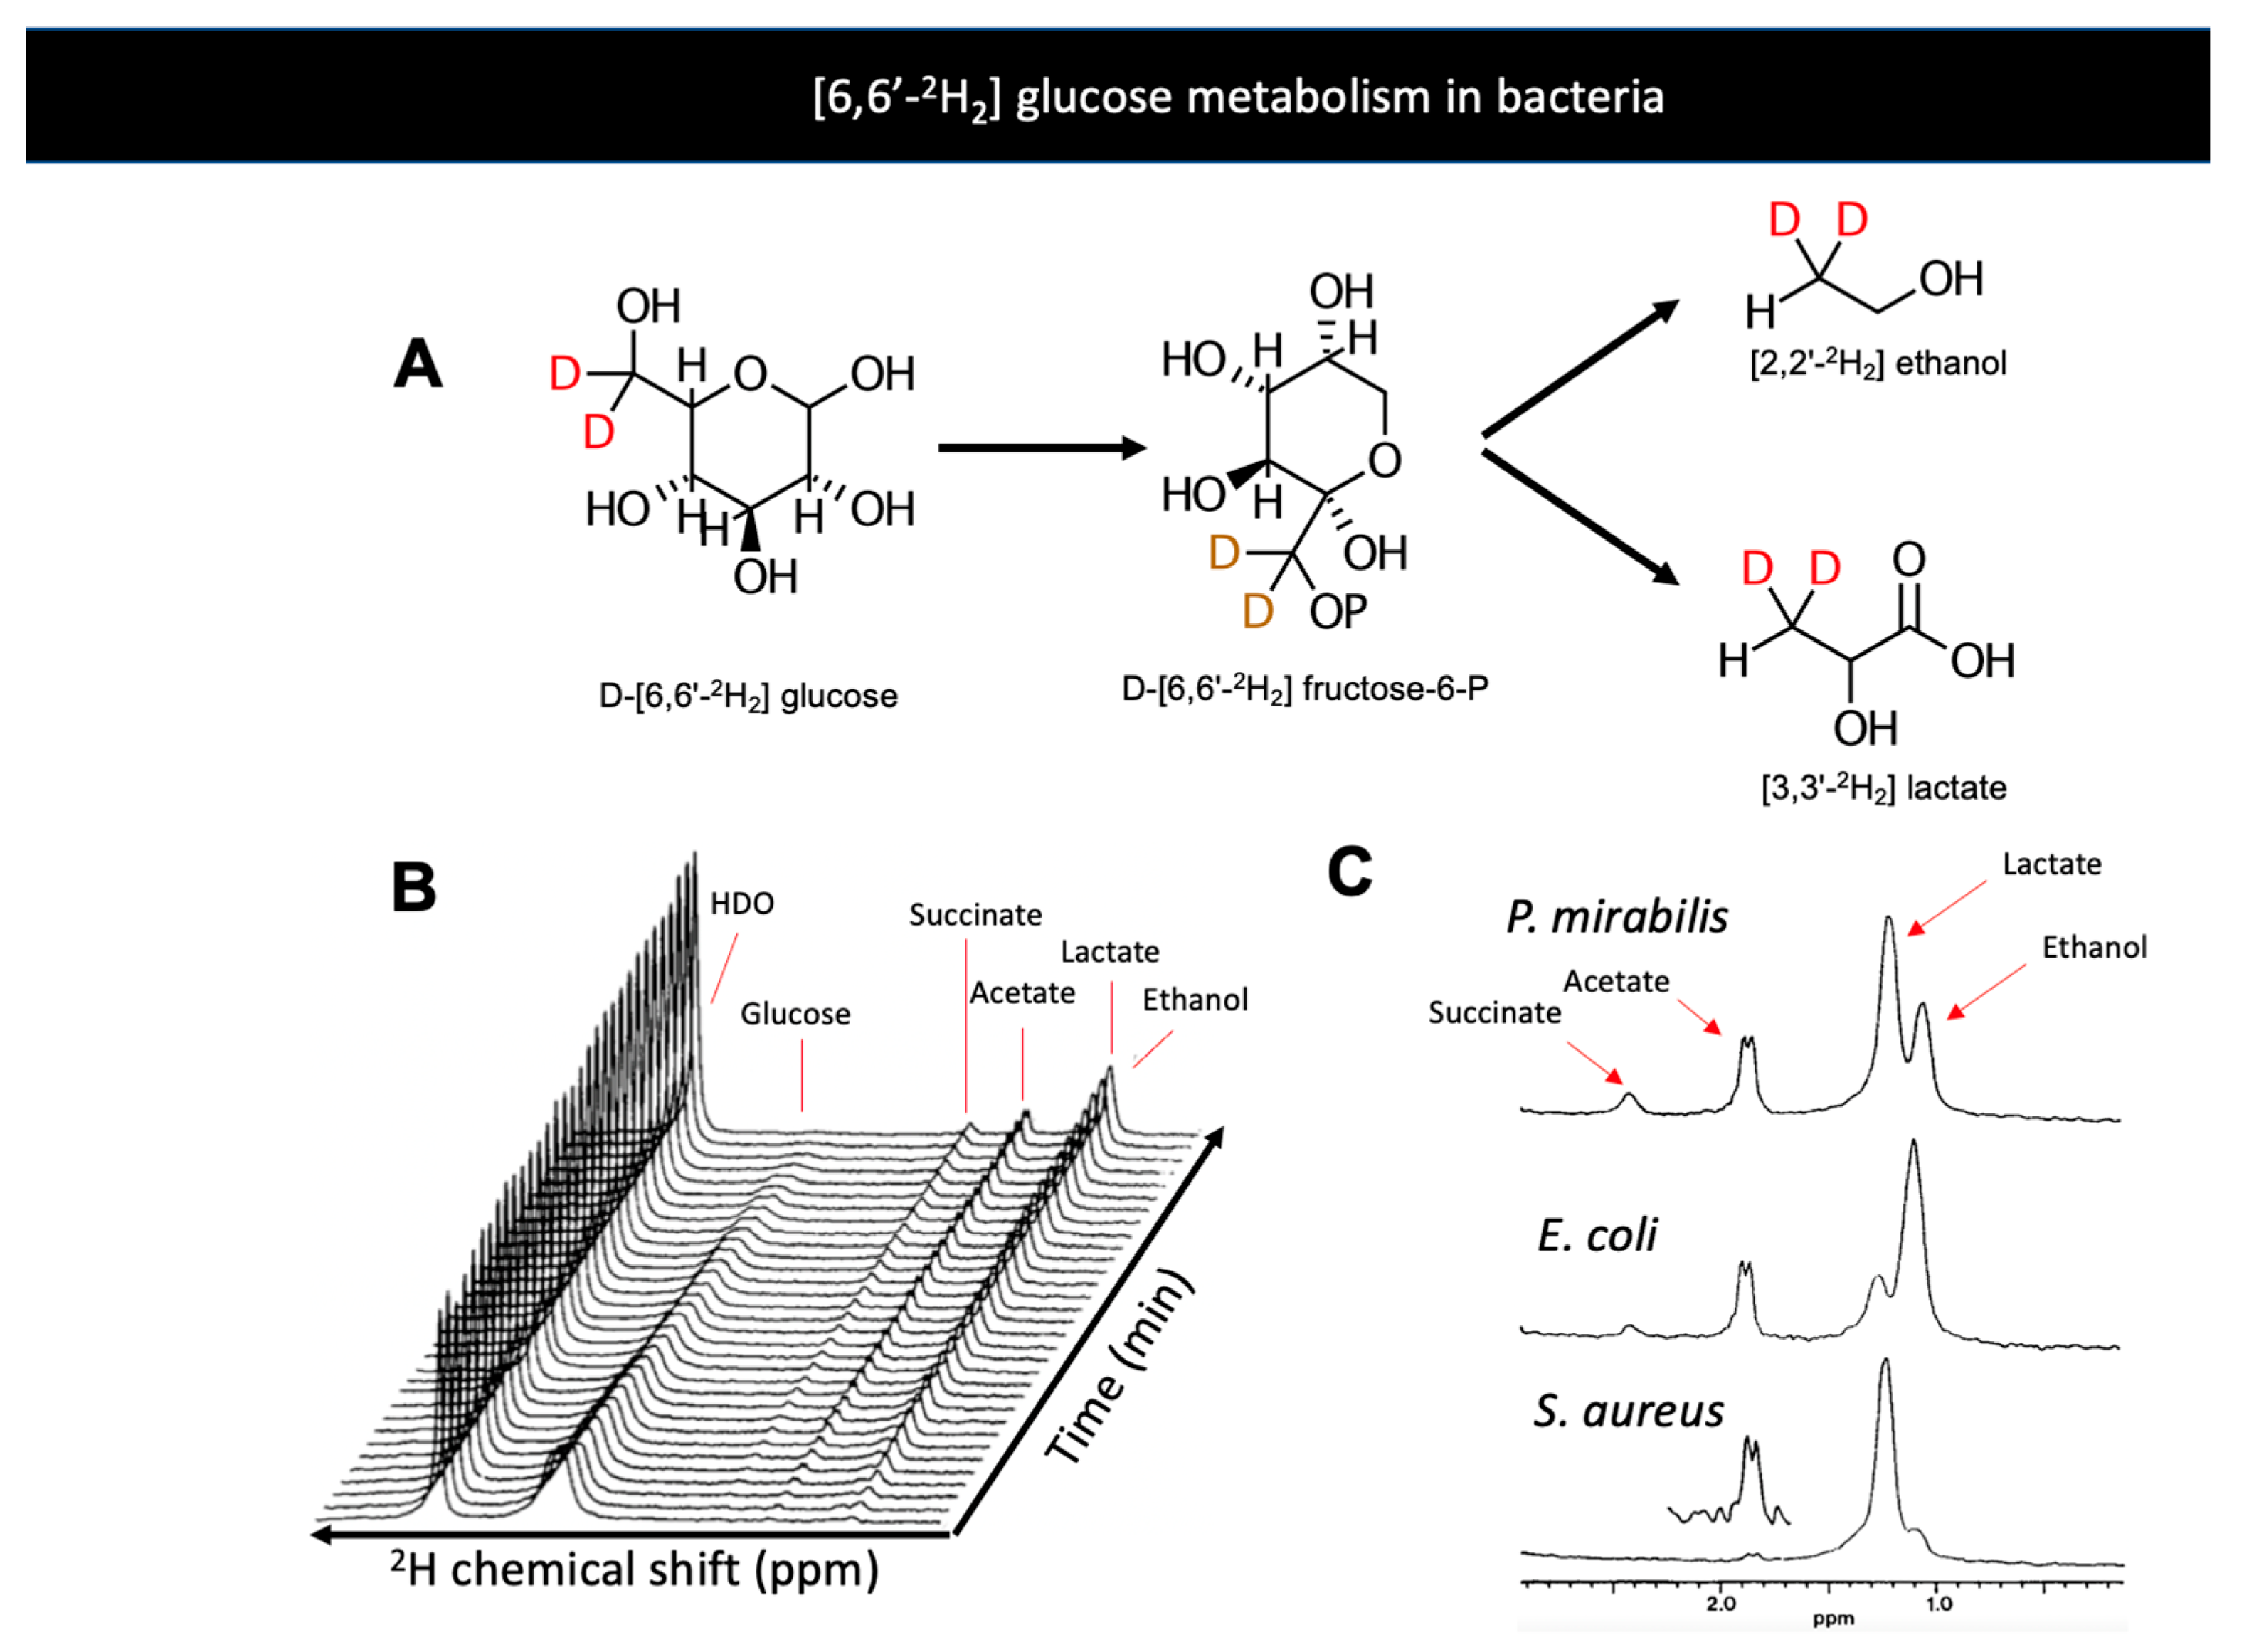
5. Bacteria-Specific DMI
6. Conclusions

| Probe | Measured Metabolic Processes | Imaging Target * | Applications | Human Studies | Refs |
|---|---|---|---|---|---|
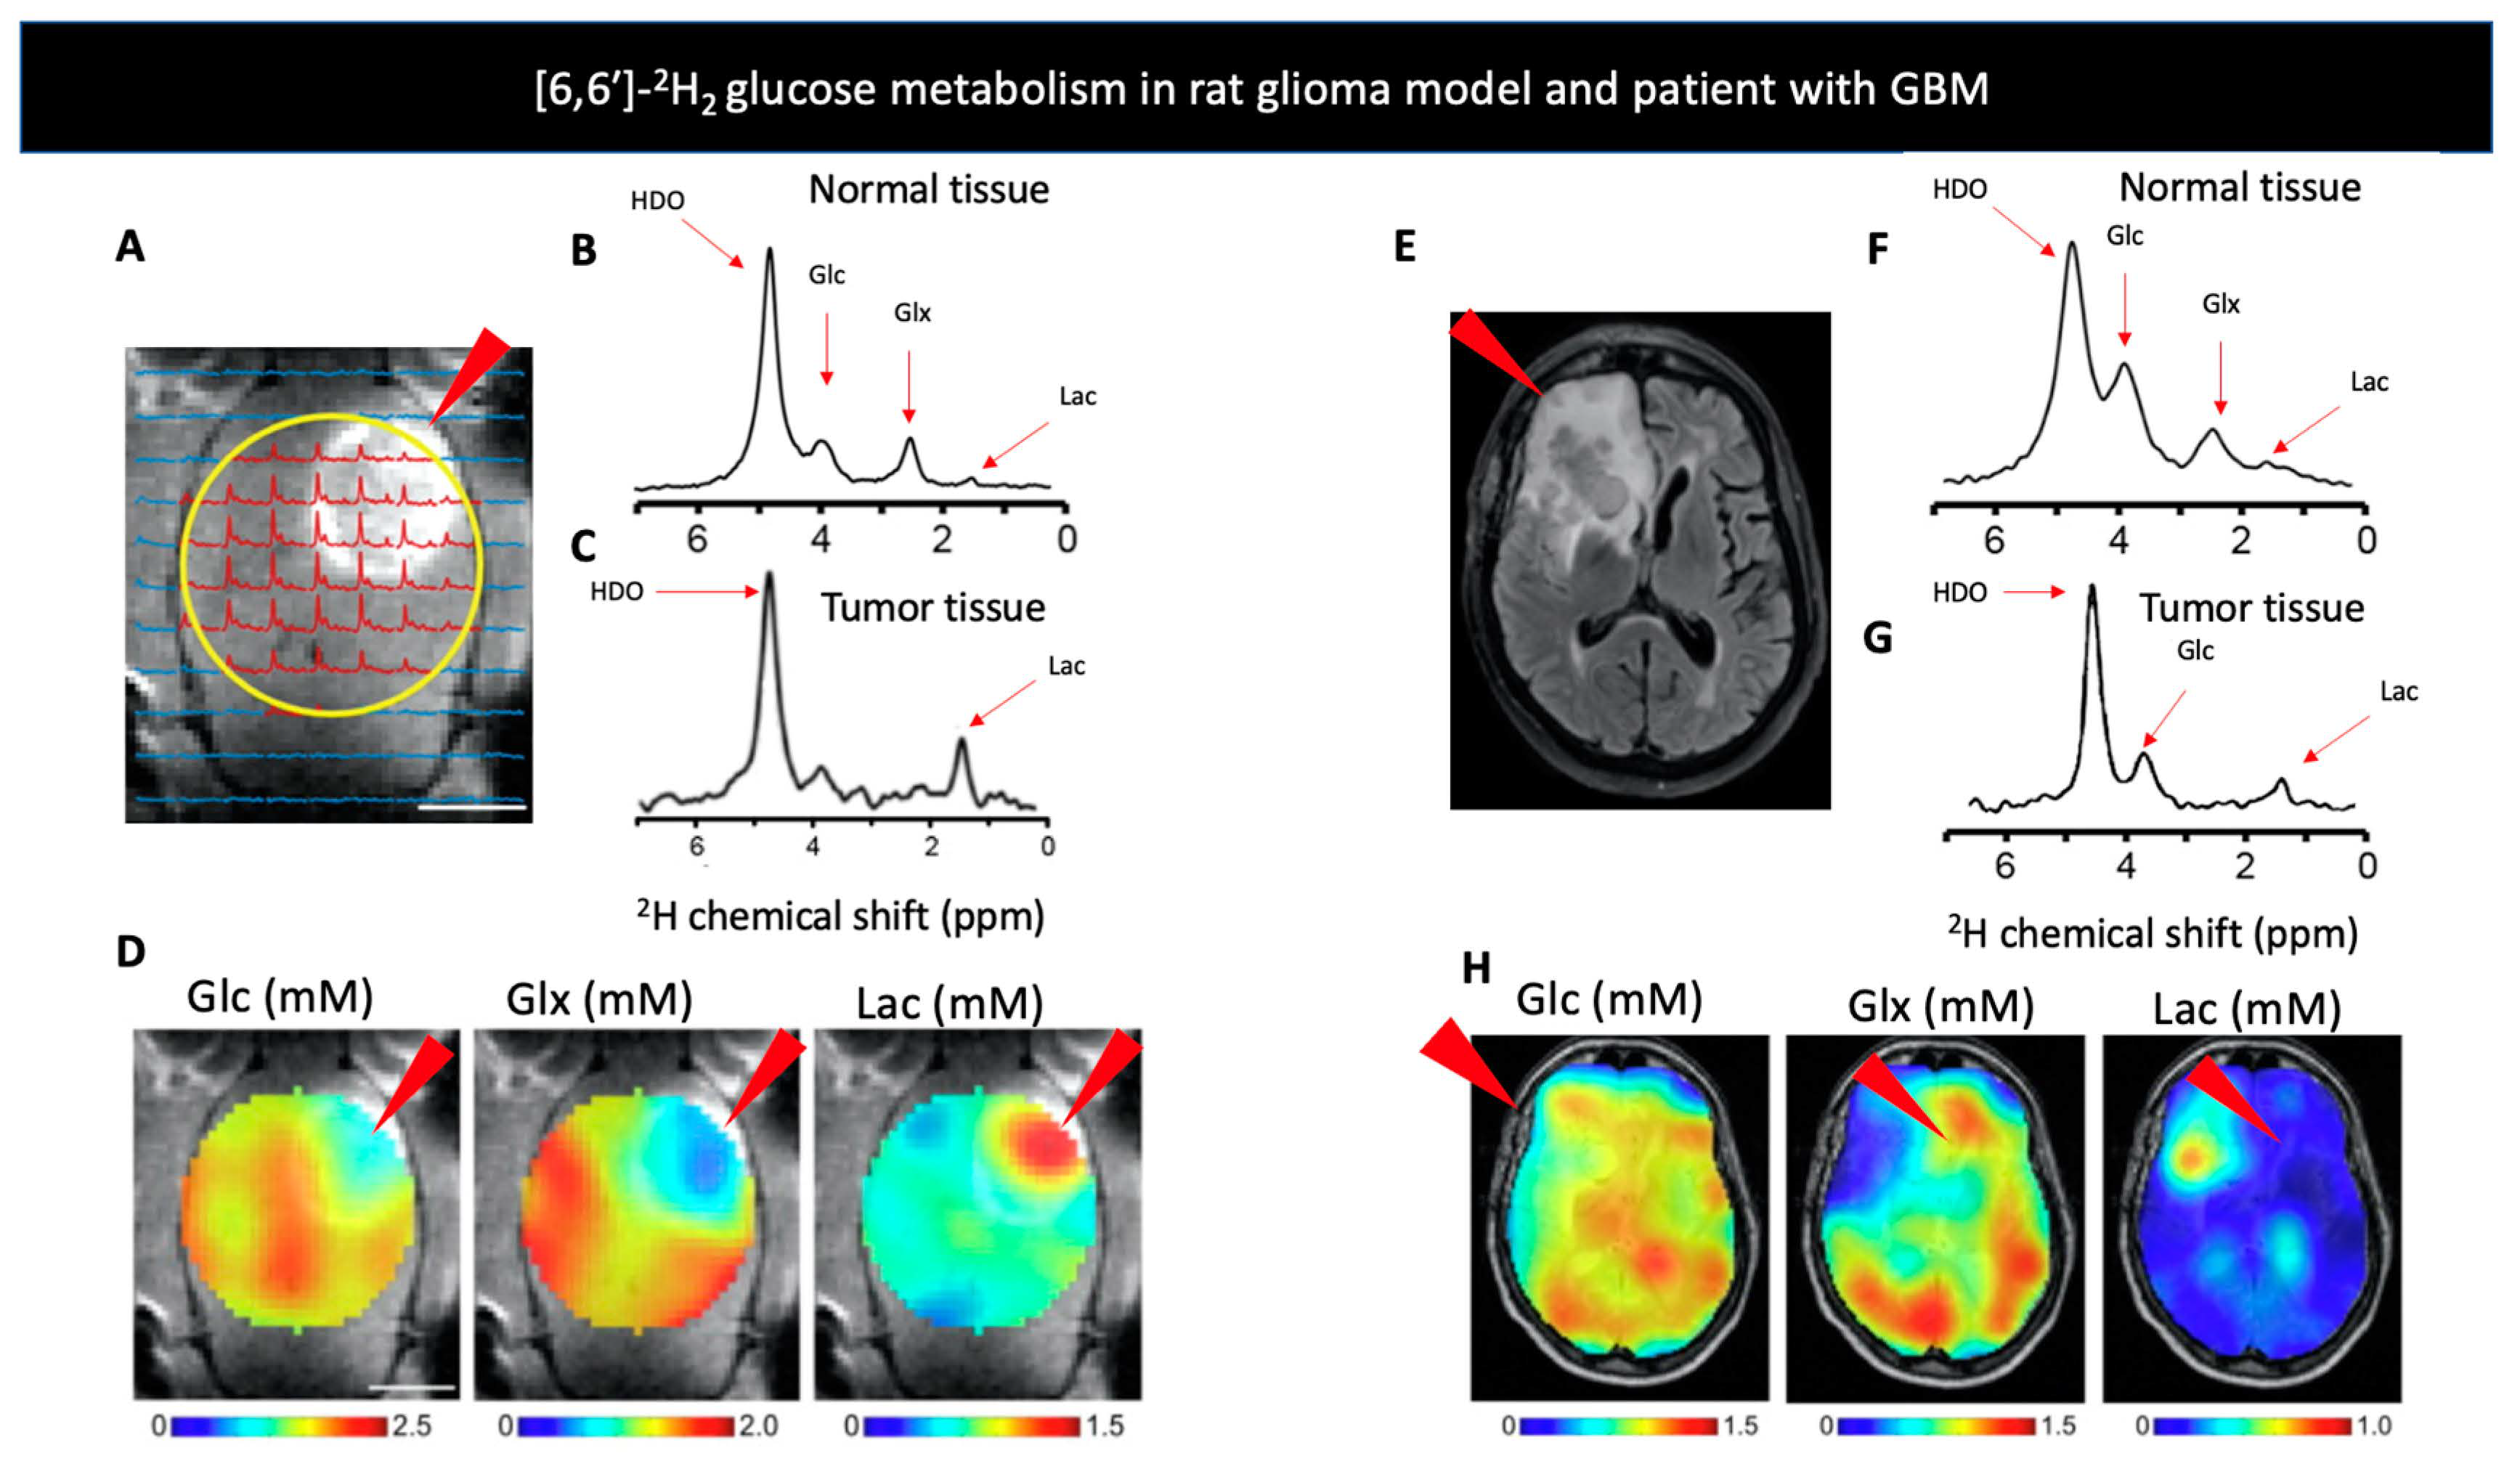
| D-[6,6′-2H2] glucose | Glycolysis, oxidative phosphorylation, glycogen liver storage | Mammalian cells: [3,3′-2H2] lactate [4,4′-2H2] glutamate [4-2H] glutamate [4,4′-2H2] glutamine [4-2H] glutamine | Infection, Malignancy, Perfusion | Glioblastoma, Glycogen storage | [1,3,47,71,74,86,87,89,91,92,93,96,97] |
| Bacterial: [3,3′-2H2] lactate [2,2′-2H2] acetate [2,2′-2H2] ethanol [2,2′-2H2] succinate [1,1′-2H2] 2,4-butaneiol 2H-butyrate 2H-butanol 2H-acetone | |||||
| D2O | Blood flow and tissue perfusion, DNA and lipid turnovers | D2O tracer kinetics Deuterium-enriched DNA | Perfusion, cellular proliferation, lipid metabolism | [75,76,78,99,104,105,106,107,108,109,110,111,112,113,116] | |
| Deuterium-enriched DNA | |||||
| Deuterium-enriched lipids | |||||
| [2H3] acetate | TCA cycle flux, fatty acid oxidation | [4,4′-2H2] glutamate | Malignancy | Glioblastoma patients | [1,71] |
| [4-2H] glutamate | |||||
| [4,4′-2H2] glutamine | |||||
| [4-2H] glutamine | |||||
| [2H9] choline chloride | Phosphorylation, methylation | [methyl-2H9] betaine | Renal metabolism, Malignancy | Choline deficiency | [119,120,122] |
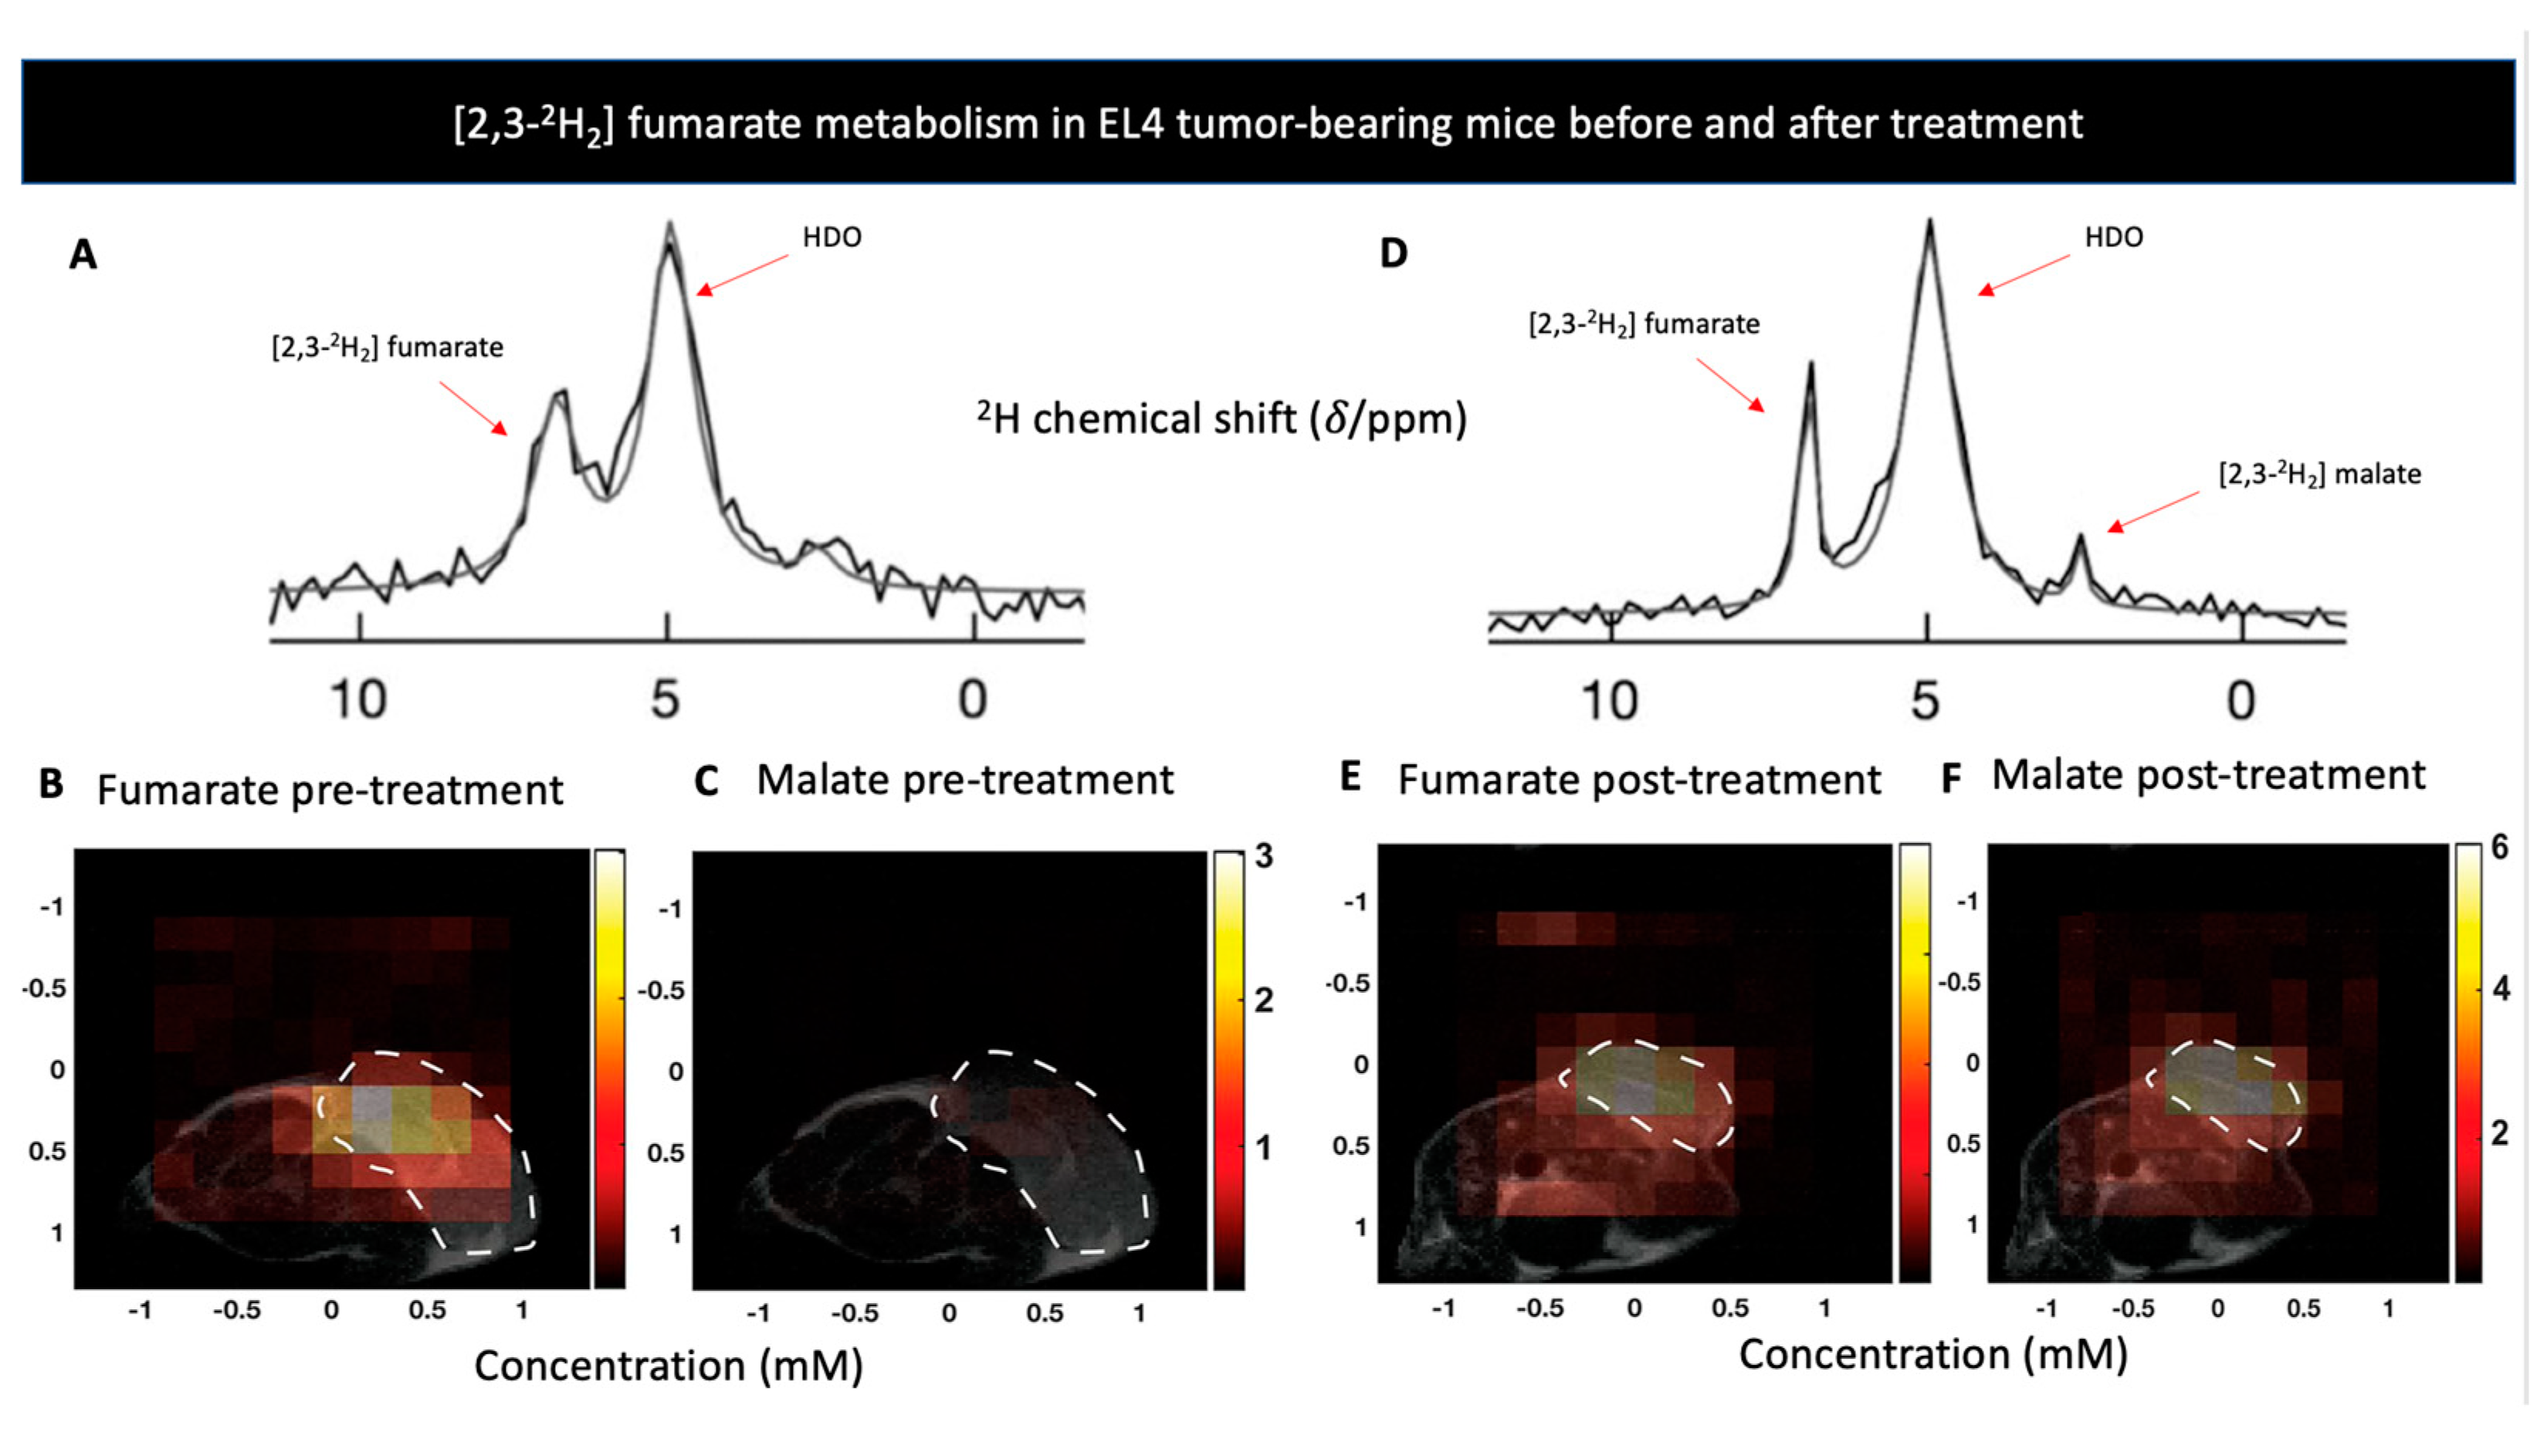
| [2,3-2H2] fumarate | Cellular necrosis | [2,3-2H2] malate | Malignancy | [123] | |
| [methyl-2H3] methionine | Protein synthesis, methylation | [methyl-2H3] sarcosine | Hepatic metabolism | [129,130] | |
| N-trimethyl labeled metabolites |
Author Contributions
Funding
Data Availability Statement
Conflicts of Interest
References
- De Feyter, H.M.; Behar, K.L.; Corbin, Z.A.; Fulbright, R.K.; Brown, P.B.; McIntyre, S.; Nixon, T.W.; Rothman, D.L.; de Graaf, R.A. Deuterium metabolic imaging (DMI) for MRI-based 3D mapping of metabolism in vivo. Sci. Adv. 2018, 4, eaat7314. [Google Scholar] [CrossRef]
- Cudalbu, C.; Comment, A.; Kurdzesau, F.; van Heeswijk, R.B.; Uffmann, K.; Jannin, S.; Denisov, V.; Kirik, D.; Gruetter, R. Feasibility of in vivo 15 N MRS detection of hyperpolarized 15N labeled choline in rats. Phys. Chem. Chem. Phys. 2010, 12, 5818–5823. [Google Scholar] [CrossRef]
- Kreis, F.; Wright, A.J.; Hesse, F.; Fala, M.; Hu, D.; Brindle, K.M. Measuring tumor glycolytic flux in vivo by using fast deuterium MRI. Radiology 2020, 294, 289–296. [Google Scholar] [CrossRef] [PubMed]
- De Feyter, H.M.; de Graaf, R.A. Deuterium metabolic imaging–Back to the future. J. Magn. Reson. 2021, 326, 106932. [Google Scholar] [CrossRef] [PubMed]
- Kauppinen, R.A.; Williams, S.R. Nuclear magnetic resonance spectroscopy studies of the brain. Prog. Neurobiol. 1994, 44, 87–118. [Google Scholar] [CrossRef]
- de Graaf, R.A.; Hendriks, A.D.; Klomp, D.W.J.; Kumaragamage, C.; Welting, D.; Arteaga de Castro, C.S.; Brown, P.B.; McIntyre, S.; Nixon, T.W.; Prompers, J.J. On the magnetic field dependence of deuterium metabolic imaging. NMR Biomed. 2020, 33, e4235. [Google Scholar] [CrossRef] [PubMed]
- Mahar, R.; Donabedian, P.L.; Merritt, M.E. HDO production from [2H7]glucose Quantitatively Identifies Warburg Metabolism. Sci. Rep. 2020, 10, 8885. [Google Scholar] [CrossRef]
- Urey, H.C.; Brickwedde, F.G.; Murphy, G.M. A hydrogen isotope of mass 2 and its concentration. Phys. Rev. 1932, 40, 1. [Google Scholar] [CrossRef]
- Klein, P.D.; Klein, E.R. Stable isotopes: Origins and safety. J. Clin. Pharmacol. 1986, 26, 378–382. [Google Scholar] [CrossRef]
- Schoenheimer, R.; Rittenberg, D. Deuterium as an indicator in the study of intermediary metabolism. 1. J. Biol. Chem. 1935, 111, 163–168. [Google Scholar] [CrossRef]
- Schoenheimer, R.; Rittenberg, D.; Graff, M. Deuterium as an indicator in the study of intermediary metabolism. 4. The mechanism of coprosterol formation. J. Biol. Chem. 1935, 111, 183–192. [Google Scholar] [CrossRef]
- Schoenheimer, R.; Rlttenberg, D. Deuterium as an indicator in the study of intermediary metabolism. 5. The desaturation of fatty acids in the organism. J. Biol. Chem. 1936, 113, 505–510. [Google Scholar] [CrossRef]
- Schoenheimer, R.; Rittenberg, D. Deuterium as an indicator in the study of intermediary metabolism. 6. Synthesis and destruction of fatty acids in the organism. J. Biol. Chem. 1936, 114, 381–396. [Google Scholar] [CrossRef]
- Schoenheimer, R.; Rittenberg, D. Deuterium as an indicator in the study of intermediary metabolism. 9. The conversion of stearic acid into palmitic acid in the organism. J. Biol. Chem. 1937, 120, 155–165. [Google Scholar] [CrossRef]
- Rittenberg, D.; Schoenheimer, R. Deuterium as an indicator in the study of intermediary metabolism. 11. Further studies on the biological uptake of deuterium into organic substances, with special reference to fat and cholesterol formation. J. Biol. Chem. 1937, 121, 235–253. [Google Scholar] [CrossRef]
- Schoenheimer, R.; Rittenberg, D.; Foster, G.L.; Keston, A.S.; Ratner, S. The application of the nitrogen isotope N15 for the study of protein metabolism. Science 1938, 88, 599–600. [Google Scholar] [CrossRef]
- Rittenberg, D.; Keston, A.S.; Schoenheimer, R.; Foster, G.L. Deuterium as an indicator in the study of intermediary metabolism. 13. The stability of hydrogen in amino acids. J. Biol. Chem. 1938, 125, 1–12. [Google Scholar] [CrossRef]
- Foster, G.L.; Rittenberg, D.; Schoenheimer, R. Deuterium as an indicator in the study of intermediary metabolism. 14. Biological formation of deuteroamino acids. J. Biol. Chem. 1938, 125, 13–22. [Google Scholar] [CrossRef]
- Oldfield, E.; Chapman, D. Deuteron resonance: A novel approach to the study of hydrocarbon chain mobility in membrane systems. FEBS Lett. 1971, 16, 102–104. [Google Scholar] [CrossRef]
- Stockton, G.W.; Johnson, K.G.; Butler, K.W.; Tulloch, A.P.; Boulanger, Y.; Smith, I.C.P.; Davis, J.H.; Bloom, M. Deuterium NMR study of lipid organisation in Acholeplasma laidlawii membranes. Nature 1977, 269, 267–268. [Google Scholar] [CrossRef]
- Oldfield, E.; Chapman, D.; Derbyshire, W. Lipid mobility in Acholeplasma membranes using deuteron magnetic resonance. Chem. Phys. Lipids 1972, 9, 69–81. [Google Scholar] [CrossRef]
- Arvidson, G.; Lindblom, G.; Drakenberg, T. A novel approach to the study of mammalian cell-membranes using deuterium NMR. FEBS Lett. 1975, 54, 249–252. [Google Scholar] [CrossRef]
- Smith, R.L.; Oldfield, E. Dynamic structure of membranes by deuterium NMR. Science 1984, 225, 280–288. [Google Scholar] [CrossRef]
- Bechinger, B.; Weik, M. Deuterium solid-state NMR investigations of exchange labeled oriented purple membranes at different hydration levels. Biophys. J. 2003, 85, 361–369. [Google Scholar] [CrossRef][Green Version]
- Cady, S.D.; Schmidt-Rohr, K.; Wang, J.; Soto, C.S.; DeGrado, W.F.; Hong, M. Structure of the amantadine binding site of influenza M2 proton channels in lipid bilayers. Nature 2010, 463, 689–692. [Google Scholar] [CrossRef] [PubMed]
- Salgado, G.F.J.; Struts, A.V.; Tanaka, K.; Fujioka, N.; Nakanishi, K.; Brown, M.F. Deuterium NMR structure of retinal in the ground state of rhodopsin. Biochemistry 2004, 43, 12819–12828. [Google Scholar] [CrossRef] [PubMed]
- Seelig, J.; Macdonald, P.M. Phospholipids and proteins in biological membranes. Deuterium NMR as a method to study structure, dynamics, and interactions. Acc. Chem. Res. 1987, 20, 221–228. [Google Scholar] [CrossRef]
- Ramsey, N.F. Vibrational and centrifugal effects on nuclear interactions and rotational moments in molecules. Phys. Rev. 1952, 87, 1075. [Google Scholar] [CrossRef]
- Wiberg, K.B. The deuterium isotope effect. Chem. Rev. 1955, 55, 713–743. [Google Scholar] [CrossRef]
- Mao, Z.; Campbell, C.T. Kinetic isotope effects: Interpretation and prediction using degrees of rate control. ACS Catal. 2020, 10, 4181–4192. [Google Scholar] [CrossRef]
- Tung, R.D. Deuterium medicinal chemistry comes of age. Future Med. Chem. 2016, 8, 491–494. [Google Scholar] [CrossRef]
- Harbeson, S.L.; Tung, R.D. Deuterium medicinal chemistry: A new approach to drug discovery and development. MedChem News 2014, 2, 8–22. [Google Scholar]
- Kobus, T.; Wright, A.J.; Weiland, E.; Heerschap, A.; Scheenen, T.W.J. Metabolite ratios in 1H MR spectroscopic imaging of the prostate. Magn. Reson. Med. 2015, 73, 1–12. [Google Scholar] [CrossRef]
- Sharma, U.; Jagannathan, N.R. Metabolism of prostate cancer by magnetic resonance spectroscopy (MRS). Biophys. Rev. 2020, 12, 1163–1173. [Google Scholar] [CrossRef] [PubMed]
- Horská, A.; Barker, P.B. Imaging of brain tumors: MR spectroscopy and metabolic imaging. Neuroimaging Clin. N. Am. 2010, 20, 293–310. [Google Scholar] [CrossRef] [PubMed]
- Gharzeddine, K.; Hatzoglou, V.; Holodny, A.I.; Young, R.J. MR Perfusion and MR Spectroscopy of Brain Neoplasms. Radiol. Clin. N. Am. 2019, 57, 1177–1188. [Google Scholar] [CrossRef]
- Brandão, L.A.; Castillo, M. Adult Brain Tumors: Clinical Applications of Magnetic Resonance Spectroscopy. Magn. Reson. Imaging Clin. N. Am. 2016, 24, 781–809. [Google Scholar] [CrossRef] [PubMed]
- Mascalchi, M.; Montomoli, M.; Guerrini, R. Neuroimaging in mitochondrial disorders. Essays Biochem. 2018, 62, 409–421. [Google Scholar] [CrossRef]
- Alkhalik Basha, M.A.; Refaat, R.; Ahmed, A.F.; Yousef, H.Y.; Alsowey, A.M.; Metwally, M.I.; Aly, S.A.; Hussien, H.M.; El-Saadany, H.F.; AlGhobashy, A.A.; et al. Brain magnetic resonance spectroscopy (MRS) as a diagnostic tool for detecting early neurological changes in children with Wilson’s disease. Eur. J. Radiol. 2019, 111, 41–46. [Google Scholar] [CrossRef] [PubMed]
- Blicher, J.U.; Eskildsen, S.F.; Stærmose, T.G.; Møller, A.T.; Figlewski, K.; Near, J. Short echo-time Magnetic Resonance Spectroscopy in ALS, simultaneous quantification of glutamate and GABA at 3 T. Sci. Rep. 2019, 9, 17593. [Google Scholar] [CrossRef]
- Lasocki, A.; Hicks, R.J. How we read: The combined use of MRI and novel PET tracers for the characterisation and treatment planning of masses in neuro-oncology. Cancer Imaging 2019, 19, 57. [Google Scholar] [CrossRef]
- Polvoy, I.; Flavell, R.R.; Rosenberg, O.S.; Ohliger, M.A.; Wilson, D.M. Nuclear Imaging of Bacterial Infection: The State of the Art and Future Directions. J. Nucl. Med. 2020, 61, 1708–1716. [Google Scholar] [CrossRef] [PubMed]
- Catalano, O.A.; Masch, W.R.; Catana, C.; Mahmood, U.; Sahani, D.V.; Gee, M.S.; Menezes, L.; Soricelli, A.; Salvatore, M.; Gervais, D.; et al. An overview of PET/MR, focused on clinical applications. Abdom. Radiol. 2017, 42, 631–644. [Google Scholar] [CrossRef] [PubMed]
- Kjær, A.; Torigian, D.A. Clinical PET/MR Imaging in Oncology: Future Perspectives. PET Clin. 2016, 11, 489–493. [Google Scholar] [CrossRef] [PubMed]
- Keshari, K.R.; Wilson, D.M. Chemistry and biochemistry of 13C hyperpolarized magnetic resonance using dynamic nuclear polarization. Chem. Soc. Rev. 2014, 43, 1627–1659. [Google Scholar] [CrossRef] [PubMed]
- Le Page, L.M.; Guglielmetti, C.; Taglang, C.; Chaumeil, M.M. Imaging Brain Metabolism Using Hyperpolarized (13)C Magnetic Resonance Spectroscopy. Trends Neurosci. 2020, 43, 343–354. [Google Scholar] [CrossRef]
- Lu, M.; Zhu, X.-H.; Zhang, Y.; Mateescu, G.; Chen, W. Quantitative assessment of brain glucose metabolic rates using in vivo deuterium magnetic resonance spectroscopy. J. Cereb. Blood Flow Metab. 2017, 37, 3518–3530. [Google Scholar] [CrossRef]
- Singnurkar, A.; Poon, R.; Metser, U. Comparison of 18F-FDG-PET/CT and 18F-FDG-PET/MR imaging in oncology: A systematic review. Ann. Nucl. Med. 2017, 31, 366–378. [Google Scholar] [CrossRef]
- Boellaard, R.; Delgado-Bolton, R.; Oyen, W.J.G.; Giammarile, F.; Tatsch, K.; Eschner, W.; Verzijlbergen, F.J.; Barrington, S.F.; Pike, L.C.; Weber, W.A. FDG PET/CT: EANM procedure guidelines for tumour imaging: Version 2.0. Eur. J. Nucl. Med. Mol. Imaging 2015, 42, 328–354. [Google Scholar] [CrossRef]
- Kostakoglu, L.; Agress, H., Jr.; Goldsmith, S.J. Clinical role of FDG PET in evaluation of cancer patients. Radiographics 2003, 23, 315–340. [Google Scholar] [CrossRef]
- Bakht, M.K.; Lovnicki, J.M.; Tubman, J.; Stringer, K.F.; Chiaramonte, J.; Reynolds, M.R.; Derecichei, I.; Ferraiuolo, R.-M.; Fifield, B.-A.; Lubanska, D. Differential Expression of Glucose Transporters and Hexokinases in Prostate Cancer with a Neuroendocrine Gene Signature: A Mechanistic Perspective for 18F-FDG Imaging of PSMA-Suppressed Tumors. J. Nucl. Med. 2020, 61, 904–910. [Google Scholar] [CrossRef]
- Burt, B.M.; Humm, J.L.; Kooby, D.A.; Squire, O.D.; Mastorides, S.; Larson, S.M.; Fong, Y. Using positron emission tomography with [18F] FDG to predict tumor behavior in experimental colorectal cancer. Neoplasia 2001, 3, 189–195. [Google Scholar] [CrossRef]
- Walker-Samuel, S.; Ramasawmy, R.; Torrealdea, F.; Rega, M.; Rajkumar, V.; Johnson, S.P.; Richardson, S.; Gonçalves, M.; Parkes, H.G.; Årstad, E. In vivo imaging of glucose uptake and metabolism in tumors. Nat. Med. 2013, 19, 1067–1072. [Google Scholar] [CrossRef]
- Xu, X.; Yadav, N.N.; Knutsson, L.; Hua, J.; Kalyani, R.; Hall, E.; Laterra, J.; Blakeley, J.; Strowd, R.; Pomper, M. Dynamic glucose-enhanced (DGE) MRI: Translation to human scanning and first results in glioma patients. Tomography 2015, 1, 105–114. [Google Scholar] [CrossRef] [PubMed]
- Wang, J.; Weygand, J.; Hwang, K.-P.; Mohamed, A.S.R.; Ding, Y.; Fuller, C.D.; Lai, S.Y.; Frank, S.J.; Zhou, J. Magnetic resonance imaging of glucose uptake and metabolism in patients with head and neck cancer. Sci. Rep. 2016, 6, 30618. [Google Scholar] [CrossRef]
- Rivlin, M.; Navon, G. Molecular imaging of tumors by chemical exchange saturation transfer MRI of glucose analogs. Quant. Imaging Med. Surg. 2019, 9, 1731–1746. [Google Scholar] [CrossRef] [PubMed]
- Van Zijl, P.C.M.; Yadav, N.N. Chemical exchange saturation transfer (CEST): What is in a name and what isn’t? Magn. Reson. Med. 2011, 65, 927–948. [Google Scholar] [CrossRef] [PubMed]
- El Mamoune, K.; Barantin, L.; Adriaensen, H.; Tillet, Y. Application of Chemical Exchange Saturation Transfer (CEST) in neuroimaging. J. Chem. Neuroanat. 2021, 114, 101944. [Google Scholar] [CrossRef]
- Wang, Z.J.; Ohliger, M.A.; Larson, P.E.Z.; Gordon, J.W.; Bok, R.A.; Slater, J.; Villanueva-Meyer, J.E.; Hess, C.P.; Kurhanewicz, J.; Vigneron, D.B. Hyperpolarized 13C MRI: State of the art and future directions. Radiology 2019, 291, 273–284. [Google Scholar] [CrossRef] [PubMed]
- Kurhanewicz, J.; Vigneron, D.B.; Ardenkjaer-Larsen, J.H.; Bankson, J.A.; Brindle, K.; Cunningham, C.H.; Gallagher, F.A.; Keshari, K.R.; Kjaer, A.; Laustsen, C.; et al. Hyperpolarized (13)C MRI: Path to Clinical Translation in Oncology. Neoplasia 2019, 21, 1–16. [Google Scholar] [CrossRef]
- von Morze, C.; Engelbach, J.A.; Blazey, T.; Quirk, J.D.; Reed, G.D.; Ippolito, J.E.; Garbow, J.R. Comparison of hyperpolarized 13C and non-hyperpolarized deuterium MRI approaches for imaging cerebral glucose metabolism at 4.7 T. Magn. Reson. Med. 2021, 85, 1795–1804. [Google Scholar] [CrossRef] [PubMed]
- Rothman, D.L.; De Feyter, H.M.; de Graaf, R.A.; Mason, G.F.; Behar, K.L. 13C MRS studies of neuroenergetics and neurotransmitter cycling in humans. NMR Biomed. 2011, 24, 943–957. [Google Scholar] [CrossRef] [PubMed]
- Cudalbu, C.; Lanz, B.; Duarte, J.M.N.; Morgenthaler, F.D.; Pilloud, Y.; Mlynárik, V.; Gruetter, R. Cerebral glutamine metabolism under hyperammonemia determined in vivo by localized (1)H and (15)N NMR spectroscopy. J. Cereb. Blood Flow Metab. 2012, 32, 696–708. [Google Scholar] [CrossRef] [PubMed]
- Kanamori, K. In vivo N-15 MRS study of glutamate metabolism in the rat brain. Anal. Biochem. 2017, 529, 179–192. [Google Scholar] [CrossRef] [PubMed]
- Wolf, W.; Presant, C.A.; Waluch, V. 19F-MRS studies of fluorinated drugs in humans. Adv. Drug Deliv. Rev. 2000, 41, 55–74. [Google Scholar] [CrossRef]
- von Kienlin, M.; Beer, M.; Greiser, A.; Hahn, D.; Harre, K.; Köstler, H.; Landschütz, W.; Pabst, T.; Sandstede, J.; Neubauer, S. Advances in human cardiac 31P-MR spectroscopy: SLOOP and clinical applications. J. Magn. Reson. Imaging 2001, 13, 521–527. [Google Scholar] [CrossRef]
- Emwas, A.-H.; Roy, R.; McKay, R.T.; Tenori, L.; Saccenti, E.; Gowda, G.A.; Raftery, D.; Alahmari, F.; Jaremko, L.; Jaremko, M. NMR spectroscopy for metabolomics research. Metabolites 2019, 9, 123. [Google Scholar] [CrossRef]
- Thomas, M.A.; Nagarajan, R.; Huda, A.; Margolis, D.; Sarma, M.K.; Sheng, K.; Reiter, R.E.; Raman, S.S. Multidimensional MR spectroscopic imaging of prostate cancer in vivo. NMR Biomed. 2014, 27, 53–66. [Google Scholar] [CrossRef]
- Choi, C.; Ganji, S.K.; DeBerardinis, R.J.; Hatanpaa, K.J.; Rakheja, D.; Kovacs, Z.; Yang, X.-L.; Mashimo, T.; Raisanen, J.M.; Marin-Valencia, I.; et al. 2-hydroxyglutarate detection by magnetic resonance spectroscopy in IDH-mutated patients with gliomas. Nat. Med. 2012, 18, 624–629. [Google Scholar] [CrossRef]
- Suh, C.H.; Kim, H.S.; Jung, S.C.; Choi, C.G.; Kim, S.J. 2-Hydroxyglutarate MR spectroscopy for prediction of isocitrate dehydrogenase mutant glioma: A systemic review and meta-analysis using individual patient data. Neuro-Oncology 2018, 20, 1573–1583. [Google Scholar] [CrossRef]
- Rich, L.J.; Bagga, P.; Wilson, N.E.; Schnall, M.D.; Detre, J.A.; Haris, M.; Reddy, R. 1 H magnetic resonance spectroscopy of 2 H-to-1 H exchange quantifies the dynamics of cellular metabolism in vivo. Nat. Biomed. Eng. 2020, 4, 335–342. [Google Scholar] [CrossRef]
- Hors, P.J. A new method for water suppression in the proton NMR spectra of aqueous solutions. J. Magn. Reson. 1983, 54, 539–542. [Google Scholar] [CrossRef]
- Wishart, D.S.; Tzur, D.; Knox, C.; Eisner, R.; Guo, A.C.; Young, N.; Cheng, D.; Jewell, K.; Arndt, D.; Sawhney, S.; et al. HMDB: The Human Metabolome Database. Nucleic Acids Res. 2007, 35, D521–D526. [Google Scholar] [CrossRef] [PubMed]
- De Feyter, H.M.; Thomas, M.A.; Behar, K.L.; de Graaf, R.A. NMR visibility of deuterium-labeled liver glycogen in vivo. Magn. Reson. Med. 2021, 86, 62–68. [Google Scholar] [CrossRef]
- Brereton, I.M.; Irving, M.G.; Field, J.; Doddrell, D.M. Preliminary studies on the potential of in vivo deuterium NMR spectroscopy. Biochem. Biophys. Res. Commun. 1986, 137, 579–584. [Google Scholar] [CrossRef]
- Ackerman, J.J.; Ewy, C.S.; Becker, N.N.; Shalwitz, R.A. Deuterium nuclear magnetic resonance measurements of blood flow and tissue perfusion employing 2H2O as a freely diffusible tracer. Proc. Natl. Acad. Sci. USA 1987, 84, 4099–4102. [Google Scholar] [CrossRef] [PubMed]
- Busch, R.; Neese, R.A.; Awada, M.; Hayes, G.M.; Hellerstein, M.K. Measurement of cell proliferation by heavy water labeling. Nat. Protoc. 2007, 2, 3045–3057. [Google Scholar] [CrossRef]
- Buxbaum, N.P.; Farthing, D.E.; Maglakelidze, N.; Lizak, M.; Merkle, H.; Carpenter, A.C.; Oliver, B.U.; Kapoor, V.; Castro, E.; Swan, G.A. In vivo kinetics and nonradioactive imaging of rapidly proliferating cells in graft-versus-host disease. JCI Insight 2017, 2, e92851. [Google Scholar] [CrossRef] [PubMed]
- Mantsch, H.H.; Saitô, H.; Smith, I.C.P. Deuterium magnetic resonance, applications in chemistry, physics and biology. Prog. Nucl. Magn. Reson. Spectrosc. 1977, 11, 211–272. [Google Scholar] [CrossRef]
- Koletzko, B.; Sauerwald, T.; Demmelmair, H. Safety of stable isotope use. Eur. J. Pediatr. 1997, 156, S12–S17. [Google Scholar] [CrossRef] [PubMed]
- Monteagudo, E.; Virgili, A.; Parella, T.; Pérez-Trujillo, M. Chiral Recognition by Dissolution DNP NMR Spectroscopy of (13)C-Labeled dl-Methionine. Anal. Chem. 2017, 89, 4939–4944. [Google Scholar] [CrossRef]
- Davies, P.S.W. Stable isotopes: Their use and safety in human nutrition studies. Eur. J. Clin. Nutr. 2020, 74, 362–365. [Google Scholar] [CrossRef] [PubMed]
- Adamson, E.B.; Ludwig, K.D.; Mummy, D.G.; Fain, S.B. Magnetic resonance imaging with hyperpolarized agents: Methods and applications. Phys. Med. Biol. 2017, 62, R81–R123. [Google Scholar] [CrossRef] [PubMed]
- Negendank, W. Studies of human tumors by MRS: A review. NMR Biomed. 1992, 5, 303–324. [Google Scholar] [CrossRef] [PubMed]
- Gillies, R.J.; Morse, D.L. In vivo magnetic resonance spectroscopy in cancer. Annu. Rev. Biomed. Eng. 2005, 7, 287–326. [Google Scholar] [CrossRef] [PubMed]
- Barrow, K.D.; Rogers, P.L.; Smith, G.M. NMR studies of [1-2H] glucose metabolism in Zymomonas mobilis. Eur. J. Biochem. 1986, 157, 195–202. [Google Scholar] [CrossRef]
- Aguayo, J.B.; Gamcsik, M.P.; Dick, J.D. High resolution deuterium NMR studies of bacterial metabolism. J. Biol. Chem. 1988, 263, 19552–19557. [Google Scholar] [CrossRef]
- Roger, O.; Lavigne, R.; Mahmoud, M.; Buisson, C.; Onno, B.; Zhang, B.-L.; Robins, R.J. Quantitative 2H NMR at natural abundance can distinguish the pathway used for glucose fermentation by lactic acid bacteria. J. Biol. Chem. 2004, 279, 24923–24928. [Google Scholar] [CrossRef]
- Aguayo, J.B.; McLennan, I.J.; Graham, C., Jr.; Cheng, H.-M. Dynamic monitoring of corneal carbohydrate metabolism using high-resolution deuterium NMR spectroscopy. Exp. Eye Res. 1988, 47, 337–343. [Google Scholar] [CrossRef]
- Aguayo, J.B.; McLennan, I.J.; Aguiar, E.; Cheng, H.-M. The study of diabetic cataractogenesis in the intact rabbit lens by deuterium NMR spectroscopy. Biochem. Biophys. Res. Commun. 1987, 142, 359–366. [Google Scholar] [CrossRef]
- Berkowitz, B.A.; Garner, M.H.; Wilson, C.A.; Corbett, R.J.T. Nondestructive measurement of retinal glucose transport and consumption in vivo using NMR spectroscopy. J. Neurochem. 1995, 64, 2325–2331. [Google Scholar] [CrossRef] [PubMed]
- Goodman, M.N.; Masuoka, L.K.; deRopp, J.S.; Jones, A.D. Use of deuterium labelled glucose in evaluating the pathway of hepatic glycogen synthesis. Biochem. Biophys. Res. Commun. 1989, 159, 522–527. [Google Scholar] [CrossRef]
- Hotchkiss, R.S.; Song, S.-K.; Ling, C.S.; Ackerman, J.J.; Karl, I.E. Sepsis does not alter red blood cell glucose metabolism or Na+ concentration: A 2H-, 23Na-NMR study. Am. J. Physiol. Integr. Comp. Physiol. 1990, 258, R21–R31. [Google Scholar] [CrossRef] [PubMed]
- Warburg, O.; Posener, K.; Negelein, E. The metabolism of cancer cells. Biochem Z 1924, 152, 319–344. [Google Scholar]
- Finessi, M.; Bisi, G.; Deandreis, D. Hyperglycemia and 18F-FDG PET/CT, issues and problem solving: A literature review. Acta Diabetol. 2020, 57, 253–262. [Google Scholar] [CrossRef] [PubMed]
- Markovic, S.; Roussel, T.; Neeman, M.; Frydman, L. Deuterium Magnetic Resonance Imaging and the Discrimination of Fetoplacental Metabolism in Normal and L-NAME-Induced Preeclamptic Mice. Metabolites 2021, 11, 376. [Google Scholar] [CrossRef]
- Markovic, S.; Roussel, T.; Agemy, L.; Sasson, K.; Preise, D.; Scherz, A.; Frydman, L. Deuterium MRSI characterizations of glucose metabolism in orthotopic pancreatic cancer mouse models. NMR Biomed. 2021, 34, e4569. [Google Scholar] [CrossRef] [PubMed]
- Straathof, M.; Meerwaldt, A.E.; De Feyter, H.M.; de Graaf, R.A.; Dijkhuizen, R.M. Deuterium Metabolic Imaging of the Healthy and Diseased Brain. Neuroscience 2021, in press. [Google Scholar] [CrossRef] [PubMed]
- Mahar, R.; Zeng, H.; Giacalone, A.; Ragavan, M.; Mareci, T.H.; Merritt, M.E. Deuterated water imaging of the rat brain following metabolism of [2H7]glucose. Magn. Reson. Med. 2021, 85, 3049–3059. [Google Scholar] [CrossRef]
- Riis-Vestergaard, M.J.; Laustsen, C.; Mariager, C.Ø.; Schulte, R.F.; Pedersen, S.B.; Richelsen, B. Glucose metabolism in brown adipose tissue determined by deuterium metabolic imaging in rats. Int. J. Obes. 2020, 44, 1417–1427. [Google Scholar] [CrossRef]
- Brook, M.S.; Wilkinson, D.J.; Atherton, P.J.; Smith, K. Recent developments in deuterium oxide tracer approaches to measure rates of substrate turnover: Implications for protein, lipid, and nucleic acid research. Curr. Opin. Clin. Nutr. Metab. Care 2017, 20, 375–381. [Google Scholar] [CrossRef] [PubMed]
- Dufner, D.; Previs, S.F. Measuring in vivo metabolism using heavy water. Curr. Opin. Clin. Nutr. Metab. Care 2003, 6, 511–517. [Google Scholar] [CrossRef] [PubMed]
- Schoenheimer, R.; Rittenberg, D. The study of intermediary metabolism of animals with the aid of isotopes. Physiol. Rev. 1940, 20, 218–248. [Google Scholar] [CrossRef]
- Brereton, I.M.; Doddrell, D.M.; Oakenfull, S.M.; Moss, D.; Irving, M.G. The use of in vivo 2H NMR spectroscopy to investigate the effects of obesity and diabetes mellitus upon lipid metabolism in mice. NMR Biomed. 1989, 2, 55–60. [Google Scholar] [CrossRef] [PubMed]
- Ewy, C.S.; Ackerman, J.J.H.; Balaban, R.S. Deuterium NMR cerebral imaging in situ. Magn. Reson. Med. 1988, 8, 35–44. [Google Scholar] [CrossRef] [PubMed]
- Mitchell, M.D.; Osbakken, M. Estimation of myocardial perfusion using deuterium nuclear magnetic resonance. Magn. Reson. Imaging 1991, 9, 545–552. [Google Scholar] [CrossRef]
- Kim, S.; Ackerman, J.J.H. Multicompartment analysis of blood flow and tissue perfusion employing D2O as a freely diffusible tracer: A novel deuterium NMR technique demonstrated via application with murine RIF-1 tumors. Magn. Reson. Med. 1988, 8, 410–426. [Google Scholar] [CrossRef] [PubMed]
- Kim, S.G.; Ackerman, J.J. Quantitative determination of tumor blood flow and perfusion via deuterium nuclear magnetic resonance spectroscopy in mice. Cancer Res. 1988, 48, 3449–3453. [Google Scholar]
- Evelhoch, J.L.; McDouall, J.B.L.; Mattiello, J.; Simpson, N.E. Measurement of relative regional tumor blood flow in mice by deuterium NMR imaging. Magn. Reson. Med. 1992, 24, 42–52. [Google Scholar] [CrossRef]
- McDouall, J.B.L.; Evelhoch, J.L. Deuterium nuclear magnetic resonance imaging of tracer distribution in D2O clearance measurements of tumor blood flow in mice. Cancer Res. 1990, 50, 363–369. [Google Scholar]
- Eskey, C.J.; Koretsky, A.P.; Domach, M.M.; Jain, R.K. 2H-nuclear magnetic resonance imaging of tumor blood flow: Spatial and temporal heterogeneity in a tissue-isolated mammary adenocarcinoma. Cancer Res. 1992, 52, 6010–6019. [Google Scholar]
- Kito, K.; Arai, T.; Mori, K.; Morikawa, S.; Inubushi, T. Deuterium chemical shift imaging for the estimation of cerebral perfusion in rabbit infarction model. J. Anesth. 1993, 7, 447–453. [Google Scholar] [CrossRef]
- Obata, T.; Ikehira, H.; Shishido, F.; Fukuda, N.; Ueshima, Y.; Koga, M.; Kato, H.; Kimura, F.; Tateno, Y. Deuterium MR in vivo imaging of the rat eye using 2H2O. Acta Radiol. 1995, 36, 552–555. [Google Scholar] [CrossRef]
- Chu, A.; Ordonez, E.T.; Hellerstein, M.K. Measurement of mouse vascular smooth muscle and atheroma cell proliferation by 2H2O incorporation into DNA. Am. J. Physiol. Physiol. 2006, 291, C1014–C1021. [Google Scholar] [CrossRef] [PubMed]
- Misell, L.M.; Holochwost, D.; Boban, D.; Santi, N.; Shefi, S.; Hellerstein, M.K.; Turek, P.J. A stable isotope-mass spectrometric method for measuring human spermatogenesis kinetics in vivo. J. Urol. 2006, 175, 242–246. [Google Scholar] [CrossRef]
- Assmann, J.C.; Brender, J.R.; Farthing, D.E.; Saito, K.; Kishimoto, S.; Warrick, K.A.; Maglakelidze, N.; Crooks, D.R.; Merkle, H.; Gress, R.E. In vivo deuterated water labeling allows tumor visualization via deuterium magnetic resonance spectroscopic imaging of cholesterol. bioRxiv 2020, 809327. [Google Scholar] [CrossRef]
- Wolfe, A.J. The acetate switch. Microbiol. Mol. Biol. Rev. 2005, 69, 12–50. [Google Scholar] [CrossRef] [PubMed]
- Zeisel, S.H.; Niculescu, M.D. Choline and Phosphatidylcholine. Mod. Nutr. Health Dis. 2016, 10, 525–536. [Google Scholar]
- Eng, J.; Berkowitzt, B.A.; Balaban, R.S. Renal distribution and metabolism of [2H9] choline. A 2H NMR and MRI study. NMR Biomed. 1990, 3, 173–177. [Google Scholar] [CrossRef]
- Katz-Brull, R.; Margalit, R.; Bendel, P.; Degani, H. Choline metabolism in breast cancer; 2 H-, 13 C-and 31 P-NMR studies of cells and tumors. Magn. Reson. Mater. Physics, Biol. Med. 1998, 6, 44–52. [Google Scholar] [CrossRef]
- De Feyter, H.M.; Thomas, M.A.; Ip, K.L.; Behar, K.L.; de Graaf, R.A. Delayed mapping of 2H-labeled choline using Deuterium Metabolic Imaging (DMI) reveals active choline metabolism in rat glioblastoma [Conference presentation]. In Proceedings of the ISMRM & SMRT Annual Meeting, Online, 15–20 May 2021. [Google Scholar]
- Horita, D.A.; Hwang, S.; Stegall, J.M.; Friday, W.B.; Kirchner, D.R.; Zeisel, S.H. Two methods for assessment of choline status in a randomized crossover study with varying dietary choline intake in people: Isotope dilution MS of plasma and in vivo single-voxel magnetic resonance spectroscopy of liver. Am. J. Clin. Nutr. 2021, 113, 1670–1678. [Google Scholar] [CrossRef]
- Hesse, F.; Somai, V.; Kreis, F.; Bulat, F.; Wright, A.J.; Brindle, K.M. Monitoring tumor cell death in murine tumor models using deuterium magnetic resonance spectroscopy and spectroscopic imaging. Proc. Natl. Acad. Sci. USA 2021, 118, e2014631118. [Google Scholar] [CrossRef] [PubMed]
- Gallagher, F.A.; Kettunen, M.I.; Hu, D.-E.; Jensen, P.R.; Karlsson, M.; Gisselsson, A.; Nelson, S.K.; Witney, T.H.; Bohndiek, S.E.; Hansson, G. Production of hyperpolarized [1, 4-13C2] malate from [1, 4-13C2] fumarate is a marker of cell necrosis and treatment response in tumors. Proc. Natl. Acad. Sci. USA 2009, 106, 19801–19806. [Google Scholar] [CrossRef] [PubMed]
- Hesketh, R.L.; Brindle, K.M. Magnetic resonance imaging of cancer metabolism with hyperpolarized 13C-labeled cell metabolites. Curr. Opin. Chem. Biol. 2018, 45, 187–194. [Google Scholar] [CrossRef]
- Hesse, F.; Wright, A.; Somai, V.; Bulat, F.; Brindle, K. Imaging response to radio-chemotherapy in brain tumor models using [2,3-2H2]fumarate and deuterium magnetic resonance spectroscopic imaging [Conference presentation]. In Proceedings of the ISMRM & SMRT Annual Meeting, Online, 15–20 May 2021. [Google Scholar]
- Li, Z.; Wang, F.; Liang, B.; Su, Y.; Sun, S.; Xia, S.; Shao, J.; Zhang, Z.; Hong, M.; Zhang, F. Methionine metabolism in chronic liver diseases: An update on molecular mechanism and therapeutic implication. Signal Transduct. Target. Ther. 2020, 5, 280. [Google Scholar] [CrossRef] [PubMed]
- Martínez, Y.; Li, X.; Liu, G.; Bin, P.; Yan, W.; Más, D.; Valdivié, M.; Hu, C.-A.A.; Ren, W.; Yin, Y. The role of methionine on metabolism, oxidative stress, and diseases. Amino Acids 2017, 49, 2091–2098. [Google Scholar] [CrossRef]
- London, R.E.; Gabel, S.A.; Funk, A. The metabolism of excess methionine in the liver of the intact rat: An in vivo deuterium NMR study. Biochemistry 1987, 26, 7166–7172. [Google Scholar] [CrossRef] [PubMed]
- London, R.E.; Gabel, S.A. A deuterium surface coil NMR study of the metabolism of D-methionine in the liver of the anesthetized rat. Biochemistry 1988, 27, 7864–7869. [Google Scholar] [CrossRef] [PubMed]
- Pal, D.; Bhattacharyya, A.; Husain, M.; Prasad, K.N.; Pandey, C.M.; Gupta, R.K. In vivo proton MR spectroscopy evaluation of pyogenic brain abscesses: A report of 194 cases. Am. J. Neuroradiol. 2010, 31, 360–366. [Google Scholar] [CrossRef] [PubMed]
- Grand, S.; Passaro, G.; Ziegler, A.; Estève, F.; Boujet, C.; Hoffmann, D.; Rubin, C.; Segebarth, C.; Décorps, M.; Le Bas, J.-F. Necrotic tumor versus brain abscess: Importance of amino acids detected at 1H MR spectroscopy—Initial results. Radiology 1999, 213, 785–793. [Google Scholar] [CrossRef]
- Kapsalaki, E.Z.; Gotsis, E.D.; Fountas, K.N. The role of proton magnetic resonance spectroscopy in the diagnosis and categorization of cerebral abscesses. Neurosurg. Focus 2008, 24, E7. [Google Scholar] [CrossRef] [PubMed]
- Dass, R.; Grudzia̧ż, K.; Ishikawa, T.; Nowakowski, M.; Dȩbowska, R.; Kazimierczuk, K. Fast 2D NMR spectroscopy for in vivo monitoring of bacterial metabolism in complex mixtures. Front. Microbiol. 2017, 8, 1306. [Google Scholar] [CrossRef] [PubMed]


Publisher’s Note: MDPI stays neutral with regard to jurisdictional claims in published maps and institutional affiliations. |
© 2021 by the authors. Licensee MDPI, Basel, Switzerland. This article is an open access article distributed under the terms and conditions of the Creative Commons Attribution (CC BY) license (https://creativecommons.org/licenses/by/4.0/).
Share and Cite
Polvoy, I.; Qin, H.; Flavell, R.R.; Gordon, J.; Viswanath, P.; Sriram, R.; Ohliger, M.A.; Wilson, D.M. Deuterium Metabolic Imaging—Rediscovery of a Spectroscopic Tool. Metabolites 2021, 11, 570. https://doi.org/10.3390/metabo11090570
Polvoy I, Qin H, Flavell RR, Gordon J, Viswanath P, Sriram R, Ohliger MA, Wilson DM. Deuterium Metabolic Imaging—Rediscovery of a Spectroscopic Tool. Metabolites. 2021; 11(9):570. https://doi.org/10.3390/metabo11090570
Chicago/Turabian StylePolvoy, Ilona, Hecong Qin, Robert R. Flavell, Jeremy Gordon, Pavithra Viswanath, Renuka Sriram, Michael A. Ohliger, and David M. Wilson. 2021. "Deuterium Metabolic Imaging—Rediscovery of a Spectroscopic Tool" Metabolites 11, no. 9: 570. https://doi.org/10.3390/metabo11090570
APA StylePolvoy, I., Qin, H., Flavell, R. R., Gordon, J., Viswanath, P., Sriram, R., Ohliger, M. A., & Wilson, D. M. (2021). Deuterium Metabolic Imaging—Rediscovery of a Spectroscopic Tool. Metabolites, 11(9), 570. https://doi.org/10.3390/metabo11090570