
Naturally Occurring Glycosidases in Milk from Native Cattle Breeds: Activity and Consequences on Free and Protein Bound-Glycans


 , , ,
, , ,  ,
,  and
and
Abstract
:1. Introduction
2. Results
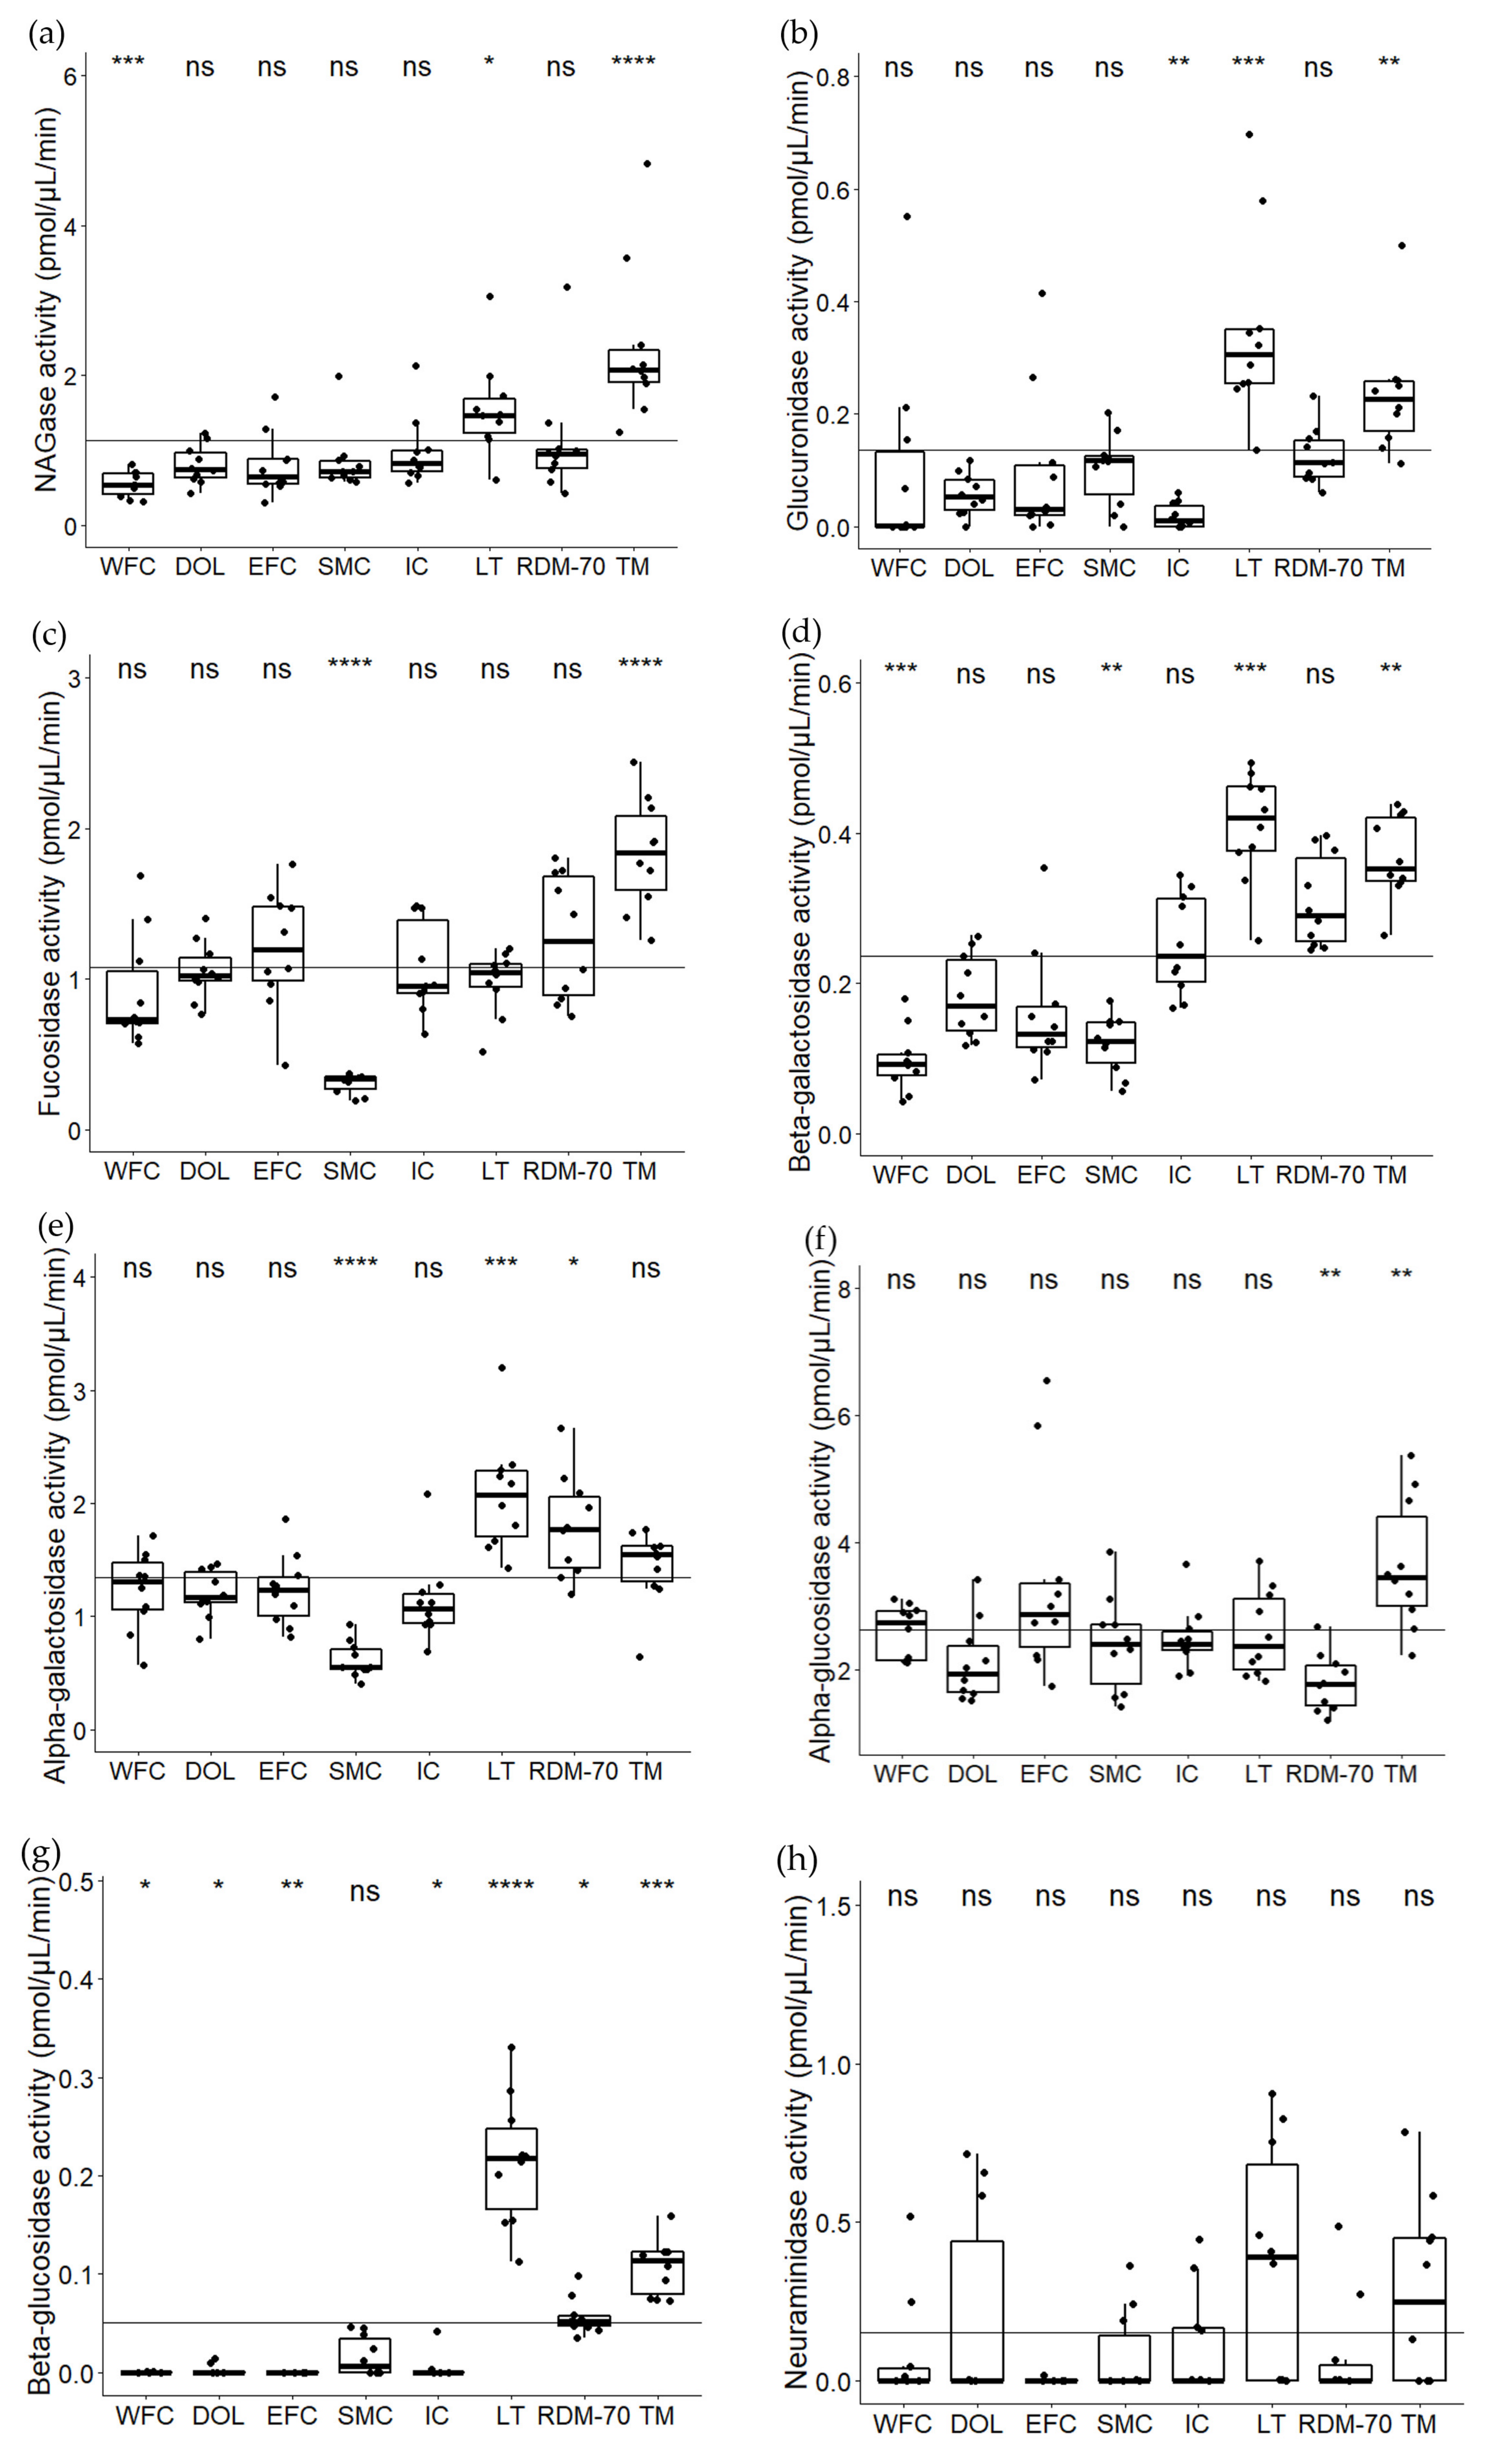
2.1. Variation in Natural Milk Glycosidases among Native North European Cattle Breeds
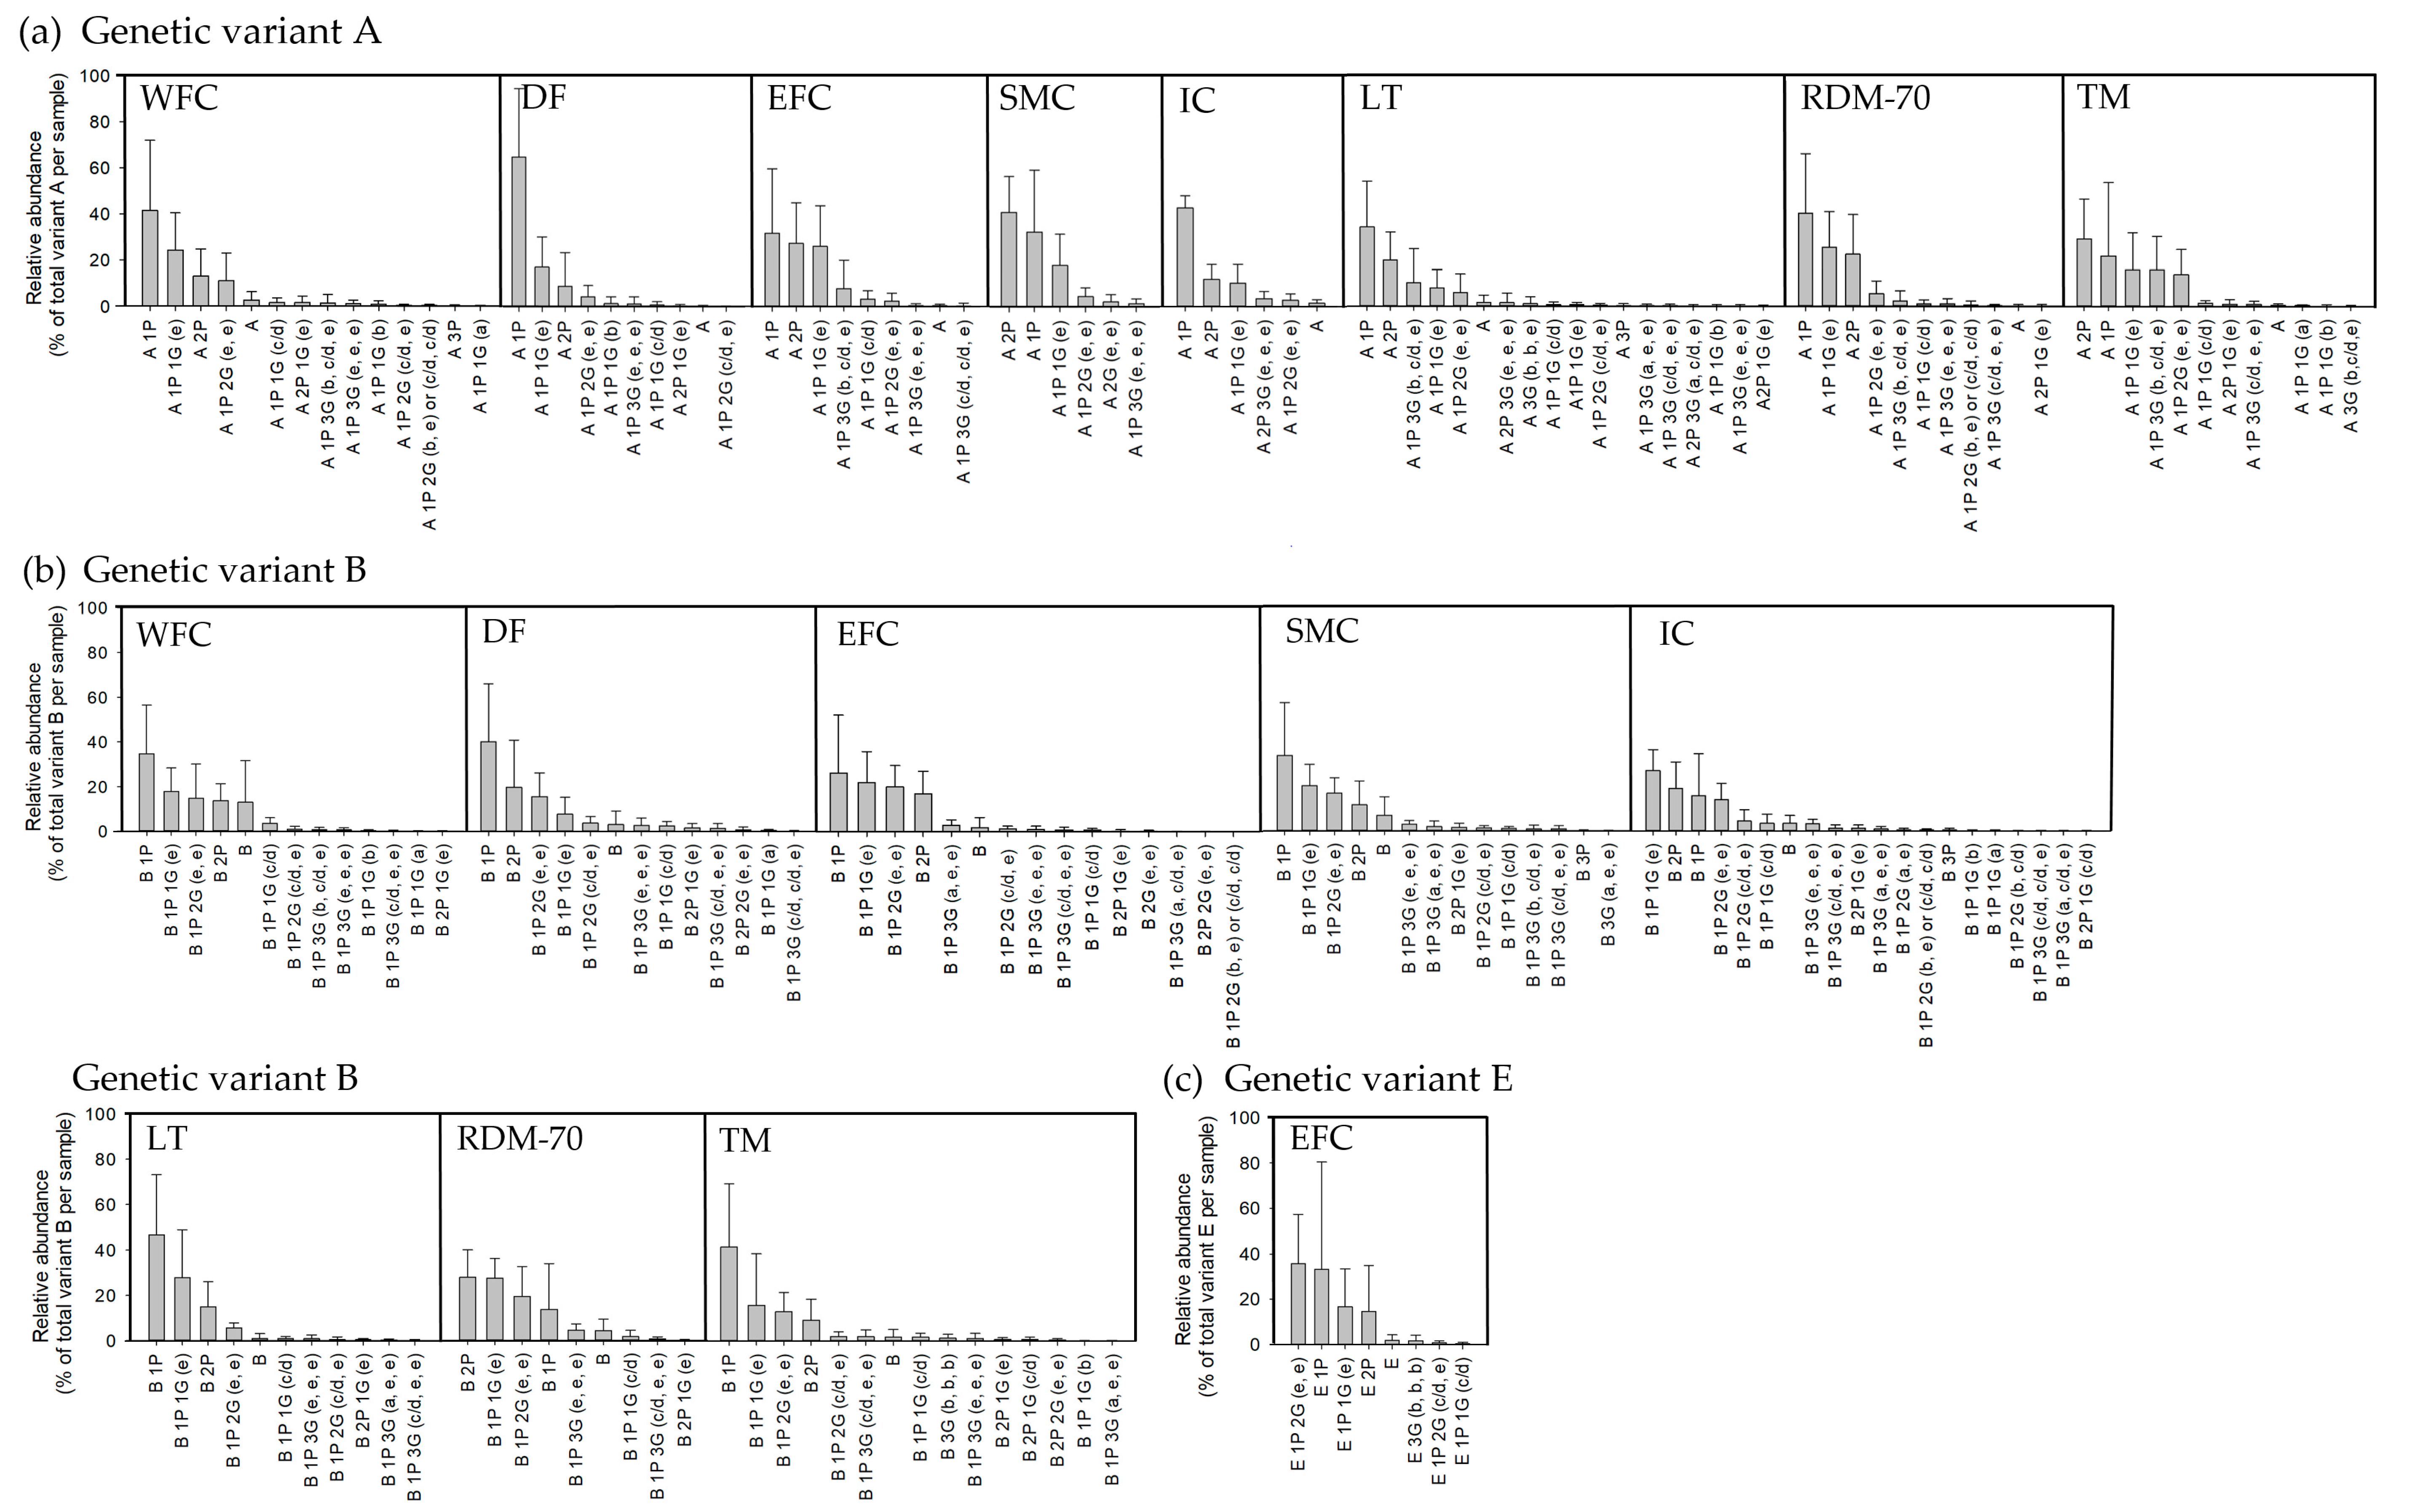
2.2. κ-Casein Isoform Variation across Native North European Cattle Breeds
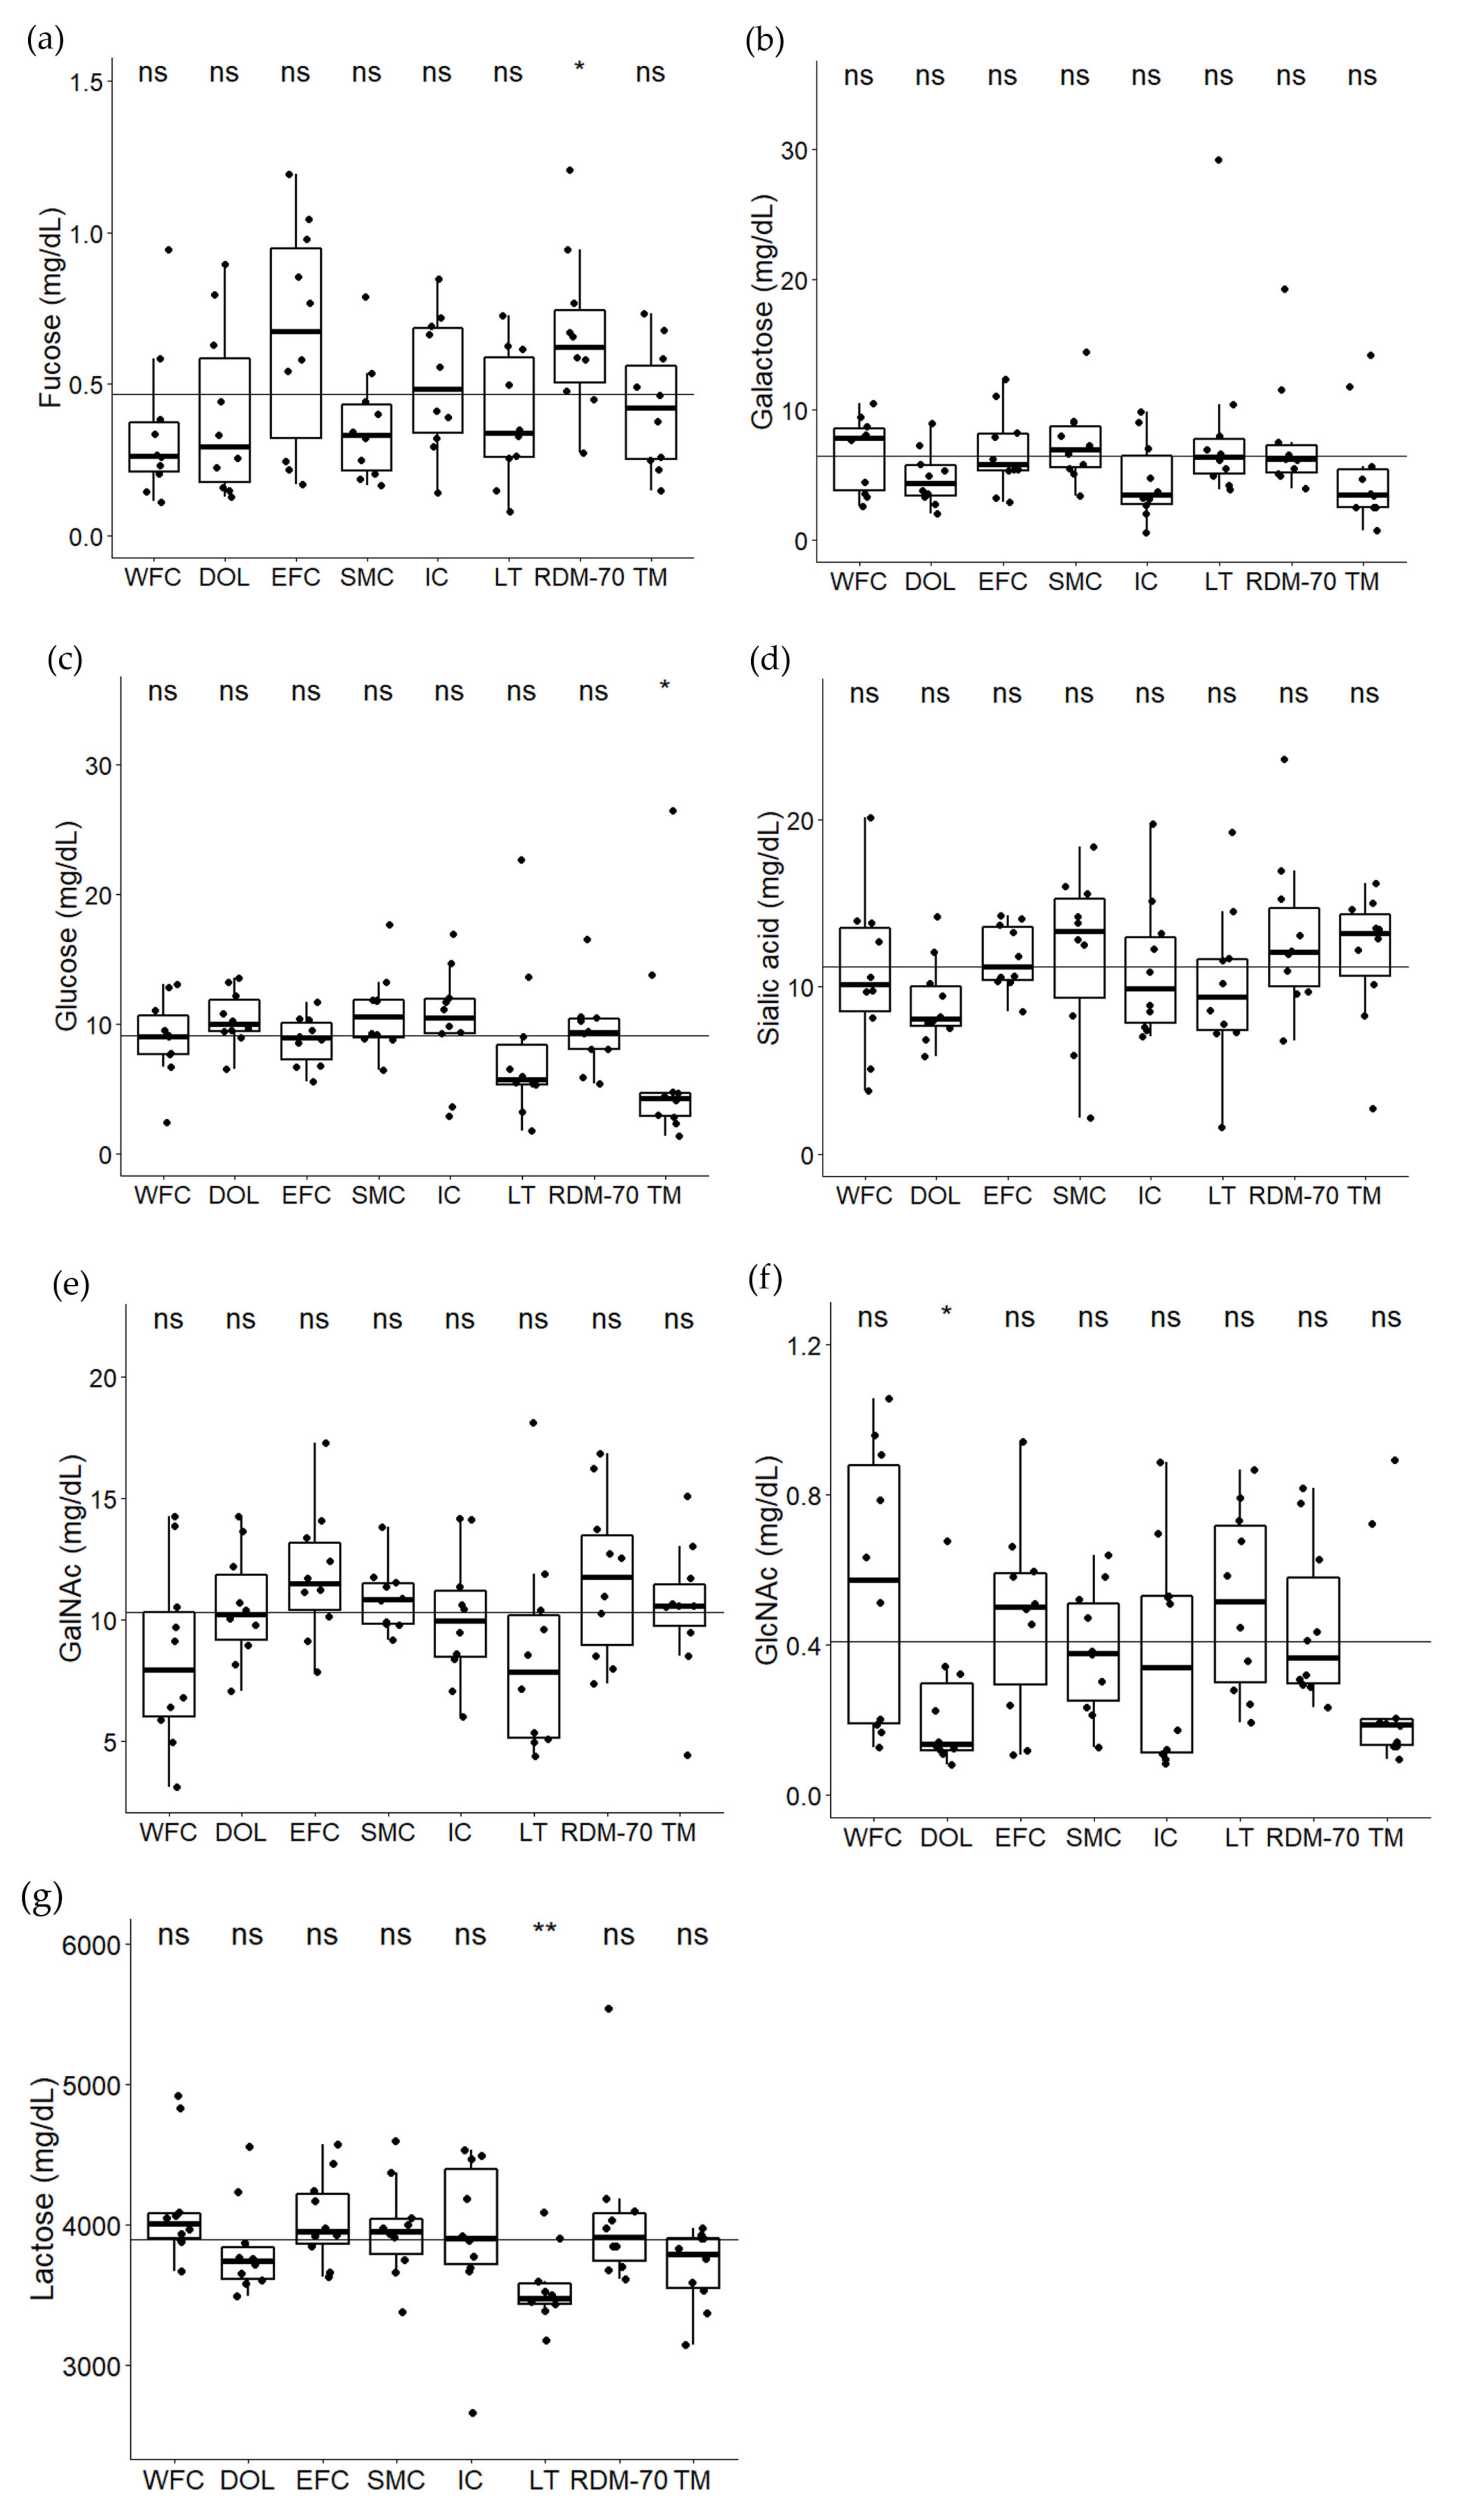
2.3. Lactose and Monosaccharides in Milk from the Native North European Cattle Breeds
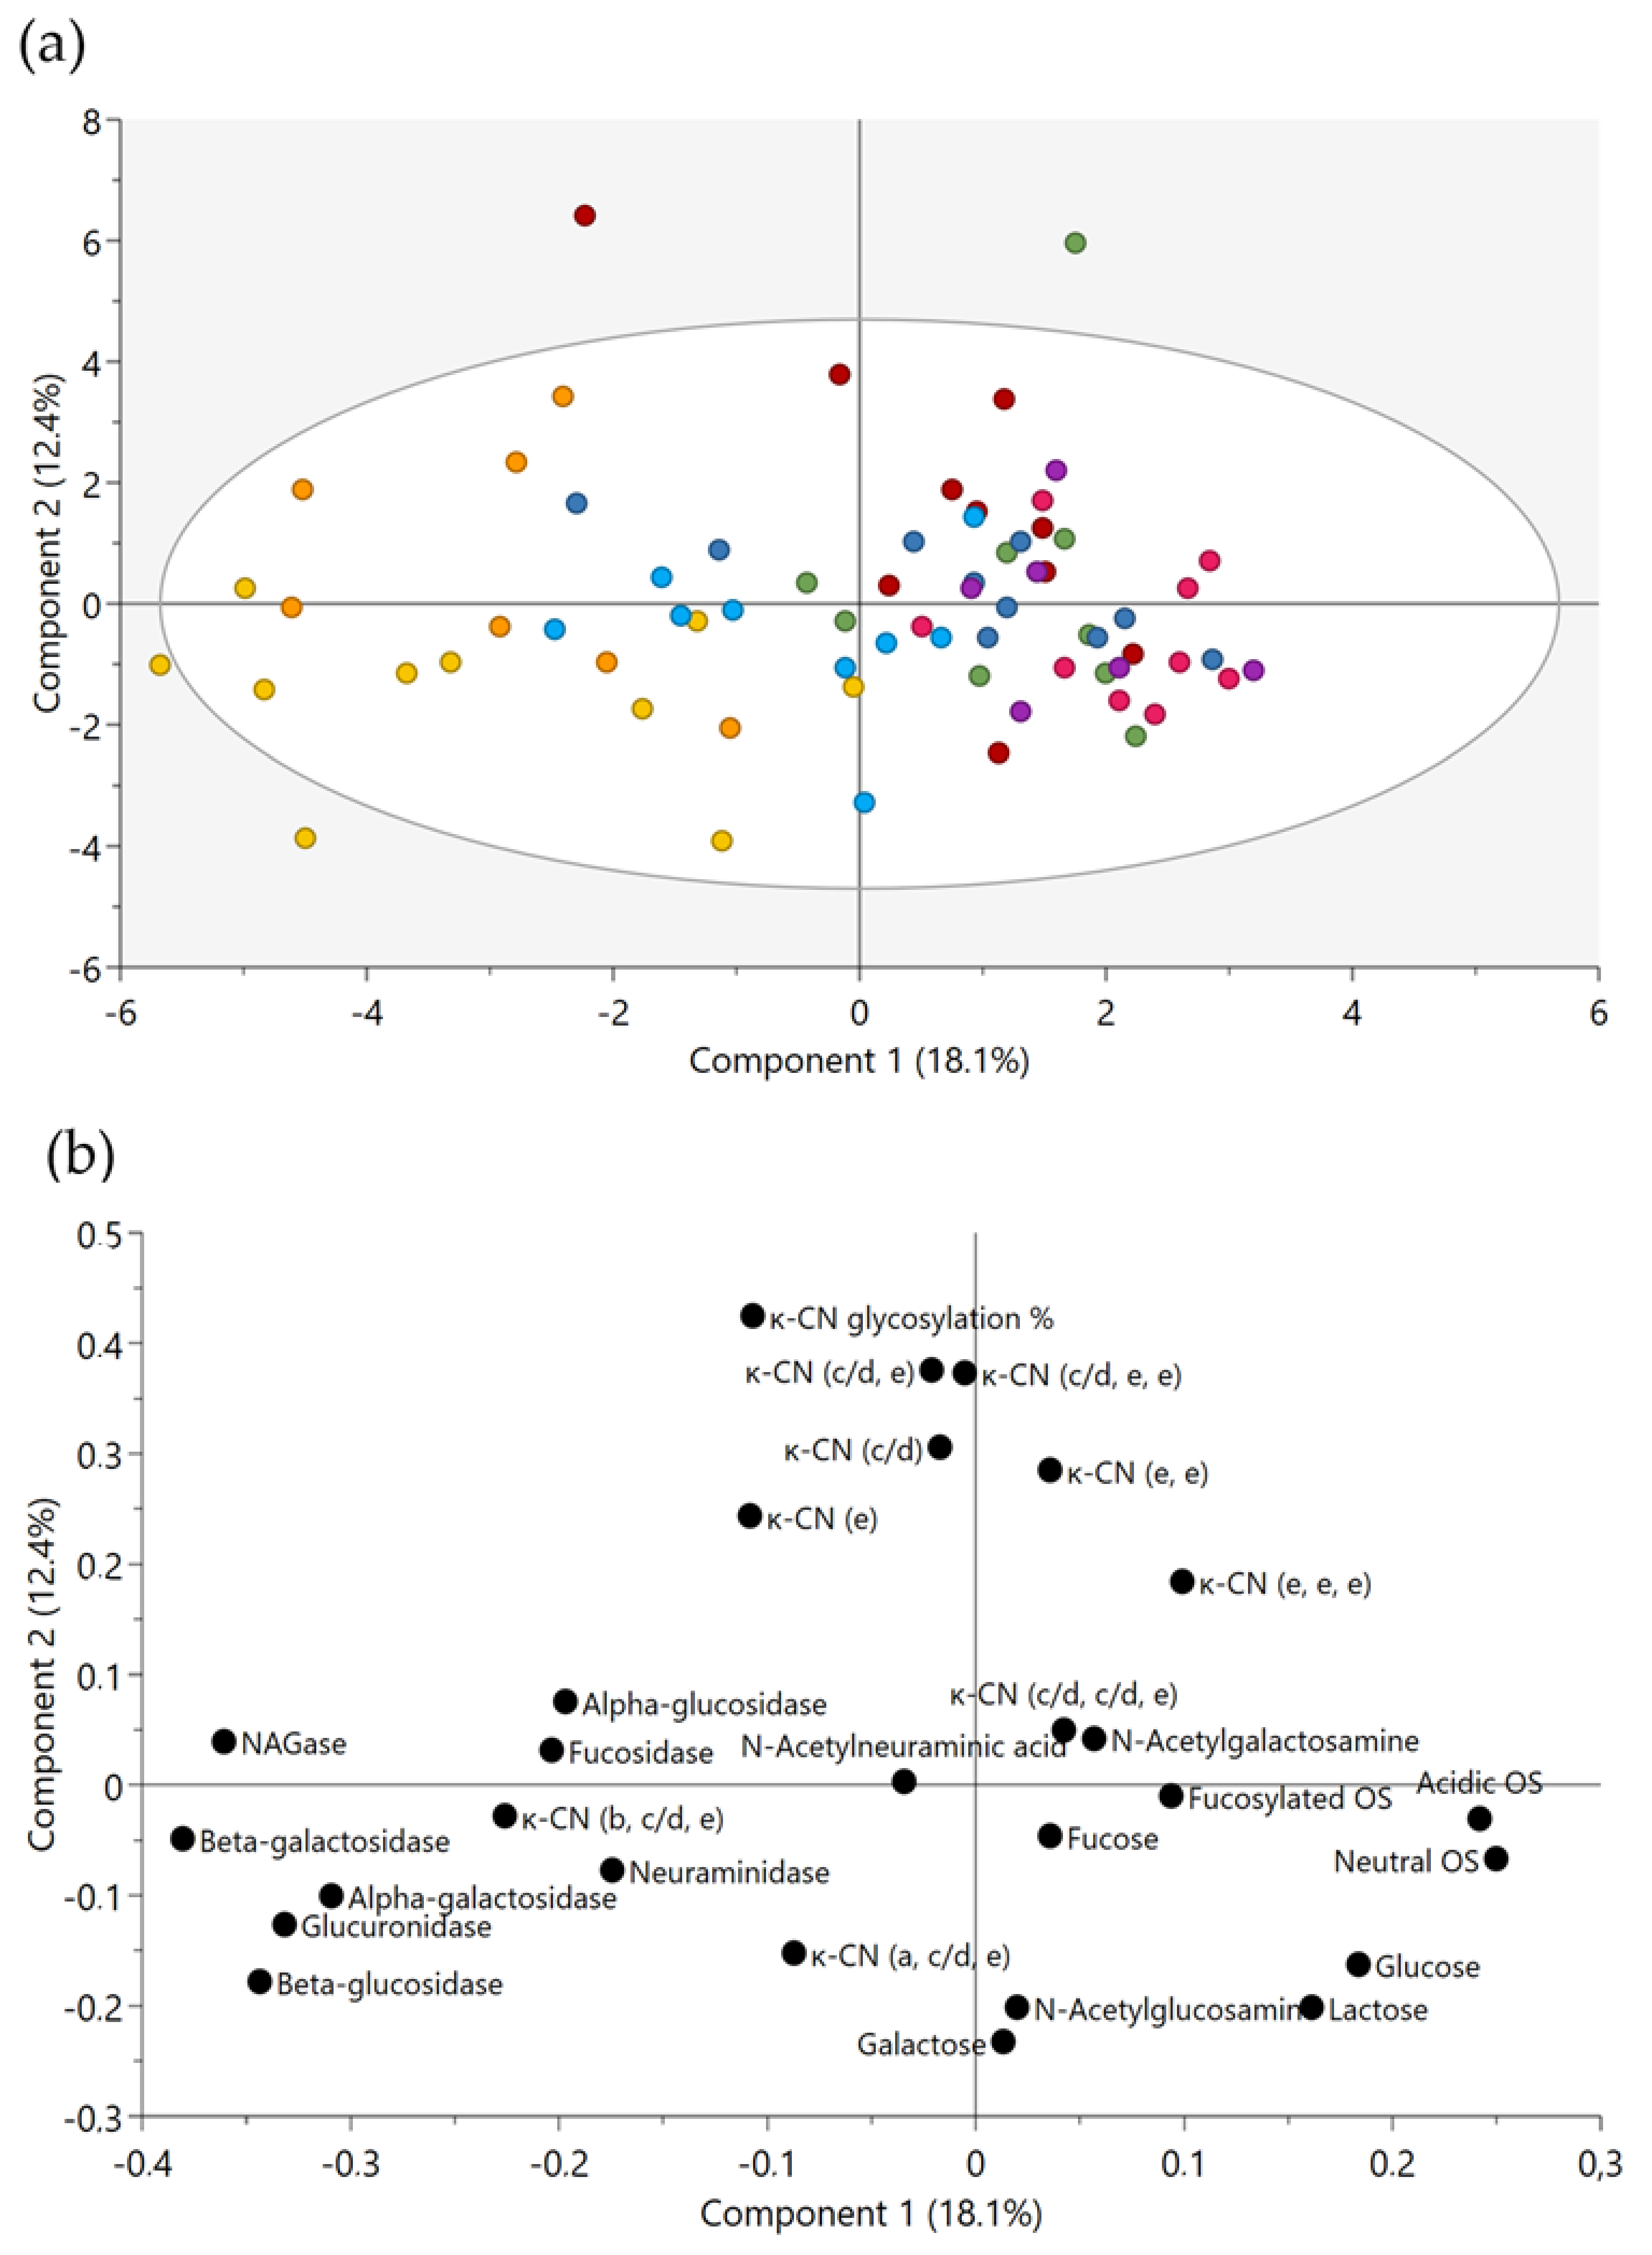
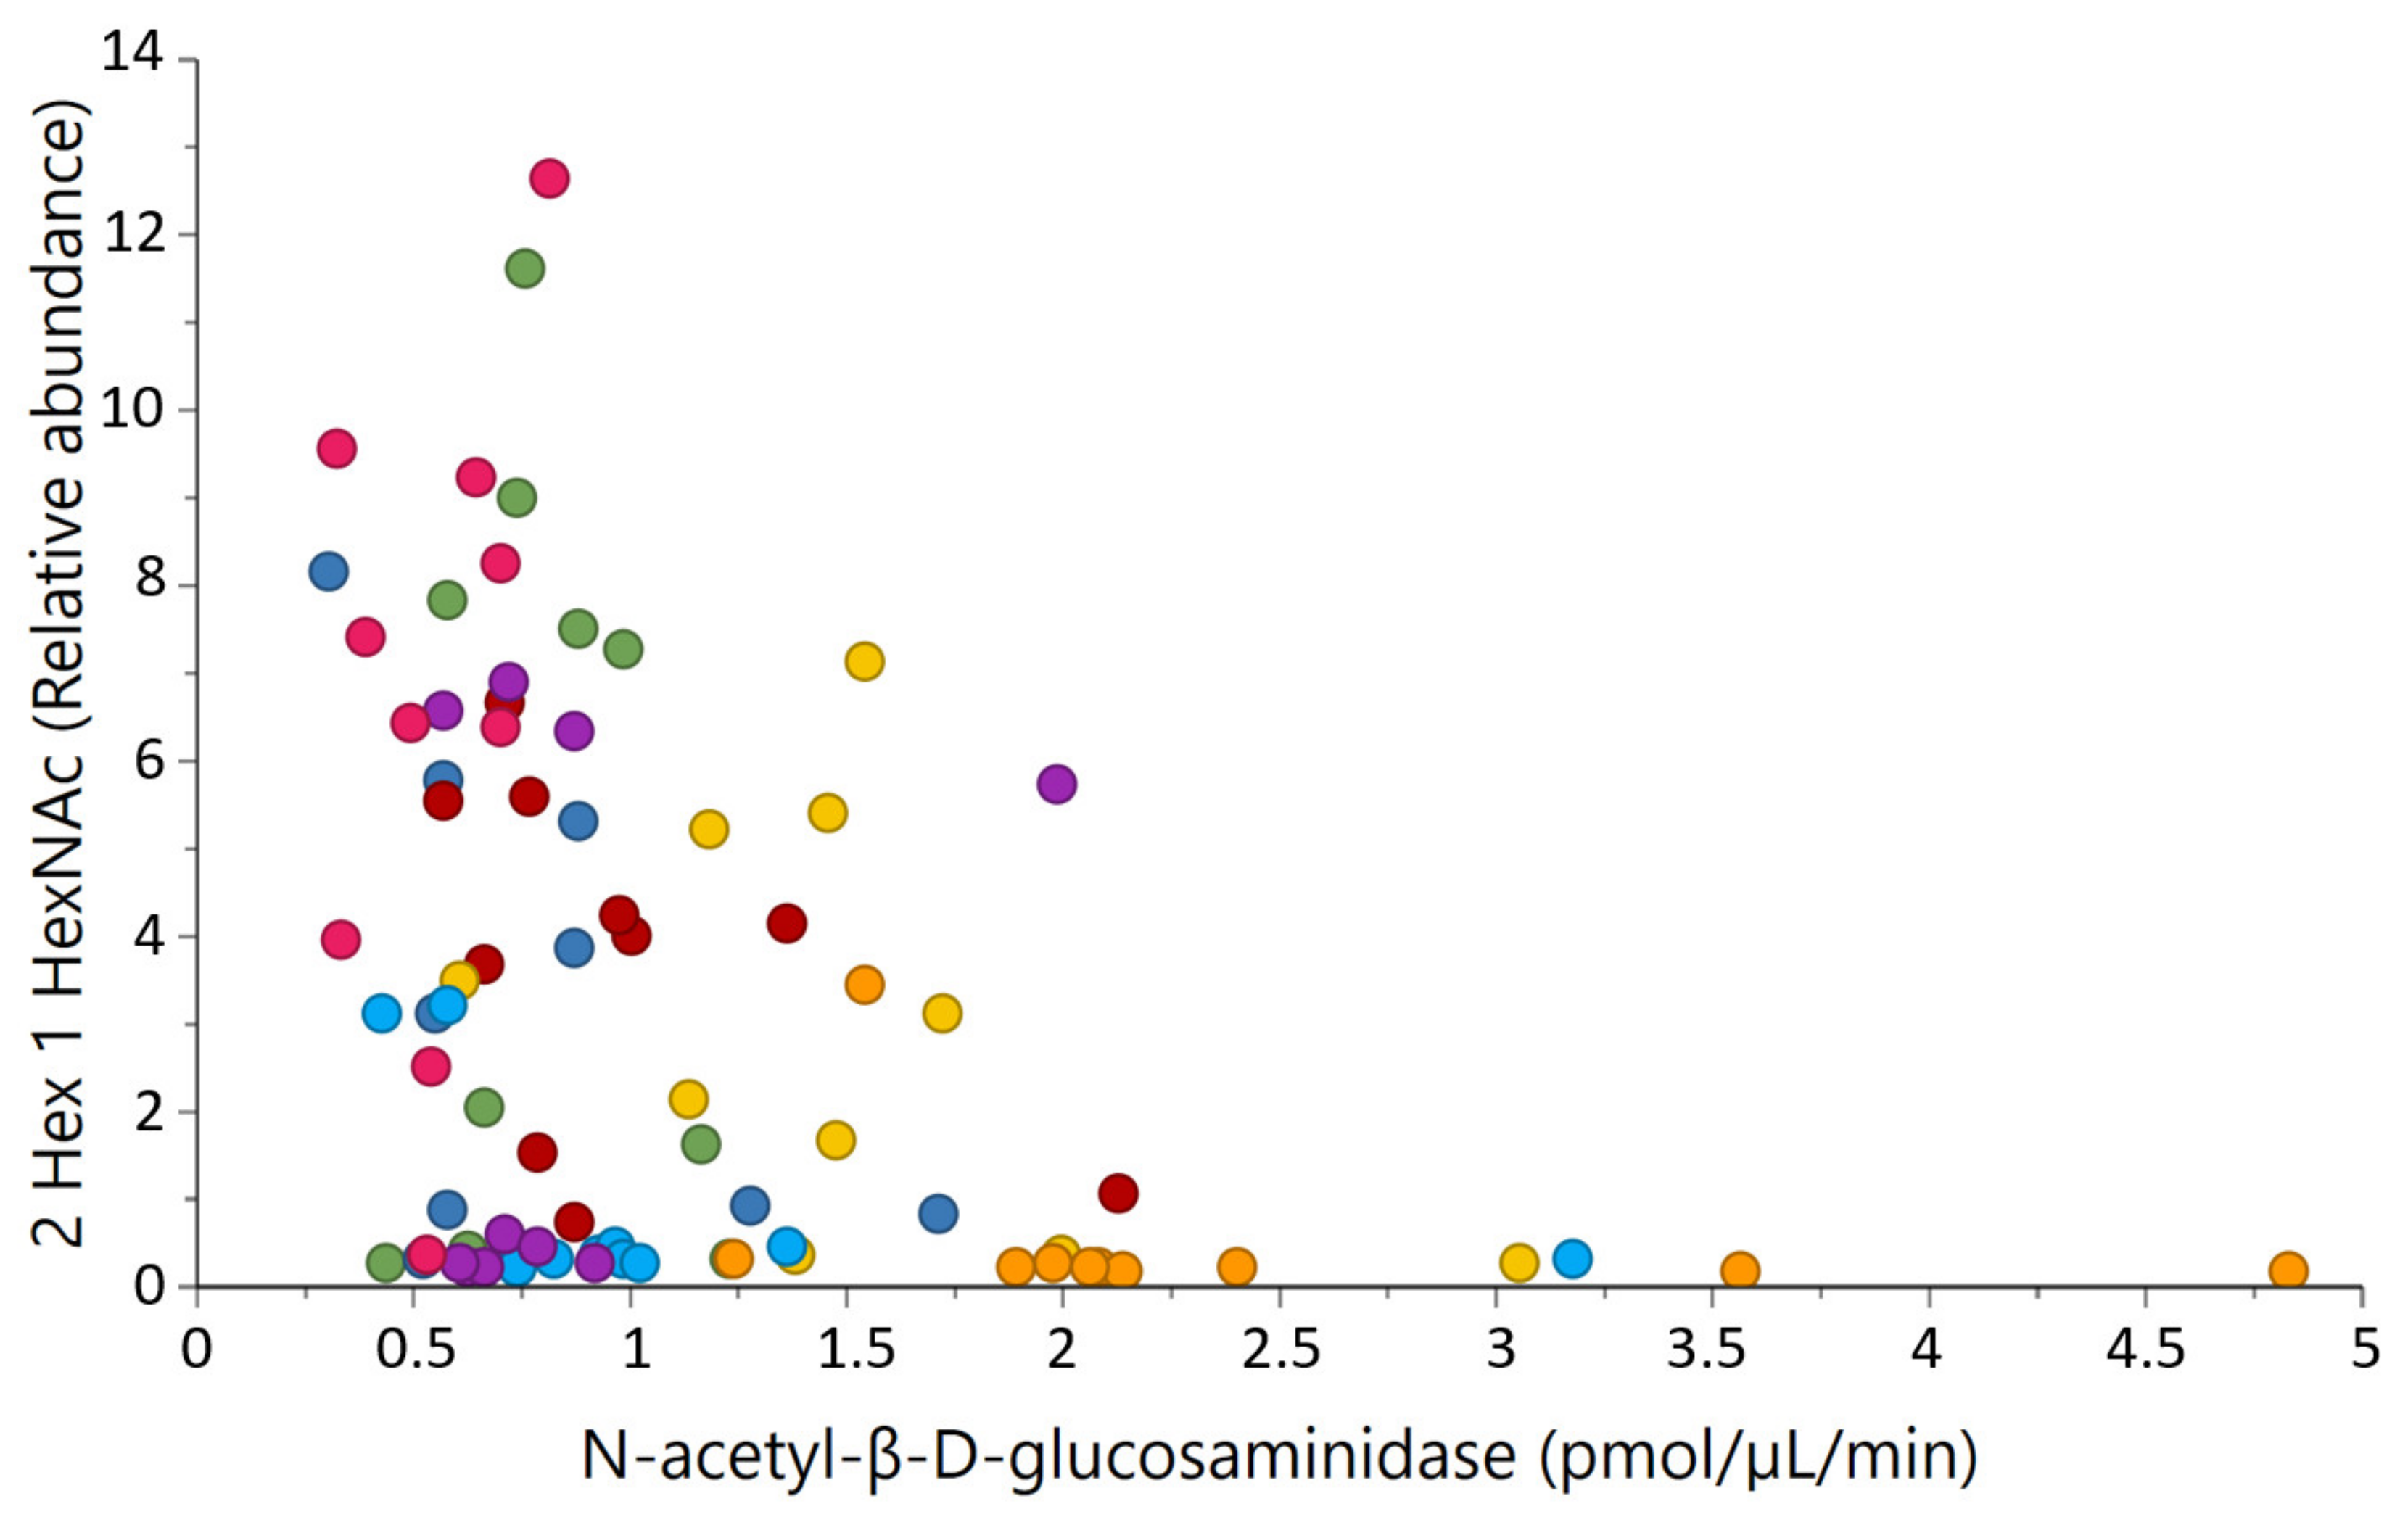
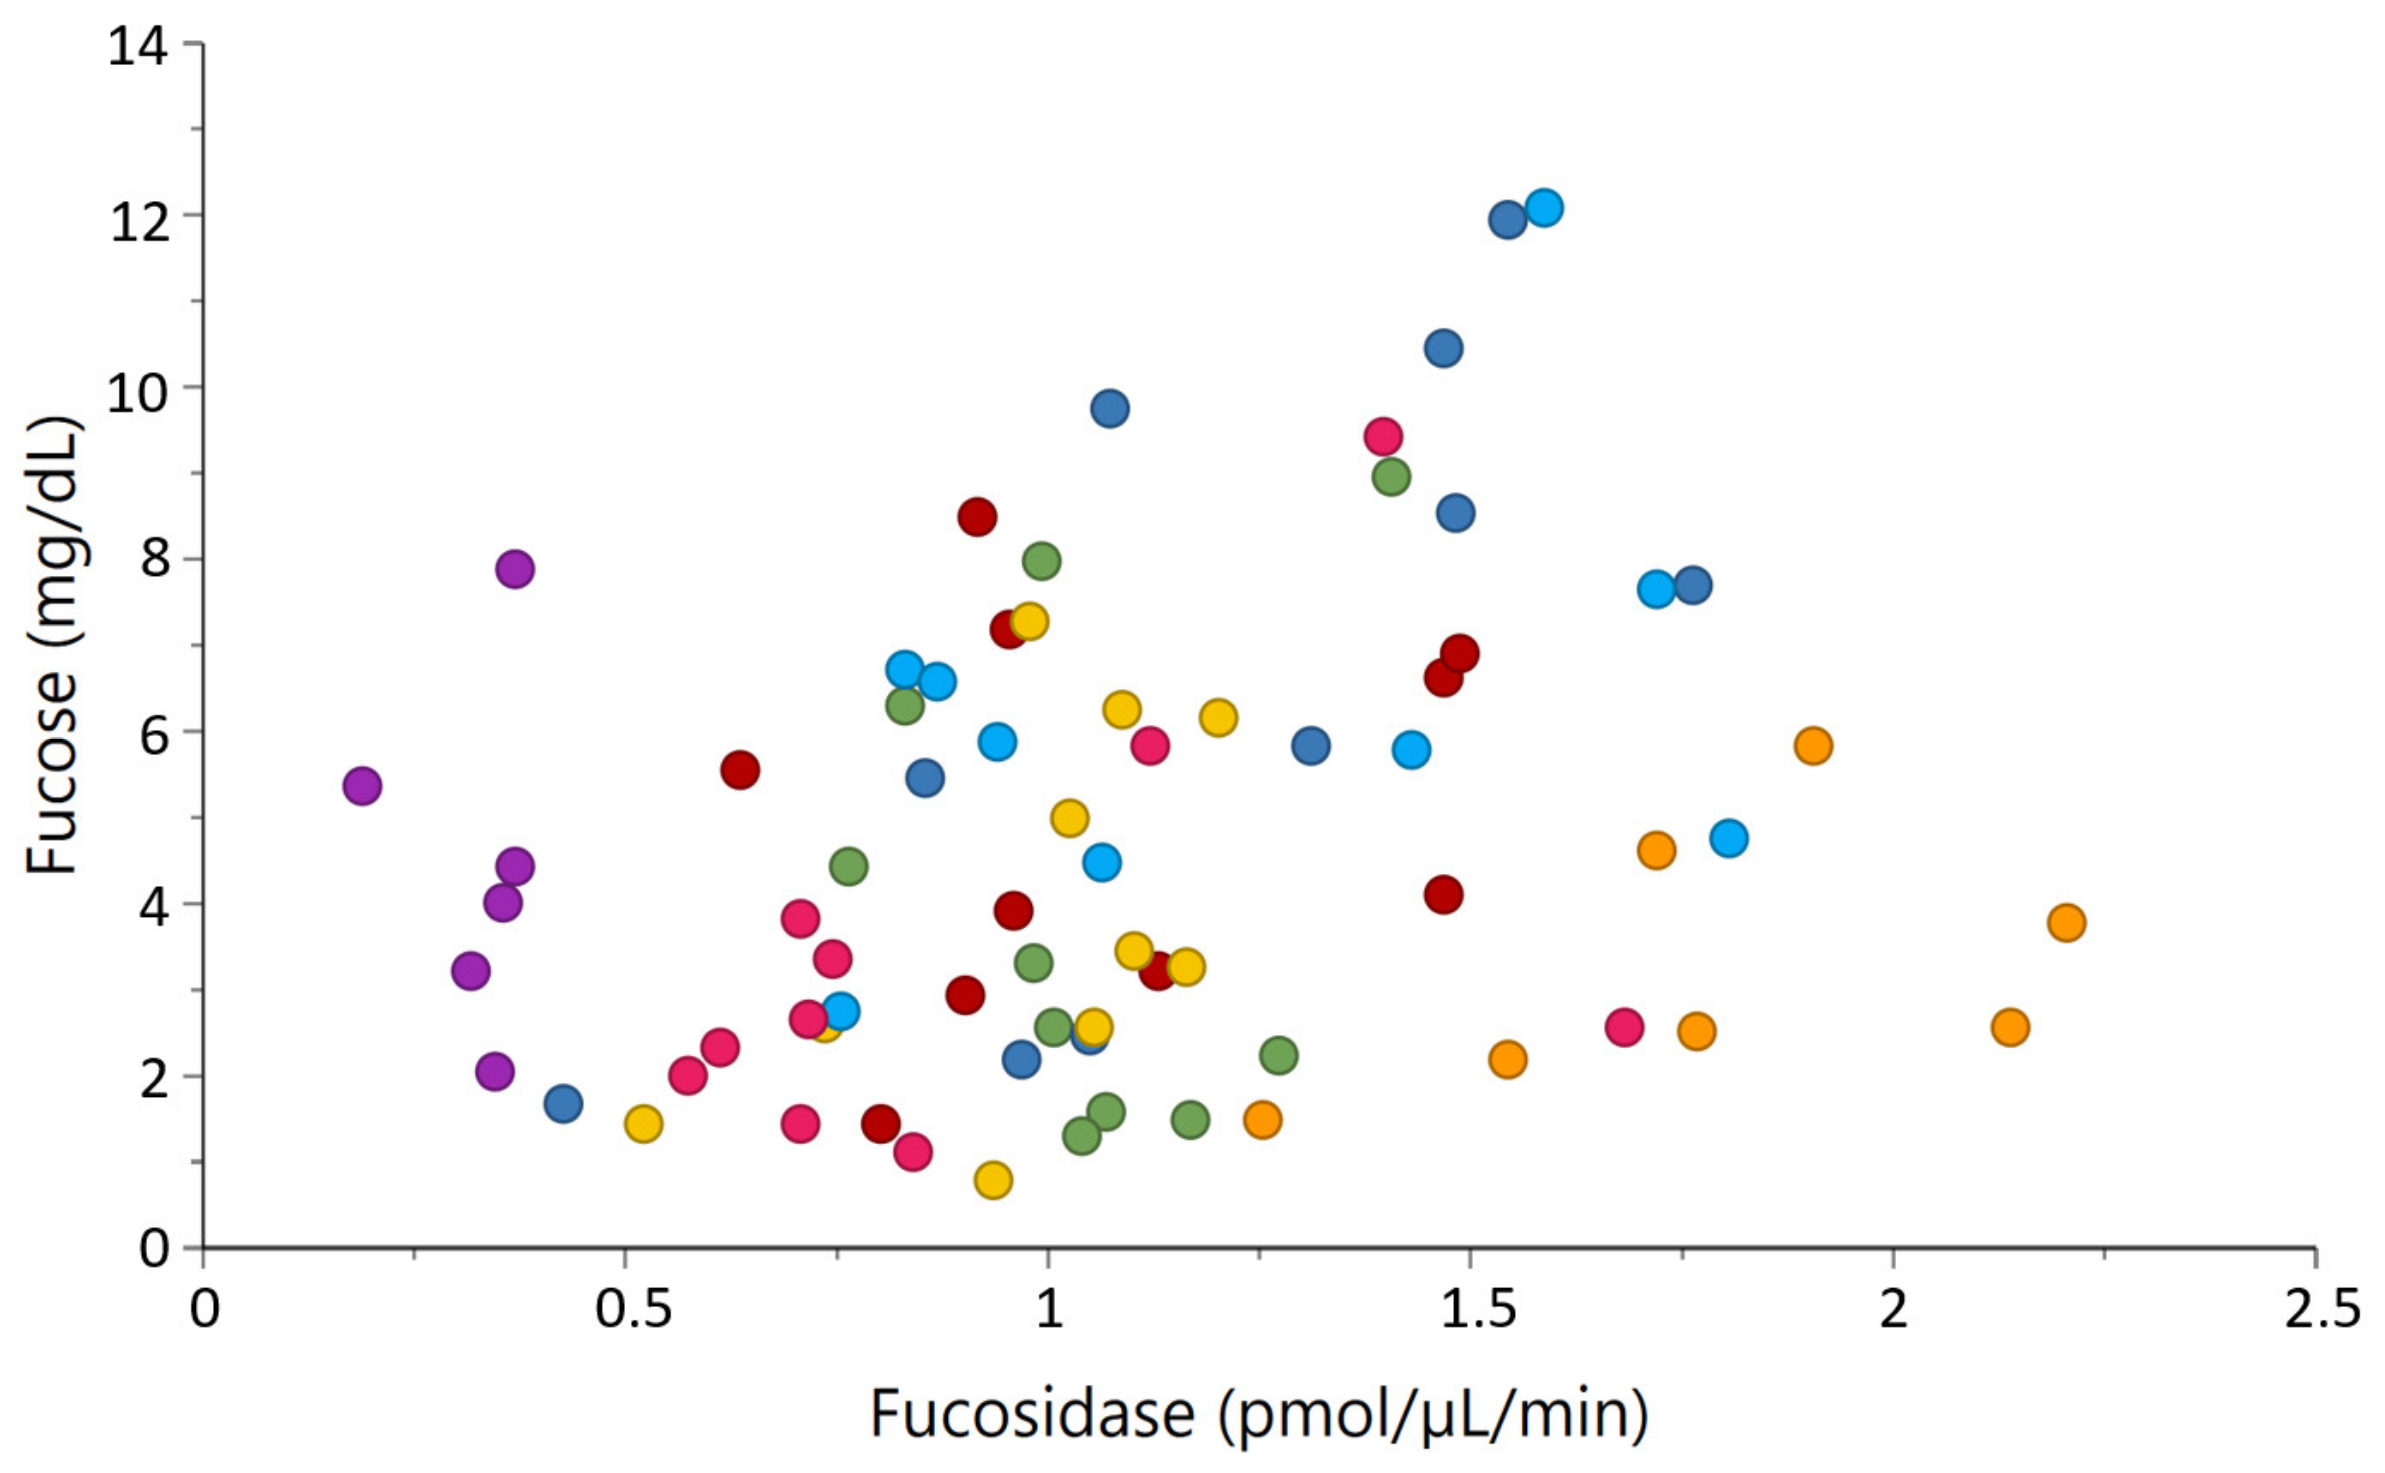
2.4. Correlations between Milk Glycosidases and Glycans
3. Discussion
3.1. Variations in Milk Glycosidase Activities among Native North European Cattle Breeds
3.2. Post-Translational Modifications of κ-Casein among Native Breeds
3.3. Potential Associations of Natural Milk Glycosidases and Glycans
4. Materials and Methods
4.1. Milk Samples and Sample Collection
4.2. Glycosidase Activities
4.3. O-Glycan Analysis by Liquid Chromatography-Electrospray Ionization-Mass Spectrometry
4.4. Oligosaccharide Extraction and HPLC-Chip/Quadrupole TOF MS
4.5. Quantification of Monosaccharides and Lactose by High Field Nuclear Magnetic Resonance
4.6. Data Analysis
5. Conclusions
Author Contributions
Funding
Institutional Review Board Statement
Informed Consent Statement
Data Availability Statement
Acknowledgments
Conflicts of Interests
Appendix A

| GMP Isoform. | RT | Experimental Mass | Theoretical Mass | Delta (ppm) | Relative Peak Height |
|---|---|---|---|---|---|
| A 1P | 19.9 | 6786.6 | 6787.6 | −146.5 | 0.737 |
| A 1P 1G (b) | 18.4 | 7151.8 | 7153.0 | −158.0 | 0.003 |
| A 1P 1G (c/d) | 17.9 | 7442.5 | 7444.2 | −224.5 | 0.005 |
| A 1P 1G (e) | 16.8–18.9 | 7734.0 | 7735.5 | −190.7 | 0.158 |
| A 1P 2G (c/d, e) | 7.1 | 8390.9 | 8392.1 | −144.8 | 0.004 |
| A 1P 2G (e, e) | 7.6 | 8682.2 | 8683.3 | −131.0 | 0.032 |
| A 2P | 20.6 | 6866.5 | 6867.6 | −167.0 | 0.060 |
| Monosaccaride | δ ppm | Assignment | H |
|---|---|---|---|
| Lactose | 3.28 | CH-2 | 1 |
| Glucose | 4.63 | CH-1 | 1 |
| Galactose | 5.25 | CH-1 | 1 |
| 4.57 | CH-1 | 1 | |
| N-acetyl-glucosamine | 2.04 | CH3 | 3 |
| N-acetyl-galactosamine | 2.05 | CH3 | 3 |
| Fucose | 1.24 | CH3-6 | 3 |
| Sialic acid | 1.78 | CH’-3 | 1 |
References
- Beja-Pereira, A.; Luikart, G.; England, P.R.; Bradley, D.G.; Jann, O.C.; Bertorelle, G.; Chamberlain, A.T.; Nunes, T.P.; Metodiev, S.; Ferrand, N.; et al. Gene-culture coevolution between cattle milk protein genes and human lactase genes. Nat. Genet. 2003, 35, 311–313. [Google Scholar] [CrossRef] [PubMed]
- Taberlet, P.; Valentini, A.; Rezaei, H.R.; Naderi, S.; Pompanon, F.; Negrini, R.; Ajmone-Marsan, P. Are cattle, sheep, and goats endangered species? Mol. Ecol. 2008, 17, 275–284. [Google Scholar] [CrossRef] [PubMed]
- Kantanen, J.; Olsaker, I.; Holm, L.E.; Lien, S.; Vilkki, J.; Brusgaard, K.; Eythorsdottir, E.; Danell, B.; Adalsteinsson, S. Genetic diversity and population structure of 20 north European cattle breeds. Amr. Genetic Asso. 2000, 91, 446–457. [Google Scholar] [CrossRef] [Green Version]
- Tapio, I.; Varv, S.; Bennewitz, J.; Maleviciute, J.; Fimland, E.; Grislis, Z.; Meuwissen, T.H.E.; Miceikiene, I.; Olsaker, I.; Viinalass, J.; et al. Prioritization for conservation of Northern European cattle breeds based on analysis of microsatellite data. Conserv. Biol. Vol. 2006, 20, 1768–1779. [Google Scholar] [CrossRef]
- Wang, M.; Monaco, M.H.; Hauser, J.; Yan, J.; Dilger, R.N.; Donovan, S.M. Bovine milk oligosaccharides and human milk oligosaccharides modulate the gut microbiota composition and volatile fatty acid concentrations in a preclinical neonatal model. Microorganisms 2021, 9, 884. [Google Scholar] [CrossRef]
- Obelitz-Ryom, K.; Bering, S.B.; Overgaard, S.H.; Eskildsen, S.F.; Ringgaard, S.; Olesen, J.L.; Skovgaard, K.; Pankratova, S.; Wang, B.; Brunse, A.; et al. Bovine milk oligosaccharides with sialyllactose improves cognition in preterm pigs. Nutrients 2019, 11, 1335. [Google Scholar] [CrossRef] [Green Version]
- Charbonneau, M.R.; O’Donnell, D.; Blanton, L.V.; Totten, S.M.; Davis, J.C.; Barratt, M.J.; Cheng, J.; Guruge, J.; Talcott, M.; Bain, J.R.; et al. Sialylated milk oligosaccharides promote microbiota-dependent growth in models of infant undernutrition. Cell 2016, 164, 859–871. [Google Scholar] [CrossRef] [Green Version]
- Hamilton, M.K.; Ronveaux, C.C.; Rust, B.M.; Newman, J.W.; Hawley, M.; Barile, D.; Mills, D.A.; Raybould, H.E. Prebiotic milk oligosaccharides prevent development of obese phenotype, impairment of gut permeability, and microbial dysbiosis in high fat-fed mice. Am. J. Physiol. Gastrointest. Liver Physiol. 2017, 312, G474–G487. [Google Scholar] [CrossRef]
- Boudry, G.; Hamilton, M.K.; Chichlowski, M.; Wickramasinghe, S.; Barile, D.; Kalanetra, K.M.; Mills, D.A.; Raybould, H.E. Bovine milk oligosaccharides decrease gut permeability and improve inflammation and microbial dysbiosis in diet-induced obese mice. J. Dairy Sci. 2017, 100, 2471–2481. [Google Scholar] [CrossRef] [PubMed] [Green Version]
- Sunds, A.V.; Bunyatratchata, A.; Robinson, R.; Glantz, M.; Paulsson, M.; Leskauskaite, D.; Pihlanto, A.; Inglingstad, R.; Devold, T.G.; Vegarud, G.E.; et al. Comparison of bovine milk oligosaccharides in native North European cattle breeds. Int. Dairy J. 2021, 114, 1–11. [Google Scholar] [CrossRef]
- O’Riordan, N.; Kane, M.; Joshi, L.; Hickey, R.M. Glycosidase activities in bovine milk over lactation. Int. Dairy J. 2014, 35, 116–121. [Google Scholar] [CrossRef]
- Dallas, D.C.; Murray, N.M.; Gan, J. Proteolytic systems in milk: Perspectives on the evolutionary function within the mammary gland and the infant. J. Mammary Gland Biol. Neoplasia 2015, 20, 133–147. [Google Scholar] [CrossRef] [PubMed] [Green Version]
- Fox, P. Enzymology of milk and dairy products: Overview. In Agents of Change: Enzymes in Milk and Dairy Products; Kelly, A.L., Larsen, L.B., Eds.; Springer: Cham, Switzerland, 2021; pp. 1–10. [Google Scholar]
- Kelly, A.L.; Fox, P.F. Indigenous enzymes in milk: A synopsis of future research requirements. Int. Dairy J. 2006, 16, 707–715. [Google Scholar] [CrossRef]
- Shennan, D.B.; Peaker, M. Transport of milk constituents by the mammary gland. Physiol. Rev. 2000, 80, 925–951. [Google Scholar] [CrossRef] [PubMed]
- Józwik, A.; Bagnicka, E.; Slivá-Józwik, A.; Strzalkowska, N.; Sloniewski, K.; Krzyzewski, J.; Kolataj, A. Activity of selected glycosidases of whole milk in cows as related to feeding season. Anim. Sci. Pap. Rep. 2004, 22, 673–677. [Google Scholar] [CrossRef]
- Józwik, A.; Strzalkowska, N.; Lipinska, P.; Markiewicz-Kęszycka, M.; Łysek-Gładysińska, M.; Wróblewska, B.; Stanisławska, I. The effect of breed and the feeding system on the activity of glycosidases in cow’s milk. Anim. Sci. Pap. Rep. 2016, 34, 41–52. [Google Scholar] [CrossRef] [Green Version]
- Hovinen, M.; Simojoki, H.; Poso, R.; Suolaniemi, J.; Kalmus, P.; Suojala, L.; Pyorala, S. N-acetyl-beta-D-glucosaminidase activity in cow milk as an indicator of mastitis. J. Dairy Res. 2016, 83, 219–227. [Google Scholar] [CrossRef]
- Bansal, B.K.; Hamann, J.; Grabowski, N.T.; Singh, K.B. Variation in the composition of selected milk fraction samples from healthy and mastitic quarters, and its significance for mastitis diagnosis. J. Dairy Res. 2005, 72, 144–152. [Google Scholar] [CrossRef]
- Wang, W.L.; Du, Y.M.; Wang, W.; Conway, L.P.; Cai, Z.P.; Voglmeir, J.; Liu, L. Comparison of the bifidogenic activity of human and bovine milk N-glycome. J. Funct. Foods 2017, 33, 40–51. [Google Scholar] [CrossRef]
- Karav, S.; Le Parc, A.; Leite Nobrega de Moura Bell, J.M.; Frese, S.A.; Kirmiz, N.; Block, D.E.; Barile, D.; Mills, D.A. Oligosaccharides released from milk glycoproteins are selective growth substrates for infant-associated Bifidobacteria. Appl. Environ. Microbiol. 2016, 82, 3622–3630. [Google Scholar] [CrossRef] [Green Version]
- Walstra, P.; Wouters, J.T.M.; Geurts, T.J. Dairy Science and Technology, 2nd ed.; CRC Press: Boca Raton, FL, USA, 2006. [Google Scholar]
- Manso, M.A.; López-Fandiño, R. κ-Casein macropeptides from cheese whey: Physicochemical, biological, nutritional, and technological features for possible uses. Food Rev. Int. 2004, 20, 329–355. [Google Scholar] [CrossRef]
- Farrell, H.M.; Jimenez-Flores, R.; Bleck, G.T.; Brown, E.M.; Butler, J.E.; Creamer, L.K.; Hicks, C.L.; Hollar, C.M.; Ng-Kwai-Hang, K.F.; Swaisgood, H.E. Nomenclature of the proteins of cows’ milk - Sixth revision. J. Dairy Sci. 2004, 87, 1641–1674. [Google Scholar] [CrossRef] [Green Version]
- Saito, T.; Itoh, T. Variations and distribution of O-glycosidically linked sugar chains in bovine κ-casein. J. Dairy Sci. 1992, 75, 1768–1774. [Google Scholar] [CrossRef]
- Jensen, H.B.; Pedersen, K.S.; Johansen, L.B.; Poulsen, N.A.; Bakman, M.; Chatterton, D.E.; Larsen, L.B. Genetic variation and posttranslational modification of bovine kappa-casein: Effects on caseino-macropeptide release during renneting. J. Dairy Sci. 2015, 98, 747–758. [Google Scholar] [CrossRef]
- Holland, J.W.; Deeth, H.C.; Alewood, P.F. Resolution and characterisation of multiple isoforms of bovine kappa-casein by 2-DE following a reversible cysteine-tagging enrichment strategy. Proteomics 2006, 6, 3087–3095. [Google Scholar] [CrossRef]
- Nwosu, C.C.; Strum, J.S.; An, H.J.; Lebrilla, C.B. Enhanced detection and identification of glycopeptides in negative ion mode mass spectrometry. Anal. Chem. 2010, 82, 9654–9662. [Google Scholar] [CrossRef] [PubMed] [Green Version]
- Oliveros, E.; Vazquez, E.; Barranco, A.; Ramirez, M.; Gruart, A.; Delgado-Garcia, J.M.; Buck, R.; Rueda, R.; Martin, M.J. Sialic acid and sialylated oligosaccharide supplementation during lactation improves learning and memory in rats. Nutrients 2018, 10, 1519. [Google Scholar] [CrossRef] [Green Version]
- Jensen, H.B.; Holland, J.W.; Poulsen, N.A.; Larsen, L.B. Milk protein genetic variants and isoforms identified in bovine milk representing extremes in coagulation properties. J. Dairy Sci. 2012, 95, 2891–2903. [Google Scholar] [CrossRef] [PubMed]
- Wickramasinghe, S.; Hua, S.; Rincon, G.; Islas-Trejo, A.; German, J.B.; Lebrilla, C.B.; Medrano, J.F. Transcriptome profiling of bovine milk oligosaccharide metabolism genes using RNA-sequencing. PLoS ONE 2011, 6, e18895. [Google Scholar] [CrossRef]
- Wiederschain, G.Y.; Newburg, D.S. Glycoconjugate stability in human milk: Glycosidase activities and sugar release. J. Nutr. Biochem. 2001, 12, 559–564. [Google Scholar] [CrossRef]
- Chagunda, M.G.; Larsen, T.; Bjerring, M.; Ingvartsen, K.L. L-lactate dehydrogenase and N-acetyl-beta-D-glucosaminidase activities in bovine milk as indicators of non-specific mastitis. J. Dairy Res. 2006, 73, 431–440. [Google Scholar] [CrossRef]
- Larsen, T.; Aulrich, K. Optimizing the fluorometric beta-glucuronidase assay in ruminant milk for a more precise determination of mastitis. J. Dairy Res. 2012, 79, 7–15. [Google Scholar] [CrossRef] [PubMed]
- Kobata, A. Exo- and endoglycosidases revisited. P. Jpn. Acad. B-Phys. 2013, 89, 97–117. [Google Scholar] [CrossRef] [Green Version]
- Coppa, G.V.; Gabrielli, O.; Bertino, E.; Zampini, L.; Galeazzi, T.; Padella, L.; Santoro, L.; Marchesiello, R.L.; Galeotti, F.; Maccari, F.; et al. Human milk glycosaminoglycans: The state of the art and future perspectives. Ital. J. Pediatr. 2013, 39, 1–4. [Google Scholar] [CrossRef] [Green Version]
- Sunds, A.V.; Sundekilde, U.K.; Poulsen, N.A.; Larsen, L.B. Association between udder inflammation and glycosidase activities and free sugar levels in bovine milk. Inter. Dairy J. 2021, 120, 1–11. [Google Scholar] [CrossRef]
- Nilsson, K.; Buhelt Johansen, L.; de Koning, D.J.; Duchemin, S.I.; Stenholdt Hansen, M.; Stalhammar, H.; Lindmark-Mansson, H.; Paulsson, M.; Fikse, W.F.; Glantz, M. Effects of milk proteins and posttranslational modifications on noncoagulating milk from Swedish Red dairy cattle. J. Dairy Sci. 2020, 103, 6858–6868. [Google Scholar] [CrossRef] [PubMed]
- Miranda, G.; Bianchi, L.; Krupova, Z.; Trossat, P.; Martin, P. An improved LC-MS method to profile molecular diversity and quantify the six main bovine milk proteins, including genetic and splicing variants as well as post-translationally modified isoforms. Food Chem. X. 2020, 5, 100080. [Google Scholar] [CrossRef]
- Guerrero, A.; Lerno, L.; Barile, D.; Lebrilla, C.B. Top-down analysis of highly post-translationally modified peptides by Fourier transform ion cyclotron resonance mass spectrometry. J. Am. Soc. Mass Spectrom. 2015, 26, 453–459. [Google Scholar] [CrossRef] [Green Version]
- Holland, J.W.; Deeth, H.C.; Alewood, P.F. Proteomic analysis of kappa-casein micro-heterogeneity. Proteomics 2004, 4, 743–752. [Google Scholar] [CrossRef]
- Sunds, A.V.; Poulsen, N.A.; Larsen, L.B. Short communication: Application of proteomics for characterization of caseinomacropeptide isoforms before and after desialidation. J. Dairy Sci. 2019, 102, 8696–8703. [Google Scholar] [CrossRef] [PubMed]
- Alipour, M.J.; Jalanka, J.; Pessa-Morikawa, T.; Kokkonen, T.; Satokari, R.; Hynonen, U.; Iivanainen, A.; Niku, M. The composition of the perinatal intestinal microbiota in cattle. Sci. Rep. 2018, 8, 10437. [Google Scholar] [CrossRef]
- Varki, A.; Cummings, R.D.; Esko, J.D.; Stanley, P.; Hart, G.W.; Aebi, M.; Darvill, A.G.; Kinoshita, T.; Packer, N.H.; Prestegard, J.H.; et al. Essentials of Glycobiology, 3rd ed.; Cold Spring Harbor Laboratory Press: Cold Spring Harbor, NY, USA, 2017. [Google Scholar]
- Poulsen, N.A.; Robinson, R.C.; Barile, D.; Larsen, L.B.; Buitenhuis, B. A genome-wide association study reveals specific transferases as candidate loci for bovine milk oligosaccharides synthesis. BMC Genomics 2019, 20, 404. [Google Scholar] [CrossRef] [PubMed]
- Newburg, D.S. Glycobiology of human milk. Biochemistry 2013, 78, 771–785. [Google Scholar] [CrossRef]
- Alhussien, M.N.; Dang, A.K. Milk somatic cells, factors influencing their release, future prospects, and practical utility in dairy animals: An overview. Vet. World 2018, 11, 562–577. [Google Scholar] [CrossRef] [PubMed]
- Ilves, A.; Harzia, H.; Ling, K.; Ots, M.; Soomets, U.; Kilk, K. Alterations in milk and blood metabolomes during the first months of lactation in dairy cows. J. Dairy Sci. 2012, 95, 5788–5797. [Google Scholar] [CrossRef] [PubMed]
- Bannerman, D.D. Pathogen-dependent induction of cytokines and other soluble inflammatory mediators during intramammary infection of dairy cows. J. Anim. Sci. 2009, 87, 10–25. [Google Scholar] [CrossRef] [Green Version]
- Sundekilde, U.K.; Poulsen, N.A.; Larsen, L.B.; Bertram, H.C. Nuclear magnetic resonance metabonomics reveals strong association between milk metabolites and somatic cell count in bovine milk. J. Dairy Sci. 2013, 96, 290–299. [Google Scholar] [CrossRef]


| First Parameter | Correlated Parameter | r | p-Value |
|---|---|---|---|
| β-galactosidase activity | β-glucosidase activity | 0.79 | <0.001 |
| β-glucuronidase activity | β-glucosidase activity | 0.73 | <0.001 |
| β-glucuronidase activity | β-galactosidase activity | 0.61 | <0.001 |
| β-glucuronidase activity | N-acetyl-β-glucosaminidase activity | 0.52 | <0.001 |
| N-acetyl-β-glucosaminidase activity | 2 Hex 1 HexNAc | −0.40 | <0.001 |
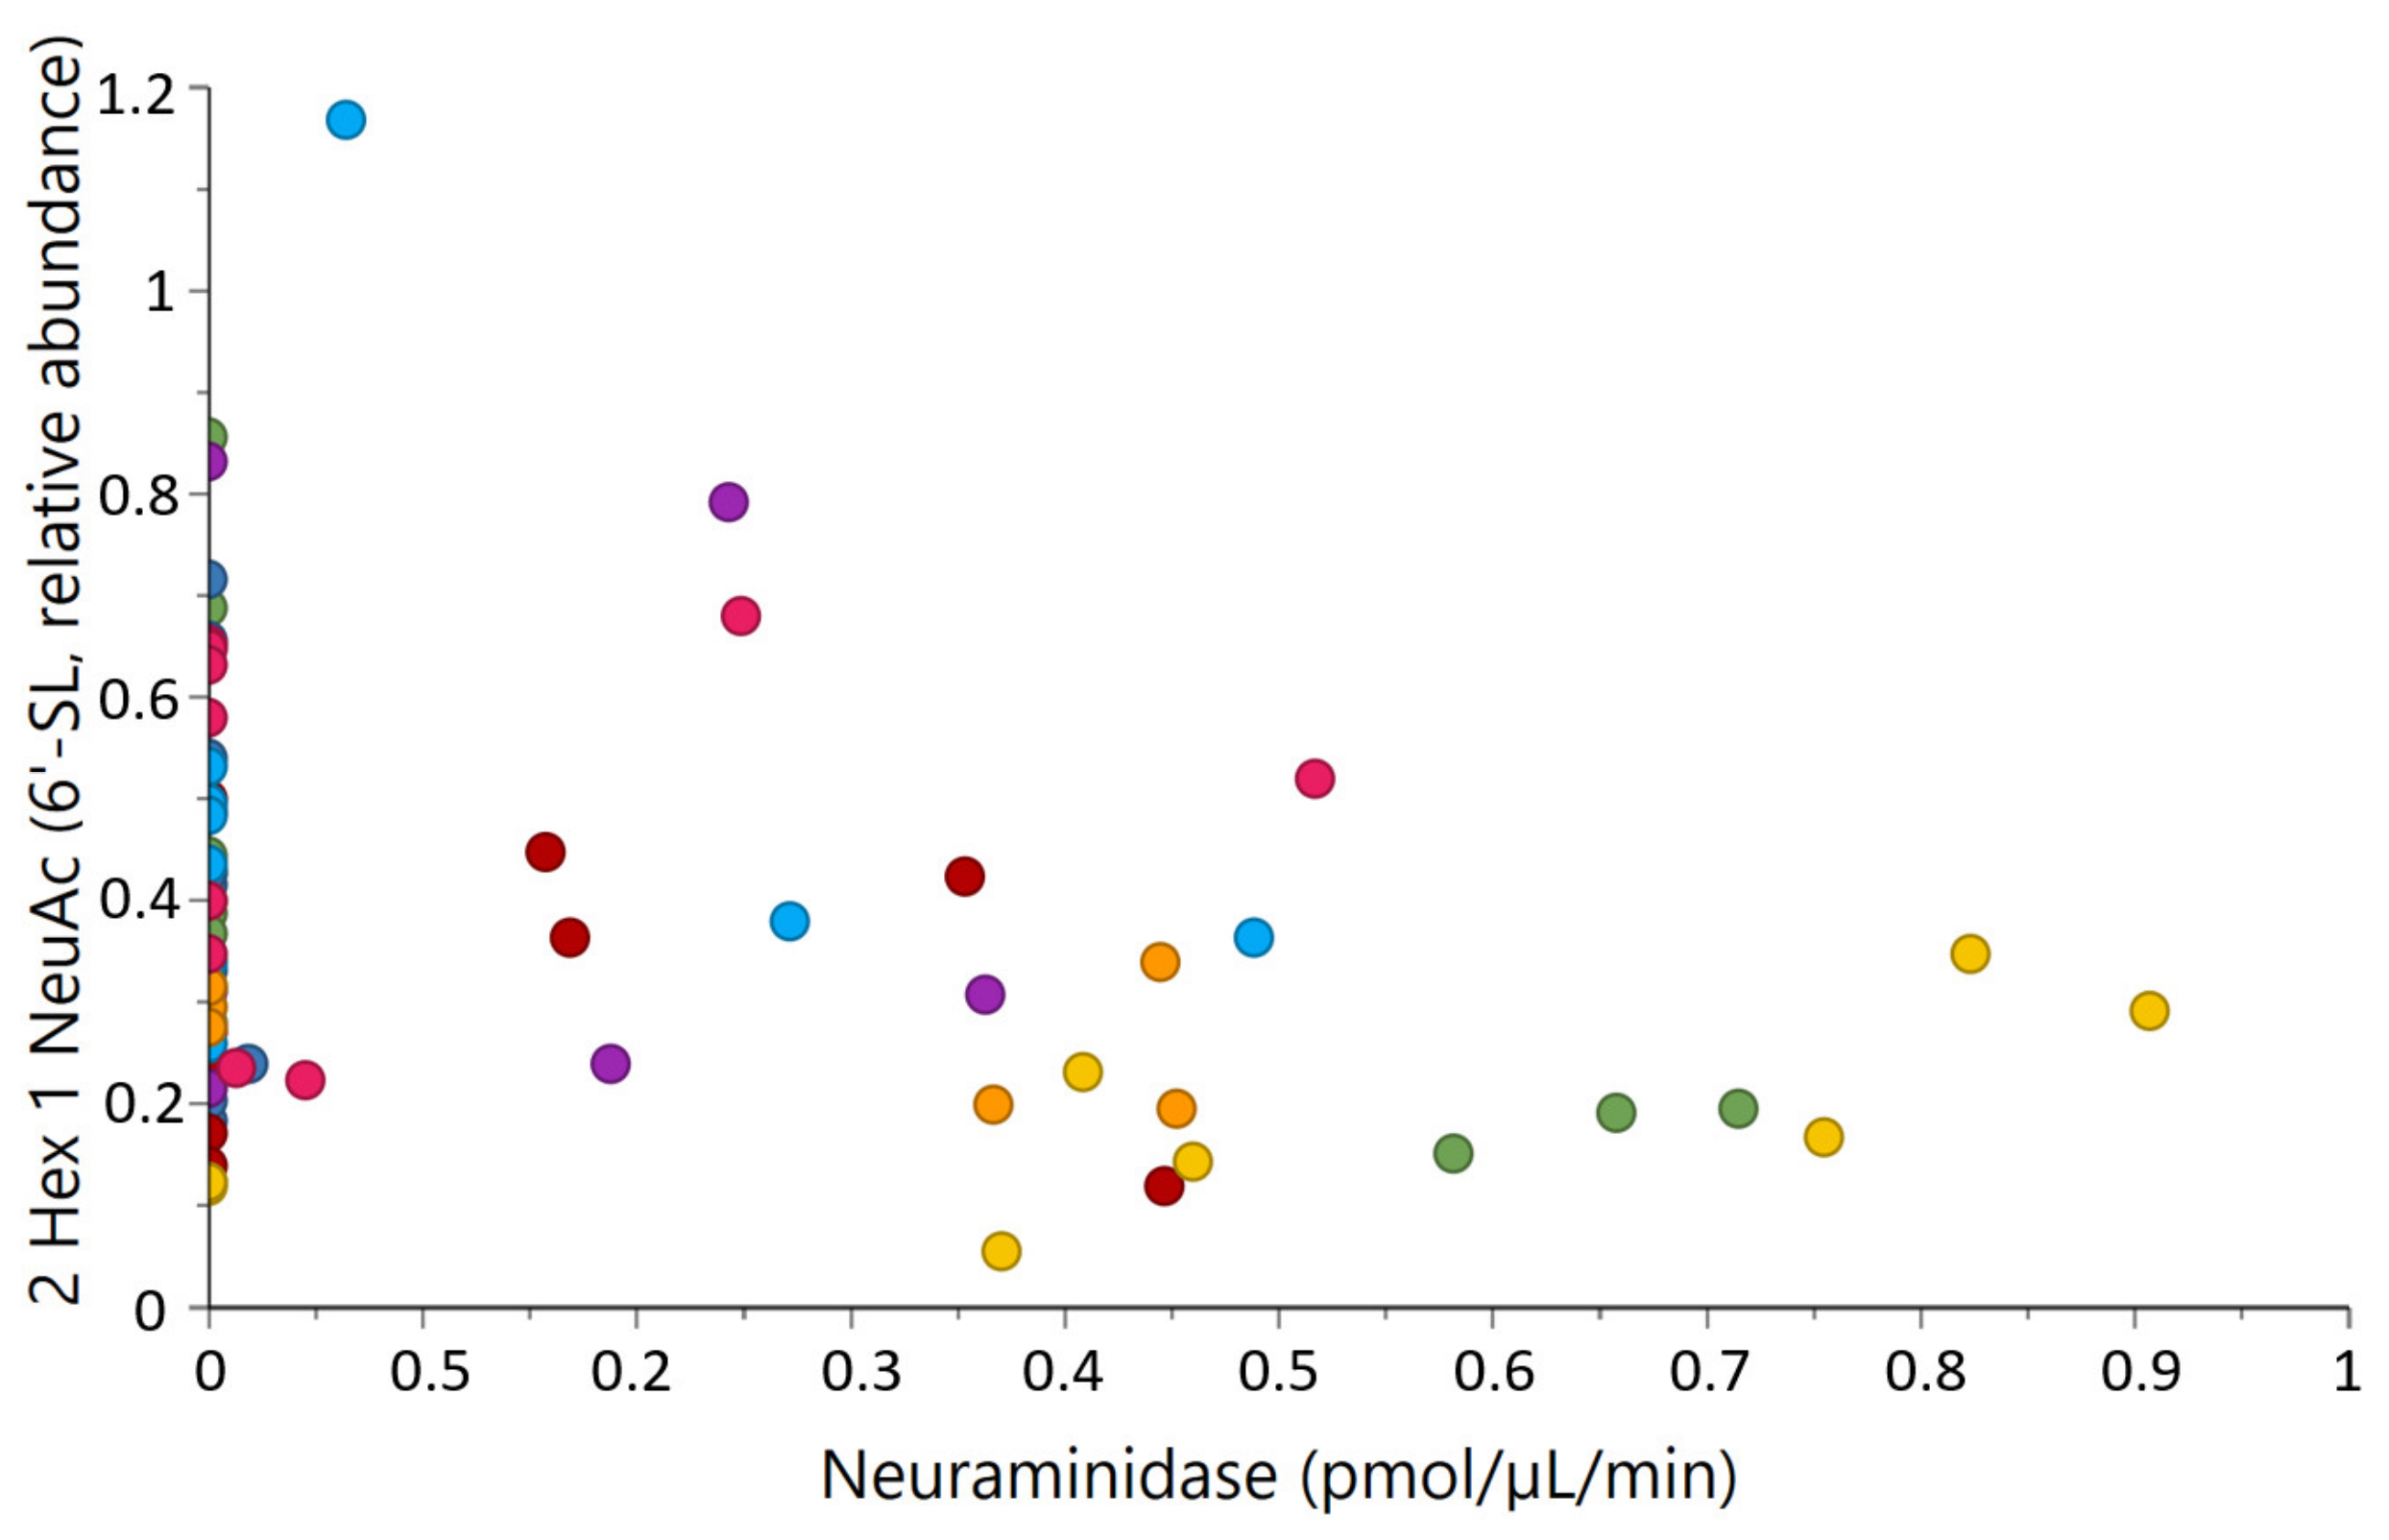
| N-acetyl-α-neuraminidase activity | 2 Hex 1 NeuAc (6′-SL) | −0.27 | 0.024 |
| β-galactosidase activity | Lactose | −0.30 | 0.007 |
| β-galactosidase activity | GMP (e, e, e) | −0.25 | 0.030 |
| α-fucosidase activity | Fucose | 0.37 | <0.001 |
| 2 Hex 2 NeuAc | GMP (c/d) | 0.36 | 0.001 |
| 3 Hex 1 NeuAc | GMP (c/d) | 0.33 | 0.001 |
Publisher’s Note: MDPI stays neutral with regard to jurisdictional claims in published maps and institutional affiliations. |
© 2021 by the authors. Licensee MDPI, Basel, Switzerland. This article is an open access article distributed under the terms and conditions of the Creative Commons Attribution (CC BY) license (https://creativecommons.org/licenses/by/4.0/).
Share and Cite
Sunds, A.V.; Roland, I.S.; Sundekilde, U.K.; Thesbjerg, M.N.; Robinson, R.; Bunyatratchata, A.; Glantz, M.; Paulsson, M.; Leskauskaite, D.; Pihlanto, A.; et al. Naturally Occurring Glycosidases in Milk from Native Cattle Breeds: Activity and Consequences on Free and Protein Bound-Glycans. Metabolites 2021, 11, 662. https://doi.org/10.3390/metabo11100662
Sunds AV, Roland IS, Sundekilde UK, Thesbjerg MN, Robinson R, Bunyatratchata A, Glantz M, Paulsson M, Leskauskaite D, Pihlanto A, et al. Naturally Occurring Glycosidases in Milk from Native Cattle Breeds: Activity and Consequences on Free and Protein Bound-Glycans. Metabolites. 2021; 11(10):662. https://doi.org/10.3390/metabo11100662
Chicago/Turabian StyleSunds, Anne Vuholm, Ida Schwartz Roland, Ulrik Kræmer Sundekilde, Martin Nørmark Thesbjerg, Randall Robinson, Apichaya Bunyatratchata, Maria Glantz, Marie Paulsson, Daiva Leskauskaite, Anne Pihlanto, and et al. 2021. "Naturally Occurring Glycosidases in Milk from Native Cattle Breeds: Activity and Consequences on Free and Protein Bound-Glycans" Metabolites 11, no. 10: 662. https://doi.org/10.3390/metabo11100662
APA StyleSunds, A. V., Roland, I. S., Sundekilde, U. K., Thesbjerg, M. N., Robinson, R., Bunyatratchata, A., Glantz, M., Paulsson, M., Leskauskaite, D., Pihlanto, A., Inglingstad, R., Devold, T. G., Vegarud, G. E., Birgisdottir, B. E., Gudjonsdottir, M., Barile, D., Larsen, L. B., & Poulsen, N. A. (2021). Naturally Occurring Glycosidases in Milk from Native Cattle Breeds: Activity and Consequences on Free and Protein Bound-Glycans. Metabolites, 11(10), 662. https://doi.org/10.3390/metabo11100662