Impact of Pre-Blood Collection Factors on Plasma Metabolomic Profiles

 ,
,  , , , ,
  , and
, and
Abstract
1. Introduction
2. Results
3. Discussion
4. Materials and Methods
Supplementary Materials
Author Contributions
Funding
Acknowledgments
Conflicts of Interest
References
- Zierer, J.; Jackson, M.A.; Kastenmuller, G.; Mangino, M.; Long, T.; Telenti, A.; Mohney, R.P.; Small, K.S.; Bell, J.T.; Steves, C.J.; et al. The fecal metabolome as a functional readout of the gut microbiome. Nat. Genet. 2018, 50, 790–795. [Google Scholar] [CrossRef] [PubMed]
- Klupczynska, A.; Derezinski, P.; Kokot, Z.J. Metabolomics in Medical, Sciences—Trends, Challenges and Perspectives. Acta Pol. Pharm. 2015, 72, 629–641. [Google Scholar] [PubMed]
- Aboud, O.A.; Weiss, R.H. New opportunities from the cancer metabolome. Clin. Chem. 2013, 59, 138–146. [Google Scholar] [CrossRef] [PubMed]
- Park, S.; Sadanala, K.C.; Kim, E.K. A Metabolomic, Approach to Understanding the Metabolic, Link between Obesity and Diabetes. Mol. Cells 2015, 38, 587–596. [Google Scholar] [CrossRef] [PubMed]
- Sancesario, G.M.; Bernardini, S.S. Alzheimer’s disease in the omics era. Clin. Biochem. 2018, 59, 9–16. [Google Scholar] [CrossRef]
- Patel, S.; Ahmed, S.S. Emerging field of metabolomics: Big promise for cancer biomarker identification and drug discovery. J. Pharm. Biomed. Anal. 2015, 107, 63–74. [Google Scholar] [CrossRef]
- Cacciatore, S.; Loda, M.M. Innovation in metabolomics to improve personalized healthcare. Ann. N. Y. Acad. Sci. 2015, 1346, 57–62. [Google Scholar] [CrossRef]
- Nambiar, P.R.; Gupta, R.R.; Misra, V.V. An “Omics” based survey of human colon cancer. Mutat. Res. 2010, 693, 3–18. [Google Scholar] [CrossRef]
- Beger, R.D.; Dunn, W.; Schmidt, M.A.; Gross, S.S.; Kirwan, J.A.; Cascante, M.; Brennan, L.; Wishart, D.S.; Oresic, M.; Hankemeier, T.; et al. Metabolomics enables precision medicine: “A White, Paper, Community, Perspective”. Metabolomics 2016, 12, 149. [Google Scholar] [CrossRef]
- Kirwan, J.A.; Brennan, L.; Broadhurst, D.; Fiehn, O.; Cascante, M.; Dunn, W.B.; Schmidt, M.A.; Velagapudi, V.V. Preanalytical, Processing and Biobanking, Procedures of Biological, Samples for Metabolomics, Research: A White, Paper, Community, Perspective (for “Precision, Medicine and Pharmacometabolomics, Task Group”—The Metabolomics Society, Initiative). Clin. Chem. 2018, 64, 1158–1182. [Google Scholar] [CrossRef]
- Van Roekel, E.H.; Loftfield, E.; Kelly, R.S.; Zeleznik, O.A.; Zanetti, K.A. Metabolomics in epidemiologic research: Challenges and opportunities for early-career epidemiologists. Metabolomics 2019, 15, 9. [Google Scholar] [CrossRef]
- Brauer, R.; Leichtle, A.B.; Fiedler, G.M.; Thiery, J.; Ceglarek, U.U. Preanalytical standardization of amino acid and acylcarnitine metabolite profiling in human blood using tandem mass spectrometry. Metabolomics 2011, 7, 344–352. [Google Scholar] [CrossRef]
- Yin, P.; Lehmann, R.; Xu, G.G. Effects of pre-analytical processes on blood samples used in metabolomics studies. Anal. Bioanal. Chem. 2015, 407, 4879–4892. [Google Scholar] [CrossRef]
- Kim, K.; Mall, C.; Taylor, S.L.; Hitchcock, S.; Zhang, C.; Wettersten, H.I.; Jones, A.D.; Chapman, A.; Weiss, R.H. Mealtime, temporal, and daily variability of the human urinary and plasma metabolomes in a tightly controlled environment. PLoS ONE 2014, 9, e86223. [Google Scholar] [CrossRef]
- Townsend, M.K.; Bao, Y.; Poole, E.M.; Bertrand, K.A.; Kraft, P.; Wolpin, B.M.; Clish, C.B.; Tworoger, S.S. Impact of Pre-analytic Blood, Sample Collection, Factors on Metabolomics. Cancer Epidemiol. Biomark. Prev. 2016, 25, 823–829. [Google Scholar] [CrossRef] [PubMed]
- Yin, P.; Peter, A.; Franken, H.; Zhao, X.; Neukamm, S.S.; Rosenbaum, L.; Lucio, M.; Zell, A.; Häring, H.U.; Xu, G.; et al. Preanalytical aspects and sample quality assessment in metabolomics studies of human blood. Clin. Chem. 2013, 59, 833–845. [Google Scholar] [CrossRef] [PubMed]
- Kamlage, B.; Maldonado, S.G.; Bethan, B.; Peter, E.; Schmitz, O.; Liebenberg, V.; Schatz, P.P. Quality markers addressing preanalytical variations of blood and plasma processing identified by broad and targeted metabolite profiling. Clin. Chem. 2014, 60, 399–412. [Google Scholar] [CrossRef] [PubMed]
- Lawton, K.A.; Berger, A.; Mitchell, M.; Milgram, K.E.; Evans, A.M.; Guo, L.; Hanson, R.W.; Kalhan, S.C.; Ryals, J.A.; Milburn, M.V. Analysis of the adult human plasma metabolome. Pharmacogenomics 2008, 9, 383–397. [Google Scholar] [CrossRef] [PubMed]
- Pitkanen, H.T.; Oja, S.S.; Kemppainen, K.; Seppa, J.M.; Mero, A.A. Serum amino acid concentrations in aging men and women. Amino Acids 2003, 24, 413–421. [Google Scholar] [CrossRef] [PubMed]
- Sampson, J.N.; Boca, S.M.; Shu, X.O.; Stolzenberg-Solomon, R.Z.; Matthews, C.E.; Hsing, A.W.; Tan, Y.T.; Ji, B.T.; Chow, W.H.; Cai, Q.; et al. Metabolomics in epidemiology: Sources of variability in metabolite measurements and implications. Cancer Epidemiol. Biomark. Prev. 2013, 22, 631–640. [Google Scholar] [CrossRef]
- Sales, S.; Graessler, J.; Ciucci, S.; Al-Atrib, R.; Vihervaara, T.; Schuhmann, K.; Kauhanen, D.; Sysi-Aho, M.; Bornstein, S.R.; Bickle, M.; et al. Gender, Contraceptives and Individual, Metabolic Predisposition, Shape a Healthy, Plasma Lipidome. Sci. Rep. 2016, 6, 27710. [Google Scholar] [CrossRef] [PubMed]
- Kuhl, J.; Moritz, T.; Wagner, H.; Stenlund, H.; Lundgren, K.; Båvenholm, P.; Efendic, S.; Norstedt, G.; Tollet Egnell, P.P. Metabolomics as a tool to evaluate exercise-induced improvements in insulin sensitivity. Metabolomics 2008, 4, 273–282. [Google Scholar] [CrossRef]
- Huffman, K.M.; Slentz, C.A.; Bateman, L.A.; Thompson, D.; Muehlbauer, M.J.; Bain, J.R.; Stevens, R.D.; Wenner, B.R.; Kraus, V.B.; Newgard, C.B.; et al. Exercise-induced changes in metabolic intermediates, hormones, and inflammatory markers associated with improvements in insulin sensitivity. Diabetes Care 2011, 34, 174–176. [Google Scholar] [CrossRef] [PubMed]
- Xiao, Q.; Moore, S.C.; Keadle, S.K.; Xiang, Y.B.; Zheng, W.; Peters, T.M.; Leitzmann, M.F.; Ji, B.T.; Sampson, J.N.; Shu, X.O.; et al. Objectively measured physical activity and plasma metabolomics in the Shanghai, Physical Activity, Study. Int. J. Epidemiol. 2016, 45, 1433–1444. [Google Scholar] [CrossRef] [PubMed]
- Valerio, D.F.; Berton, R.; Conceicao, M.S.; Canevarolo, R.R.; Chacon-Mikahil, M.P.T.; Cavaglieri, C.R.; Meirelles, G.V.; Zeri, A.C.; Libardi, C.A. Early metabolic response after resistance exercise with blood flow restriction in well-trained men: A metabolomics approach. Appl. Physiol. Nutr. Metab. 2018, 43, 240–246. [Google Scholar] [CrossRef] [PubMed]
- Montrose, D.C.; Zhou, X.K.; McNally, E.M.; Sue, E.; Yantiss, R.K.; Gross, S.S.; Leve, N.D.; Karoly, E.D.; Suen, C.S.; Ling, L.; et al. Celecoxib, Alters the Intestinal, Microbiota and Metabolome in Association with Reducing, Polyp Burden. Cancer Prev. Res. 2016, 9, 721–731. [Google Scholar] [CrossRef]
- Cross, A.J.; Boca, S.; Freedman, N.D.; Caporaso, N.E.; Huang, W.Y.; Sinha, R.; Sampson, J.N.; Moore, S.C. Metabolites of tobacco smoking and colorectal cancer risk. Carcinogenesis 2014, 35, 1516–1522. [Google Scholar] [CrossRef]
- Ren, X.; Zhang, J.; Fu, X.; Ma, S.; Wang, C.; Wang, J.; Tian, S.; Liu, S.; Zhao, B.; Wang, X.X. LC-MS based metabolomics identification of novel biomarkers of tobacco smoke-induced chronic bronchitis. Biomed. Chromatogr. BMC 2016, 30, 68–74. [Google Scholar] [CrossRef]
- Chenoweth, M.J.; Novalen, M.; Hawk, L.W., Jr.; Schnoll, R.A.; George, T.P.; Cinciripini, P.M.; Lerman, C.; Tyndale, R.F. Known and novel sources of variability in the nicotine metabolite ratio in a large sample of treatment-seeking smokers. Cancer Epidemiol. Biomark. Prev. 2014, 23, 1773–1782. [Google Scholar] [CrossRef]
- Hu, Q.; Wei, J.; Liu, Y.; Fei, X.; Hao, Y.; Pei, D.; Di, D.D. Discovery and identification of potential biomarkers for alcohol-induced oxidative stress based on cellular metabolomics. Biomed. Chromatogr. BMC 2017, 31, e3907. [Google Scholar] [CrossRef]
- Harada, S.; Takebayashi, T.; Kurihara, A.; Akiyama, M.; Suzuki, A.; Hatakeyama, Y.; Sugiyama, D.; Kuwabara, K.; Takeuchi, A.; Okamura, T.; et al. Metabolomic profiling reveals novel biomarkers of alcohol intake and alcohol-induced liver injury in community-dwelling men. Environ. Health Prev. Med. 2016, 21, 18–26. [Google Scholar] [CrossRef] [PubMed]
- Playdon, M.C.; Ziegler, R.G.; Sampson, J.N.; Stolzenberg-Solomon, R.; Thompson, H.J.; Irwin, M.L.; Mayne, S.T.; Hoover, R.N.; Moore, S.C. Nutritional metabolomics and breast cancer risk in a prospective study. Am. J. Clin. Nutr. 2017, 106, 637–649. [Google Scholar] [CrossRef] [PubMed]
- Irwin, C.; van Reenen, M.; Mason, S.; Mienie, L.J.; Wevers, R.A.; Westerhuis, J.A.; Reinecke, C.J. The 1H-NMR-based metabolite profile of acute alcohol consumption: A metabolomics intervention study. PLoS ONE 2018, 13, e0196850. [Google Scholar] [CrossRef] [PubMed]
- Ulrich, C.M.; Gigic, B.; Bohm, J.; Ose, J.; Viskochil, R.; Schneider, M.; Colditz, G.A.; Figueiredo, J.C.; Grady, W.M.; Li, C.I.; et al. The ColoCare, Study: A Paradigm of Transdisciplinary, Science in Colorectal, Cancer Outcomes. Cancer Epidemiol. Biomark. Prev. 2019, 28, 591–601. [Google Scholar] [CrossRef] [PubMed]
- Siskos, A.P.; Jain, P.; Romisch-Margl, W.; Bennett, M.; Achaintre, D.; Asad, Y.; Marney, L.; Richardson, L.; Koulman, A.; Griffin, J.L.; et al. Interlaboratory, Reproducibility of a Targeted, Metabolomics Platform for Analysis of Human, Serum and Plasma. Anal. Chem. 2017, 89, 656–665. [Google Scholar] [CrossRef] [PubMed]
- Carayol, M.; Licaj, I.; Achaintre, D.; Sacerdote, C.; Vineis, P.; Key, T.J.; Onland Moret, N.C.; Scalbert, A.; Rinaldi, S.; Ferrari, P.P. Reliability of Serum, Metabolites over a Two-Year, Period: A Targeted, Metabolomic Approach in Fasting and Non-Fasting, Samples from EPIC. PLoS ONE 2015, 10, e0135437. [Google Scholar] [CrossRef]
- Geijsen, A.; Brezina, S.; Keski-Rahkonen, P.; Baierl, A.; Bachleitner-Hofmann, T.; Bergmann, M.M.; Boehm, J.; Brenner, H.; Chang-Claude, J.; van Duijnhoven, F.J.B.; et al. Plasma metabolites associated with colorectal cancer: A discovery-replication strategy. Int. J. Cancer 2019, 145, 1221–1231. [Google Scholar] [CrossRef]
- Holowatyj, A.N.; Gigic, B.; Herpel, E.; Scalbert, A.; Schneider, M.; Ulrich, C.M. Distinct, Molecular Phenotype of Sporadic, Colorectal Cancers, Among Young, Patients Based on Multiomics, Analysis. Gastroenterology 2020, 158, 1155–1158. [Google Scholar] [CrossRef]
- Hochberg, Y.; Benjamini, Y.Y. More powerful procedures for multiple significance testing. Stat. Med. 1990, 9, 811–818. [Google Scholar] [CrossRef]


| Characteristics | Participants (n = 108) |
|---|---|
| Age, mean ± SD | 51.6 ± 14.7 |
| Sex | |
| Female, n (%) | 69 (63.9) |
| Male, n (%) | 39 (36.1) |
| BMI kg/m2 (mean ± SD) | 24.4 ± 4.8 |
| Pre-blood collection exposures (yes/no), n (%) | |
| Physical Activity in the last 12 h | 20 (18.5) |
| NSAID use in the last 24 h | 10 (9.3) |
| Tobacco use in the last 24 h | 14 (13.0) |
| Alcohol use in the last 48 h | 53 (49.1) |
| Fasting state at blood draw (h), n (%) a | |
| <1 | 35 (32.4) |
| ≥ 1 to < 2 | 33 (30.6) |
| ≥ 2 to < 3 | 16 (14.8) |
| 3 or more | 20 (18.5) |
| Date of blood draw, n (%) | |
| Season | |
| Spring (March–May) | 16 (14.8) |
| Summer (June–August) | 13 (12.0) |
| Fall (September–November) | 62 (57.4) |
| Winter (December–February) | 17 (15.7) |
| Sun Exposure | |
| High Sun (May–October) | 56 (51.9) |
| Low Sun (November–April) | 52 (48.1) |
| Time of blood draw, n (%) | |
| Morning (7–10 am) | 40 (37.0) |
| Mid-Day (10 am–1 pm) | 41 (38.0) |
| Afternoon (1–4 pm) | 27 (25.0) |
| Metabolite Categories | ||||||
|---|---|---|---|---|---|---|
| Acylcarnitines | AA and Biogenic Amines | Sphingolipids | Glycerophospholipids | Hexoses | ||
| (n = 13) | (n = 28) | (n = 14) | (n = 77) | (n = 1) | ||
| Characteristic | n (%) | % difference in median (10th, 90th percentile) | % difference | |||
| Sex | ||||||
| Male | 39 (36.1%) | Ref | Ref | Ref | Ref | Ref |
| Female | 69 (63.9%) | −6.0 (−9.6, 1.8) | 0.8 (−2.7, 6.7) | −3.2 (−9.7, 4.1) | −1.2 (−12.0, 12.7) | −1.3 |
| Age | ||||||
| Below median | 55 (50.9%) | Ref | Ref | Ref | Ref | Ref |
| Above median | 53 (49.1%) | 6.3 (−1.8, 10.4) | −2.7 (−6.1, −0.1) | −3.8 (−8.5, 7.2) | −2.7 (−16.9, 4.9) | −1.3 |
| Metabolite Categories | ||||||
|---|---|---|---|---|---|---|
| Acylcarnitines | AA and Biogenic Amines | Sphingolipids | Glycerophospholipids | Hexoses | ||
| (n = 13) | (n = 28) | (n = 14) | (n = 77) | (n = 1) | ||
| Pre-blood Collection Factors | n (%) | % difference median (10th, 90th percentile) | % difference | |||
| Season of Blood Collection | ||||||
| Low Sun Months (November–April) | 52 (48.1%) | Ref | Ref | Ref | Ref | Ref |
| High-Sun Months (May–October) | 56 (51.9%) | 2.7 (0.6, 5.7) | 0.3, (−2.4, 2.0) | 0.4 (−2.7, 2.2) | 0.5 (−2.1, 8.0) | −1.1 |
| Winter (December–February) | 17 (15.7%) | Ref | Ref | Ref | Ref | Ref |
| Spring (March–May) | 16 (14.8%) | 2.1 (−9.8, 7.3) | 1.6 (−1.8, 2.0) | 1.2 (−4.6, 5.0) | 1.7 (−9.9, 11.7) | −1.9 |
| Summer (June–August) | 13 (12.0%) | −4.7 (−15.8, 3.6) | 0.2 (−1.9, 2.0) | 1.9 (−0.1, 2.7) | 2.9 (−6.2, 16.9) | −0.1 |
| Fall (September–November) | 62 (57.4%) | 1.8 (−2.8, 3.2) | −0.3 (−2.3, 2.0) | 1.1 (−3.4, 6.1) | 0.4 (−9.1, 7.6) | −2.1 |
| Time of Day of Blood Collection | ||||||
| Morning (7–10 am) | 40 (37.0%) | Ref | Ref | Ref | Ref | Ref |
| Midday (10 am–1 pm) | 41 (38.0%) | 0.6 (−2.0, 2.6) | −0.7 (−3.6, 1.1) | −0.2 (−1.7, 1.4) | −1.3 (−5.4, 2.2) | −0.2 |
| Afternoon (1–4 pm) | 27 (25.0%) | 3.5 (−6.1, 8.3) | 1.1 (−2.1, 3.0) | −0.4 (−2.4, 2.5) | −1.2 (−8.7, 3.3) | 0.5 |
| Fasting at Blood Collection (h) a | ||||||
| 3 or more | 20 (18.5%) | Ref | Ref | Ref | Ref | Ref |
| ≥ 2 to < 3 | 16 (14.8%) | 2.6 (−3.3, 8.1) | −1.0 (−3.9, 2.0) | −0.8 (−4.1, 3.4) | −2.7 (−19.2, 16.4) | 0.3 |
| ≥ 1 to < 2 | 33 (30.6%) | 1.5 (−8.2, 4.1) | −0.5 (−4.4, 2.0) | −1.5 (−5.7, 6.1) | 0.6 (−7.5, 5.9) | 0.0 |
| <1 | 35 (32.4%) | 1.2 (−1.8, 7.2) | −0.2 (−2.3, 2.0) | 0.6 (−2.5, 3.2) | 0.5 (−2.7, 3.8) | 0.8 |
| Modifiable exposures at Blood Collection | ||||||
| No NSAID Use (<24 h) | 98 (90.7%) | Ref | Ref | Ref | Ref | Ref |
| NSAID Use (<24 h) | 10 (9.3%) | 1.7 (−5.9, 7.5) | 1.7 (−1.0, 6.1) | −3.0 (−5.0, −0.4) | −1.6 (−10.1,11.2) | 2.0 |
| No Tobacco Use (<24 h) | 94 (87.0%) | Ref | Ref | Ref | Ref | Ref |
| Tobacco Use (<24 h) | 14 (13.0%) | 2.5 (−0.9, 5.7) | −0.1 (−2.5, 7.6) | −0.7 (−3.1, 2.8) | −0.5 (−7.0, 6.7) | −0.2 |
| No Physical Activity (<12 h) | 88 (81.5%) | Ref | Ref | Ref | Ref | Ref |
| Physical Activity (<12 h) | 20 (18.5%) | −3.2 (−7.6, 2.3) | −0.1 (−2.6, 1.5) | −1.9 (−5.9, 4.0) | −2.7 (−10.7, 1.3) | −0.4 |
| No Alcohol Use (<48 h) | 55 (50.9%) | Ref | Ref | Ref | Ref | Ref |
| Alcohol Use (<48 h) | 53 (49.1%) | −0.1 (−2.1, 5.4) | −0.7 (−2.2, 1.8) | −0.2 (−4.1, 5.3) | 1.4 (−4.9, 12.5) | −0.4 |
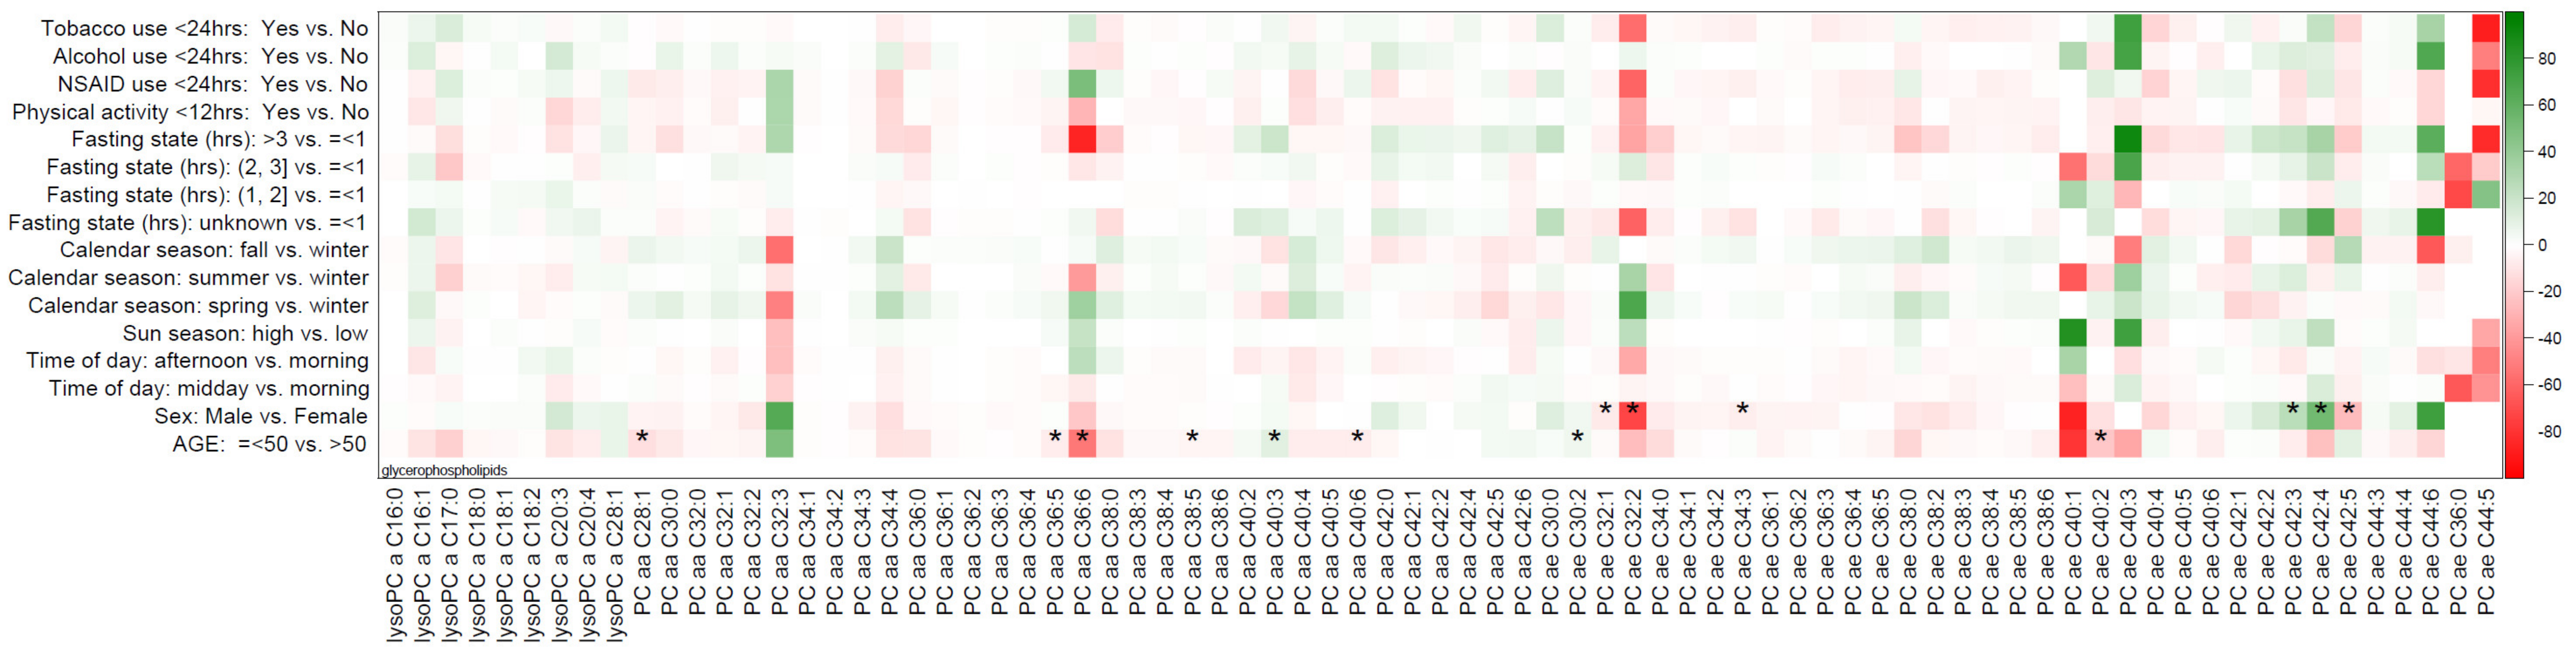
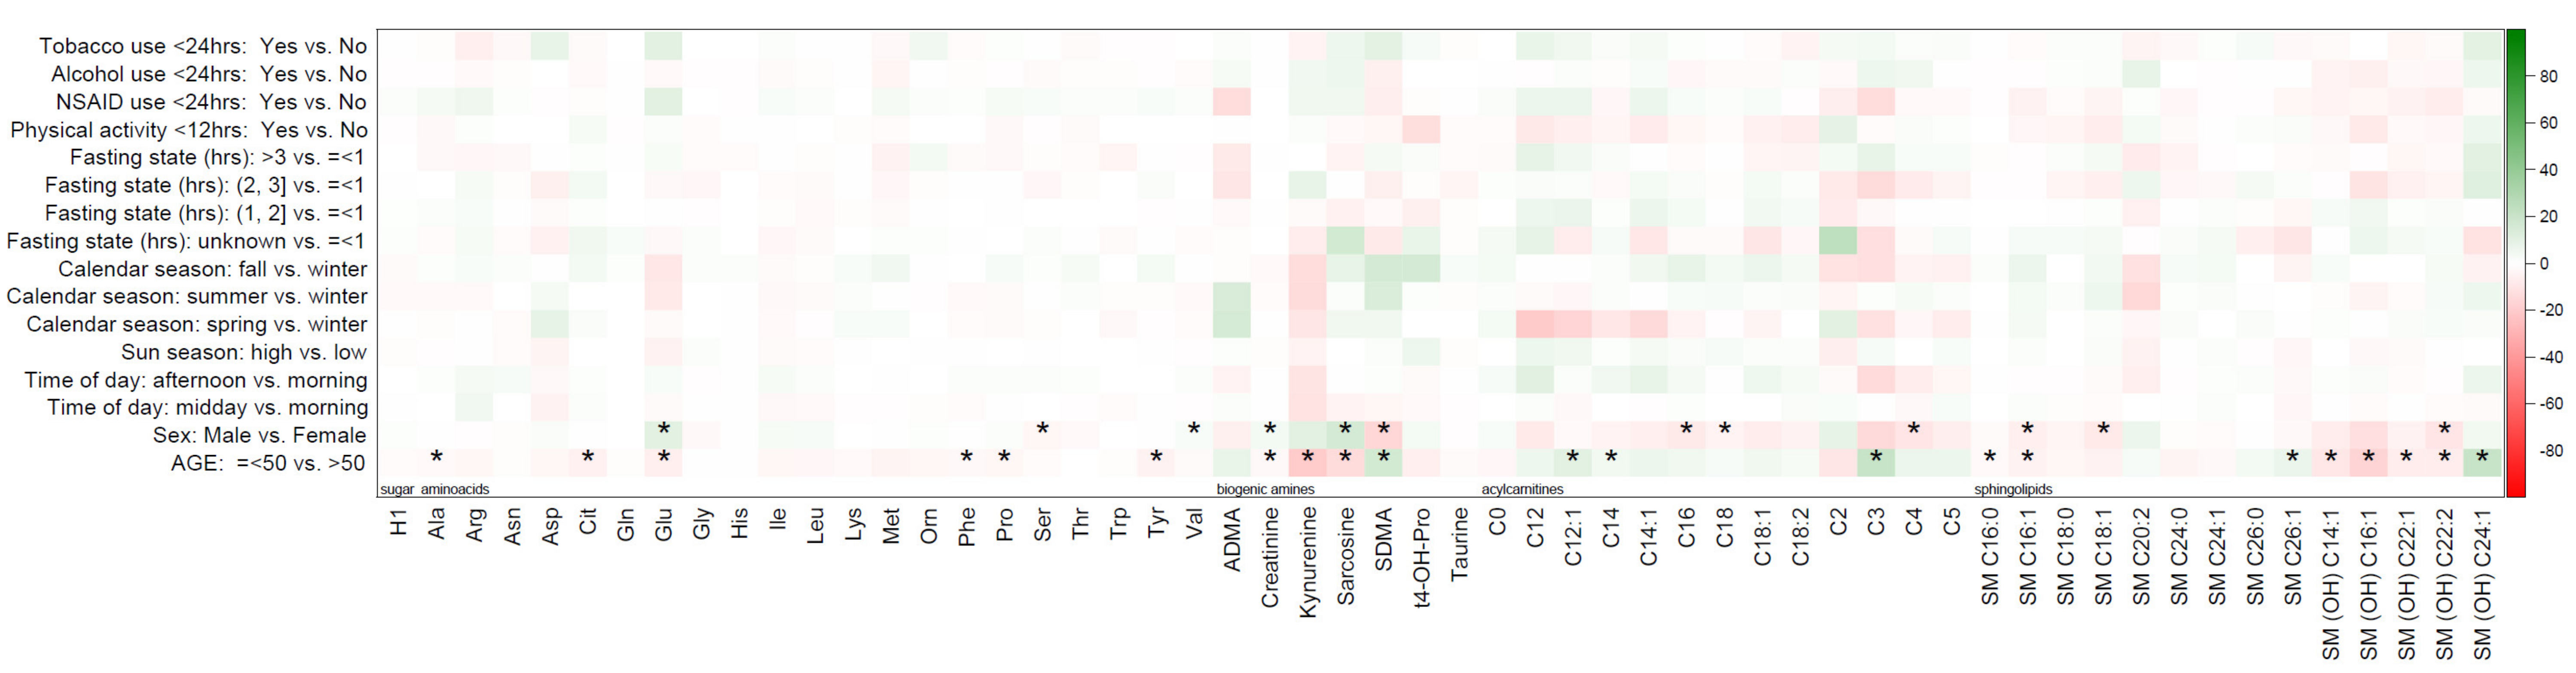
| Comparison Groups | Acylcarnitines | AA and Amines | Sphingolipids | Glycerophospholipids | Hexoses |
|---|---|---|---|---|---|
| (n = 13) | (n = 28) | (n = 14) | (n = 77) | (n = 1) | |
| Sex (male vs female), n (%) | 3 (23.1%) | 6 (21.4%) | 3 (21.4%) | 7 (9.1%) | 0 |
| Age (above vs below median), n (%) | 3 (23.1%) | 10 (35.7%) | 8 (57.1%) | 8 (10.39%) | 0 |
| Pre-Collection Factors b | 0 | 0 | 0 | 0 | 0 |
© 2020 by the authors. Licensee MDPI, Basel, Switzerland. This article is an open access article distributed under the terms and conditions of the Creative Commons Attribution (CC BY) license (http://creativecommons.org/licenses/by/4.0/).
Share and Cite
Hardikar, S.; Albrechtsen, R.D.; Achaintre, D.; Lin, T.; Pauleck, S.; Playdon, M.; Holowatyj, A.N.; Gigic, B.; Schrotz-King, P.; Boehm, J.; et al. Impact of Pre-Blood Collection Factors on Plasma Metabolomic Profiles. Metabolites 2020, 10, 213. https://doi.org/10.3390/metabo10050213
Hardikar S, Albrechtsen RD, Achaintre D, Lin T, Pauleck S, Playdon M, Holowatyj AN, Gigic B, Schrotz-King P, Boehm J, et al. Impact of Pre-Blood Collection Factors on Plasma Metabolomic Profiles. Metabolites. 2020; 10(5):213. https://doi.org/10.3390/metabo10050213
Chicago/Turabian StyleHardikar, Sheetal, Richard D. Albrechtsen, David Achaintre, Tengda Lin, Svenja Pauleck, Mary Playdon, Andreana N. Holowatyj, Biljana Gigic, Petra Schrotz-King, Juergen Boehm, and et al. 2020. "Impact of Pre-Blood Collection Factors on Plasma Metabolomic Profiles" Metabolites 10, no. 5: 213. https://doi.org/10.3390/metabo10050213
APA StyleHardikar, S., Albrechtsen, R. D., Achaintre, D., Lin, T., Pauleck, S., Playdon, M., Holowatyj, A. N., Gigic, B., Schrotz-King, P., Boehm, J., Habermann, N., Brezina, S., Gsur, A., van Roekel, E. H., Weijenberg, M. P., Keski-Rahkonen, P., Scalbert, A., Ose, J., & Ulrich, C. M. (2020). Impact of Pre-Blood Collection Factors on Plasma Metabolomic Profiles. Metabolites, 10(5), 213. https://doi.org/10.3390/metabo10050213