Developmental Signatures of Microbiota-Derived Metabolites in the Mouse Brain


Abstract

1. Introduction
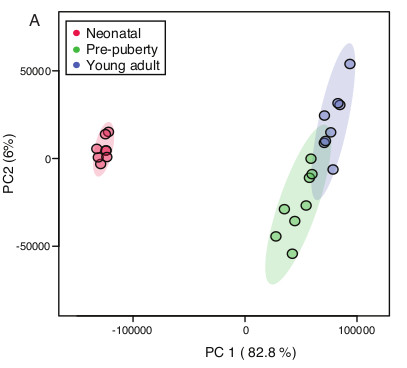
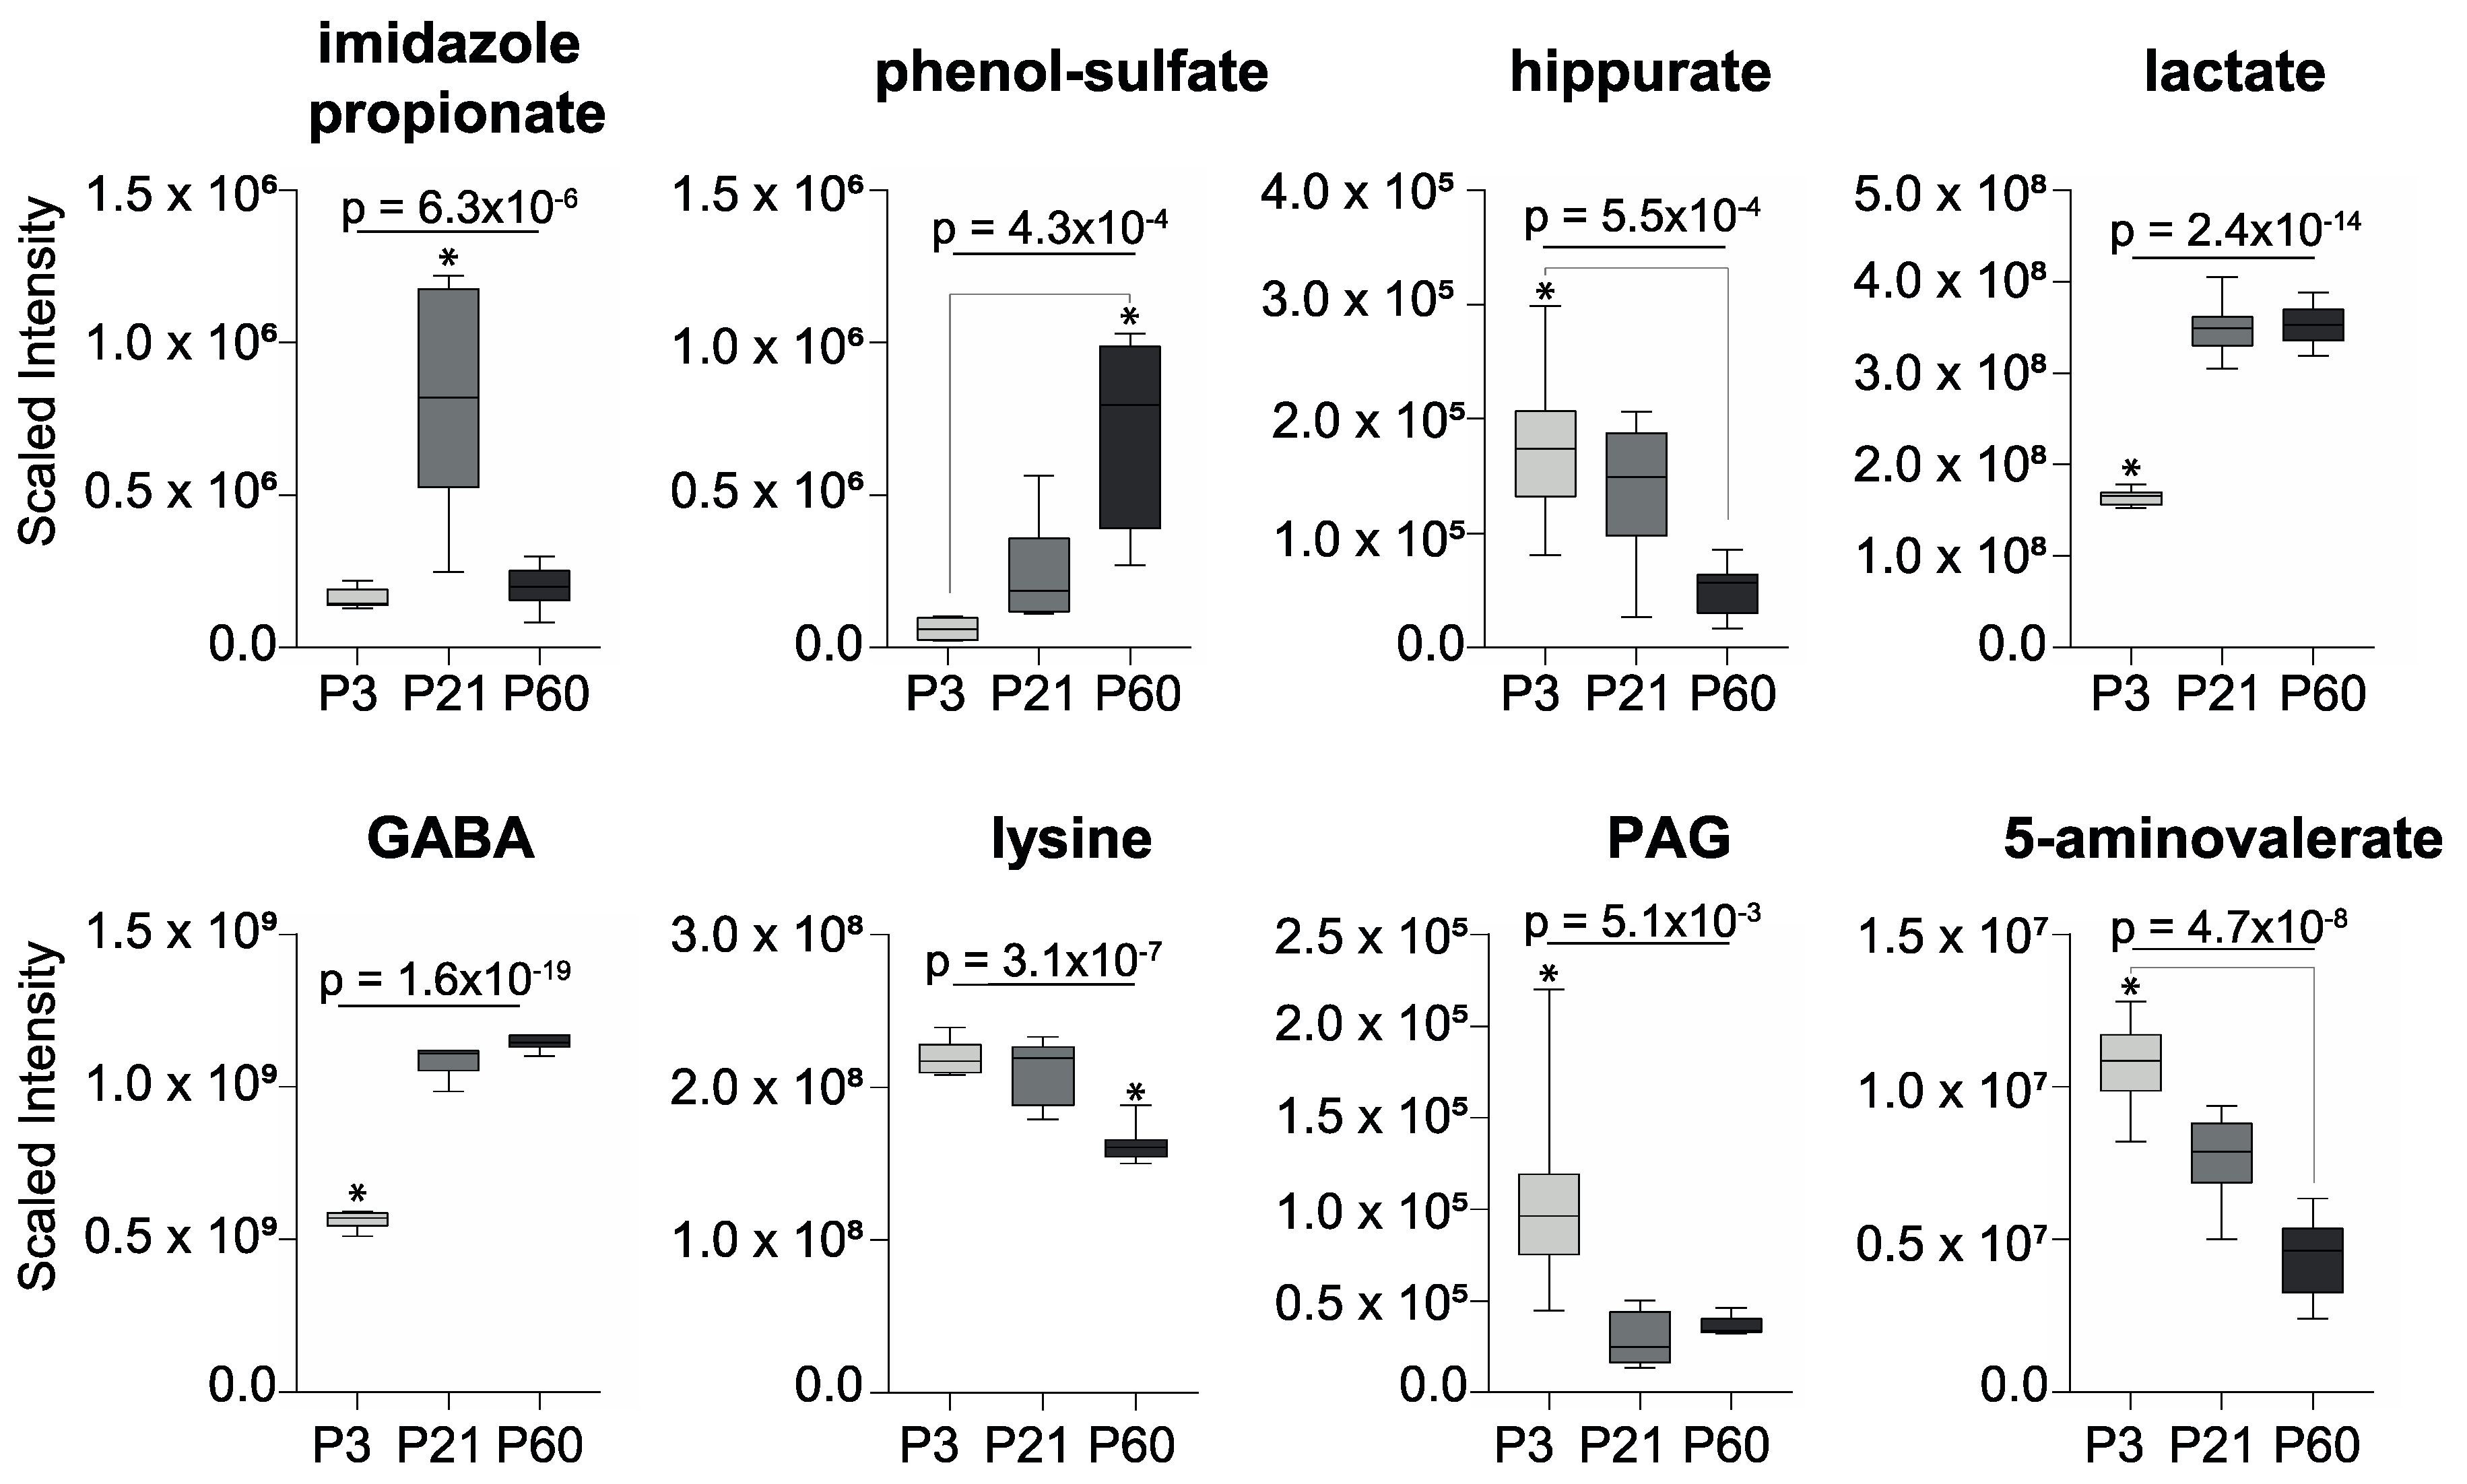
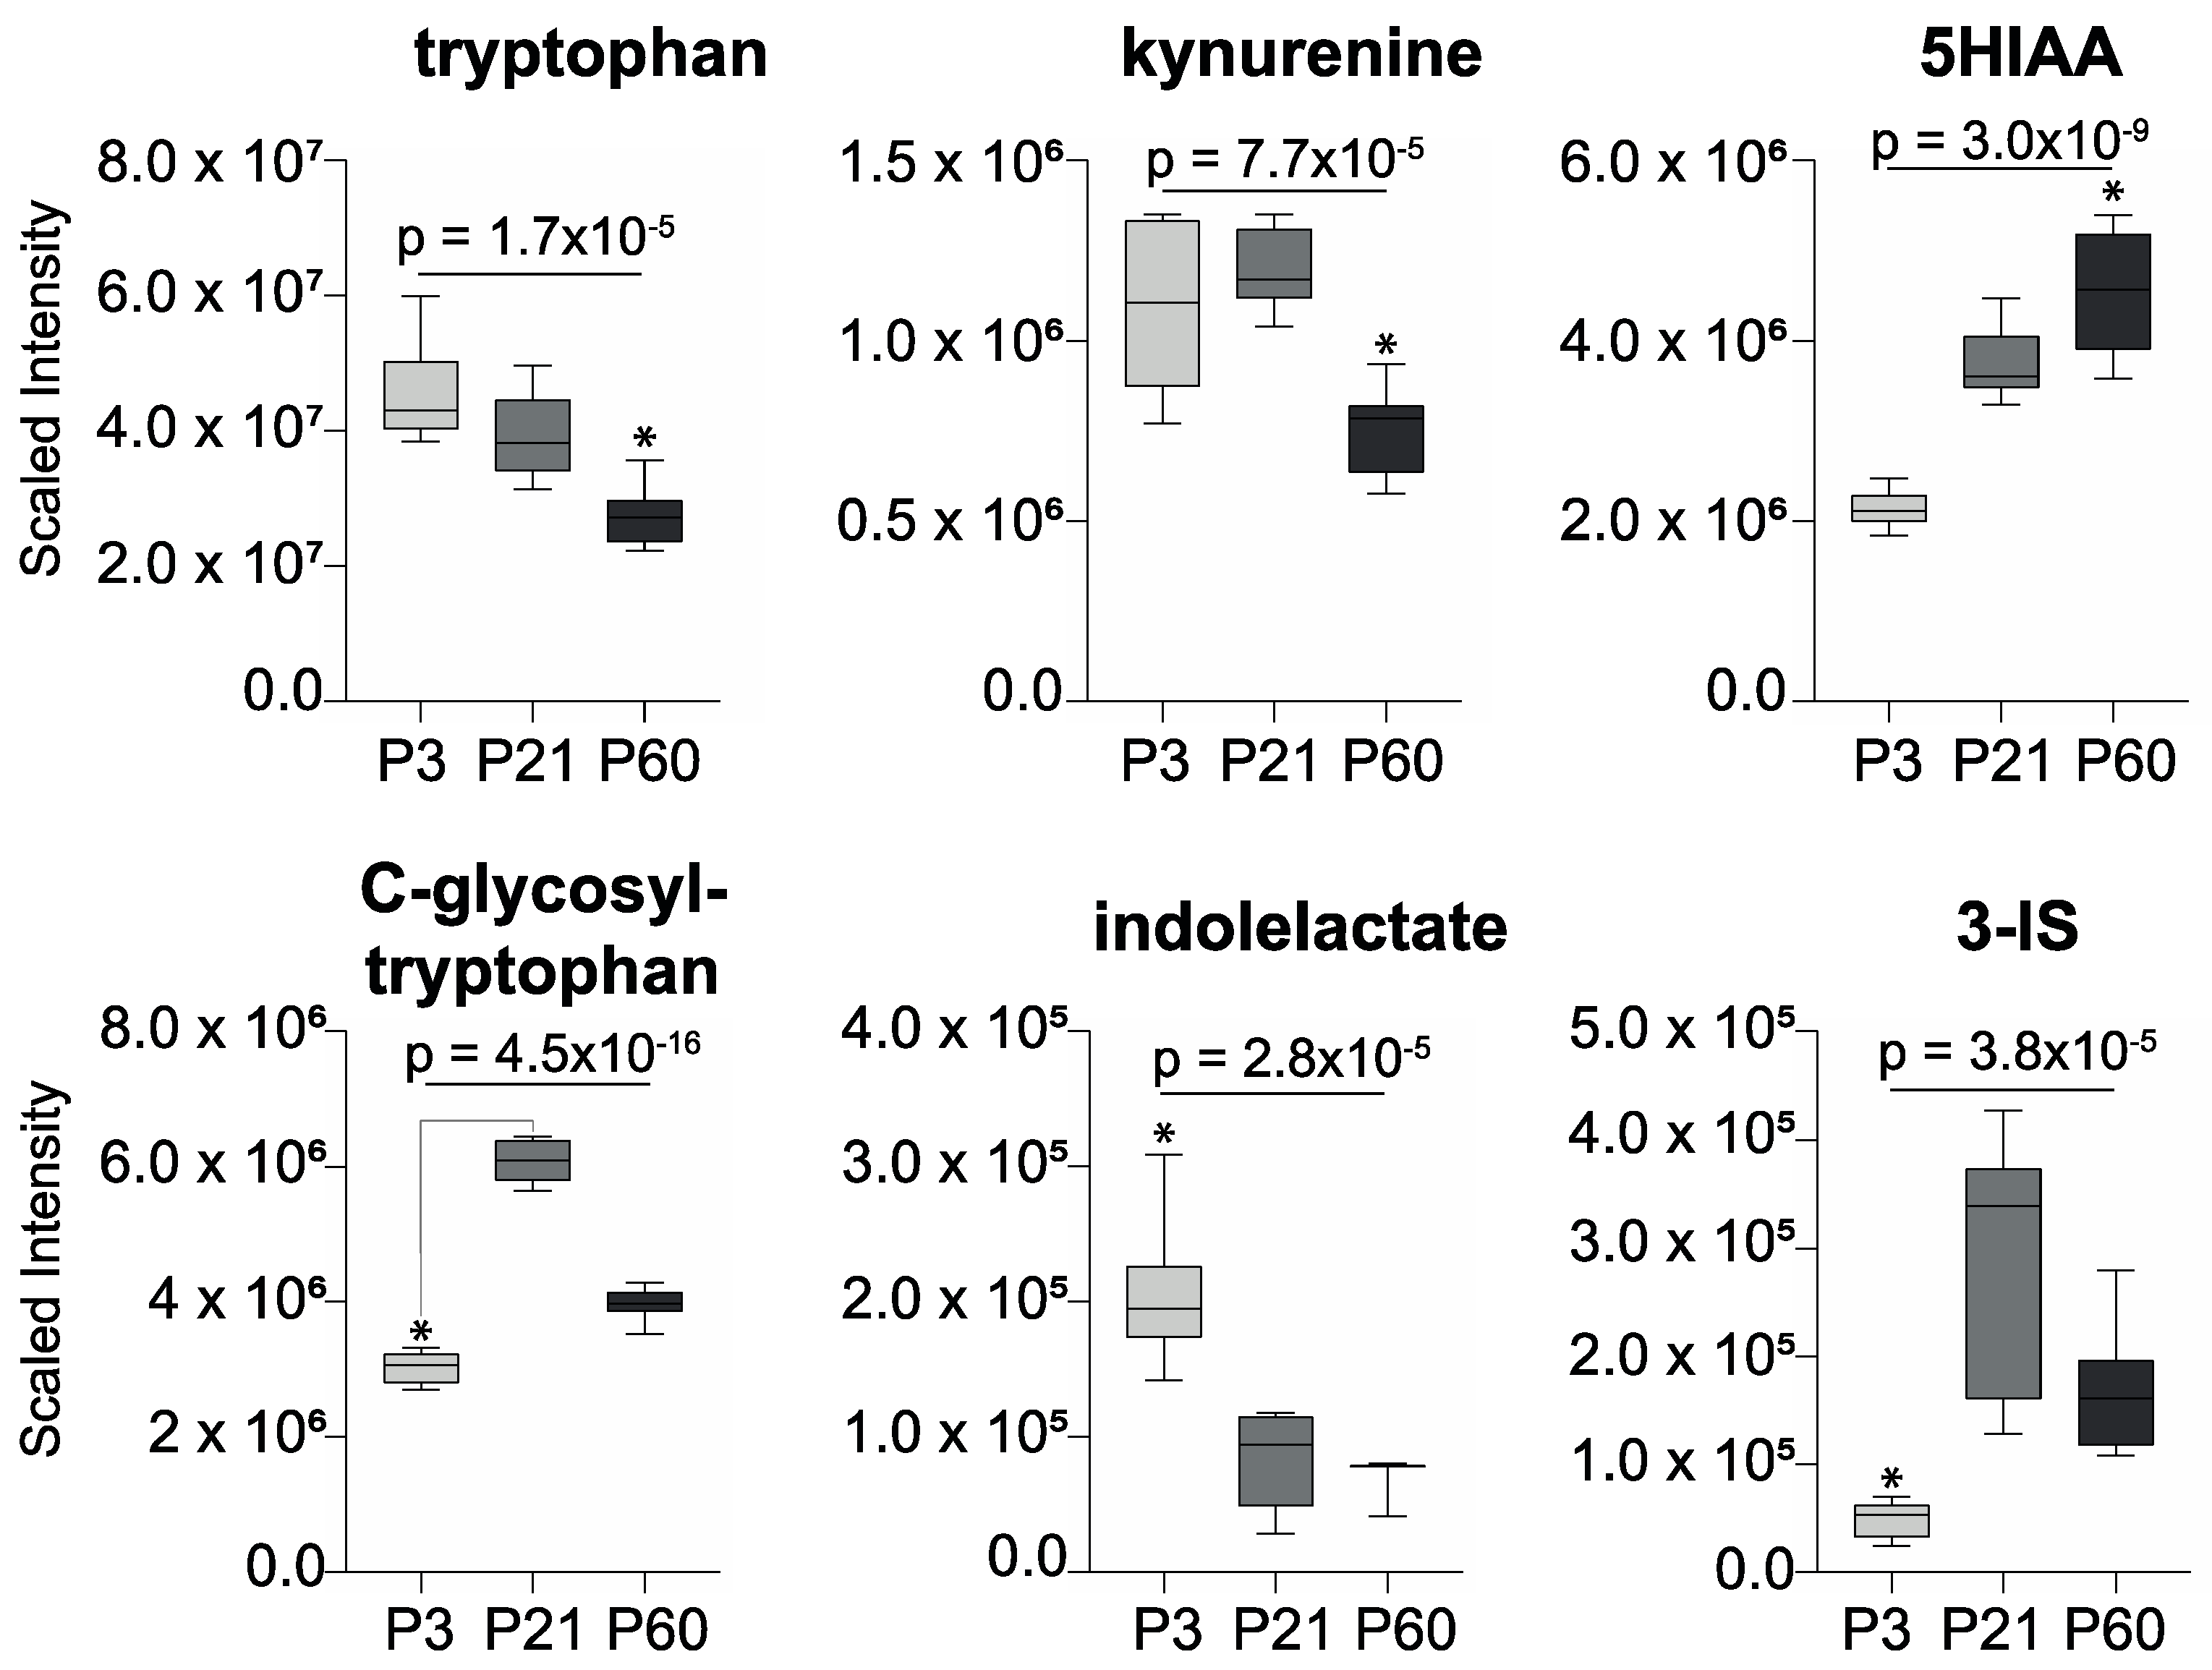
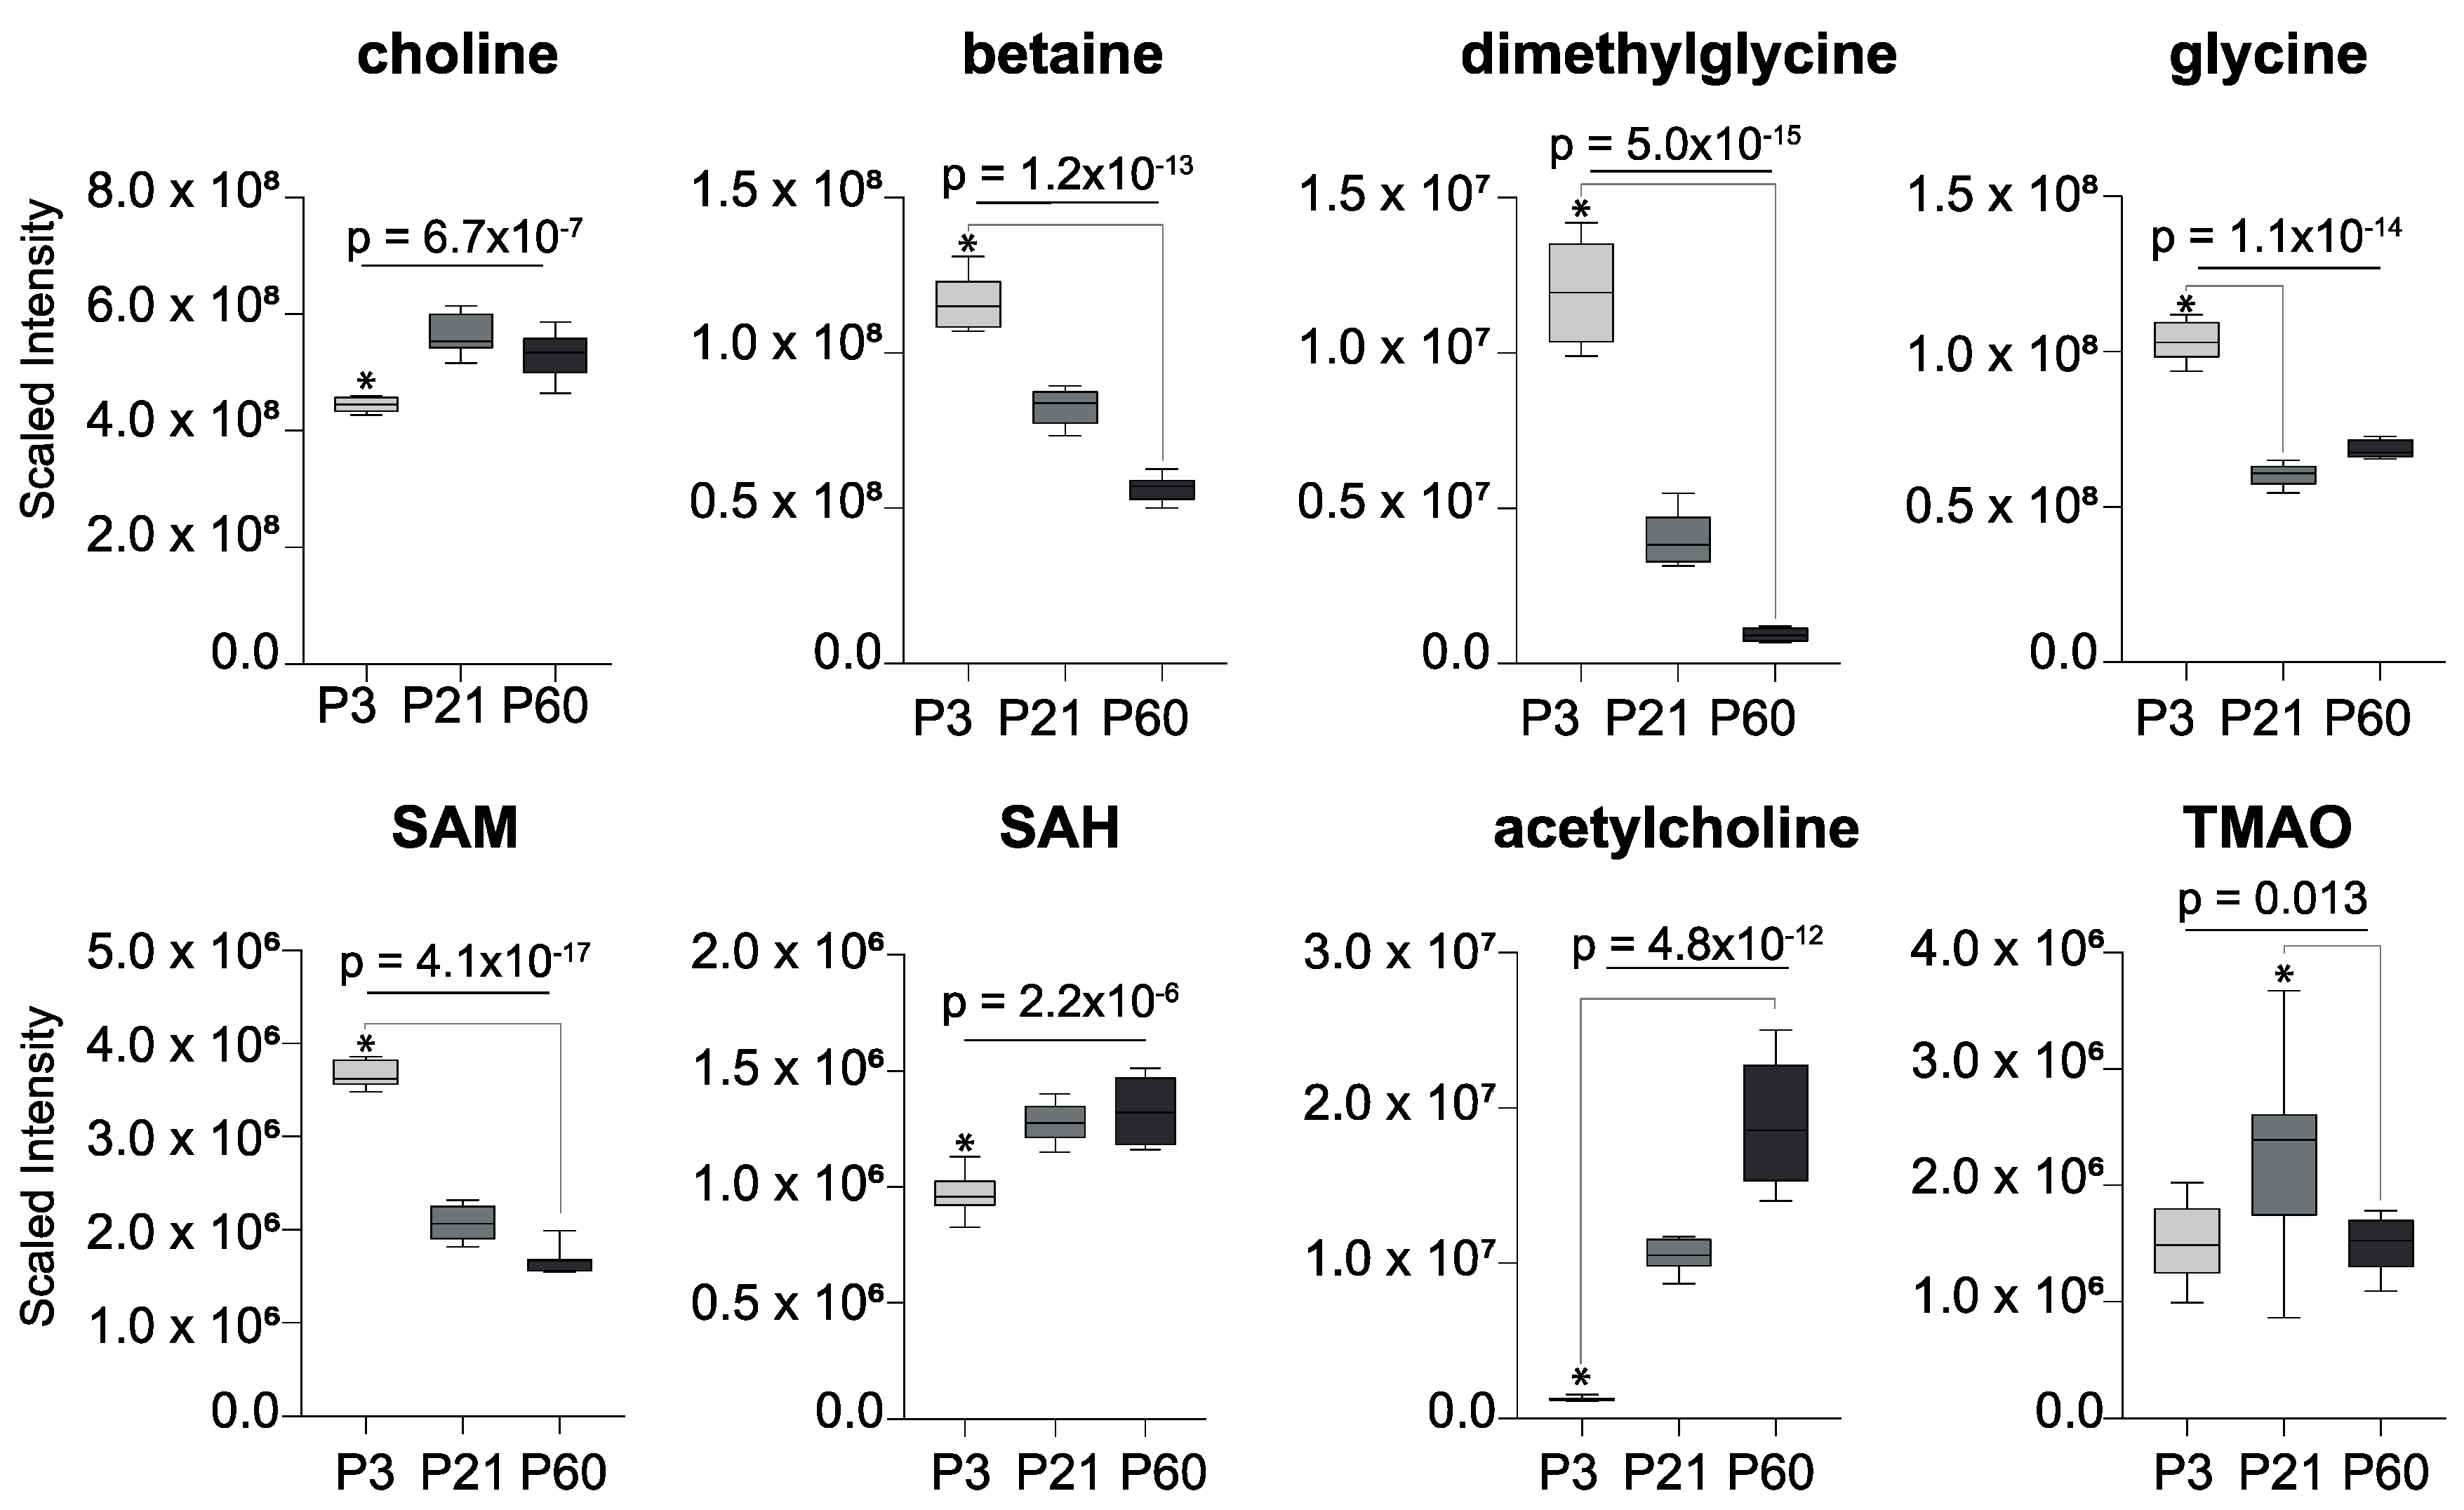
2. Results
3. Discussion
4. Materials and Methods
Animals and Sample Collection
Liquid Chromatography–Mass Spectrometry-Based Metabolic Phenotyping
Data Analysis
Supplementary Materials
Author Contributions
Funding
Acknowledgments
Conflicts of Interest
References
- Qin, J.; Li, R.; Raes, J.; Arumugam, M.; Burgdorf, K.; Manichanh, C.; Nielsen, T.S.; Pons, N.; Levenez, F.; Yamada, T.; et al. A human gut microbial gene catalogue established by metagenomic sequencing. Nature 2010, 464, 59–65. [Google Scholar] [CrossRef]
- Tierney, B.T.; Yang, Z.; Luber, J.M.; Beaudin, M.; Wibowo, M.C.; Baek, C.; Mehlenbacher, E.; Patel, C.J.; Kostic, A.D. The Landscape of Genetic Content in the Gut and Oral Human Microbiome. Cell Host Microbe 2019, 26, 283–295.e8. [Google Scholar] [CrossRef]
- Rowland, I.; Gibson, G.R.; Heinken, A.; Scott, K.P.; Swann, J.R.; Thiele, I.; Tuohy, K. Gut microbiota functions: Metabolism of nutrients and other food components. Eur. J. Nutr. 2017, 57, 1–24. [Google Scholar] [CrossRef]
- Cho, I.; Blaser, M.J. The human microbiome: At the interface of health and disease. Nat. Rev. Genet. 2012, 13, 260–270. [Google Scholar] [CrossRef]
- Borre, Y.E.; O’Keeffe, G.W.; Clarke, G.; Stanton, C.; Dinan, T.G.; Cryan, J.F. Microbiota and neurodevelopmental windows: Implications for brain disorders. Trends Mol. Med. 2014, 20, 509–518. [Google Scholar] [CrossRef]
- Heijtz, R.D. Fetal, neonatal, and infant microbiome: Perturbations and subsequent effects on brain development and behavior. Semin. Fetal Neonatal Med. 2016, 21, 410–417. [Google Scholar] [CrossRef]
- Wikoff, W.R.; Anfora, A.T.; Liu, J.; Schultz, P.G.; Lesley, S.A.; Peters, E.C.; Siuzdak, G. Metabolomics analysis reveals large effects of gut microflora on mammalian blood metabolites. Proc. Natl. Acad. Sci. USA 2009, 106, 3698–3703. [Google Scholar] [CrossRef]
- Jaglin, M.; Rhimi, M.; Philippe, C.; Pons, N.; Bruneau, A.; Goustard, B.; Daugé, V.; Maguin, E.; Naudon, L.; Rabot, S. Indole, a Signaling Molecule Produced by the Gut Microbiota, Negatively Impacts Emotional Behaviors in Rats. Front. Mol. Neurosci. 2018, 12. [Google Scholar] [CrossRef]
- Gheorghe, C.E.; A Martin, J.; Manriquez, F.V.; Dinan, T.G.; Cryan, J.F.; Clarke, G. Focus on the essentials: Tryptophan metabolism and the microbiome-gut-brain axis. Curr. Opin. Pharmacol. 2019, 48, 137–145. [Google Scholar] [CrossRef]
- Kuzawa, C.W.; Chugani, H.T.; Grossman, L.I.; Lipovich, L.; Muzik, O.; Hof, P.R.; Wildman, D.E.; Sherwood, C.C.; Leonard, W.; Lange, N. Metabolic costs and evolutionary implications of human brain development. Proc. Natl. Acad. Sci. USA 2014, 111, 13010–13015. [Google Scholar] [CrossRef]
- Heijtz, R.D.; Wang, S.; Anuar, F.; Qian, Y.; Björkholm, B.; Samuelsson, A.; Hibberd, M.L.; Forssberg, H.; Pettersson, S. Normal gut microbiota modulates brain development and behavior. Proc. Natl. Acad. Sci. USA 2011, 108, 3047–3052. [Google Scholar] [CrossRef]
- Swann, J.R.; Garcia-Perez, I.; Braniste, V.; Wilson, I.D.; Sidaway, J.; Nicholson, J.; Pettersson, S.; Holmes, E. Application of 1 H NMR spectroscopy to the metabolic phenotyping of rodent brain extracts: A metabonomic study of gut microbial influence on host brain metabolism. J. Pharm. Biomed. Anal. 2017, 143, 141–146. [Google Scholar] [CrossRef]
- Frost, G.; Sleeth, M.L.; Sahuri-Arisoylu, M.; Lizarbe, B.; Cerdan, S.; Brody, L.; Anastasovska, J.; Ghourab, S.; Hankir, M.; Zhang, S.; et al. The short-chain fatty acid acetate reduces appetite via a central homeostatic mechanism. Nat. Commun. 2014, 5, 3611. [Google Scholar] [CrossRef]
- Koh, A.; Molinaro, A.; Ståhlman, M.; Khan, M.T.; Schmidt, C.; Mannerås-Holm, L.; Wu, H.; Carreras, A.; Jeong, H.; Olofsson, L.; et al. Microbially Produced Imidazole Propionate Impairs Insulin Signaling through mTORC1. Cell 2018, 175, 947–961.e17. [Google Scholar] [CrossRef]
- Licausi, F.; Hartman, N. Role of mTOR Complexes in Neurogenesis. Int. J. Mol. Sci. 2018, 19, 1544. [Google Scholar] [CrossRef]
- Stoica, L.; Zhu, P.J.; Huang, W.; Zhou, H.; Kozma, S.C.; Costa-Mattioli, M. Selective pharmacogenetic inhibition of mammalian target of Rapamycin complex I (mTORC1) blocks long-term synaptic plasticity and memory storage. Proc. Natl. Acad. Sci. USA 2011, 108, 3791–3796. [Google Scholar] [CrossRef]
- Hsiao, E.Y.; McBride, S.W.; Hsien, S.; Sharon, G.; Hyde, E.R.; McCue, T.; Codelli, J.A.; Chow, J.; Reisman, S.E.; Petrosino, J.F.; et al. Microbiota modulate behavioral and physiological abnormalities associated with neurodevelopmental disorders. Cell 2013, 155, 1451–1463. [Google Scholar] [CrossRef]
- Lee, J.H.; Lee, J. Indole as an intercellular signal in microbial communities. FEMS Microbiol. Rev. 2010, 34, 426–444. [Google Scholar] [CrossRef]
- Dodd, D.; Spitzer, M.H.; Van Treuren, W.; Merrill, B.; Hryckowian, A.J.; Higginbottom, S.K.; Le, A.; Cowan, T.M.; Nolan, G.P.; Fischbach, M.A.; et al. A gut bacterial pathway metabolizes aromatic amino acids into nine circulating metabolites. Nature 2017, 551, 648–652. [Google Scholar] [CrossRef]
- Taft, D.H.; Liu, J.; Maldonado-Gomez, M.X.; Akre, S.; Huda, M.N.; Ahmad, S.M.; Stephensen, C.B.; A Mills, D. Bifidobacterial Dominance of the Gut in Early Life and Acquisition of Antimicrobial Resistance. mSphere 2018, 3, e00441-18. [Google Scholar] [CrossRef]
- Chu, C.; Murdock, M.H.; Jing, D.; Won, T.H.; Chung, H.; Kressel, A.M.; Tsaava, T.; Addorisio, M.E.; Putzel, G.G.; Zhou, L.; et al. The microbiota regulate neuronal function and fear extinction learning. Nature 2019, 574, 543–548. [Google Scholar] [CrossRef]
- Chen, J.; Zhou, C.-J.; Zheng, P.; Cheng, K.; Wang, H.; Li, J.; Zeng, L.; Xie, P. Differential urinary metabolites related with the severity of major depressive disorder. Behav. Brain Res. 2017, 332, 280–287. [Google Scholar] [CrossRef]
- Yeh, Y.-C.; Huang, M.-F.; Liang, S.-S.; Hwang, S.-J.; Tsai, J.-C.; Liu, T.-L.; Wu, P.-H.; Yang, Y.-H.; Kuo, K.-C.; Kuo, M.-C.; et al. Indoxyl sulfate, not p-cresyl sulfate, is associated with cognitive impairment in early-stage chronic kidney disease. NeuroToxicology 2016, 53, 148–152. [Google Scholar] [CrossRef]
- Kimura, E.; Tohyama, C. Embryonic and Postnatal Expression of Aryl Hydrocarbon Receptor mRNA in Mouse Brain. Front. Neuroanat. 2017, 11, 118. [Google Scholar] [CrossRef]
- Schroeder, J.C.; DiNatale, B.C.; Murray, I.A.; Flaveny, C.A.; Liu, Q.; Laurenzana, E.M.; Lin, J.M.; Strom, S.; Omiecinski, C.J.; Amin, S.; et al. The Uremic Toxin 3-Indoxyl Sulfate Is a Potent Endogenous Agonist for the Human Aryl Hydrocarbon Receptor. Biochemistry 2010, 49, 393–400. [Google Scholar] [CrossRef]
- Rothhammer, V.; Mascanfroni, I.D.; Bunse, L.; Takenaka, M.C.; Kenison, J.E.; Mayo, L.; Chao, C.-C.; Patel, B.; Yan, R.; Blain, M.; et al. Type I interferons and microbial metabolites of tryptophan modulate astrocyte activity and central nervous system inflammation via the aryl hydrocarbon receptor. Nat. Med. 2016, 22, 586–597. [Google Scholar] [CrossRef]
- Wong, C.B.; Tanaka, A.; Kuhara, T.; Xiao, J.-Z. Potential Effects of Indole-3-Lactic Acid, a Metabolite of Human Bifidobacteria, on NGF-Induced Neurite Outgrowth in PC12 Cells. Microorganisms 2020, 8, 398. [Google Scholar] [CrossRef]
- Latchney, S.E.; Hein, A.M.; O’Banion, M.; DiCicco-Bloom, E.; Opanashuk, L.A. Deletion or activation of the aryl hydrocarbon receptor alters adult hippocampal neurogenesis and contextual fear memory. J. Neurochem. 2013, 125, 430–445. [Google Scholar] [CrossRef]
- Stone, T.W.; Darlington, L.G. Endogenous kynurenines as targets for drug discovery and development. Nat. Rev. Drug Discov. 2002, 1, 609–620. [Google Scholar] [CrossRef]
- Desbonnet, L.; Garrett, L.; Clarke, G.; Bienenstock, J.; Dinan, T.G. The probiotic Bifidobacteria infantis: An assessment of potential antidepressant properties in the rat. J. Psychiatr. Res. 2008, 43, 164–174. [Google Scholar] [CrossRef]
- Valladares, R.; Bojilova, L.; Potts, A.H.; Cameron, E.; Gardner, C.; Lorca, G.; Gonzalez, C.F. Lactobacillus johnsonii inhibits indoleamine 2,3-dioxygenase and alters tryptophan metabolite levels in BioBreeding rats. FASEB J. 2013, 27, 1711–1720. [Google Scholar] [CrossRef] [PubMed]
- O’Connor, J.; Lawson, M.; André, C.; Moreau, M.; Lestage, J.; Castanon, N.; Kelley, K.W.; Dantzer, R. Lipopolysaccharide-induced depressive-like behavior is mediated by indoleamine 2,3-dioxygenase activation in mice. Mol. Psychiatry 2008, 14, 511–522. [Google Scholar] [CrossRef] [PubMed]
- Xu, R.; Wang, Q. Towards understanding brain-gut-microbiome connections in Alzheimer’s disease. BMC Syst. Boil. 2016, 10, 63. [Google Scholar] [CrossRef]
- Tseng, H.-C.; Graves, N.J. Natural Methylamine Osmolytes, Trimethylamine N-Oxide and Betaine, Increase Tau-Induced Polymerization of Microtubules. Biochem. Biophys. Res. Commun. 1998, 250, 726–730. [Google Scholar] [CrossRef]
- Del Rio, D.; Zimetti, F.; Caffarra, P.; Tassotti, M.; Bernini, F.; Brighenti, F.; Zini, A.; Zanotti, I. The Gut Microbial Metabolite Trimethylamine-N-Oxide Is Present in Human Cerebrospinal Fluid. Nutrients 2017, 9, 1053. [Google Scholar] [CrossRef]
- Subramaniam, S.; Fletcher, C.A. Trimethylamine N-oxide: Breathe new life. Br. J. Pharmacol. 2017, 175, 1344–1353. [Google Scholar] [CrossRef]
- Chen, S.; Henderson, A.; Petriello, M.C.; Romano, K.A.; Gearing, M.; Miao, J.; Schell, M.; Sandoval-Espinola, W.J.; Tao, J.; Sha, B.; et al. Trimethylamine N-Oxide Binds and Activates PERK to Promote Metabolic Dysfunction. Cell Metab. 2019, 30, 1141–1151.e5. [Google Scholar] [CrossRef]
- Sharma, V.; Ounallah-Saad, H.; Chakraborty, D.; Hleihil, M.; Sood, R.; Barrera, I.; Edry, E.; Chandran, S.K.; Leon, S.B.T.D.; Kaphzan, H.; et al. Local Inhibition of PERK Enhances Memory and Reverses Age-Related Deterioration of Cognitive and Neuronal Properties. J. Neurosci. 2017, 38, 648–658. [Google Scholar] [CrossRef]
- Romano, K.A.; Campo, A.M.-D.; Kasahara, K.; Chittim, C.L.; Vivas, E.I.; Amador-Noguez, D.; Balskus, E.P.; E Rey, F. Metabolic, Epigenetic, and Transgenerational Effects of Gut Bacterial Choline Consumption. Cell Host Microbe 2017, 22, 279–290.e7. [Google Scholar] [CrossRef]
- Merrifield, C.A.; Lewis, M.; Claus, S.P.; Pearce, J.T.M.; Cloarec, O.; Duncker, S.; Heinzmann, S.S.; Dumas, M.-E.; Kochhar, S.; Rezzi, S.; et al. Weaning diet induces sustained metabolic phenotype shift in the pig and influences host response toBifidobacterium lactisNCC2818. Gut 2012, 62, 842–851. [Google Scholar] [CrossRef] [PubMed]
- Li, Y.; Guo, Y.; Wen, Z.; Jiang, X.; Ma, X.; Han, X.-Y. Weaning Stress Perturbs Gut Microbiome and Its Metabolic Profile in Piglets. Sci. Rep. 2018, 8, 18068. [Google Scholar] [CrossRef]
- Farshim, P.; Walton, G.; Chakrabarti, B.; Givens, I.; Saddy, D.; Kitchen, I.; Swann, J.R.; Bailey, A. Maternal Weaning Modulates Emotional Behavior and Regulates the Gut-Brain Axis. Sci. Rep. 2016, 6, 21958. [Google Scholar] [CrossRef]


© 2020 by the authors. Licensee MDPI, Basel, Switzerland. This article is an open access article distributed under the terms and conditions of the Creative Commons Attribution (CC BY) license (http://creativecommons.org/licenses/by/4.0/).
Share and Cite
Swann, J.R.; Spitzer, S.O.; Diaz Heijtz, R. Developmental Signatures of Microbiota-Derived Metabolites in the Mouse Brain. Metabolites 2020, 10, 172. https://doi.org/10.3390/metabo10050172
Swann JR, Spitzer SO, Diaz Heijtz R. Developmental Signatures of Microbiota-Derived Metabolites in the Mouse Brain. Metabolites. 2020; 10(5):172. https://doi.org/10.3390/metabo10050172
Chicago/Turabian StyleSwann, Jonathan R., Sonia O. Spitzer, and Rochellys Diaz Heijtz. 2020. "Developmental Signatures of Microbiota-Derived Metabolites in the Mouse Brain" Metabolites 10, no. 5: 172. https://doi.org/10.3390/metabo10050172
APA StyleSwann, J. R., Spitzer, S. O., & Diaz Heijtz, R. (2020). Developmental Signatures of Microbiota-Derived Metabolites in the Mouse Brain. Metabolites, 10(5), 172. https://doi.org/10.3390/metabo10050172