Evaluation of MDA-MB-468 Cell Culture Media Analysis in Predicting Triple-Negative Breast Cancer Patient Sera Metabolic Profiles

 , ,
, , 
Abstract

1. Introduction
2. Results
3. Discussion
4. Materials and Methods
4.1. Sample Collection
4.2. Cell Culturing in DMEM
4.3. Medium Sample Preparation for NMR Measurements
4.4. Serum Sample Preparation for NMR Measurements
4.5. NMR Measurements
4.6. Metabolites Identification NMR
4.7. Processing for Data Analysis
4.8. Univariate Data Analysis
4.9. Multivariate Data Analysis
5. Conclusions
Supplementary Materials
Author Contributions
Funding
Acknowledgments
Conflicts of Interest
References
- DeSantis, C.E.; Fedewa, S.A.; Sauer, A.G.; Kramer, J.L.; Smith, R.A.; Jemal, A. Breast cancer statistics, 2015: Convergence of incidence rates between black and white women. CA. Cancer J. Clin. 2016, 66, 31–42. [Google Scholar] [CrossRef] [PubMed]
- Ismail-Khan, R.; Bui, M.M. A Review of Triple-Negative Breast Cancer. Cancer Control. 2010, 17, 173–176. [Google Scholar] [CrossRef]
- Skandan, S.P. 5 year Overall survival of triple negative breast cancer: A single institution experience. J. Clin. Oncol. 2016, 34, e12580. [Google Scholar] [CrossRef]
- Boja, E.S.; Kinsinger, C.R.; Rodriguez, H.; Srinivas, P. Integration of omics sciences to advance biology and medicine. Clin. Proteomics. 2014, 11, 45. [Google Scholar] [CrossRef]
- Blum, B.C.; Mousavi, F.; Emili, A. Single-platform ‘multi-omic’ profiling: Unified mass spectrometry and computational workflows for integrative proteomics–metabolomics analysis. Mol. Omi. 2018, 14, 307–319. [Google Scholar] [CrossRef] [PubMed]
- Vucic, E.A.; Thu, K.L.; Robison, K.; Rybaczyk, L.A.; Chari, R.; Alvarez, C.E.; Lam, W.L. Translating cancer ‘omics’ to improved outcomes. Genome Res. 2012, 22, 188–195. [Google Scholar] [CrossRef]
- Zhang, A.; Sun, H.; Xu, H.; Qiu, S.; Wang, X. Cell metabolomics. OMICS 2013, 17, 495–501. [Google Scholar] [CrossRef]
- Martineau, E.; Tea, I.; Akoka, S.; Giraudeau, P. Absolute quantification of metabolites in breast cancer cell extracts by quantitative 2D 1H INADEQUATE NMR. NMR Biomed. 2012, 25, 985–992. [Google Scholar] [CrossRef]
- Abu-Absi, N.R.; Kenty, B.M.; Cuellar, M.E.; Borys, M.C.; Sakhamuri, S.; Strachan, D.J.; Hausladen, M.C.; Li, Z.J. Real time monitoring of multiple parameters in mammalian cell culture bioreactors using an in-line Raman spectroscopy probe. Biotechnol. Bioeng. 2011, 108, 1215–1221. [Google Scholar] [CrossRef]
- Fennema, E.; Rivron, N.; Rouwkema, J.; van Blitterswijk, C.; de Boer, J. Spheroid culture as a tool for creating 3D complex tissues. Trends Biotechnol. 2013, 31, 108–115. [Google Scholar] [CrossRef]
- Kirdar, A.O.; Conner, J.S.; Baclaski, J.; Rathore, A.S. Application of Multivariate Analysis toward Biotech Processes: Case Study of a Cell-Culture Unit Operation. Biotechnol. Prog. 2007, 23, 61–67. [Google Scholar] [CrossRef]
- Vermeersch, K.A.; Styczynski, M.P. Applications of metabolomics in cancer research. J. Carcinog. 2013, 12, 9. [Google Scholar] [CrossRef]
- Zenobi, R. Single-Cell Metabolomics: Analytical and Biological Perspectives. Science 2013, 342, 1243259. [Google Scholar] [CrossRef] [PubMed]
- Hevia, D.; Gonzalez-Menendez, P.; Fernandez-Fernandez, M.; Cueto, S.; Rodriguez-Gonzalez, P.; Garcia-Alonso, J.I.; Mayo, J.C.; Sainz, R.M. Melatonin Decreases Glucose Metabolism in Prostate Cancer Cells: A (13)C Stable Isotope-Resolved Metabolomic Study. Int. J. Mol. Sci. 2017, 18, 1620. [Google Scholar] [CrossRef] [PubMed]
- Flores, R.E.; Brown, A.K.; Taus, L.; Khoury, J.; Glover, F.; Kami, K.; Sarangarajan, R.; Walshe, T.E.; Narain, N.R.; Kiebish, M.A.; et al. Mycoplasma infection and hypoxia initiate succinate accumulation and release in the VM-M3 cancer cells. Biochim. Biophys. Acta-Bioenerg. 2018, 1859, 975–983. [Google Scholar] [CrossRef]
- Knott, M.E.; Manzi, M.; Zabalegui, N.; Salazar, M.O.; Puricelli, L.I.; Monge, M.E. Metabolic Footprinting of a Clear Cell Renal Cell Carcinoma in Vitro Model for Human Kidney Cancer Detection. J. Proteome Res. 2018, 17, 3877–3888. [Google Scholar] [CrossRef] [PubMed]
- Gillet, J.-P.; Varma, S.; Gottesman, M.M. The clinical relevance of cancer cell lines. J. Natl. Cancer Inst. 2013, 105, 452–458. [Google Scholar] [CrossRef] [PubMed]
- Katt, M.E.; Placone, A.L.; Wong, A.D.; Xu, Z.S.; Searson, P.C. In Vitro Tumor Models: Advantages, Disadvantages, Variables, Selecting the Right Platform. Front. Bioeng. Biotechnol. 2016, 4, 12. [Google Scholar] [CrossRef]
- Holliday, D.L.; Speirs, V. Choosing the right cell line for breast cancer research. Breast Cancer Res. 2011, 13, 215. [Google Scholar] [CrossRef]
- Lanning, N.J.; Castle, J.P.; Singh, S.J.; Leon, A.N.; Tovar, E.A.; Sanghera, A.; MacKeigan, J.P.; Filipp, F.V.; Graveel, C.R. Metabolic profiling of triple-negative breast cancer cells reveals metabolic vulnerabilities. Cancer Metab. 2017, 5, 6. [Google Scholar] [CrossRef]
- Goode, G.; Gunda, V.; Chaika, N.V.; Purohit, V.; Yu, F.; Singh, P.K. MUC1 facilitates metabolomic reprogramming in triple-negative breast cancer. PLoS ONE 2017, 12, e0176820. [Google Scholar] [CrossRef] [PubMed]
- Borrego, S.L.; Fahrmann, J.; Datta, R.; Stringari, C.; Grapov, D.; Zeller, M.; Chen, Y.; Wang, P.; Baldi, P.; Gratton, E.; et al. Metabolic changes associated with methionine stress sensitivity in MDA-MB-468 breast cancer cells. Cancer Metab. 2016, 4, 9. [Google Scholar] [CrossRef] [PubMed]
- Stewart, D.A.; Winnike, J.H.; McRitchie, S.L.; Clark, R.F.; Pathmasiri, W.W.; Sumner, S.J. Metabolomics Analysis of Hormone-Responsive and Triple-Negative Breast Cancer Cell Responses to Paclitaxel Identify Key Metabolic Differences. J. Proteome Res. 2016, 15, 3225–3240. [Google Scholar] [CrossRef] [PubMed]
- Romero-Garcia, S.; Moreno-Altamirano, M.M.B.; Prado-Garcia, H.; Sánchez-García, F.J. Lactate Contribution to the Tumor Microenvironment: Mechanisms, Effects on Immune Cells and Therapeutic Relevance. Front. Immunol. 2016, 7, 52. [Google Scholar] [CrossRef] [PubMed]
- Pavlides, S.; Whitaker-Menezes, D.; Castello-Cros, R.; Flomenberg, N.; Witkiewicz, A.K.; Frank, P.G.; Casimiro, M.C.; Wang, C.; Fortina, P.; Addya, S.; et al. The reverse Warburg effect: Aerobic glycolysis in cancer associated fibroblasts and the tumor stroma. Cell Cycle. 2009, 8, 3984–4001. [Google Scholar] [CrossRef]
- Witkiewicz, A.K.; Whitaker-Menezes, D.; Dasgupta, A.; Philp, N.J.; Lin, Z.; Gandara, R.; Sneddon, S.; Martinez-Outschoorn, U.E.; Sotgia, F.; Lisanti, M.P. Using the ‘reverse Warburg effect’ to identify high-risk breast cancer patients: Stromal MCT4 predicts poor clinical outcome in triple-negative breast cancers. Cell Cycle 2012, 11, 1108–1117. [Google Scholar] [CrossRef]
- Suman, S.; Sharma, R.K.; Kumar, V.; Sinha, N.; Shukla, Y. Metabolic fingerprinting in breast cancer stages through 1H NMR spectroscopy-based metabolomic analysis of plasma. J. Pharm. Biomed. Anal. 2018, 160, 38–45. [Google Scholar] [CrossRef]
- Cala, M.P.; Aldana, J.; Medina, J.; Sanchez, J.; Guio, J.; Wist, J.; Meesters, R.J. Multiplatform plasma metabolic and lipid fingerprinting of breast cancer: A pilot control-case study in Colombian Hispanic women. PLoS ONE 2018, 13, e0190958. [Google Scholar] [CrossRef]
- Brody, T. Nutritional Biochemistry, 2nd ed.; Academic Press: San Diego, CA, USA, 1999; pp. 157–271. [Google Scholar]
- Jobard, E.; Pontoizeau, C.; Blaise, B.J.; Bachelot, T.; Elena-Herrmann, B.; Trédan, O. A serum nuclear magnetic resonance-based metabolomic signature of advanced metastatic human breast cancer. Cancer Lett. 2014, 343, 33–41. [Google Scholar] [CrossRef]
- Bartmann, C.; Raman, S.R.J.; Flöter, J.; Schulze, A.; Bahlke, K.; Willingstorfer, J.; Strunz, M.; Wöckel, A.; Klement, R.J.; Kapp, M.; et al. Beta-hydroxybutyrate (3-OHB) can influence the energetic phenotype of breast cancer cells, but does not impact their proliferation and the response to chemotherapy or radiation. Cancer Metab. 2018, 6, 8. [Google Scholar] [CrossRef]
- Shen, J.; Yan, L.; Liu, S.; Ambrosone, C.B.; Zhao, H. Plasma metabolomic profiles in breast cancer patients and healthy controls: By race and tumor receptor subtypes. Transl. Oncol. 2013, 6, 757–765. [Google Scholar] [CrossRef] [PubMed]
- Meister, A. Biochemistry of Amino Acids, 2nd ed.; Academic Press: Cambridge, MA, USA, 1965; Volume II, p. xxiii. [Google Scholar]
- Tenori, L.; Oakman, C.; Morris, P.G.; Gralka, E.; Turner, N.; Cappadona, S.; Fornier, M.; Hudis, C.; Norton, L.; Luchinat, C.; et al. Serum metabolomic profiles evaluated after surgery may identify patients with oestrogen receptor negative early breast cancer at increased risk of disease recurrence. Results from a retrospective study. Mol. Oncol. 2015, 9, 128–139. [Google Scholar] [CrossRef] [PubMed]
- Budczies, J.; Brockmöller, S.F.; Müller, B.M.; Barupal, D.K.; Richter-Ehrenstein, C.; Kleine-Tebbe, A.; Griffin, J.L.; Orešič, M.; Dietel, M.; Denkerta, C.; et al. Comparative metabolomics of estrogen receptor positive and estrogen receptor negative breast cancer: Alterations in glutamine and beta-alanine metabolism. J. Proteomics. 2013, 94, 279–288. [Google Scholar] [CrossRef] [PubMed]
- Miyagi, Y.; Higashiyama, M.; Gochi, A.; Akaike, M.; Ishikawa, T.; Miura, T.; Saruki, N.; Bando, E.; Kimura, H.; Imamura, F.; et al. Plasma Free Amino Acid Profiling of Five Types of Cancer Patients and Its Application for Early Detection. PLoS ONE 2011, 6, e24143. [Google Scholar] [CrossRef] [PubMed]
- Hussein, Y.R.; Bandyopadhyay, S.; Semaan, A.; Ahmed, Q.; Albashiti, B.; Jazaerly, T.; Nahleh, Z.; Ali-Fehmi, R. Glut-1 Expression Correlates with Basal-like Breast Cancer. Transl. Oncol. 2011, 4, 321–327. [Google Scholar] [CrossRef]
- Krzeslak, A.; Wojcik-Krowiranda, K.; Forma, E.; Jozwiak, P.; Romanowicz, H.; Bienkiewicz, A.; Brys, M. Expression of GLUT1 and GLUT3 glucose transporters in endometrial and breast cancers. Pathol. Oncol. Res. 2012, 18, 721–728. [Google Scholar] [CrossRef]
- Lampa, M.; Arlt, H.; He, T.; Ospina, B.; Reeves, J.; Zhang, B.; Murtie, J.; Deng, G.; Barberis, C.; Hoffmann, D.; et al. Glutaminase is essential for the growth of triple-negative breast cancer cells with a deregulated glutamine metabolism pathway and its suppression synergizes with mTOR inhibition. PLoS ONE 2017, 12, e0185092. [Google Scholar] [CrossRef]
- Wahdan-Alaswad, R.S.; Edgerton, S.M.; Salem, H.S.; Thor, A.D. Metformin Targets Glucose Metabolism in Triple Negative Breast Cancer. J. Oncol. Transl. Res. 2018, 4, 129. [Google Scholar] [CrossRef]
- Waterhouse, C.; Keilson, J. Cori cycle activity in man. J. Clin. Investig. 1969, 48, 2359–2366. [Google Scholar] [CrossRef]
- Jové, M.; Collado, R.; Quiles, J.L.; Ramírez-Tortosa, M.C.; Sol, J.; Ruiz-Sanjuan, M.; Fernandez, M.; de la Cabrera, C.T.; Ramírez-Tortosa, C.; Granados-Principal, S.; et al. A plasma metabolomic signature discloses human breast cancer. Oncotarget 2017, 8, 19522. [Google Scholar]
- Ren, J.G.; Seth, P.; Ye, H.; Guo, K.; Hanai, J.I.; Husain, Z.; Sukhatme, V.P. Citrate Suppresses Tumor Growth in Multiple Models through Inhibition of Glycolysis, the Tricarboxylic Acid Cycle and the IGF-1R Pathway. Sci. Rep. 2017, 7, 4537. [Google Scholar] [CrossRef] [PubMed]
- Hart, C.D.; Vignoli, A.; Tenori, L.; Uy, G.L.; Van To, T.; Adebamowo, C.; Hossain, S.M.; Biganzoli, L.; Risi, E.; Love, R.R.; et al. Serum Metabolomic Profiles Identify ER-Positive Early Breast Cancer Patients at Increased Risk of Disease Recurrence in a Multicenter Population. Clin. Cancer Res. 2017, 23, 1422–1431. [Google Scholar] [CrossRef] [PubMed]
- Tate, C.R.; Rhodes, L.V.; Segar, H.C.; Driver, J.L.; Pounder, F.N.; Burow, M.E.; Collins-Burow, B.M. Targeting triple-negative breast cancer cells with the histone deacetylase inhibitor panobinostat. Breast Cancer Res. 2012, 14, R79. [Google Scholar] [CrossRef] [PubMed]
- Wahdan-Alaswad, R.; Fan, Z.; Edgerton, S.M.; Liu, B.; Deng, X.S.; Árnadóttir, S.S.; Richer, J.K.; Anderson, S.M.; Thor, A.D. Glucose promotes breast cancer aggression and reduces metformin efficacy. Cell Cycle 2013, 12, 3759–3769. [Google Scholar] [CrossRef]
- Chavez, K.J.; Garimella, S.V.; Lipkowitz, S. Triple negative breast cancer cell lines: One tool in the search for better treatment of triple negative breast cancer. Breast Dis. 2010, 32, 35–48. [Google Scholar] [CrossRef]
- Gowda, G.A.N.; Raftery, D. Quantitating metabolites in protein precipitated serum using NMR spectroscopy. Anal. Chem. 2014, 86, 5433–5440. [Google Scholar] [CrossRef] [PubMed]
- Tayyari, F.; Gowda, G.N.; Olopade, O.F.; Berg, R.; Yang, H.H.; Lee, M.P.; Ngwa, W.F.; Mittal, S.K.; Raftery, D.; Mohammed, S.I. Metabolic profiles of triple-negative and luminal a breast cancer subtypes in African-American identify key metabolic differences. Oncotarget 2018, 9, 11677–11690. [Google Scholar] [CrossRef]
- Ulrich, E.L.; Akutsu, H.; Doreleijers, J.F.; Harano, Y.; Ioannidis, Y.E.; Lin, J.; Livny, M.; Mading, S.; Maziuk, D.; Miller, Z.; et al. BioMagResBank. Nucleic Acids Res. 2008, 36, D402–D408. [Google Scholar] [CrossRef]
- Wishart, D.S.; Feunang, Y.D.; Marcu, A.; Guo, A.C.; Liang, K.; Vázquez-Fresno, R.; Sajed, T.; Johnson, D.; Li, C.; Karu, N.; et al. HMDB 4.0: The human metabolome database for 2018. Nucleic Acids Res. 2017, 46, D608–D617. [Google Scholar] [CrossRef]
- Tomasi, G.; van den Berg, F.; Andersson, C. Correlation optimized warping and dynamic time warping as preprocessing methods for chromatographic data. J. Chemom. 2004, 18, 231–241. [Google Scholar] [CrossRef]
- Savorani, F.; Tomasi, G.; Engelsen, S.B. icoshift: A versatile tool for the rapid alignment of 1D NMR spectra. J. Magn. Reson. 2010, 202, 190–202. [Google Scholar] [CrossRef] [PubMed]
- Dieterle, F.; Ross, A.; Schlotterbeck, G.; Senn, H. Probabilistic Quotient Normalization as Robust Method to Account for Dilution of Complex Biological Mixtures. Application in 1H NMR Metabonomics. Anal. Chem. 2006, 78, 4281–4290. [Google Scholar] [CrossRef] [PubMed]


| Group | Average Age | Range | p Value | ||
|---|---|---|---|---|---|
| TNBC (9) | 56.67 | 50–67 | 0.79 | ||
| HC (86) | 57.41 | 45–68 | |||
| Menopausal status | Pre-menopausal | Post-menopausal | N.D | ||
| TNBC | 0 | 9 | 0 | ||
| HC | 0 | 86 | 0 | ||
| Comorbidity | Diabetes | Hypertension | Hypothyroidism | Hyperthyroidism | N.D |
| TNBC | 0 | 4 | 1 | 1 | 0 |
| HC | 4 | 34 | 14 | 0 | 2 |
| Smoking | Smokers | Non-smokers | N.D. | ||
| TNBC | - | - | - | ||
| HC | 27 | 55 | 4 |
| Metabolite | TNBC vs. HC APD [%] | Coefficient of Variation | p Value | |
|---|---|---|---|---|
| HC | TNBC | |||
| Lactate | −33.149 | 19.889 | 17.203 | 6.26 × 10⁻⁵ a |
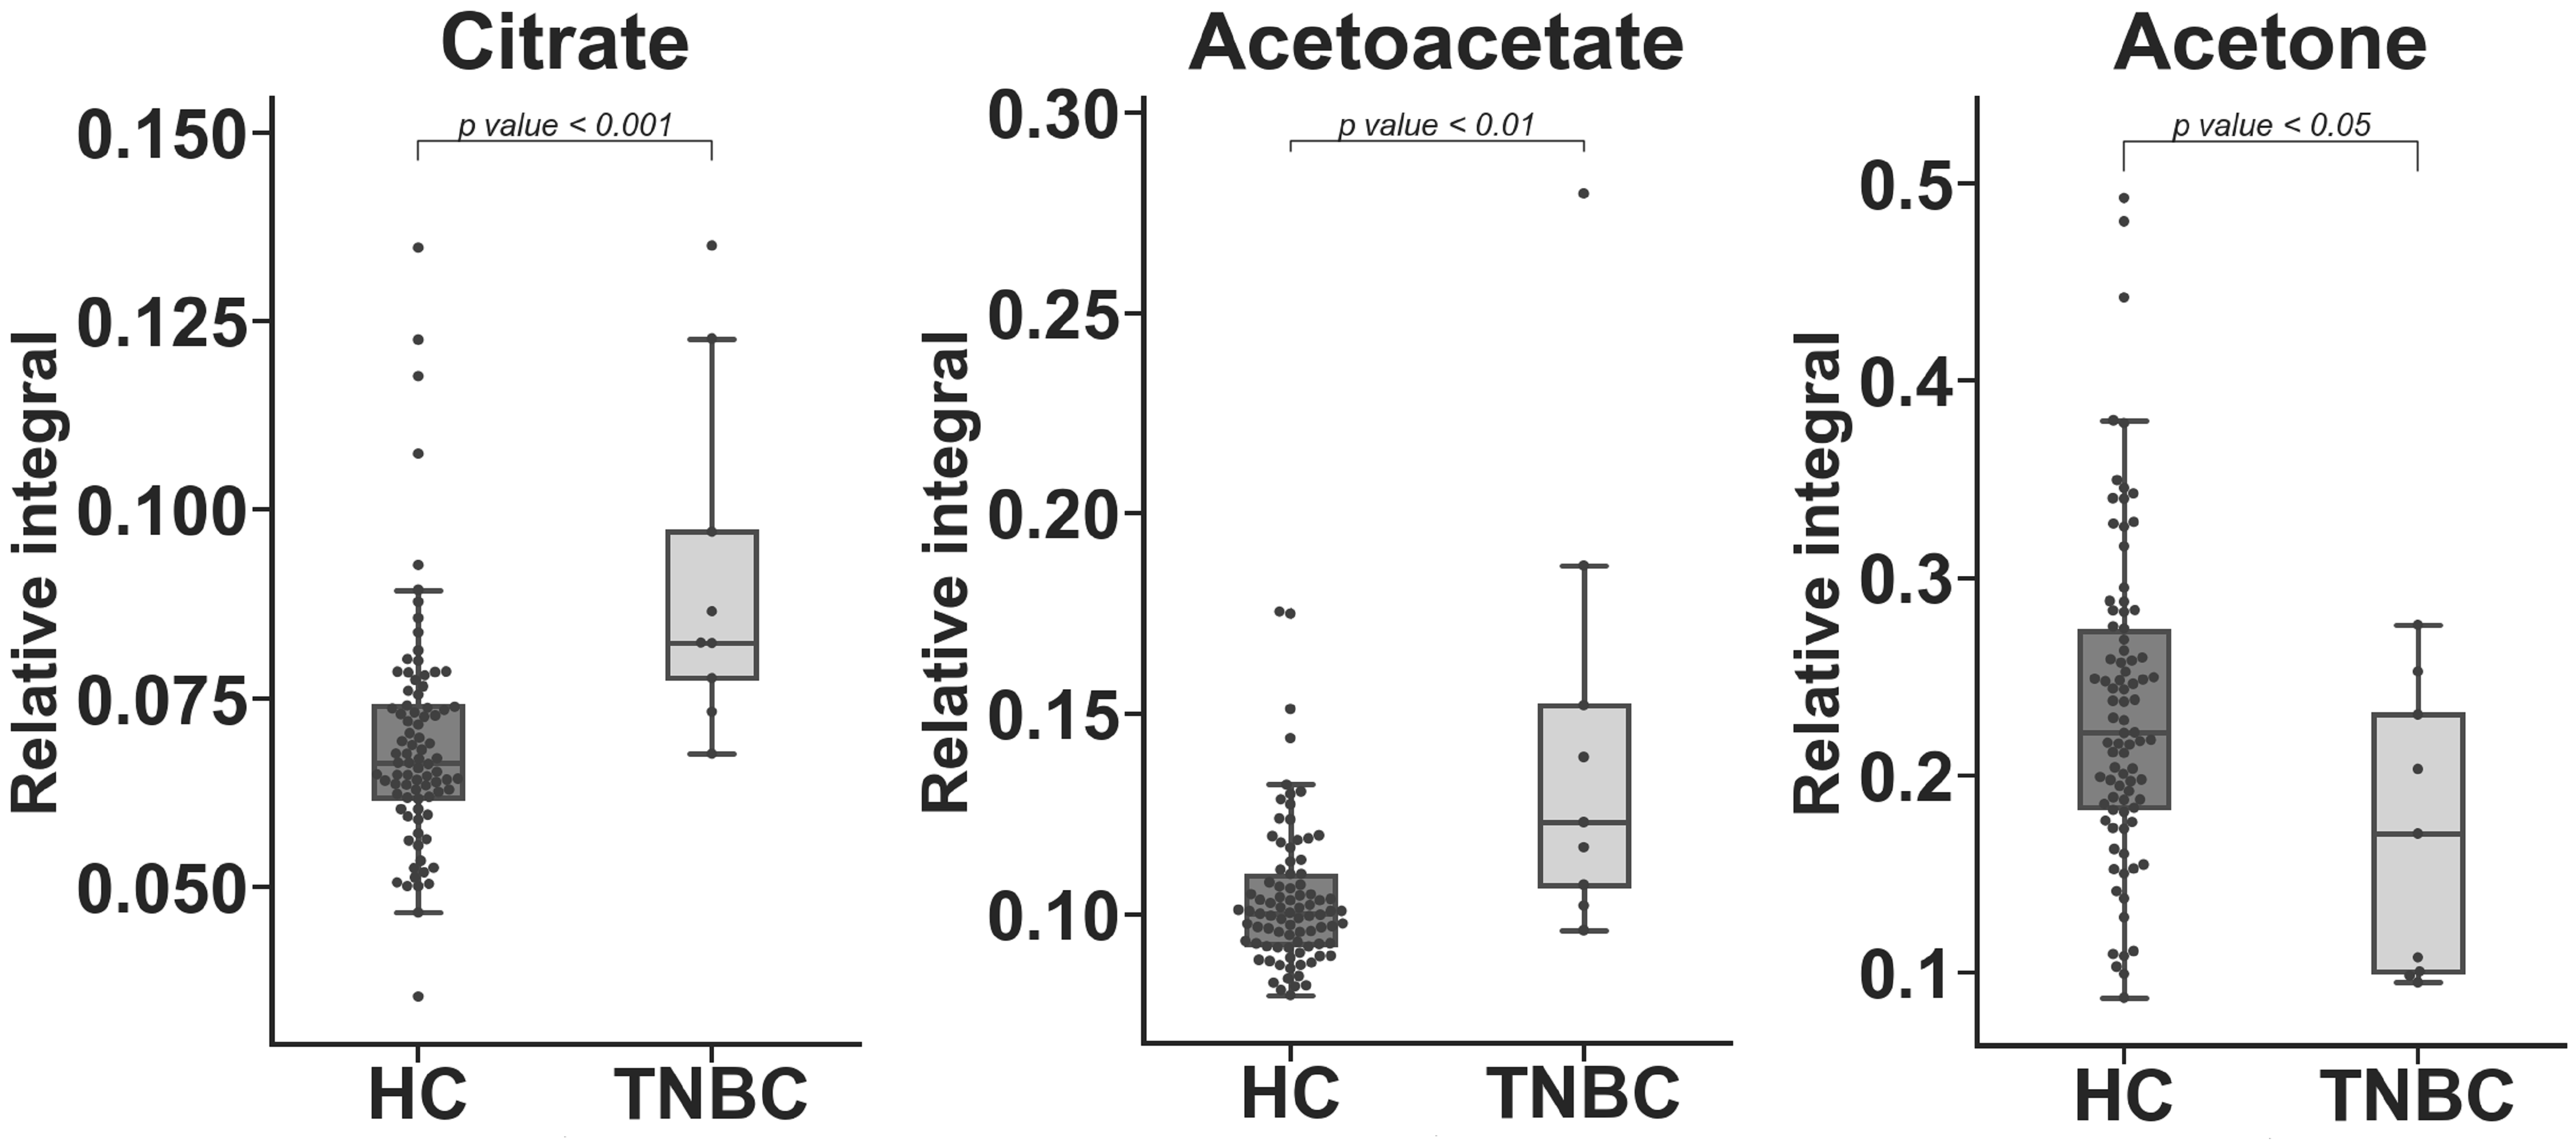
| Citrate | 27.819 | 22.291 | 24.960 | 5.10 × 10⁻⁴ c |
| Acetoacetate | 32.928 | 17.322 | 40.115 | 2.44 × 10⁻³ c |
| Tyrosine | −13.204 | 14.847 | 17.841 | 1.98 × 10⁻² b |
| Glucose | 7.068 | 9.307 | 7.745 | 2.58 × 10⁻² a |
| Glutamine | 6.860 | 9.315 | 6.373 | 2.87 × 10⁻² a |
| Glutamate | −9.490 | 15.409 | 9.123 | 3.89 × 10⁻² c |
| Acetone | −31.267 | 34.257 | 42.560 | 4.01 × 10⁻² c |
| Alanine | −11.149 | 14.519 | 19.592 | 4.45 × 10⁻² a |
| Metabolite | TNBC vs. HC APD [%] | Coefficient of Variation | p Value | |
|---|---|---|---|---|
| HC | TNBC | |||
| L_2 | −35.525 | 29.061 | 20.954 | 6.45 × 10⁻⁴ c |
| L_4 | −20.872 | 17.941 | 13.087 | 9.75 × 10⁻⁴ c |
| L_8 | −29.523 | 27.006 | 18.362 | 1.81 × 10⁻³ c |
| L_5 | −18.917 | 20.758 | 11.910 | 2.24 × 10⁻³ c |
| L_3 | −50.287 | 45.304 | 39.963 | 3.40 × 10⁻³ c |
| Lipid + Acetone | −41.161 | 39.546 | 35.046 | 4.69 × 10⁻³ c |
| L_1 | −14.663 | 15.130 | 14.784 | 6.41 × 10⁻³ c |
© 2020 by the authors. Licensee MDPI, Basel, Switzerland. This article is an open access article distributed under the terms and conditions of the Creative Commons Attribution (CC BY) license (http://creativecommons.org/licenses/by/4.0/).
Share and Cite
Wojtowicz, W.; Wróbel, A.; Pyziak, K.; Tarkowski, R.; Balcerzak, A.; Bębenek, M.; Młynarz, P. Evaluation of MDA-MB-468 Cell Culture Media Analysis in Predicting Triple-Negative Breast Cancer Patient Sera Metabolic Profiles. Metabolites 2020, 10, 173. https://doi.org/10.3390/metabo10050173
Wojtowicz W, Wróbel A, Pyziak K, Tarkowski R, Balcerzak A, Bębenek M, Młynarz P. Evaluation of MDA-MB-468 Cell Culture Media Analysis in Predicting Triple-Negative Breast Cancer Patient Sera Metabolic Profiles. Metabolites. 2020; 10(5):173. https://doi.org/10.3390/metabo10050173
Chicago/Turabian StyleWojtowicz, Wojciech, Anna Wróbel, Karolina Pyziak, Radosław Tarkowski, Alicja Balcerzak, Marek Bębenek, and Piotr Młynarz. 2020. "Evaluation of MDA-MB-468 Cell Culture Media Analysis in Predicting Triple-Negative Breast Cancer Patient Sera Metabolic Profiles" Metabolites 10, no. 5: 173. https://doi.org/10.3390/metabo10050173
APA StyleWojtowicz, W., Wróbel, A., Pyziak, K., Tarkowski, R., Balcerzak, A., Bębenek, M., & Młynarz, P. (2020). Evaluation of MDA-MB-468 Cell Culture Media Analysis in Predicting Triple-Negative Breast Cancer Patient Sera Metabolic Profiles. Metabolites, 10(5), 173. https://doi.org/10.3390/metabo10050173