A Cross-Sectional Study of Obesity Effects on the Metabolomic Profile of a Leptin-Resistant Swine Model

 , , , and
Abstract
1. Introduction
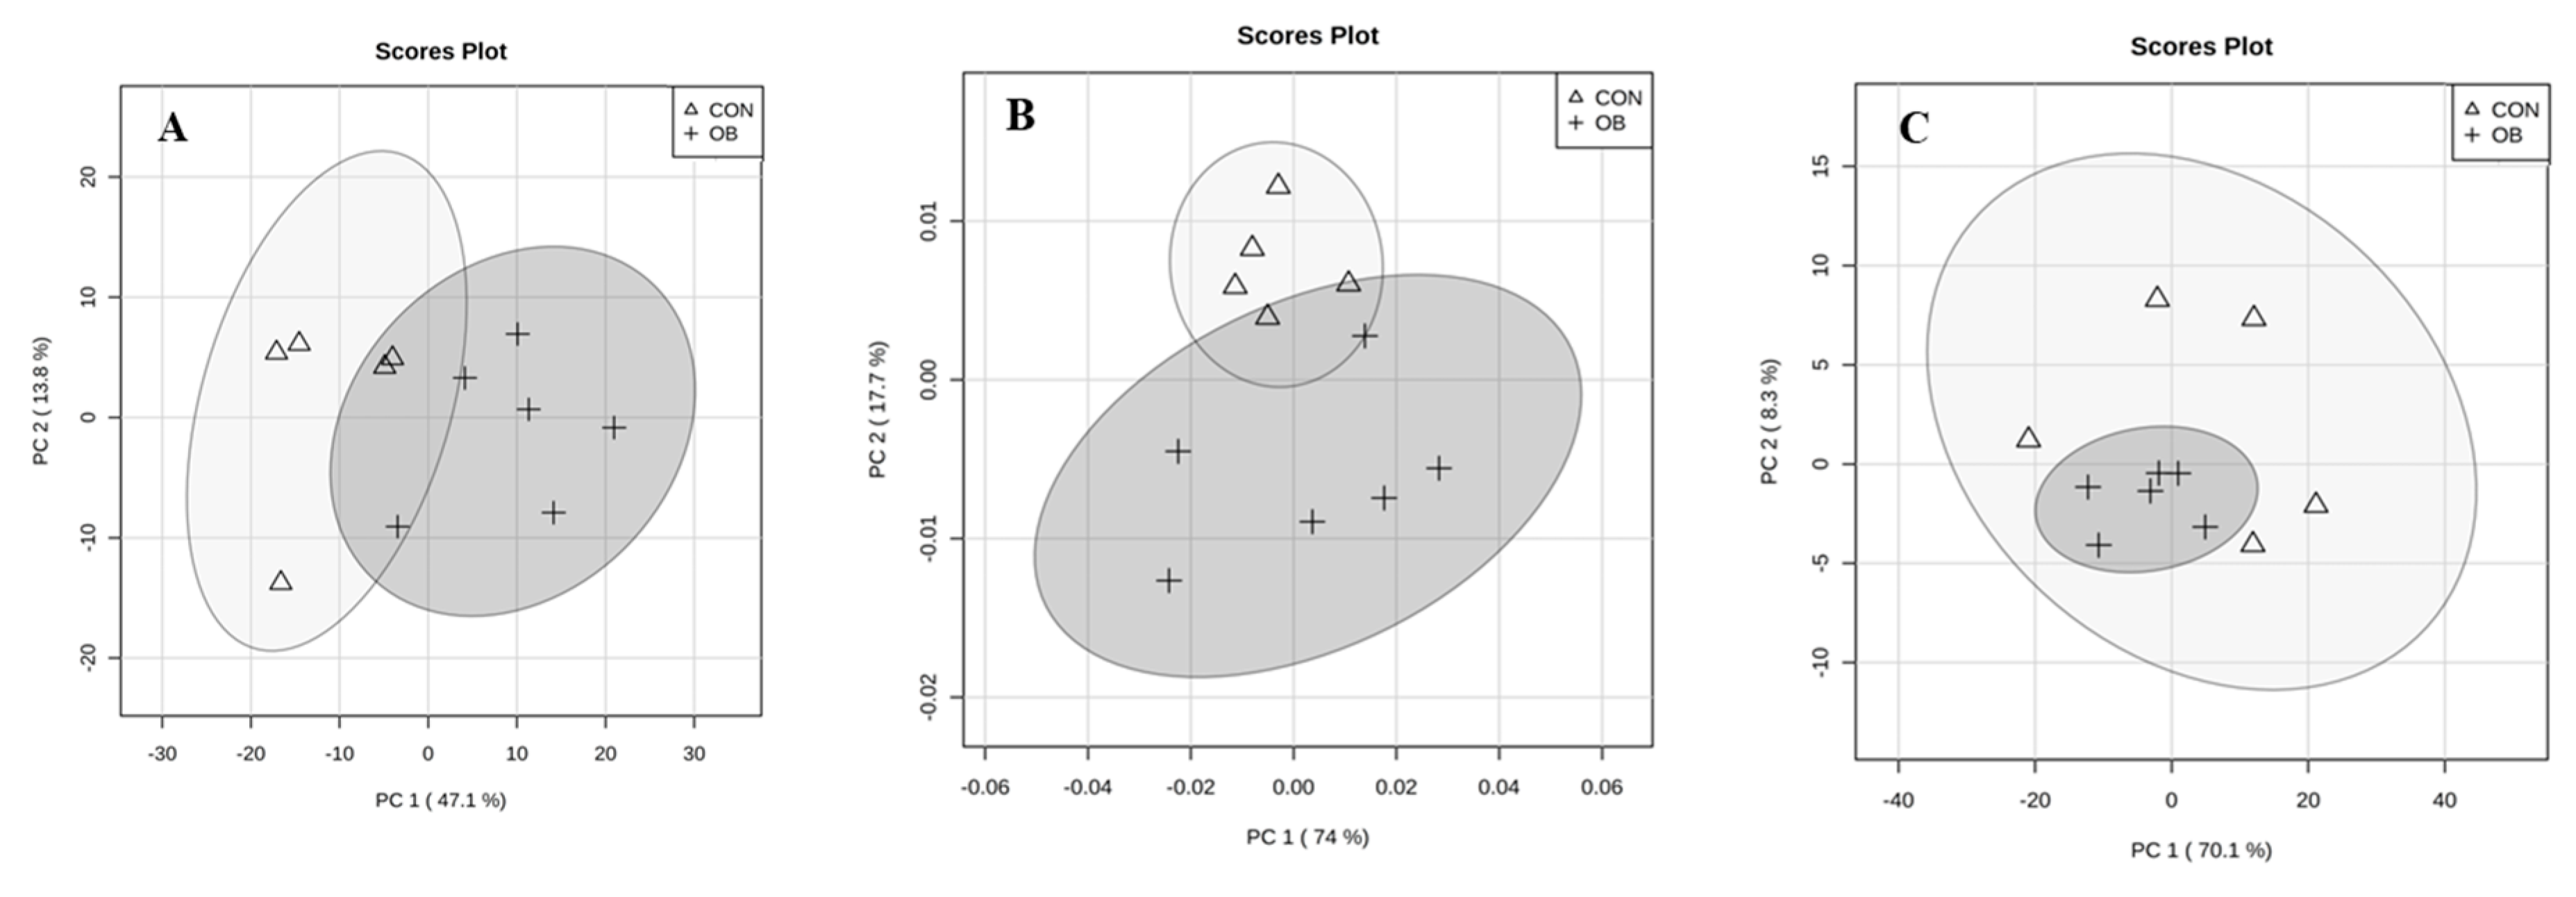
2. Results
3. Discussion
4. Materials and Methods
4.1. Animals and Experimental Design
4.2. Nuclear Magnetic Resonance Data Acquisition and 2D Experiments
4.3. Statistical Analysis
Author Contributions
Funding
Acknowledgments
Conflicts of Interest
References
- Gonzalez-Franquesa, A.; Burkart, A.M.; Isganaitis, E.; Patti, M.-E.E. What have metabolomics approaches taught us about Type 2 Diabetes? Curr. Diabetes Rep. 2016, 16, 74. [Google Scholar] [CrossRef] [PubMed]
- Perleberg, C.; Kind, A.; Schnieke, A. Genetically engineered pigs as models for human disease. Dis. Model. Mech. 2018, 11. [Google Scholar] [CrossRef] [PubMed]
- Torres-Rovira, L.; Astiz, S.; Caro, A.; Lopez-Bote, C.; Ovilo, C.; Pallares, P.; Perez-Solana, M.L.; Sanchez-Sanchez, R.; Gonzalez-Bulnes, A. Diet-induced swine model with obesity/leptin resistance for the study of metabolic syndrome and type 2 diabetes. Sci. World J. 2012, 2012, 1–8. [Google Scholar] [CrossRef]
- Heitmann, B.L.; Westerterp, K.R.; Loos, R.J.F.; Sørensen, T.I.A.; O’Dea, K.; McLean, P.; Jensen, T.K.; Eisenmann, J.; Speakman, J.R.; Simpson, S.J.; et al. Obesity: Lessons from evolution and the environment. Obes. Rev. 2012, 13, 910–922. [Google Scholar] [CrossRef]
- Newgard, C.B.; An, J.; Bain, J.R.; Muehlbauer, M.J.; Stevens, R.D.; Lien, L.F.; Haqq, A.M.; Shah, S.H.; Arlotto, M.; Slentz, C.A.; et al. A branched-chain amino acid-related metabolic signature that differentiates obese and lean humans and contributes to insulin resistance. Cell Metab. 2009, 9, 311–326. [Google Scholar] [CrossRef]
- Cheng, S.; Rhee, E.P.; Larson, M.G.; Lewis, G.D.; McCabe, E.L.; Shen, D.; Palma, M.J.; Roberts, L.D.; Dejam, A.; Souza, A.L.; et al. Metabolite profiling identifies pathways associated with metabolic risk in humans. Circulation 2012, 125, 2222–2231. [Google Scholar] [CrossRef]
- Wang, T.J.; Larson, M.G.; Vasan, R.S.; Cheng, S.; Rhee, E.P.; McCabe, E.; Lewis, G.D.; Fox, C.S.; Jacques, P.F.; Fernandez, C.; et al. Metabolite profiles and the risk of developing diabetes. Nat. Med. 2011, 17, 448–453. [Google Scholar] [CrossRef]
- Bagheri, M.; Farzadfar, F.; Qi, L.; Yekaninejad, M.S.; Chamari, M.; Zeleznik, O.A.; Kalantar, Z.; Ebrahimi, Z.; Sheidaie, A.; Koletzko, B.; et al. Obesity-related metabolomic profiles and discrimination of metabolically unhealthy obesity. J. Proteome Res. 2018, 17, 1452–1462. [Google Scholar] [CrossRef]
- Walford, G.A.; Ma, Y.; Clish, C.; Florez, J.C.; Wang, T.J.; Gerszten, R.E. Metabolite profiles of diabetes incidence and intervention response in the diabetes prevention program. Diabetes 2016, 65, 1424–1433. [Google Scholar] [CrossRef]
- Figueroa-Soto, C.G.; Valenzuela-Soto, E.M. Glycine betaine rather than acting only as an osmolyte also plays a role as regulator in cellular metabolism. Biochimie 2018, 147, 89–97. [Google Scholar] [CrossRef]
- Chen, Y.M.; Liu, Y.; Liu, Y.H.; Wang, X.; Guan, K.; Zhu, H.L. Higher serum concentrations of betaine rather than choline is associated with better profiles of DXA-derived body fat and fat distribution in Chinese adults. Int. J. Obes. 2015, 39, 465–471. [Google Scholar] [CrossRef] [PubMed]
- Ejaz, A.; Martinez-Guino, L.; Goldfine, A.B.; Ribas-Aulinas, F.; De Nigris, V.; Ribó, S.; Gonzalez-Franquesa, A.; Garcia-Roves, P.M.; Li, E.; Dreyfuss, J.M.; et al. Dietary betaine supplementation increases Fgf21 levels to improve glucose homeostasis and reduce hepatic lipid accumulation in mice. Diabetes 2016, 65, 902–912. [Google Scholar] [CrossRef] [PubMed]
- Cholewa, J.M.; Guimarães-Ferreira, L.; Zanchi, N.E. Effects of betaine on performance and body composition: A review of recent findings and potential mechanisms. Amino Acids 2014, 46, 1785–1793. [Google Scholar] [CrossRef]
- Du, J.; Shen, L.; Tan, Z.; Zhang, P.; Zhao, X.; Xu, Y.; Gan, M.; Yang, Q.; Ma, J.; Jiang, A.; et al. Betaine supplementation enhances lipid metabolism and improves insulin resistance in mice fed a high-fat diet. Nutrients 2018, 10, 131. [Google Scholar] [CrossRef] [PubMed]
- Alcorn, C.; Cuperlovic-Culf, M.; Ghandi, K. Comparison of the computational NMR chemical shifts of choline with the experimental data. J. Phys. Conf. Ser. 2012, 341, 12013. [Google Scholar] [CrossRef]
- Gao, X.; Wang, Y.; Randell, E.; Pedram, P.; Yi, Y.; Gulliver, W.; Sun, G. Higher dietary choline and betaine intakes are associated with better body composition in the adult population of Newfoundland, Canada. PLoS ONE 2016, 11, e0155403. [Google Scholar] [CrossRef]
- Ueland, P.M. Choline and betaine in health and disease. J. Inherit. Metab. Dis. 2011, 34, 3–15. [Google Scholar] [CrossRef]
- Lever, M.; George, P.M.; Dellow, W.J.; Scott, R.S.; Chambers, S.T. Homocysteine, glycine betaine, and N,N-dimethylglycine in patients attending a lipid clinic. Metabolism 2005, 54, 1–14. [Google Scholar] [CrossRef]
- Humphrey, L.L.; Fu, R.; Rogers, K.; Freeman, M.; Helfand, M. Homocysteine level and coronary heart disease incidence: A systematic review and meta-analysis. Mayo Clin. Proc. 2008, 83, 1203–1212. [Google Scholar] [CrossRef]
- Tzotzas, T.; Evangelou, P.; Kiortsis, D.N. Obesity, weight loss and conditional cardiovascular risk factors. Obes. Rev. 2011, 12, e282–e289. [Google Scholar] [CrossRef]
- Bromage, T.G.; Idaghdour, Y.; Lacruz, R.S.; Crenshaw, T.D.; Ovsiy, O.; Rotter, B.; Hoffmeier, K.; Schrenk, F. The swine plasma metabolome chronicles "many days" biological timing and functions linked to growth. PLoS ONE. 2016, 11. [Google Scholar] [CrossRef] [PubMed]
- Sitter, B.; Bathen, T.F.; Tessem, M.B.; Gribbestad, I.S. High-resolution magic angle spinning (HR MAS) MR spectroscopy in metabolic characterization of human cancer. Prog. Nucl. Magn. Reson. Spectrosc. 2009, 54, 239–254. [Google Scholar] [CrossRef]
- Beckonert, O.; Coen, M.; Keun, H.C.; Wang, Y.; Ebbels, T.M.D.; Holmes, E.; Lindon, J.C.; Nicholson, J.K. High-resolution magic-angle-spinning NMR spectroscopy for metabolic profiling of intact tissues. Nat. Protoc. 2010, 5, 1019–1032. [Google Scholar] [CrossRef]


| Intensity, A.U. | Control | Obese | Trt 1 | ||
|---|---|---|---|---|---|
| LSMEAN | SEM | LSMEAN | SEM | P-Value | |
| Plasma | |||||
| Betaine (3.27 ppm) | 0.00936 | 0.00026 | 0.00565 | 0.00024 | <0.0001 |
| GPCho 2 or PCho 3 (3.23 ppm) | 0.00921 | 0.00015 | 0.00797 | 0.00014 | 0.0002 |
| Glycine (3.55 ppm) | 0.00712 | 0.00016 | 0.00535 | 0.00015 | <0.0001 |
| Glutamate (2.35 ppm) | 0.00457 | 0.00023 | 0.00218 | 0.00021 | <0.0001 |
| Valine (2.29 ppm) | 0.00144 | 0.00003 | 0.00176 | 0.00003 | <0.0001 |
| Liver | |||||
| Betaine (3.28 ppm) | 0.02668 | 0.00082 | 0.01741 | 0.00075 | <0.0001 |
| 4-aminoadipate (2.24 ppm) | 0.00054 | 0.00004 | 0.00102 | 0.00004 | <0.0001 |
© 2020 by the authors. Licensee MDPI, Basel, Switzerland. This article is an open access article distributed under the terms and conditions of the Creative Commons Attribution (CC BY) license (http://creativecommons.org/licenses/by/4.0/).
Share and Cite
Sanz-Fernandez, M.V.; Torres-Rovira, L.; Pesantez-Pacheco, J.L.; Vazquez-Gomez, M.; Garcia-Contreras, C.; Astiz, S.; Gonzalez-Bulnes, A. A Cross-Sectional Study of Obesity Effects on the Metabolomic Profile of a Leptin-Resistant Swine Model. Metabolites 2020, 10, 89. https://doi.org/10.3390/metabo10030089
Sanz-Fernandez MV, Torres-Rovira L, Pesantez-Pacheco JL, Vazquez-Gomez M, Garcia-Contreras C, Astiz S, Gonzalez-Bulnes A. A Cross-Sectional Study of Obesity Effects on the Metabolomic Profile of a Leptin-Resistant Swine Model. Metabolites. 2020; 10(3):89. https://doi.org/10.3390/metabo10030089
Chicago/Turabian StyleSanz-Fernandez, M. Victoria, Laura Torres-Rovira, Jose L. Pesantez-Pacheco, Marta Vazquez-Gomez, Consolacion Garcia-Contreras, Susana Astiz, and Antonio Gonzalez-Bulnes. 2020. "A Cross-Sectional Study of Obesity Effects on the Metabolomic Profile of a Leptin-Resistant Swine Model" Metabolites 10, no. 3: 89. https://doi.org/10.3390/metabo10030089
APA StyleSanz-Fernandez, M. V., Torres-Rovira, L., Pesantez-Pacheco, J. L., Vazquez-Gomez, M., Garcia-Contreras, C., Astiz, S., & Gonzalez-Bulnes, A. (2020). A Cross-Sectional Study of Obesity Effects on the Metabolomic Profile of a Leptin-Resistant Swine Model. Metabolites, 10(3), 89. https://doi.org/10.3390/metabo10030089