Simultaneous Measurement of Tricarboxylic Acid Cycle Intermediates in Different Biological Matrices Using Liquid Chromatography–Tandem Mass Spectrometry; Quantitation and Comparison of TCA Cycle Intermediates in Human Serum, Plasma, Kasumi-1 Cell and Murine Liver Tissue
Abstract
1. Introduction
2. Results and Discussion
2.1. Method Development
2.2. Method Validation
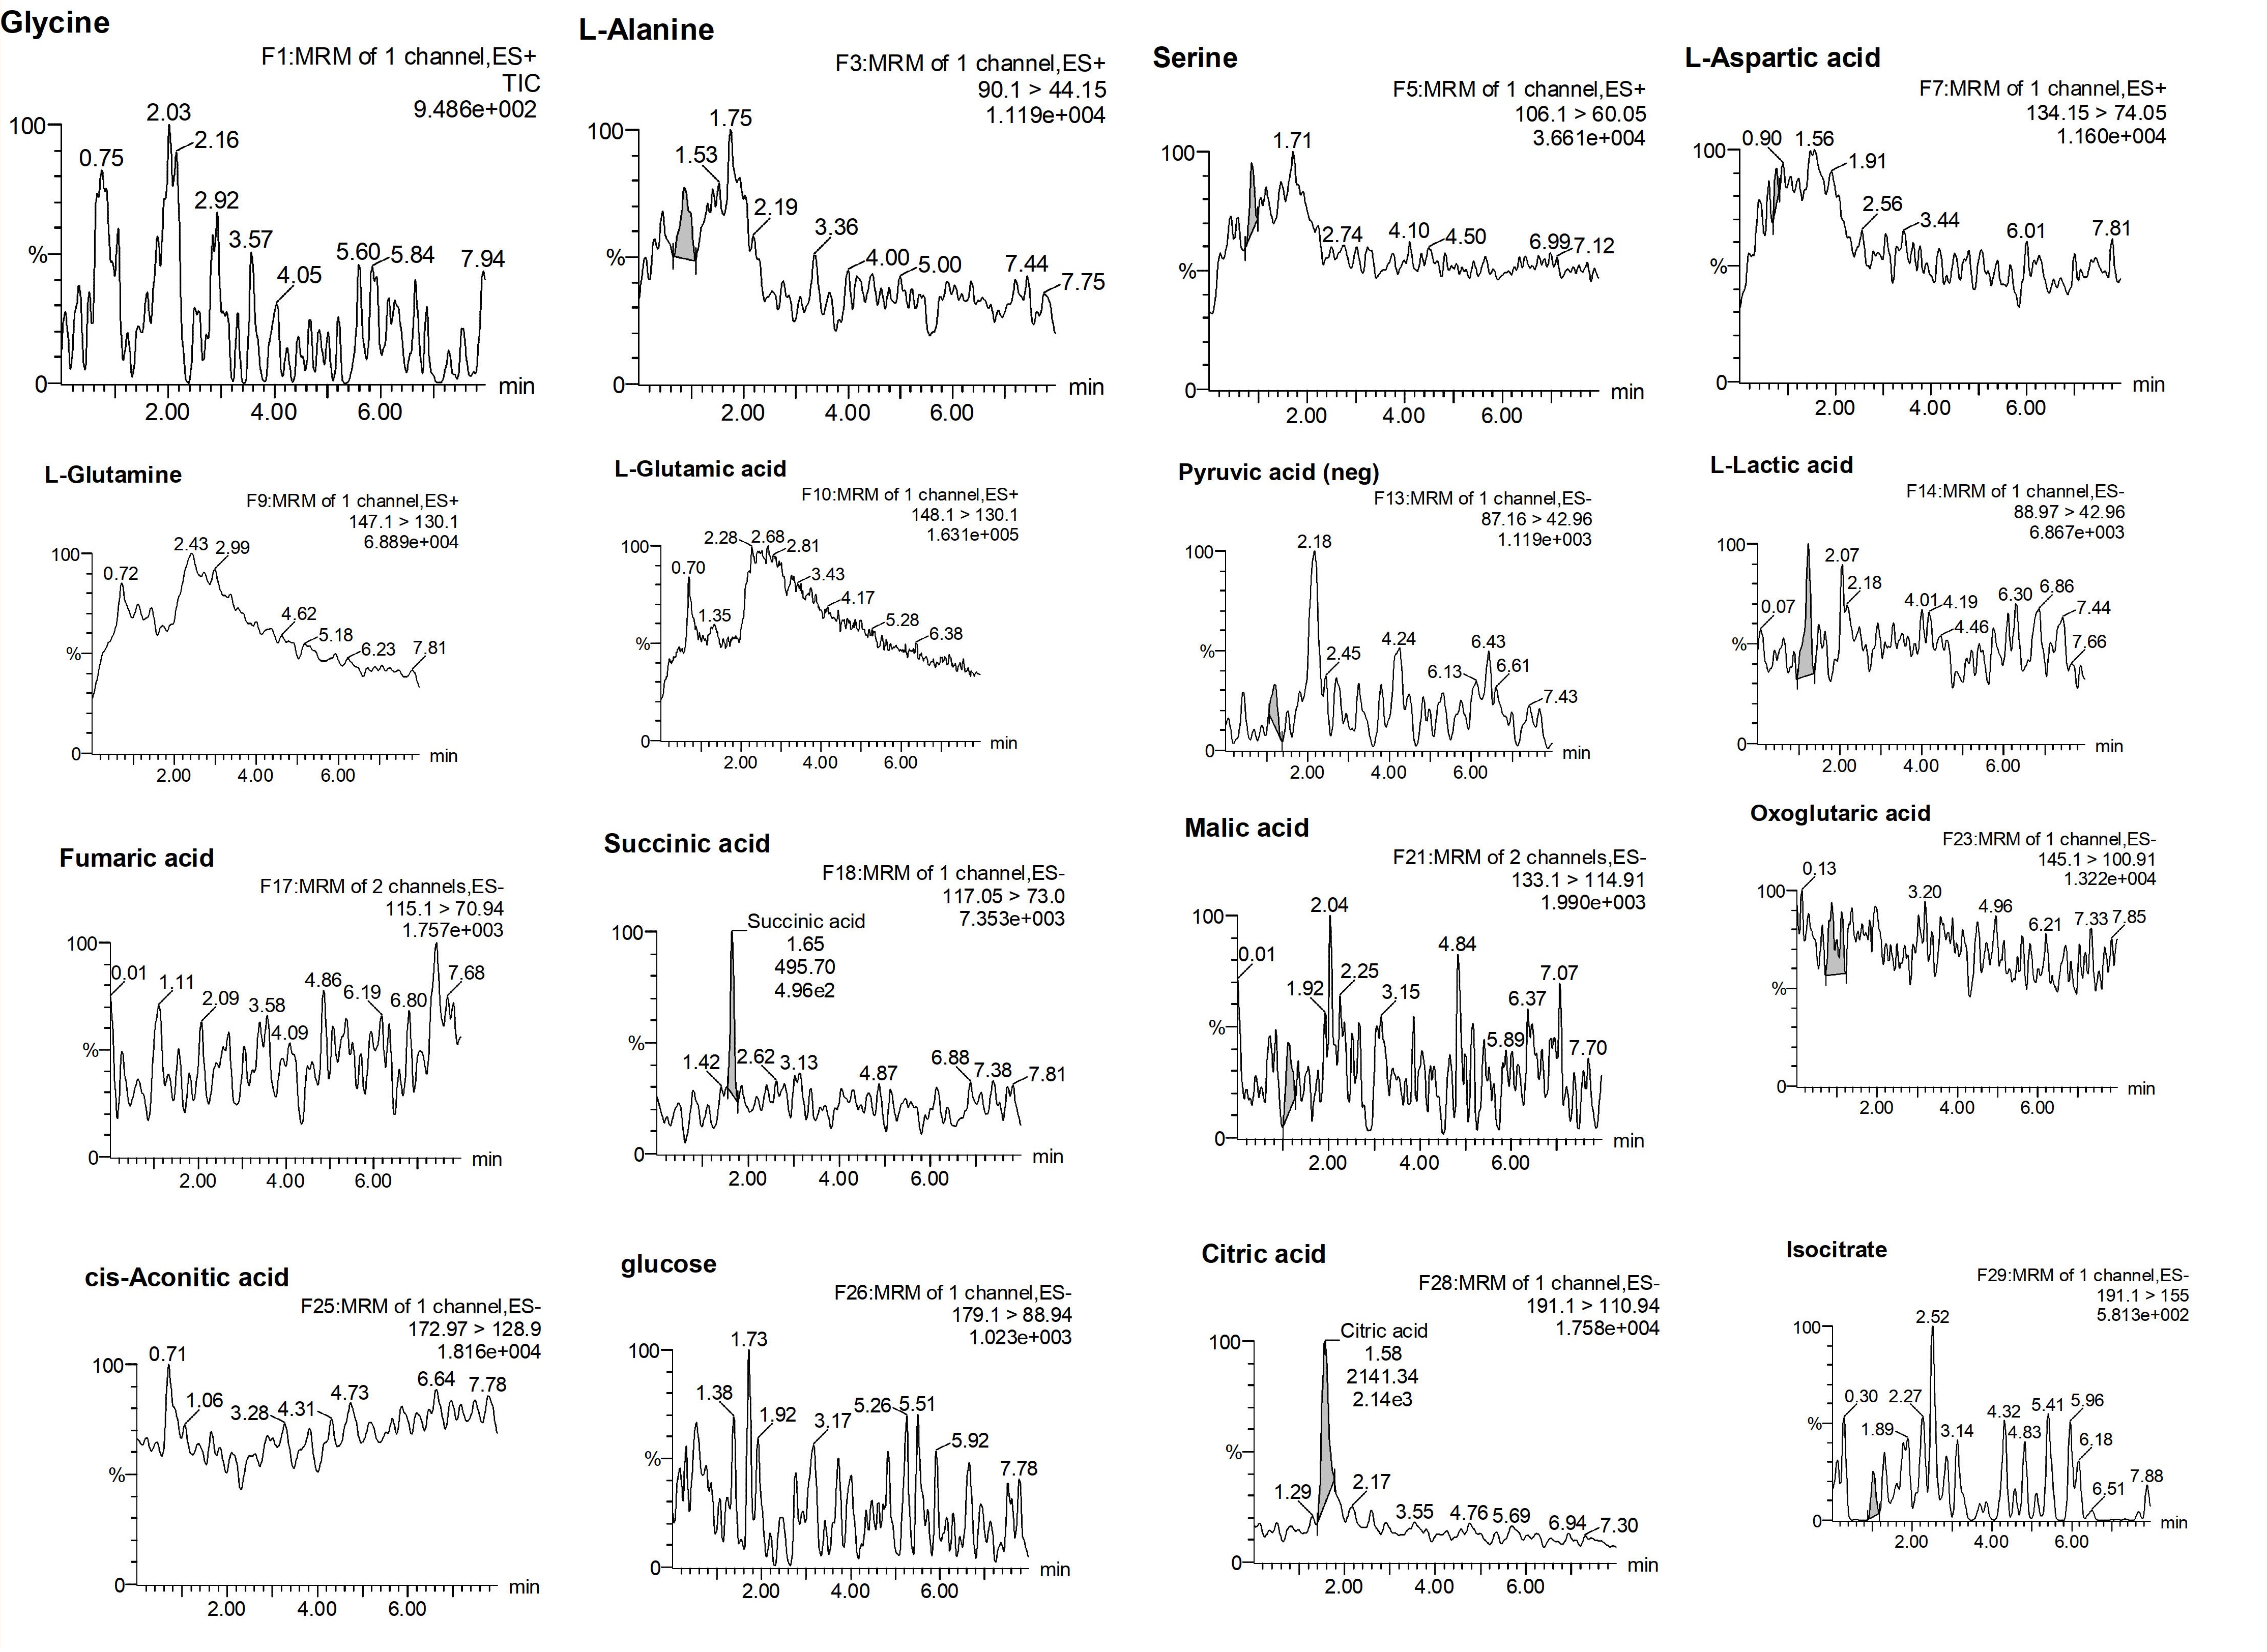
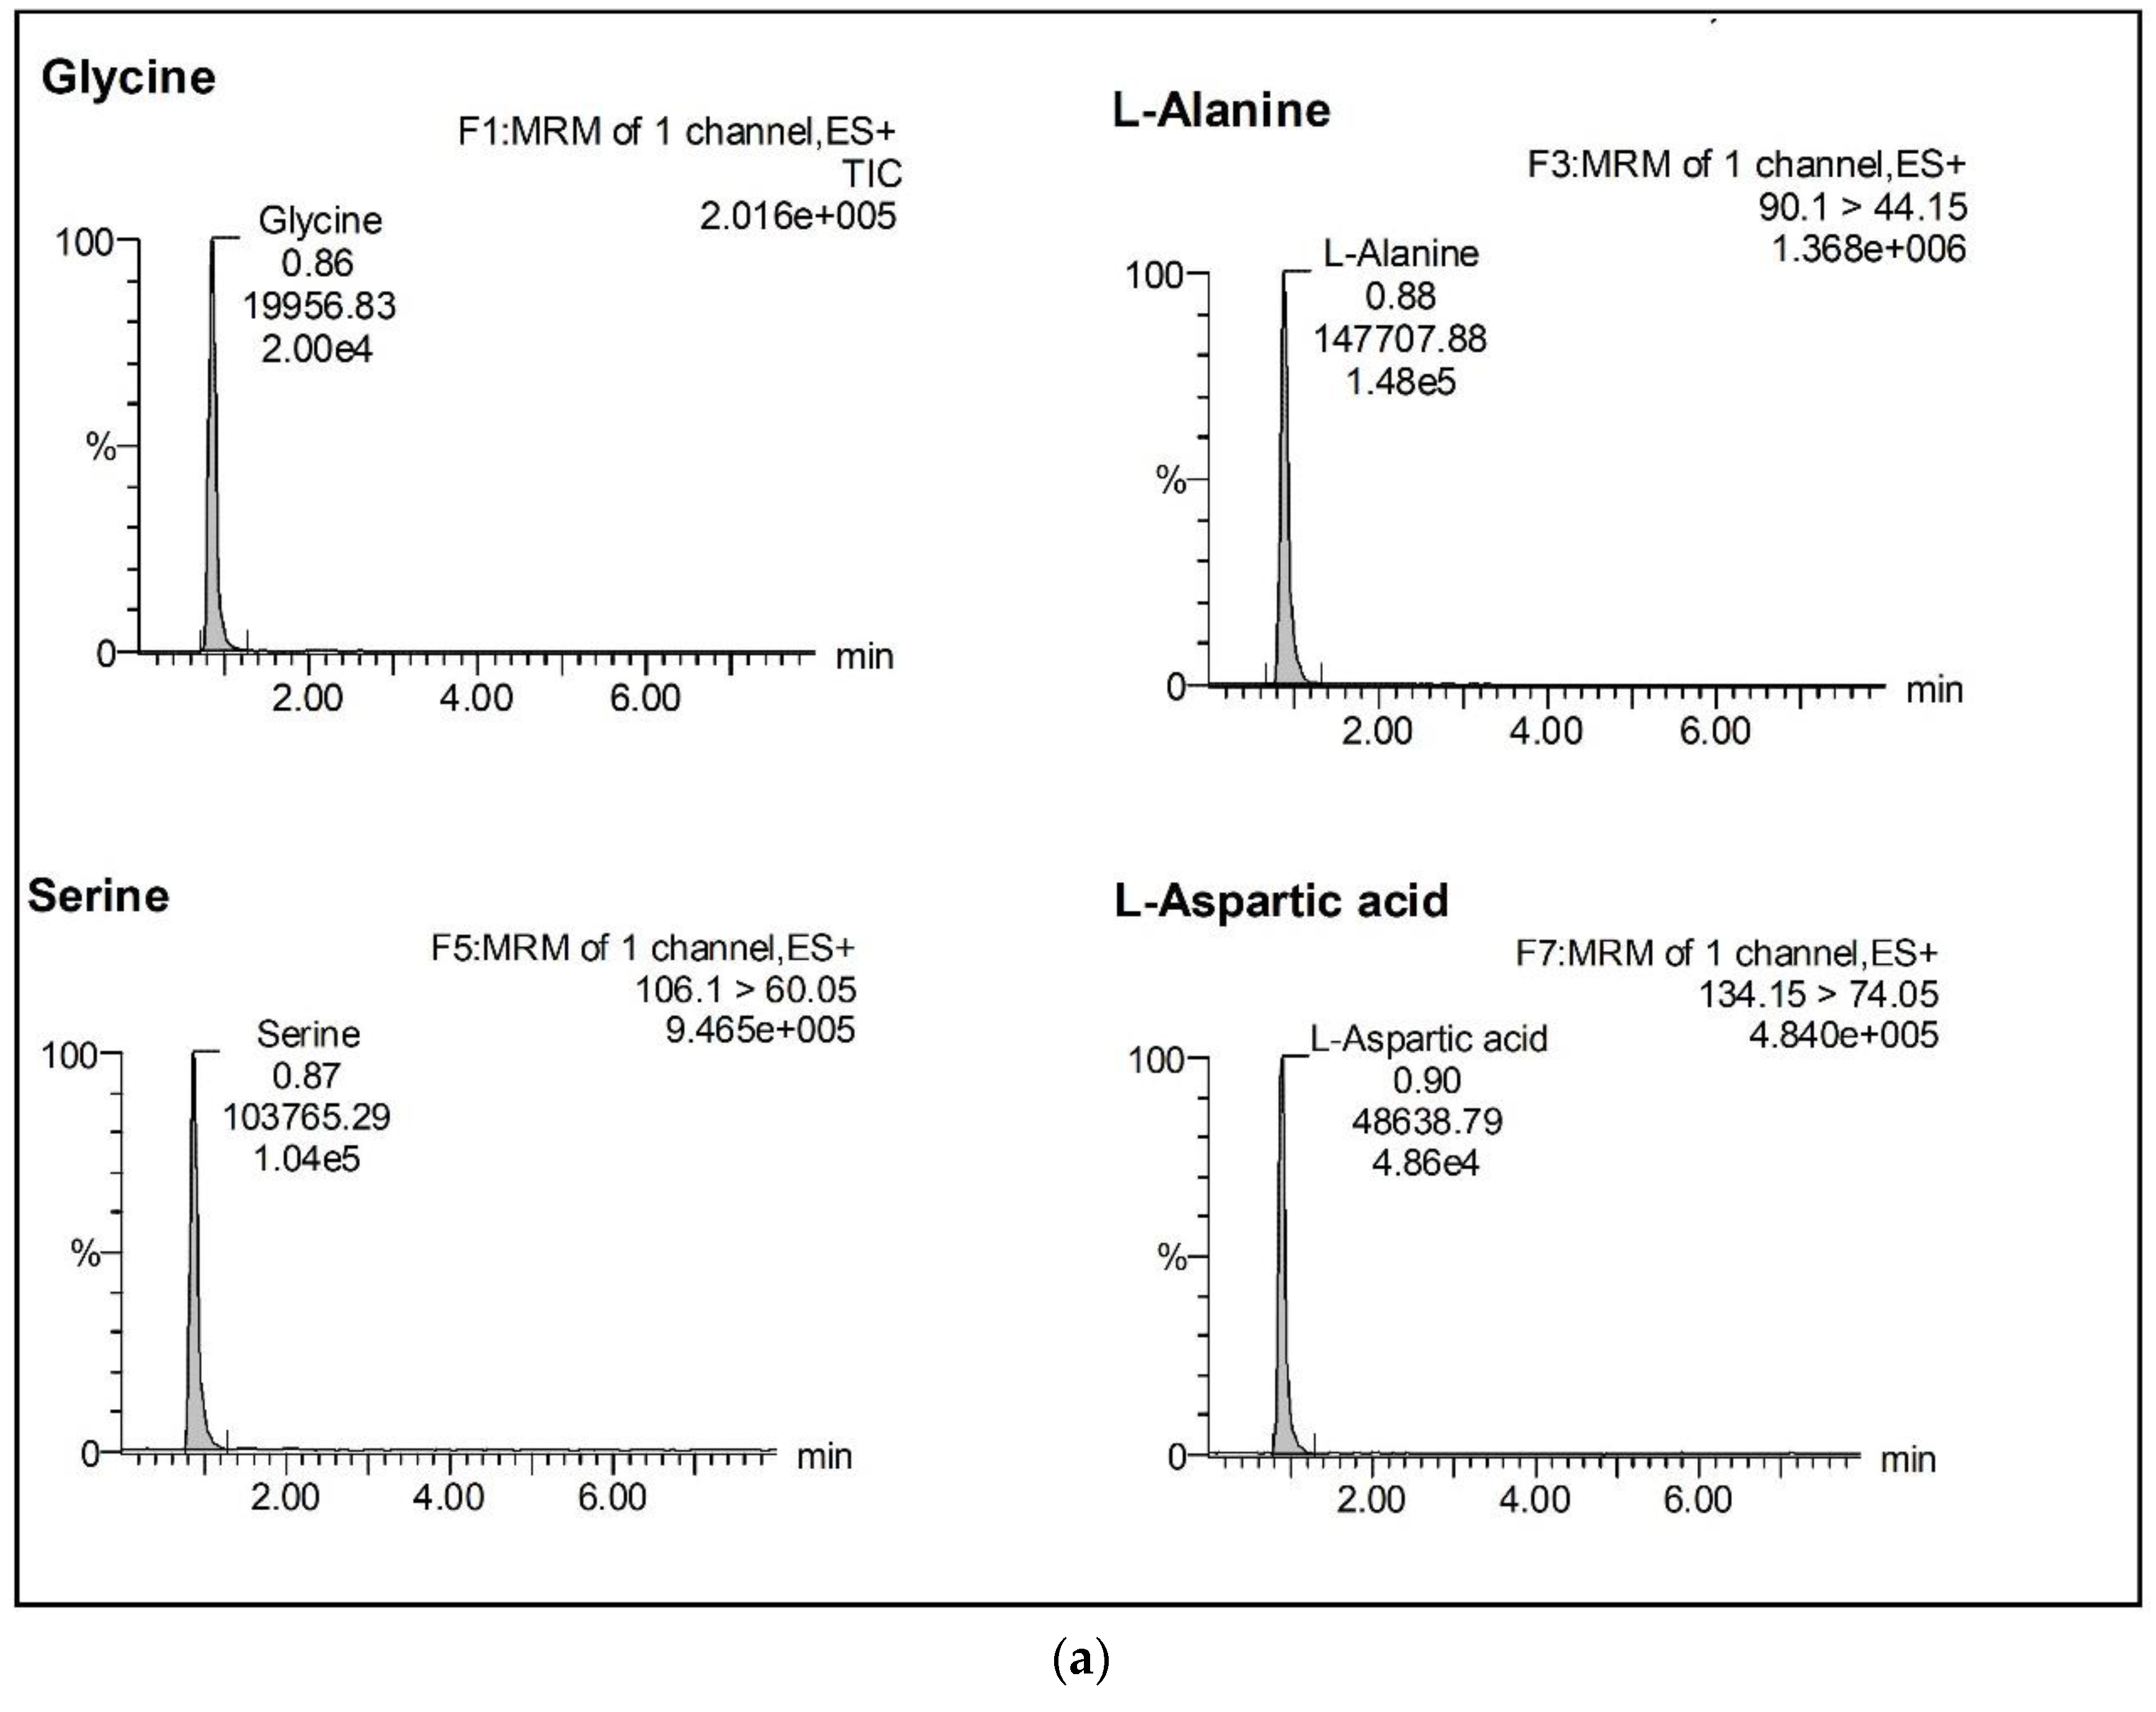
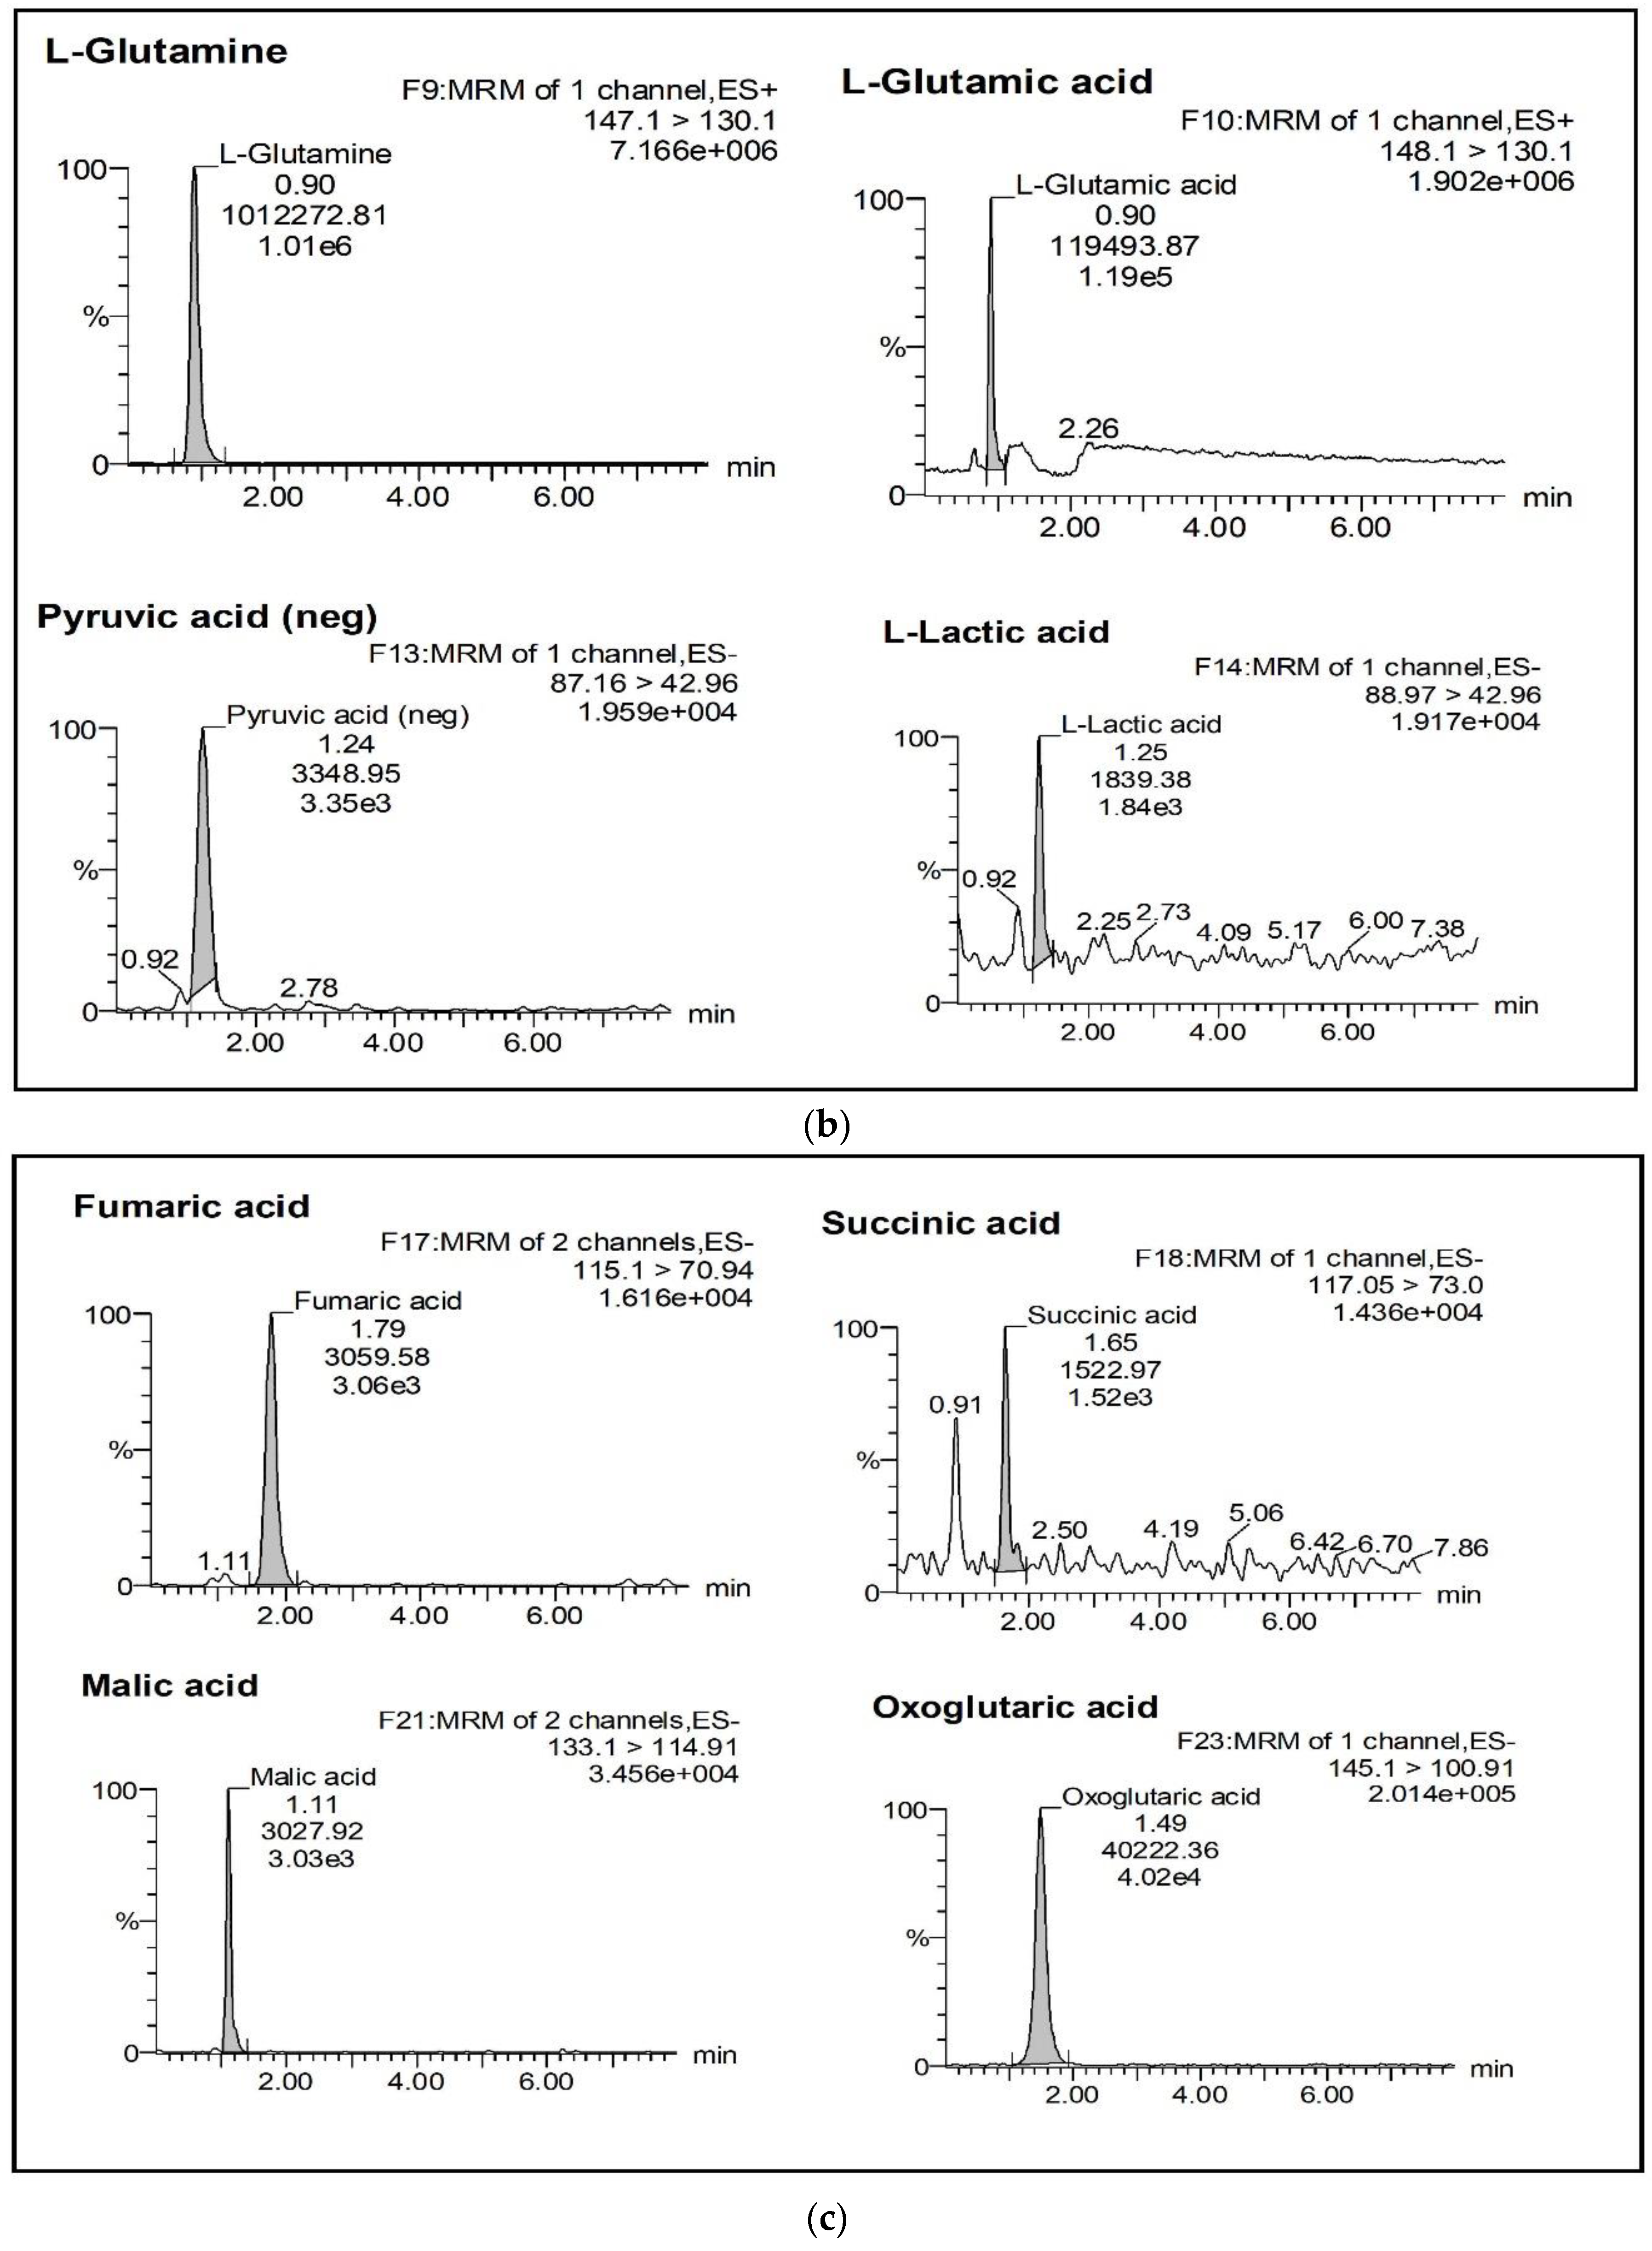
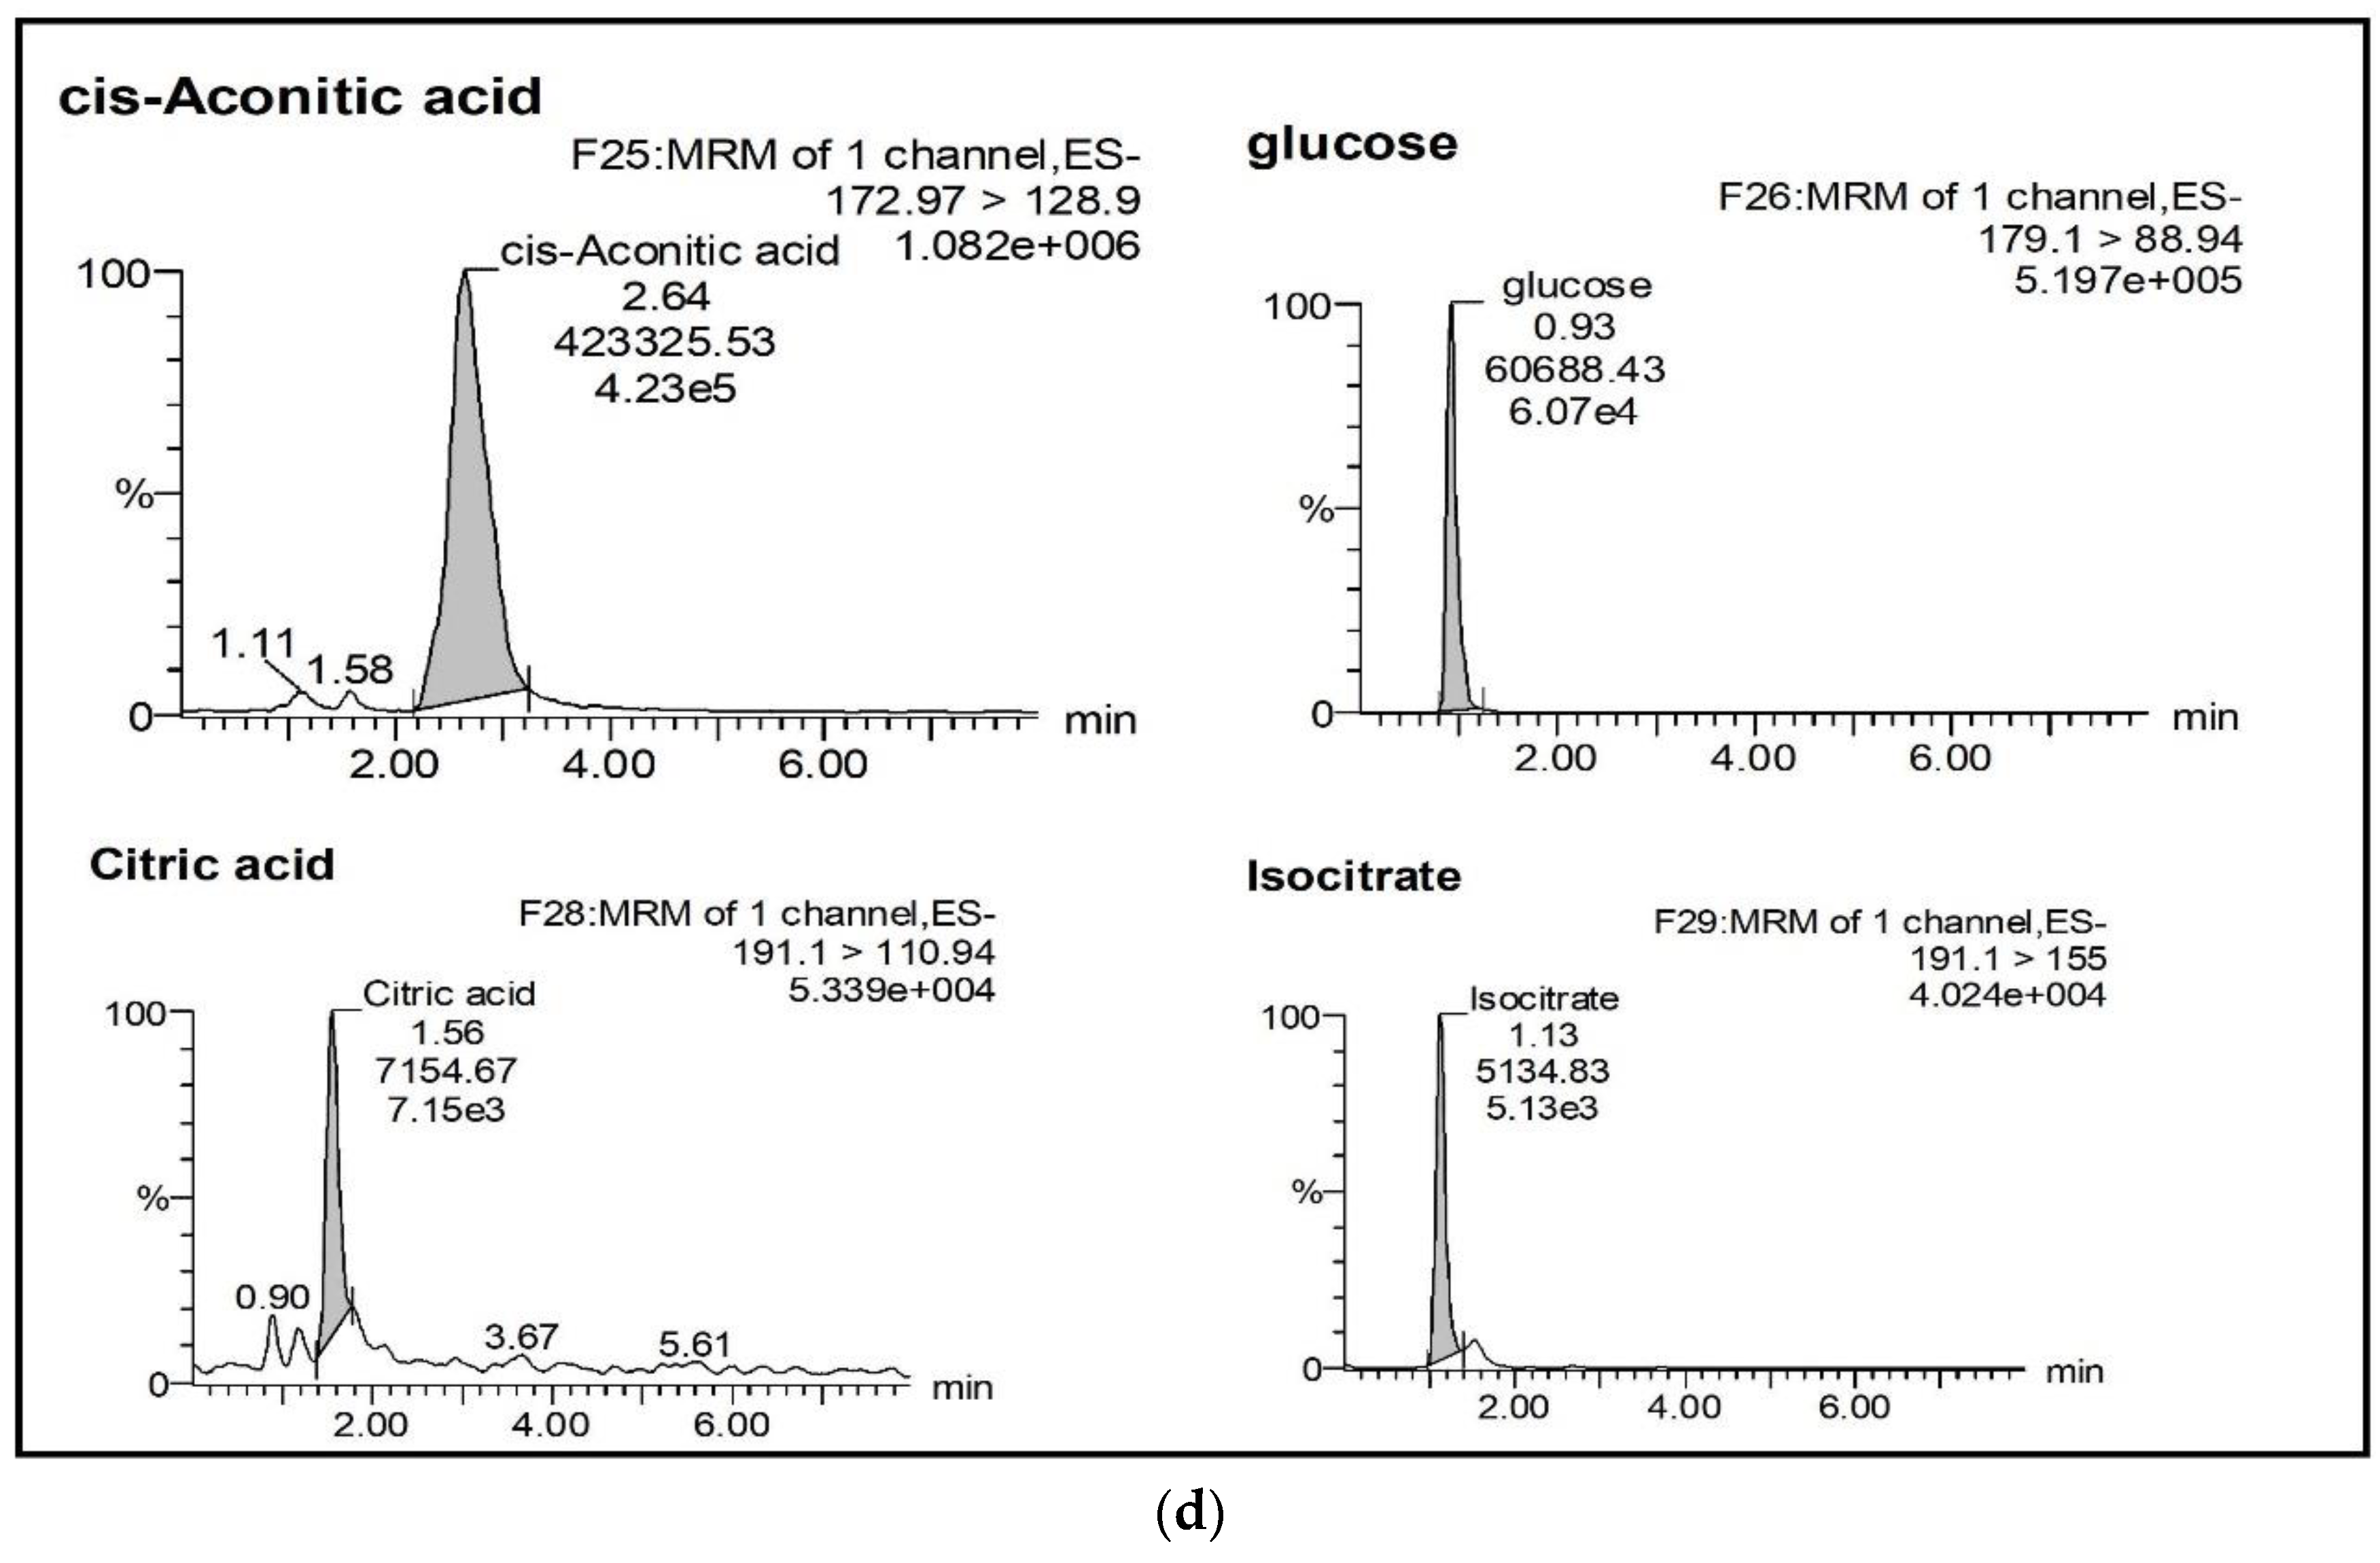
2.2.1. Selectivity and Specificity
2.2.2. Auto-Sampler Carryover
2.2.3. Linearity, Accuracy, and Precision
2.2.4. Recovery and Matrix Effect
2.2.5. Stability
2.2.6. Limit of Detection and Limit of Quantification
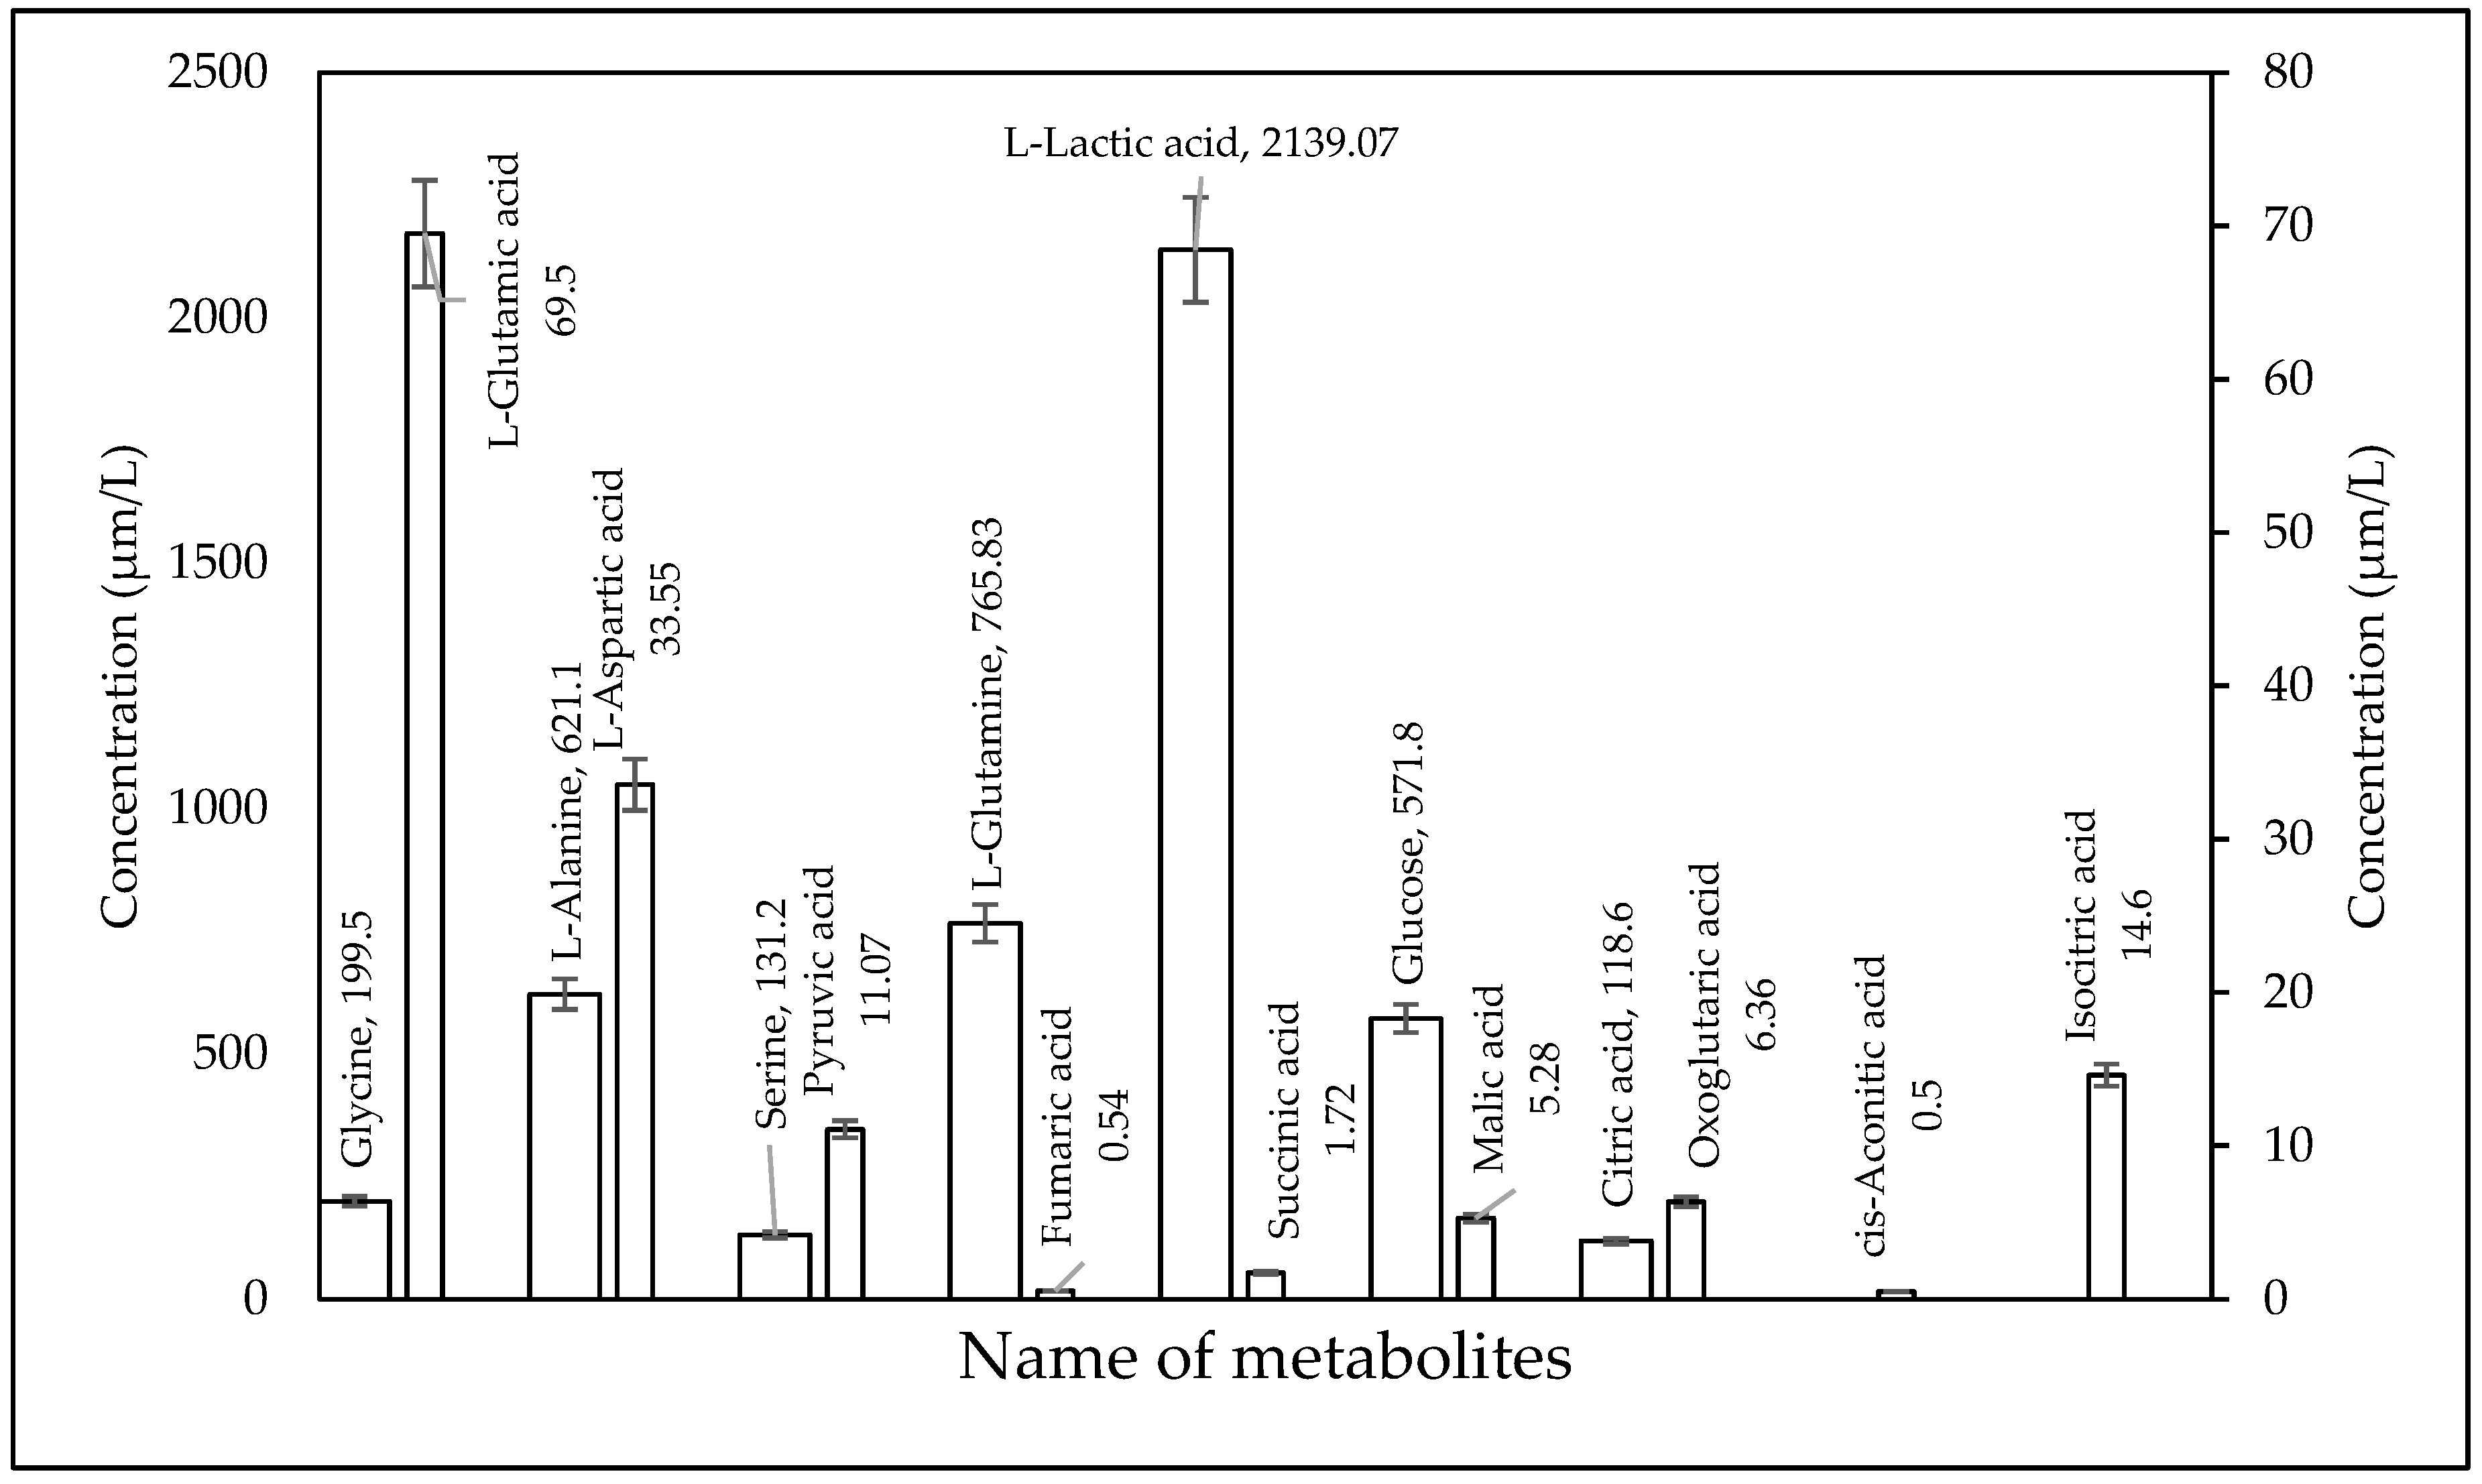
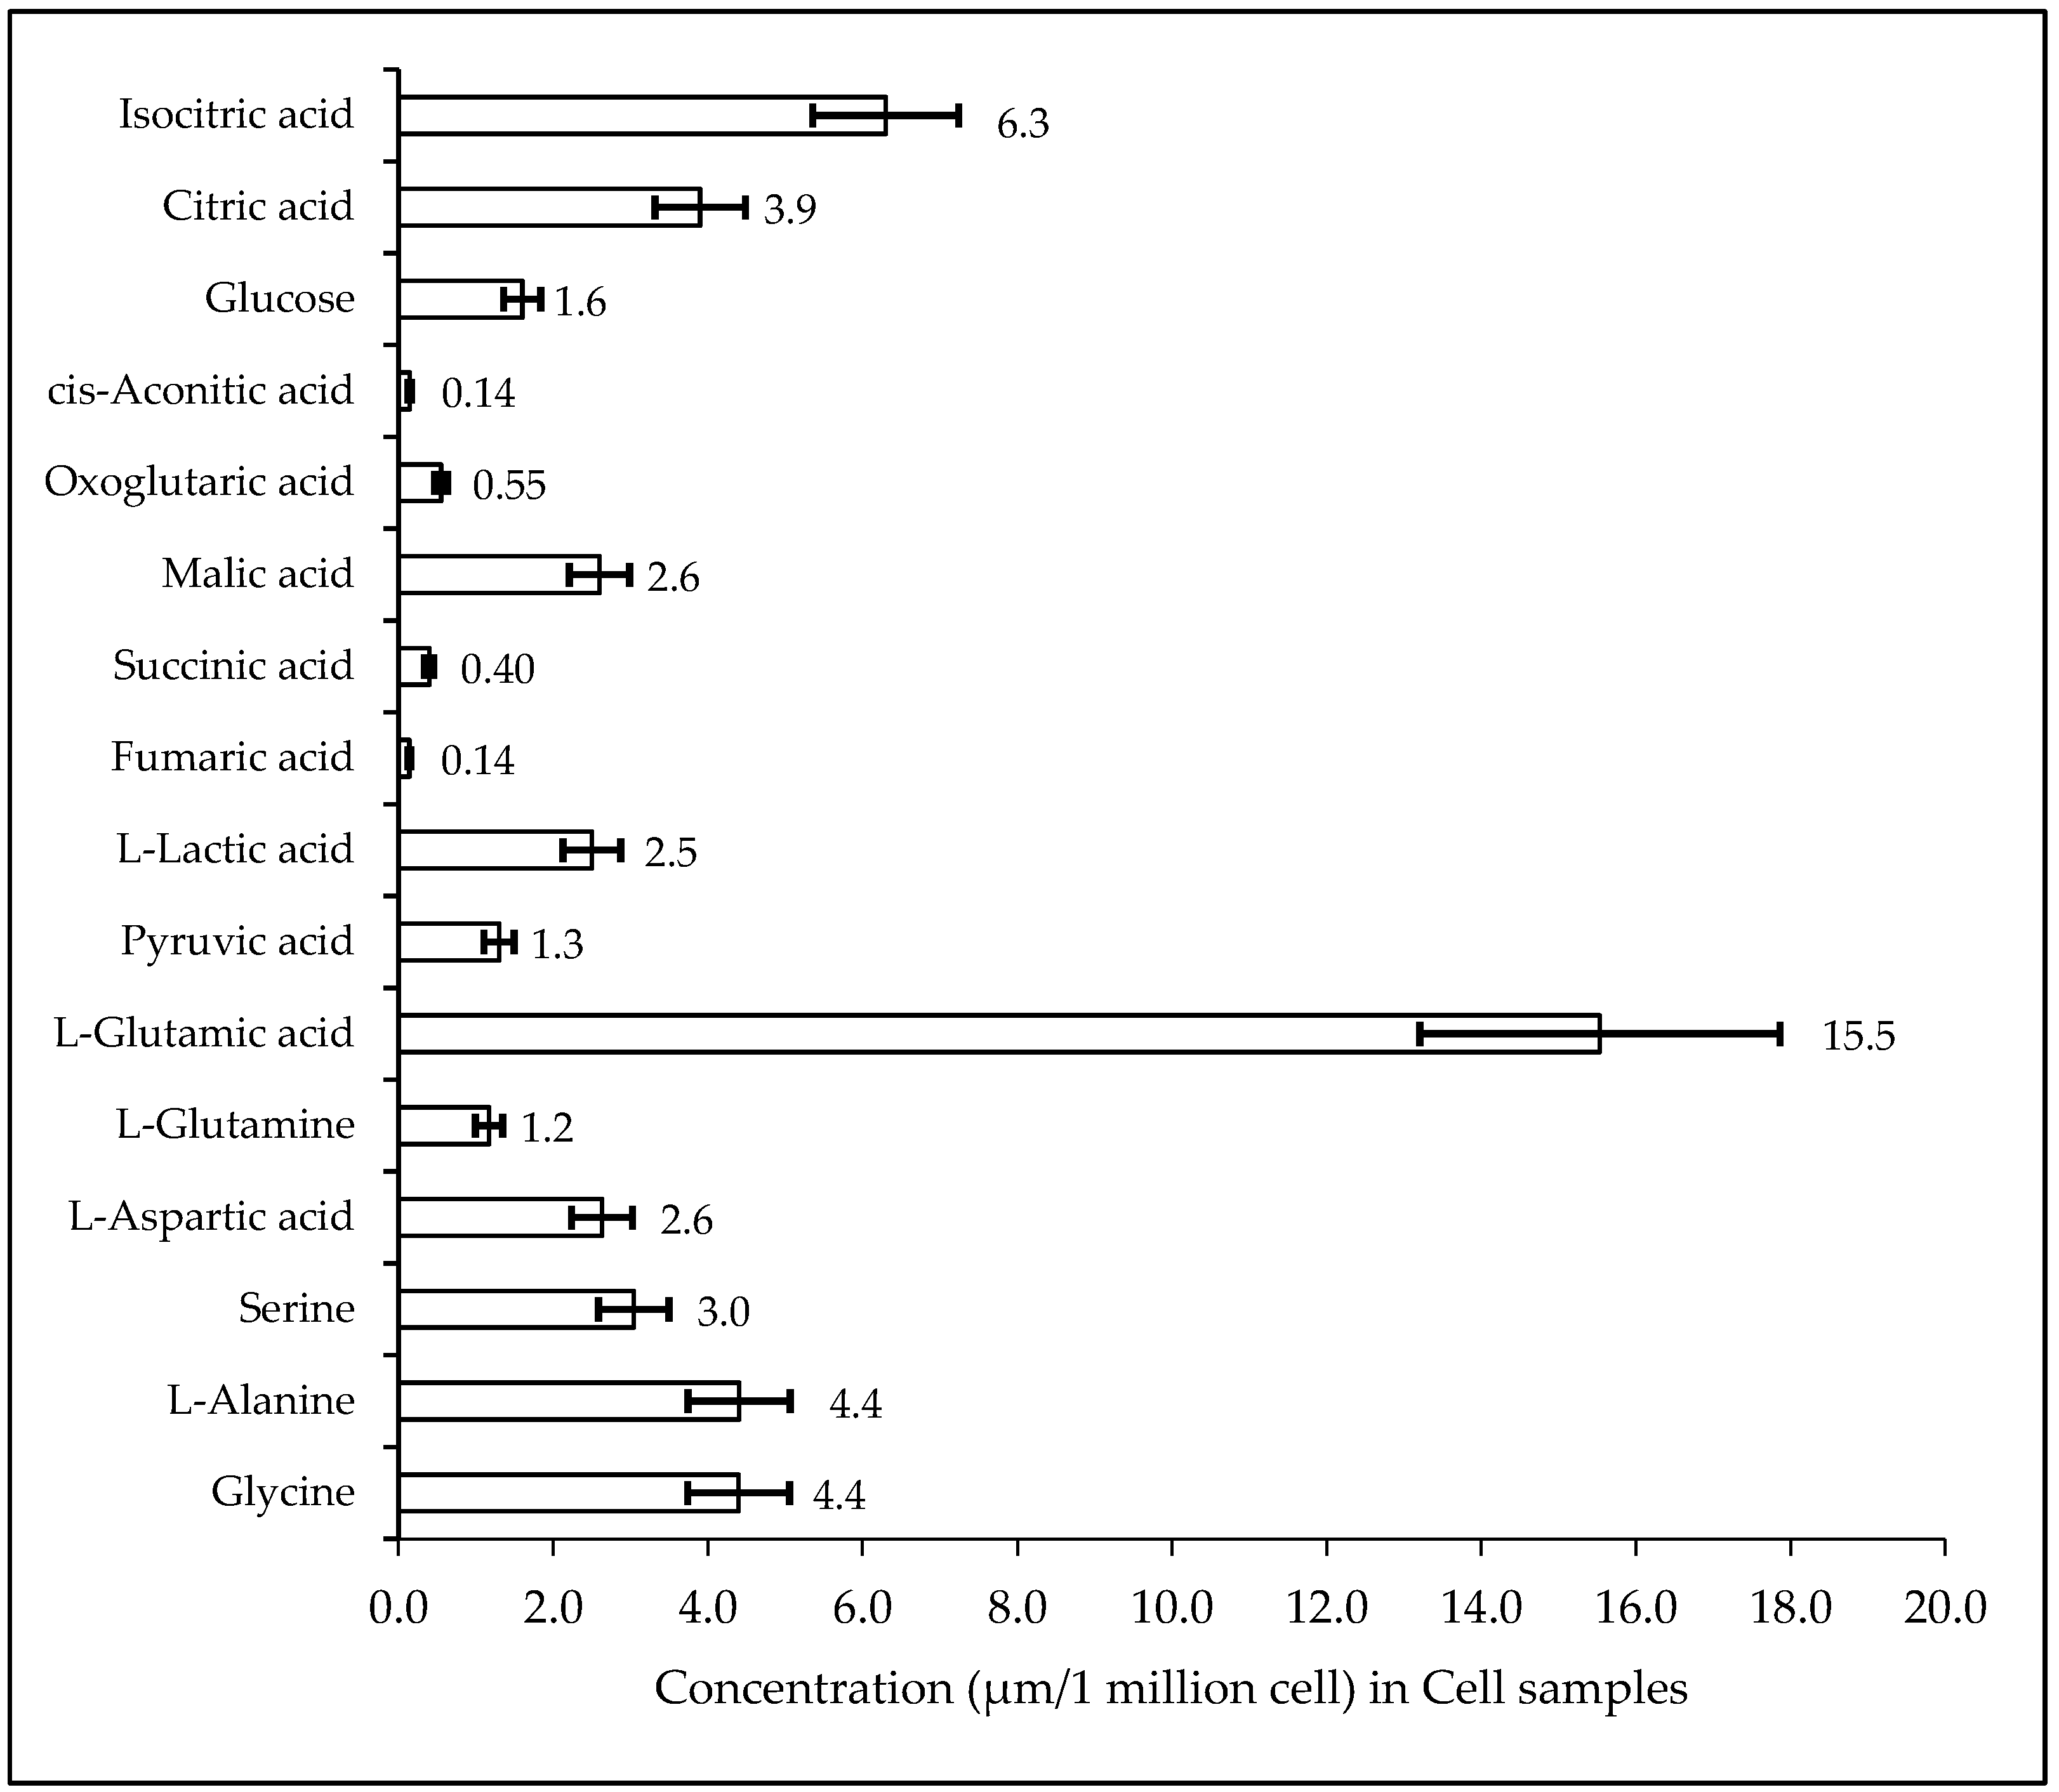
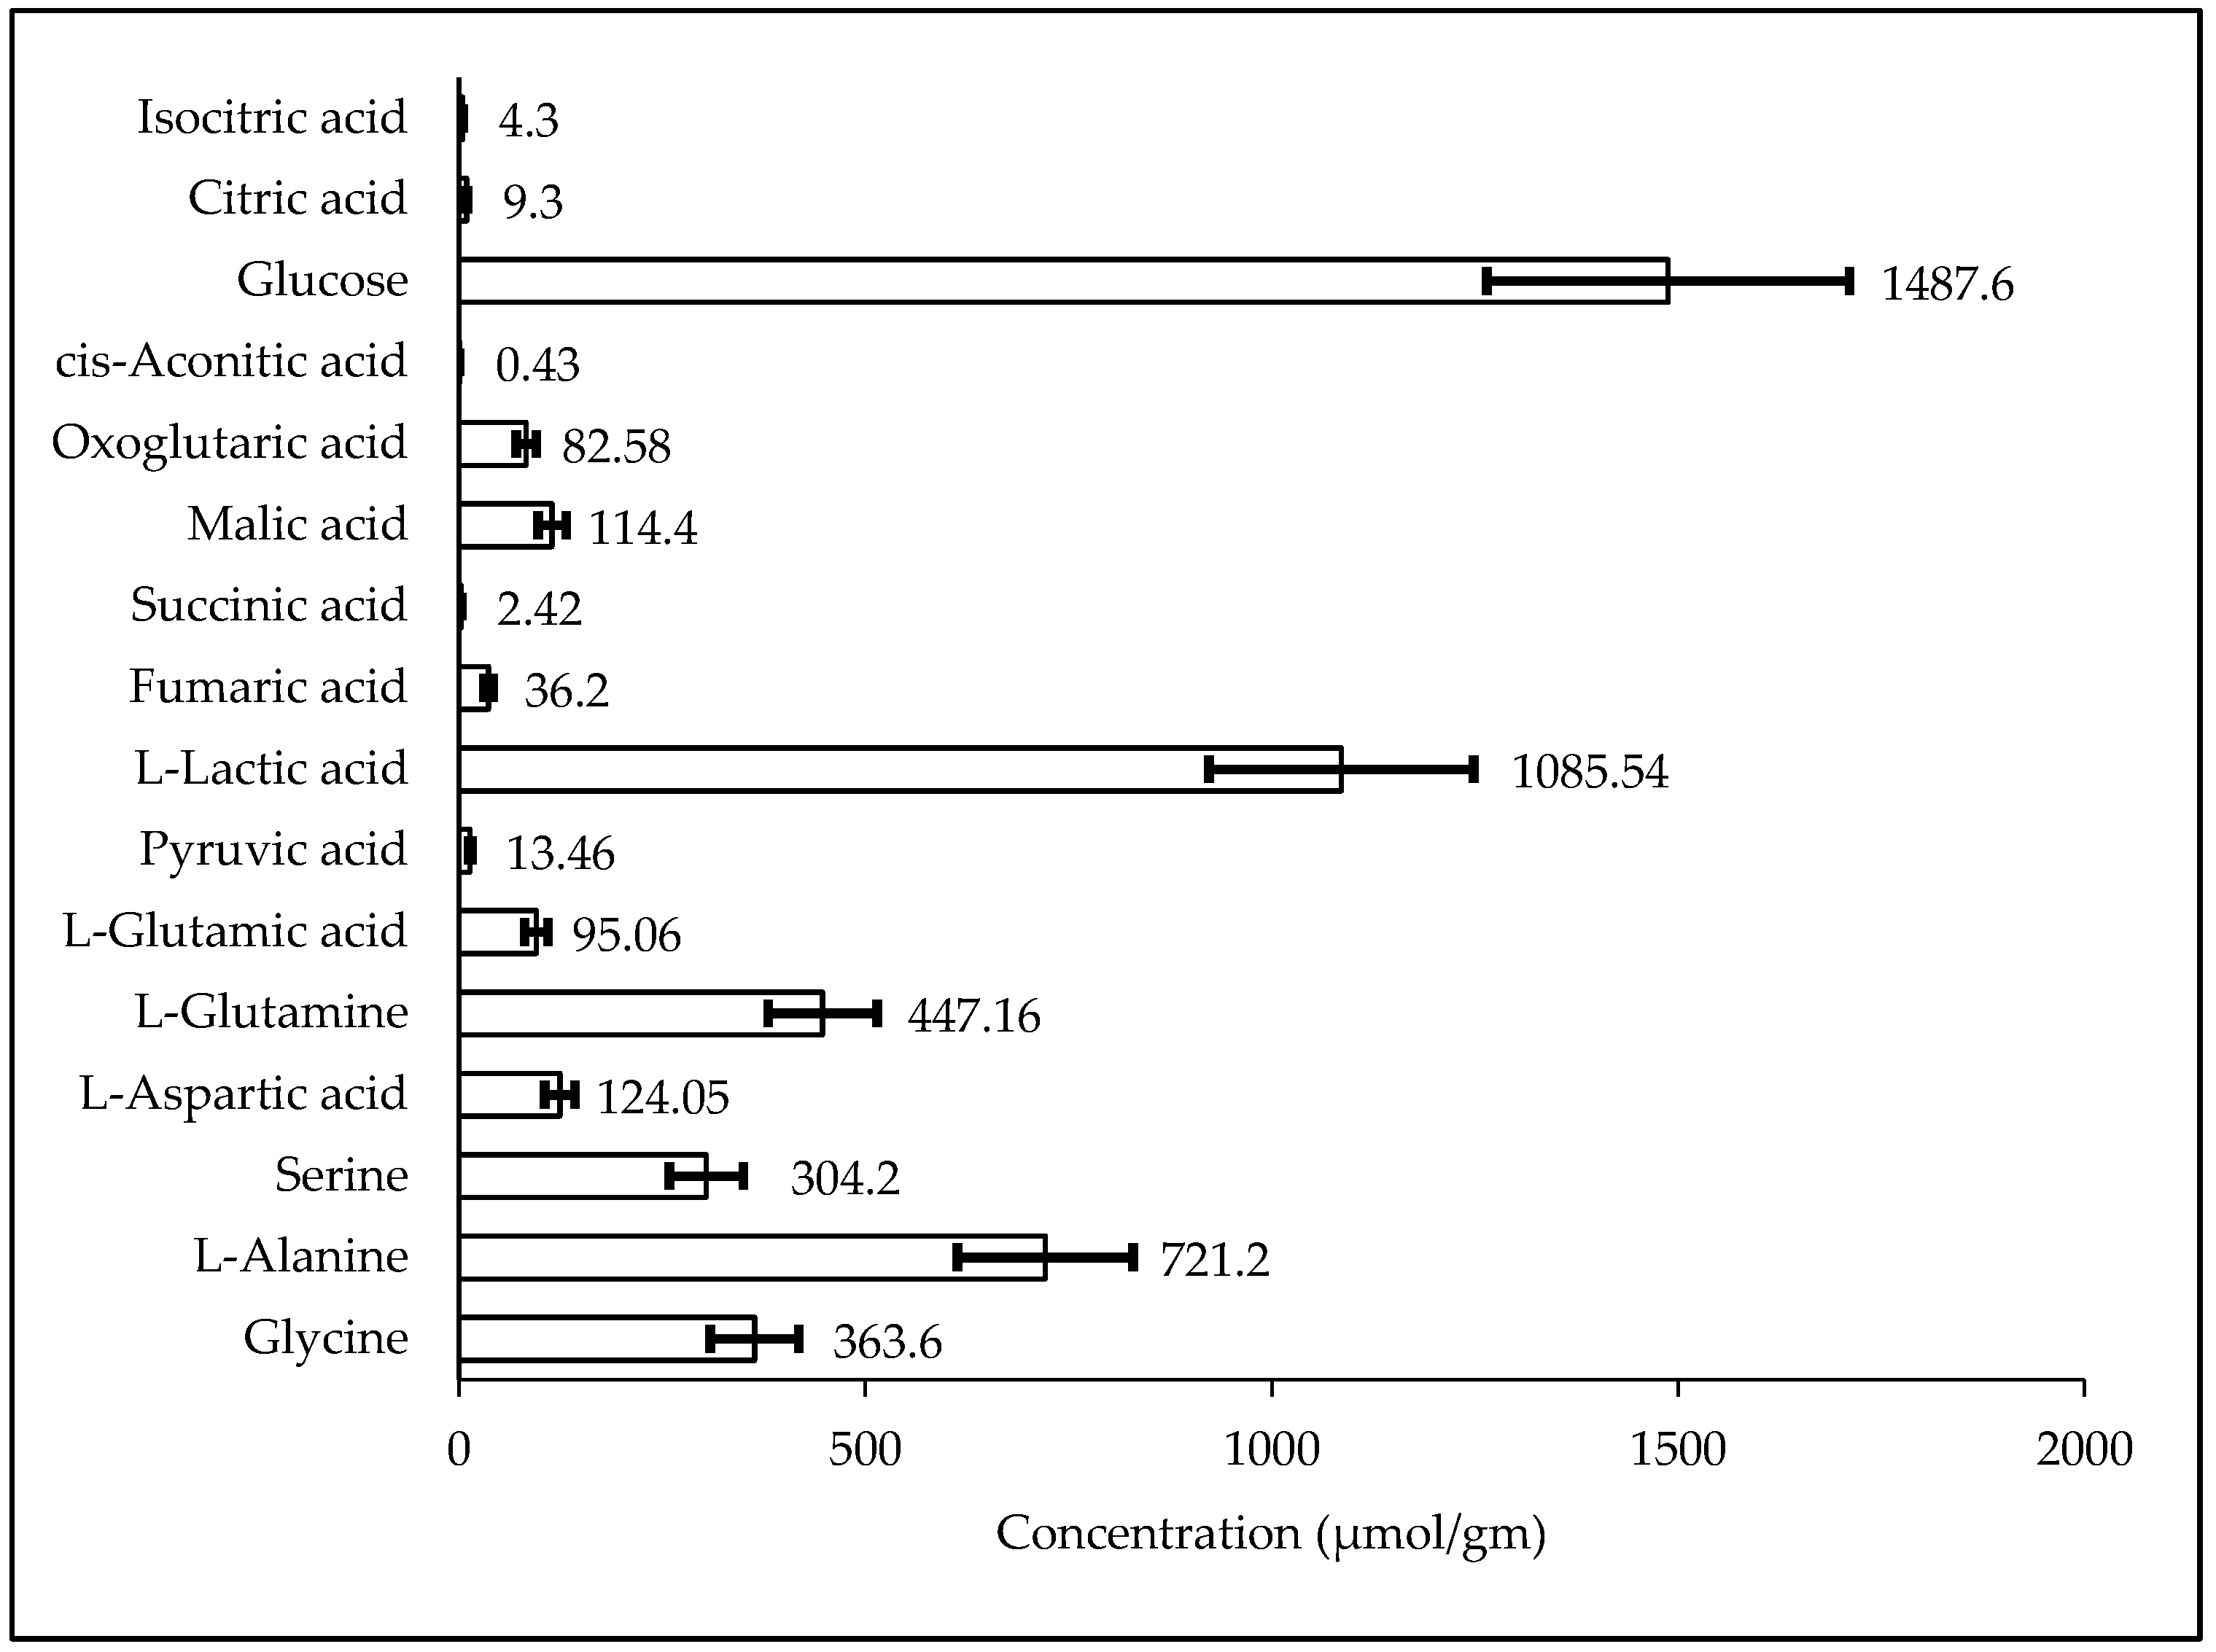
2.3. Biological Sample Analysis
3. Materials and Methods
3.1. Chemicals, Reagents and Samples
3.2. Solution Preparation
3.3. Sample Extraction
3.3.1. Extraction Protocol for Murine Liver Tissue Samples
3.3.2. Extraction Protocol for Serum and Plasma
3.3.3. Extraction Protocol for Cell
3.4. Instrument and Analytical Conditions
3.5. Validation
3.5.1. Selectivity and Specificity
3.5.2. Auto-Sampler Carryover
3.5.3. Linearity, Accuracy and Precision
3.5.4. Recovery and Matrix Effect
3.5.5. Stability
3.5.6. Limit of Detection and Limit of Quantification
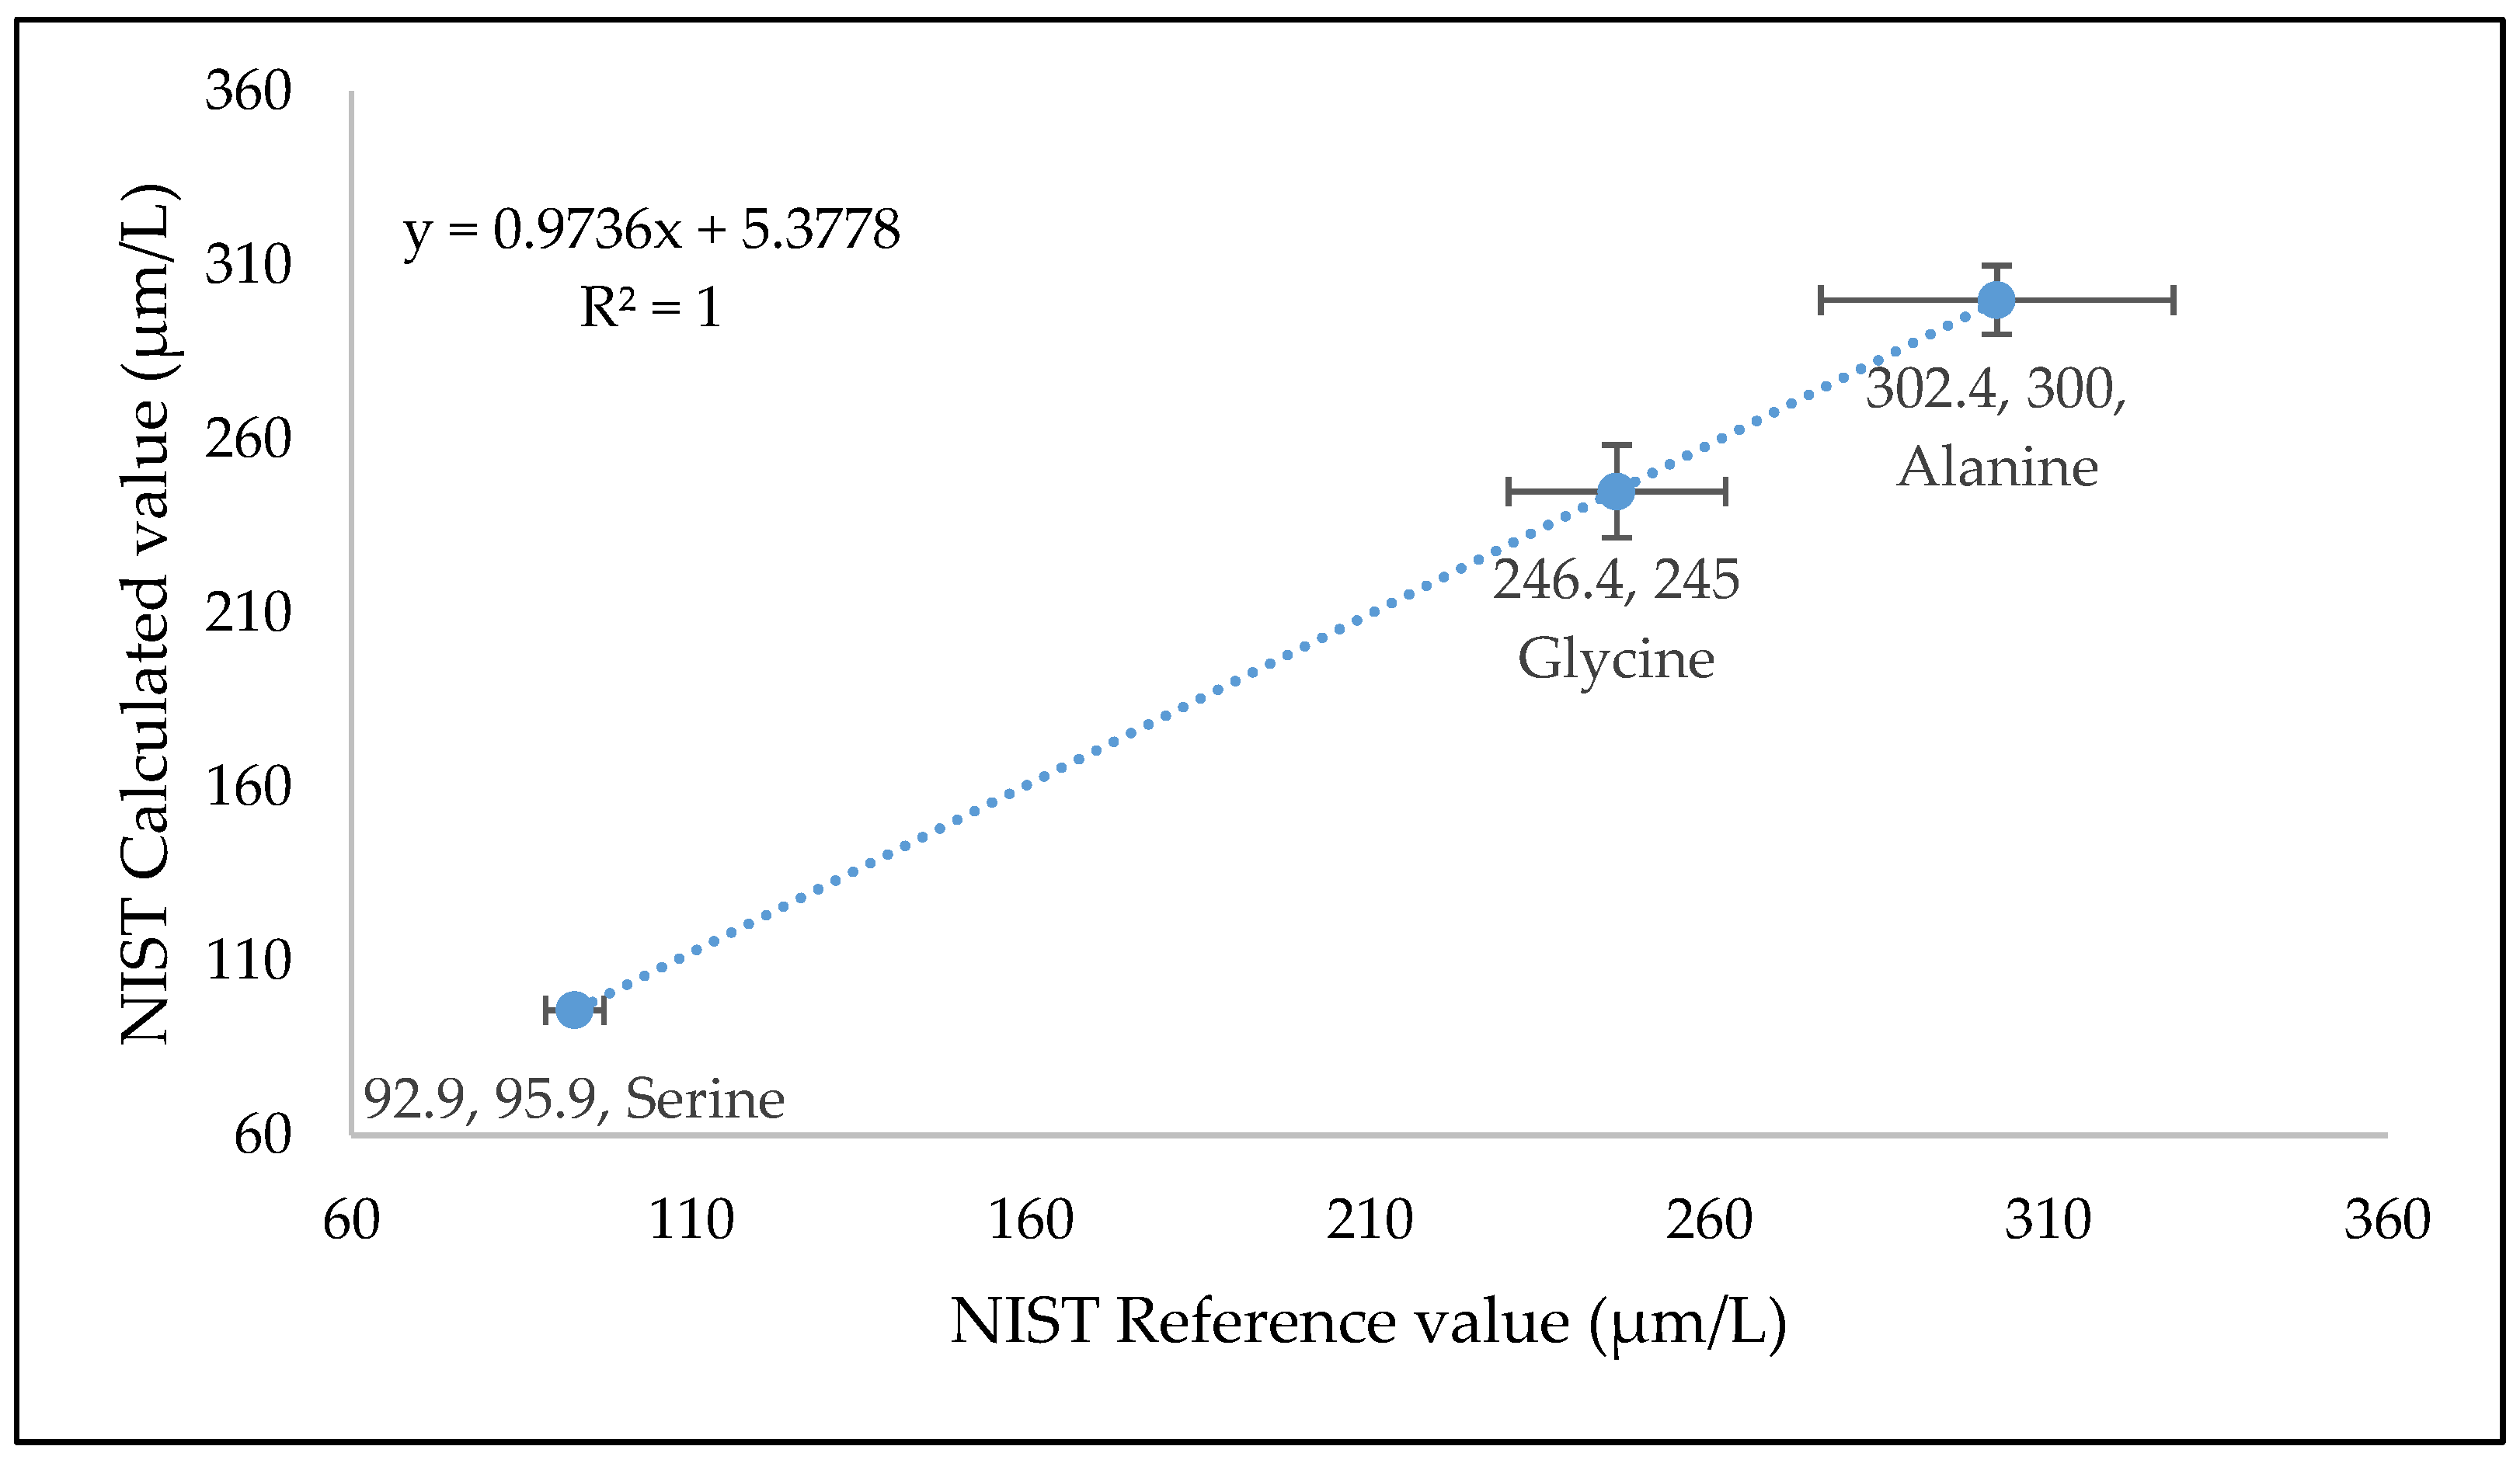
3.5.7. Comparison with NIST Reference Material
3.5.8. Ethic Statement
4. Conclusions
Supplementary Materials
Author Contributions
Funding
Acknowledgments
Conflicts of Interest
References
- Bonora, M.; Patergnani, S.; Rimessi, A.; De Marchi, E.; Suski, J.M.; Bononi, A.; Pinton, P. ATP synthesis and storage. Purinergic Signal 2012, 8, 343–357. [Google Scholar] [CrossRef] [PubMed]
- Kroemer, G.; Pouyssegur, J. Tumor cell metabolism: Cancer’s Achilles’ heel. Cancer Cell 2008, 13, 472–482. [Google Scholar] [CrossRef] [PubMed]
- Nagarajan, A.; Malvi, P.; Wajapeyee, N. Oncogene-directed alterations in cancer cell metabolism. Trends Cancer 2016, 2, 365–377. [Google Scholar] [CrossRef] [PubMed]
- Calderon-Santiago, M.; Priego-Capote, F.; Galache-Osuna, J.G.; Luque de Castro, M.D. Method based on GC-MS to study the influence of tricarboxylic acid cycle metabolites on cardiovascular risk factors. J. Pharm. Biomed. Anal. 2013, 74, 178–185. [Google Scholar] [CrossRef] [PubMed]
- Musharraf, S.G.; Siddiqui, A.J.; Shamsi, T.; Choudhary, M.I.; Rahman, A.U. Serum metabonomics of acute leukemia using nuclear magnetic resonance spectroscopy. Sci. Rep. 2016, 6, 30693. [Google Scholar] [CrossRef] [PubMed]
- He, X.; Liu, S.; Lai, W.; Yan, B.; Liu, X.; Jiang, Y.; Tao, Y.J.C. The Simultaneous Determination of Tricarboxylic Acid Cycle Acids and 2-Hydroxyglutarate in Serum from Patients with Nasopharyngeal Carcinoma Via GC–MS. Chromatographia 2016, 79, 501–508. [Google Scholar] [CrossRef]
- Thapar, R.; Titus, M.A. Recent Advances in Metabolic Profiling and Imaging of Prostate Cancer. Curr. Metab. 2014, 2, 53–69. [Google Scholar] [CrossRef] [PubMed]
- Li, M.; Wang, X.; Aa, J.; Qin, W.; Zha, W.; Ge, Y.; Liu, Z. GC/TOFMS analysis of metabolites in serum and urine reveals metabolic perturbation of TCA cycle in db/db mice involved in diabetic nephropathy. Am. J. Physiol. Renal Physiol. 2013, 304, F1317–F1324. [Google Scholar] [CrossRef] [PubMed]
- Shrestha, A.; Mullner, E.; Poutanen, K.; Mykkanen, H.; Moazzami, A.A. Metabolic changes in serum metabolome in response to a meal. Eur. J. Nutr. 2017, 56, 671–681. [Google Scholar] [CrossRef] [PubMed]
- Tan, B.; Lu, Z.; Dong, S.; Zhao, G.; Kuo, M.S. Derivatization of the tricarboxylic acid intermediates with O-benzylhydroxylamine for liquid chromatography-tandem mass spectrometry detection. Anal. Biochem. 2014, 465, 134–147. [Google Scholar] [CrossRef] [PubMed]
- Marquis, B.J.; Louks, H.P.; Bose, C.; Wolfe, R.R.; Singh, S.P.J.C. A New Derivatization Reagent for HPLC–MS Analysis of Biological Organic Acids. Chromatographia 2017, 80, 1723–1732. [Google Scholar] [CrossRef] [PubMed]
- Tulipani, S.; Llorach, R.; Urpi-Sarda, M.; Andres-Lacueva, C. Comparative Analysis of Sample Preparation Methods to Handle the Complexity of the Blood Fluid Metabolome: When Less Is More. Anal. Chem. 2013, 85, 341–348. [Google Scholar] [CrossRef] [PubMed]
- Bajad, S.U.; Lu, W.; Kimball, E.H.; Yuan, J.; Peterson, C.; Rabinowitz, J.D. Separation and quantitation of water soluble cellular metabolites by hydrophilic interaction chromatography-tandem mass spectrometry. J. Chromatogr. A 2006, 1125, 76–88. [Google Scholar] [CrossRef] [PubMed]
- Lv, H.; Palacios, G.; Hartil, K.; Kurland, I.J. Advantages of tandem LC-MS for the rapid assessment of tissue-specific metabolic complexity using a pentafluorophenylpropyl stationary phase. J. Proteome Res. 2011, 10, 2104–2112. [Google Scholar] [CrossRef] [PubMed]
- Liu, R.; Chou, J.; Hou, S.; Liu, X.; Yu, J.; Zhao, X.; Sun, C. Evaluation of two-step liquid-liquid extraction protocol for untargeted metabolic profiling of serum samples to achieve broader metabolome coverage by UPLC-Q-TOF-MS. Anal. Chim. Acta 2018, 1035, 96–107. [Google Scholar] [CrossRef] [PubMed]
- Carmical, J.; Brown, S. The impact of phospholipids and phospholipid removal on bioanalytical method performance. Biomed. Chromatogr. 2016, 30, 710–720. [Google Scholar] [CrossRef] [PubMed]
- Guo, X.; Lankmayr, E. Phospholipid-based matrix effects in LC–MS bioanalysis. Bioanalysis 2011, 3, 349–352. [Google Scholar] [CrossRef] [PubMed]
- Keunchkarian, S.; Reta, M.; Romero, L.; Castells, C. Effect of sample solvent on the chromatographic peak shape of analytes eluted under reversed-phase liquid chromatogaphic conditions. J. Chromatogr. A 2006, 1119, 20–28. [Google Scholar] [CrossRef] [PubMed]
- Gao, H.; Yu, X.; Sun, R.; Yang, N.; He, J.; Tao, M.; Wang, G. Quantitative GC-MS assay of citric acid from humans and db/db mice blood serum to assist the diagnosis of diabetic nephropathy. J. Chromatogr. B Anal. Technol. Biomed. Life Sci. 2018, 1077–1078, 28–34. [Google Scholar] [CrossRef] [PubMed]
- Han, M.; Xie, M.; Han, J.; Yuan, D.; Yang, T.; Xie, Y. Development and validation of a rapid, selective, and sensitive LC-MS/MS method for simultaneous determination of D- and L-amino acids in human serum: Application to the study of hepatocellular carcinoma. Anal. Bioanal. Chem. 2018, 410, 2517–2531. [Google Scholar] [CrossRef] [PubMed]
- Available online: https://www.ema.europa.eu/en/documents/scientific-guideline/guideline-bioanalytical-method-validation_en.pdf (accessed on 20 April 2019).
- Available online: https://www-s.nist.gov/srmors/certificates/1950.pdf (accessed on 7 May 2019).
| Analyte | % Mean Accuracy a at Different Standard Concentration Level | LoQ (ng/mL) | LoD (ng/mL) | ||||||||||
|---|---|---|---|---|---|---|---|---|---|---|---|---|---|
| L-1 | L-2 | L-3 | L-4 | L-5 | L-6 | L-7 | L-8 | L-9 | L-10 | L-11 | |||
| cis-Aconitic acid | 85.12 | 80.24 | 86.54 | 81.91 | 94.99 | 85.73 | 99.17 | 104.58 | 101.65 | 99.12 | 100.07 | 11.72 | 8.79 |
| Citric acid | 103.38 | 86.48 | 90.49 | 93.10 | 95.52 | 104.64 | 101.99 | 103.79 | 103.69 | 101.25 | 98.51 | 122.07 | 12.21 |
| Fumaric acid | 96.42 | 115.90 | 97.13 | 109.16 | 97.60 | 101.16 | 99.09 | 95.49 | 95.91 | 98.73 | 102.65 | 23.44 | 17.58 |
| Isocitric acid | 102.28 | 106.47 | 135.45 | 138.34 | 116.83 | 103.05 | 91.41 | 83.08 | 86.35 | 95.54 | 114.94 | 29.30 | 14.65 |
| Malic acid | 101.33 | 86.40 | 82.40 | 83.07 | 101.73 | 104.68 | 103.53 | 105.99 | 104.21 | 102.07 | 97.29 | 6.25 | 3.13 |
| Pyruvic acid | 98.50 | 86.14 | 118.65 | 108.54 | 100.45 | 105.05 | 99.12 | 96.39 | 86.12 | 81.99 | 86.57 | 244.14 | 183.11 |
| Oxoglutaric acid | 99.61 | 101.24 | 125.54 | 108.43 | 99.51 | 101.72 | 99.24 | 98.11 | 98.44 | 98.38 | 98.45 | 122.07 | 61.04 |
| Glycine | 104.04 | 116.45 | 90.41 | 86.32 | 116.92 | 104.29 | 101.37 | 101.97 | 101.40 | 102.70 | 98.06 | 122.07 | 61.04 |
| l-Alanine | 94.24 | 109.23 | 101.87 | 101.99 | 105.04 | 103.66 | 102.49 | 99.33 | 97.90 | 92.59 | 91.66 | 122.07 | 12.21 |
| l-Serine | 97.38 | 100.70 | 117.07 | 107.11 | 100.20 | 101.90 | 99.76 | 100.26 | 99.10 | 91.96 | 96.08 | 29.30 | 2.93 |
| l-Aspartic acid | 97.84 | 95.56 | 121.37 | 102.72 | 101.81 | 101.74 | 102.04 | 102.50 | 99.70 | 89.49 | 92.91 | 11.72 | 5.86 |
| l-Glutamine | 98.28 | 99.04 | 104.86 | 104.54 | 104.57 | 105.26 | 101.34 | 99.12 | 89.24 | 75.12 | 63.02 | 122.07 | 6.10 |
| l-Glutamic acid | 97.16 | 88.41 | 108.66 | 102.11 | 102.84 | 96.74 | 97.30 | 99.39 | 100.14 | 100.13 | 98.48 | 29.30 | 2.93 |
| l-Lactic acid | 95.19 | 109.72 | 103.53 | 93.83 | 97.68 | 99.92 | 99.00 | 99.98 | 101.23 | 99.01 | 100.90 | 527.34 | 52.73 |
| Succinic acid | 98.98 | 101.25 | 104.02 | 95.32 | 98.26 | 101.43 | 100.23 | 103.12 | 102.37 | 98.57 | 96.42 | 23.44 | 11.72 |
| d-Glucose | 96.08 | 103.03 | 106.53 | 104.76 | 100.91 | 103.12 | 102.59 | 101.29 | 98.12 | 94.97 | 88.60 | 976.56 | 97.66 |
| Analyte | Linearity Regression r2 Value a | Intra-Day Precision of High, Medium and Low Concentrations, % RSD | Inter-Day Precision of High, Medium and Low Concentrations, % RSD | Mean Recovery Serum (%) b | Mean Recovery Tissue (%) b | Mean Recovery Cell (%) b | ||||
|---|---|---|---|---|---|---|---|---|---|---|
| HQC | MQC | LQC | HQC | MQC | LQC | |||||
| cis-Aconitic acid | 0.999 | 3.83 | 12.10 | 14.90 | 2.73 | 11.30 | 15.90 | 89.30 | 223.82 | 107.24 |
| Citric acid | 0.993 | 2.69 | 5.79 | 20.24 | 6.24 | 5.81 | 19.84 | 100.59 | 125.73 | 104.36 |
| Fumaric acid | 0.995 | 2.10 | 5.18 | 11.63 | 2.60 | 5.74 | 19.34 | 89.99 | 77.24 | 102.54 |
| Isocitric acid | 0.990 | 6.89 | 11.31 | 19.57 | 6.19 | 17.27 | 19.82 | 90.53 | 111.40 | 87.04 |
| Malic acid | 0.992 | 1.46 | 8.61 | 21.87 | 1.66 | 7.56 | 19.23 | 104.28 | 105.66 | 92.01 |
| Pyruvic acid | 0.990 | 3.36 | 4.06 | 14.51 | 10.86 | 8.91 | 12.06 | 85.00 | 132.64 | 91.48 |
| Oxoglutaric acid | 0.998 | 2.17 | 4.87 | 11.88 | 2.66 | 4.33 | 11.72 | 79.93 | 108.26 | 86.96 |
| Glycine | 0.996 | 3.20 | 4.84 | 17.26 | 3.95 | 6.59 | 19.06 | 105.34 | 111.00 | 108.73 |
| l-Alanine | 0.994 | 2.52 | 2.68 | 12.20 | 2.29 | 3.54 | 13.76 | 106.21 | 104.72 | 102.91 |
| l-Serine | 0.994 | 1.95 | 4.95 | 11.27 | 2.58 | 4.43 | 16.25 | 113.68 | 139.08 | 104.54 |
| l-Aspartic acid | 0.994 | 6.82 | 3.27 | 11.28 | 5.71 | 5.13 | 12.07 | 107.72 | 100.49 | 105.43 |
| l-Glutamine | 0.994 | 3.96 | 3.55 | 8.09 | 4.99 | 3.38 | 7.64 | 113.09 | 111.81 | 105.14 |
| l-Glutamic acid | 0.996 | 1.91 | 2.93 | 26.47 | 3.69 | 5.63 | 18.47 | 118.35 | 145.97 | 109.48 |
| l-Lactic acid | 0.992 | 1.34 | 4.93 | 18.97 | 1.43 | 4.30 | 17.93 | 103.81 | 79.26 | 107.18 |
| Succinic acid | 0.997 | 2.51 | 4.28 | 19.51 | 2.20 | 4.59 | 19.92 | 100.68 | 151.24 | 97.04 |
| d-Glucose | 0.996 | 1.92 | 2.72 | 3.86 | 2.25 | 2.69 | 3.74 | 96.36 | 101.98 | 100.45 |
| Analyte | Stock Solution Stability, % | working Solution Stability, % | Autosampler Stability (%) | |||
|---|---|---|---|---|---|---|
| HQC | LQC | HQC | LQC | HQC | LQC | |
| cis-Aconitic acid | 89.13 | 90.01 | 87.52 | 91.02 | 88.28 | 89.23 |
| Citric acid | 90.12 | 95.01 | 91.05 | 96.12 | 91.29 | 94.35 |
| Fumaric acid | 100.20 | 94.25 | 101.39 | 95.01 | 99.80 | 93.91 |
| Isocitric acid | 109.62 | 111.47 | 108.52 | 114.23 | 112.59 | 114.80 |
| Malic acid | 97.34 | 86.01 | 98.10 | 86.50 | 98.64 | 85.56 |
| Pyruvic acid | 87.23 | 98.12 | 87.01 | 96.52 | 86.77 | 97.81 |
| Oxoglutaric acid | 98.99 | 91.23 | 96.52 | 90.34 | 97.90 | 89.36 |
| Glycine | 110.52 | 87.24 | 109.34 | 87.52 | 111.83 | 85.92 |
| l-Alanine | 89.25 | 113.24 | 89.34 | 112.24 | 88.04 | 115.25 |
| l-Serine | 90.52 | 102.34 | 91.04 | 101.11 | 91.85 | 101.58 |
| l-Aspartic acid | 92.00 | 107.32 | 93.34 | 108.00 | 92.73 | 108.68 |
| l-Glutamine | 86.23 | 100.12 | 87.54 | 99.01 | 85.45 | 101.81 |
| l-Glutamic acid | 95.12 | 109.12 | 93.12 | 108.92 | 94.87 | 107.59 |
| l-Lactic acid | 101.52 | 112.52 | 102.15 | 114.19 | 101.38 | 115.13 |
| Succinic acid | 97.85 | 112.52 | 98.14 | 113.00 | 98.07 | 114.61 |
| d-Glucose | 91.23 | 100.12 | 92.32 | 101.92 | 90.22 | 99.29 |
| Analyte | Mass transition | Cone Voltage (eV) | Collision Voltage (V) | Ionization Mode |
|---|---|---|---|---|
| cis-Aconitic acid | 172.97 > 128.9 | 22 | 8 | Negative |
| Citric acid | 191.1 > 110.94 | 16 | 10 | Negative |
| Fumaric acid | 115.1 > 41.00 & 70.94 | 32 | 6 | Negative |
| Isocitric acid | 191.1 > 155.00 | 20 | 12 | Negative |
| Malic acid | 133.1 > 114.91 & 71.00 | 34 | 10 | Negative |
| Pyruvic acid | 87.16 > 42.96 | 28 | 6 | Negative |
| Oxoglutaric acid | 145.1 > 100.91 | 22 | 6 | Negative |
| Glycine | 76.1 > 30.15 | 20 | 7 | Positive |
| l-Alanine | 90.1 > 44.15 | 20 | 10 | Positive |
| l-Serine | 106.1 > 60.5 | 23 | 7 | Positive |
| l-Aspartic acid | 134.15 > 74.05 | 29 | 13 | Positive |
| l-Glutamine | 147.1 > 130.1 | 26 | 8 | Positive |
| l-Glutamic acid | 148.1 > 130.1 | 22 | 9 | Positive |
| l-Lactic acid | 88.97 > 42.96 | 22 | 8 | Negative |
| Succinic acid | 117.05 > 73.00 | 22 | 12 | Negative |
| d-Glucose | 179.1 > 88.94 | 36 | 4 | Negative |
© 2020 by the authors. Licensee MDPI, Basel, Switzerland. This article is an open access article distributed under the terms and conditions of the Creative Commons Attribution (CC BY) license (http://creativecommons.org/licenses/by/4.0/).
Share and Cite
Rathod, R.; Gajera, B.; Nazir, K.; Wallenius, J.; Velagapudi, V. Simultaneous Measurement of Tricarboxylic Acid Cycle Intermediates in Different Biological Matrices Using Liquid Chromatography–Tandem Mass Spectrometry; Quantitation and Comparison of TCA Cycle Intermediates in Human Serum, Plasma, Kasumi-1 Cell and Murine Liver Tissue. Metabolites 2020, 10, 103. https://doi.org/10.3390/metabo10030103
Rathod R, Gajera B, Nazir K, Wallenius J, Velagapudi V. Simultaneous Measurement of Tricarboxylic Acid Cycle Intermediates in Different Biological Matrices Using Liquid Chromatography–Tandem Mass Spectrometry; Quantitation and Comparison of TCA Cycle Intermediates in Human Serum, Plasma, Kasumi-1 Cell and Murine Liver Tissue. Metabolites. 2020; 10(3):103. https://doi.org/10.3390/metabo10030103
Chicago/Turabian StyleRathod, Ramji, Bharat Gajera, Kenneth Nazir, Janne Wallenius, and Vidya Velagapudi. 2020. "Simultaneous Measurement of Tricarboxylic Acid Cycle Intermediates in Different Biological Matrices Using Liquid Chromatography–Tandem Mass Spectrometry; Quantitation and Comparison of TCA Cycle Intermediates in Human Serum, Plasma, Kasumi-1 Cell and Murine Liver Tissue" Metabolites 10, no. 3: 103. https://doi.org/10.3390/metabo10030103
APA StyleRathod, R., Gajera, B., Nazir, K., Wallenius, J., & Velagapudi, V. (2020). Simultaneous Measurement of Tricarboxylic Acid Cycle Intermediates in Different Biological Matrices Using Liquid Chromatography–Tandem Mass Spectrometry; Quantitation and Comparison of TCA Cycle Intermediates in Human Serum, Plasma, Kasumi-1 Cell and Murine Liver Tissue. Metabolites, 10(3), 103. https://doi.org/10.3390/metabo10030103


