Selection for Growth and Precocity Alters Muscle Metabolism in Nellore Cattle

 ,
,  , , , ,

Abstract
1. Introduction
2. Results
3. Discussion
4. Material and Methods
4.1. Post-Weaning Growth Evaluation and Animal Selection
4.2. Finishing, Slaughter, and Carcass Samples
4.3. Extraction of Polar Beef Metabolites
4.4. Nuclear Magnetic Ressonance (NMR) Spectroscopy
4.5. Spectral Processing and Metabolite Quantitation
4.6. Data Analysis
5. Conclusions
Supplementary Materials
Author Contributions
Acknowledgments
Conflicts of Interest
References
- Berg, R.T.; Butterfield, R.M. New Concepts of Cattle Growth, 1st ed.; Macarthur Press: Parramatta, Australia, 1976; p. 240. ISBN 0424000024. [Google Scholar]
- Abreu Silva, B.C.; Eler, J.P.; Santana, M.L.; Mattos, E.C.; Menezes, I.R.; Ferraz, J.B.S. Genetic association between mature weight and early growth and heifer pregnancy traits in Nellore cattle. Livest. Sci. 2018, 211, 61–65. [Google Scholar] [CrossRef]
- Eler, J.P.; Ferraz, J.B.S.; Balieiro, J.C.C.; Mattos, E.C.; Mourão, G.B. Genetic correlation between heifer pregnancy and scrotal circumference measured at 15 and 18 months of age in Nellore cattle. Genet. Mol. Res. 2006, 5, 569–580. [Google Scholar] [PubMed]
- Lopes, F.B.; Da Silva, M.C.; Magnabosco, C.U.; Narciso, M.G.; Sainz, R.D. Selection Indices and Multivariate Analysis Show Similar Results in the Evaluation of Growth and Carcass Traits in Beef Cattle. PLoS ONE 2016, 11, e0147180. [Google Scholar]
- Campion, B.; Keane, M.G.; Kenny, D.A.; Berry, D.P. Evaluation of estimated genetic merit for carcass weight in beef cattle: Blood metabolites, carcass measurements, carcass composition and selected non-carcass components. Livest. Sci. 2009, 126, 100–111. [Google Scholar] [CrossRef]
- Clarke, A.M.; Drennan, M.J.; McGee, M.; Kenny, D.A.; Evans, R.D.; Berry, D.P. Intake, growth and carcass traits in male progeny of sires differing in genetic merit for beef production. Animal 2009, 3, 791–801. [Google Scholar] [CrossRef]
- Okut, H.; Wu, X.-L.; Rosa, G.J.; Bauck, S.; Woodward, B.W.; Schnabel, R.D.; Taylor, J.F.; Gianola, D. Predicting expected progeny difference for marbling score in Angus cattle using artificial neural networks and Bayesian regression models. Genet. Sel. Evol. 2013, 45, 34. [Google Scholar] [CrossRef]
- Hocquette, J.F.; Ortigues-Marty, I.; Pethick, D.; Herpin, P.; Fernandez, X. Nutritional and hormonal regulation of energy metabolism in skeletal muscles of meat-producing animals. Livest. Prod. Sci. 1998, 56, 115–143. [Google Scholar] [CrossRef]
- Beckonert, O.; Keun, H.C.; Ebbels, T.M.D.; Bundy, J.; Holmes, E.; Lindon, J.C. Metabolic profiling, metabolomic and metabonomic procedures for NMR spectroscopy of urine, plasma, serum and tissue extracts. Nat. Protoc. 2007, 2, 2692–2703. [Google Scholar] [CrossRef]
- Goldansaz, S.A.; Guo, A.C.; Sajed, T.; Steele, M.A.; Plastow, G.S.; Wishart, D.S. Livestock metabolomics and the livestock metabolome: A systematic review. PLoS ONE 2017, 12, e0177675. [Google Scholar] [CrossRef]
- Nishimura, T.; Kato, H. Taste of free amino acids and peptides. Food Rev. Int. 1988, 4, 175–194. [Google Scholar] [CrossRef]
- Yao, K.; Yin, Y.-L.; Chu, W.; Liu, Z.; Deng, D.; Li, T.; Huang, R.; Zhang, J.; Tan, B.; Wang, W.; et al. Dietary arginine supplementation increases mTOR signaling activity in skeletal muscle of neonatal pigs. J. Nutr. 2008, 138, 867–872. [Google Scholar] [CrossRef] [PubMed]
- Widmann, P.; Reverter, A.; Fortes, M.R.S.; Weikard, R.; Suhre, K.; Hammon, H.; Albrecht, E.; Kuehn, C. A systems biology approach using metabolomic data reveals genes and pathways interacting to modulate divergent growth in cattle. BMC Genom. 2013, 14, 1–17. [Google Scholar] [CrossRef] [PubMed]
- Churchward-Venne, T.A.; Burd, N.A.; Mitchell, C.J.; West, D.W.D.; Philp, A.; Marcotte, G.R.; Baker, S.K.; Baar, K.; Phillips, S.M. Supplementation of a suboptimal protein dose with leucine or essential amino acids: effects on myofibrillar protein synthesis at rest and following resistance exercise in men. J. Physiol. 2012, 590, 2751–2765. [Google Scholar] [CrossRef] [PubMed]
- Kanazawa, T.; Taneike, I.; Akaishi, R.; Yoshizawa, F.; Furuya, N.; Fujimura, S.; Kadowaki, M. Amino Acids and Insulin Control Autophagic Proteolysis through Different Signaling Pathways in Relation to mTOR in Isolated Rat Hepatocytes. J. Biol. Chem. 2004, 279, 8452–8459. [Google Scholar] [CrossRef]
- Rao, M.V.; Gault, N.F.S. The influence of fibre-type composition and associated biochemical characteristics on the acid buffering capacities of several beef muscles. Meat Sci. 1989, 26, 5–18. [Google Scholar] [CrossRef]
- Beline, M.; Gomes, J.F.M.; Antonelo, D.S.; Silva, J.; Pavan, B.; Toseti, L.B.; Matarneh, S.K.; Gerrard, D.E.; Silva, S.L. Muscle fiber type profile and postmortem metabolism of Nellore cattle with different growth potential from weaning to yearling. In Proceedings of the 65th International Congress of Meat Science and Technology (ICoMST 2019), Potsdam, Germany, 4–9 August 2019; pp. 688–692. [Google Scholar]
- Keady, S.M.; Kenny, D.A.; Ohlendieck, K.; Doyle, S.; Keane, M.G.; Waters, S.M. Proteomic pro fi ling of bovine M. longissimus lumborum from Crossbred Aberdeen Angus and Belgian Blue sired steers varying in genetic merit for carcass weight. J. Anim. Sci. 2013, 91, 654–665. [Google Scholar] [CrossRef]
- Hamelin, M.; Sayd, T.; Chambon, C.; Bouix, J.; Bibé, B.; Milenkovic, D.; Leveziel, H.; Georges, M.; Clop, A.; Marinova, P.; et al. Proteomic analysis of ovine muscle hypertrophy. J. Anim. Sci. 2006, 84, 3266–3276. [Google Scholar] [CrossRef][Green Version]
- Morales, A.; Arce, N.; Cota, M.; Buenabad, L.; Avelar, E.; Htoo, J.K.; Cervantes, M. Effect of dietary excess of branched-chain amino acids on performance and serum concentrations of amino acids in growing pigs. J. Anim. Physiol. Anim. Nutr. 2016, 100, 39–45. [Google Scholar] [CrossRef]
- Watford, M.; Wu, G. Glutamine metabolism in uricotelic species: Variation in skeletal muscle glutamine synthetase, glutaminase, glutamine levels and rates of protein synthesis. Comp. Biochem. Physiol. 2005, 140, 607–614. [Google Scholar] [CrossRef]
- Straadt, I.K.; Aaslyng, M.D.; Bertram, H.C. An NMR-based metabolomics study of pork from different crossbreeds and relation to sensory perception. Meat Sci. 2014, 96, 719–728. [Google Scholar] [CrossRef]
- Virgili, F.; Maiani, G.; Zahoor, Z.; Ciarapica, D.; Raguzzini, A.; Ferro-Luzzi, A. Relationship between fat-free mass and urinary excretion of creatinine and 3MH in adult humans. J. Appl. Physiol. 1994, 76, 1946–1950. [Google Scholar] [CrossRef] [PubMed]
- Coulter, D.L. Carnitine deficiency in epilepsy: Risk factors and treatment. J. Child Neurol. 1995, 10. [Google Scholar] [CrossRef]
- Abasht, B.; Zhou, N.; Lee, W.R.; Zhuo, Z.; Peripolli, E. The metabolic characteristics of susceptibility to wooden breast disease in chickens with high feed efficiency. Poult. Sci. 2019, 98, 3246–3256. [Google Scholar] [CrossRef] [PubMed]
- Vernon, R.G. Lipid metabolism in the adipose tissue of ruminant animals. In Lipid Metabolism in Ruminant Animals; Christie, W.W., Ed.; Pergamon Press: Oxford, UK, 1981; pp. 279–362. [Google Scholar]
- Chong, J.; Soufan, O.; Li, C.; Caraus, I.; Li, S.; Bourque, G.; Wishart, D.S.; Xia, J. MetaboAnalyst 4.0: Towards more transparent and integrative metabolomics analysis. Nucleic Acids Res. 2018, 46, 486–494. [Google Scholar] [CrossRef] [PubMed]
- Zeileis, A.; Wiel, M.A.; Hornik, K.; Hothorn, T. Implementing a class of permutation tests: the coin package. J. Stat. Softw. 2008, 28, 1–23. [Google Scholar]
- Xia, J.; Wishart, D.S. MSEA: A web-based tool to identify biologically meaningful patterns in quantitative metabolomic data. Nucleic Acids Res. 2010, 38, 71–77. [Google Scholar] [CrossRef]


| Metabolites | p-Value | |
|---|---|---|
| Permutation | KS | |
| Isoleucine | 0.4675185 | 0.07832309 (D = 0.36) |
| Valine | 0.178246 | 0.6993742 (D = 0.2) |
| Lactate | 0.07011515 | 0.1545381 (D = 0.32) |
| Beta-Alanine | 0.5255741 | 0.6993742 (D = 0.2) |
| Proline | 0.406171 | 0.28096 (D = 0.28) |
| Succinate | 0.1662221 | 0.6993742 (D = 0.2) |
| Methionine | 0.849174 | 0.6993742 (D = 0.2) |
| Glutamine | 0.7481134 | 0.6993742 (D = 0.2) |
| Glutamate | 0.04236974 | 0.28096 (D = 0.28) |
| Creatine | 0.06499233 | 0.1545381 (D = 0.32) |
| Creatinine | 0.1402015 | 0.4675586 (D = 0.24) |
| Alanine/Hypoxantine | 0.1040305 | 0.28096 (D = 0.28) |
| Glycerol | 0.474837 | 0.07832309 (D = 0.36) |
| Leucine | 0.0316985 | 0.03663105 (D = 0.4) |
| Threonine | 0.9695724 | 0.9937649 (D = 0.12) |
| Choline | 0.3409856 | 0.4675586 (D = 0.24) |
| Glucose | 0.154457 | 0.28096 (D = 0.28) |
| Arginine | 0.000686095 | 0.002318458 (D = 0.52) |
| Carnosine | 0.002277323 | 0.03663105 (D = 0.4) |
| Carnitine | 0.8327426 | 0.9062064 (D = 0.16) |
| Acetylcarnitine | 0.3393883 | 0.9062064 (D = 0.16) |
| Adenine | 0.9329617 | 0.9937649 (D = 0.12) |
| Inosine | 0.6008663 | 0.1545381 (D = 0.32) |
| Betaine | 0.8918807 | 0.9937649 (D = 0.12) |
| Fumarate | 0.5587293 | 0.9062064 (D = 0.16) |
| Glycerate | 0.6074683 | 0.6993742 (D = 0.2) |
| Anserine | 0.1455512 | 0.6993742 (D = 0.2) |
| NADH | 0.3460372 | 0.4675586 (D = 0.24) |
| IMP | 0.05199825 | 0.1545381 (D = 0.32) |
| ATP | 0.7473122 | 0.4675586 (D = 0.24) |
| Fructose | 0.6223233 | 0.6993742 (D = 0.2) |
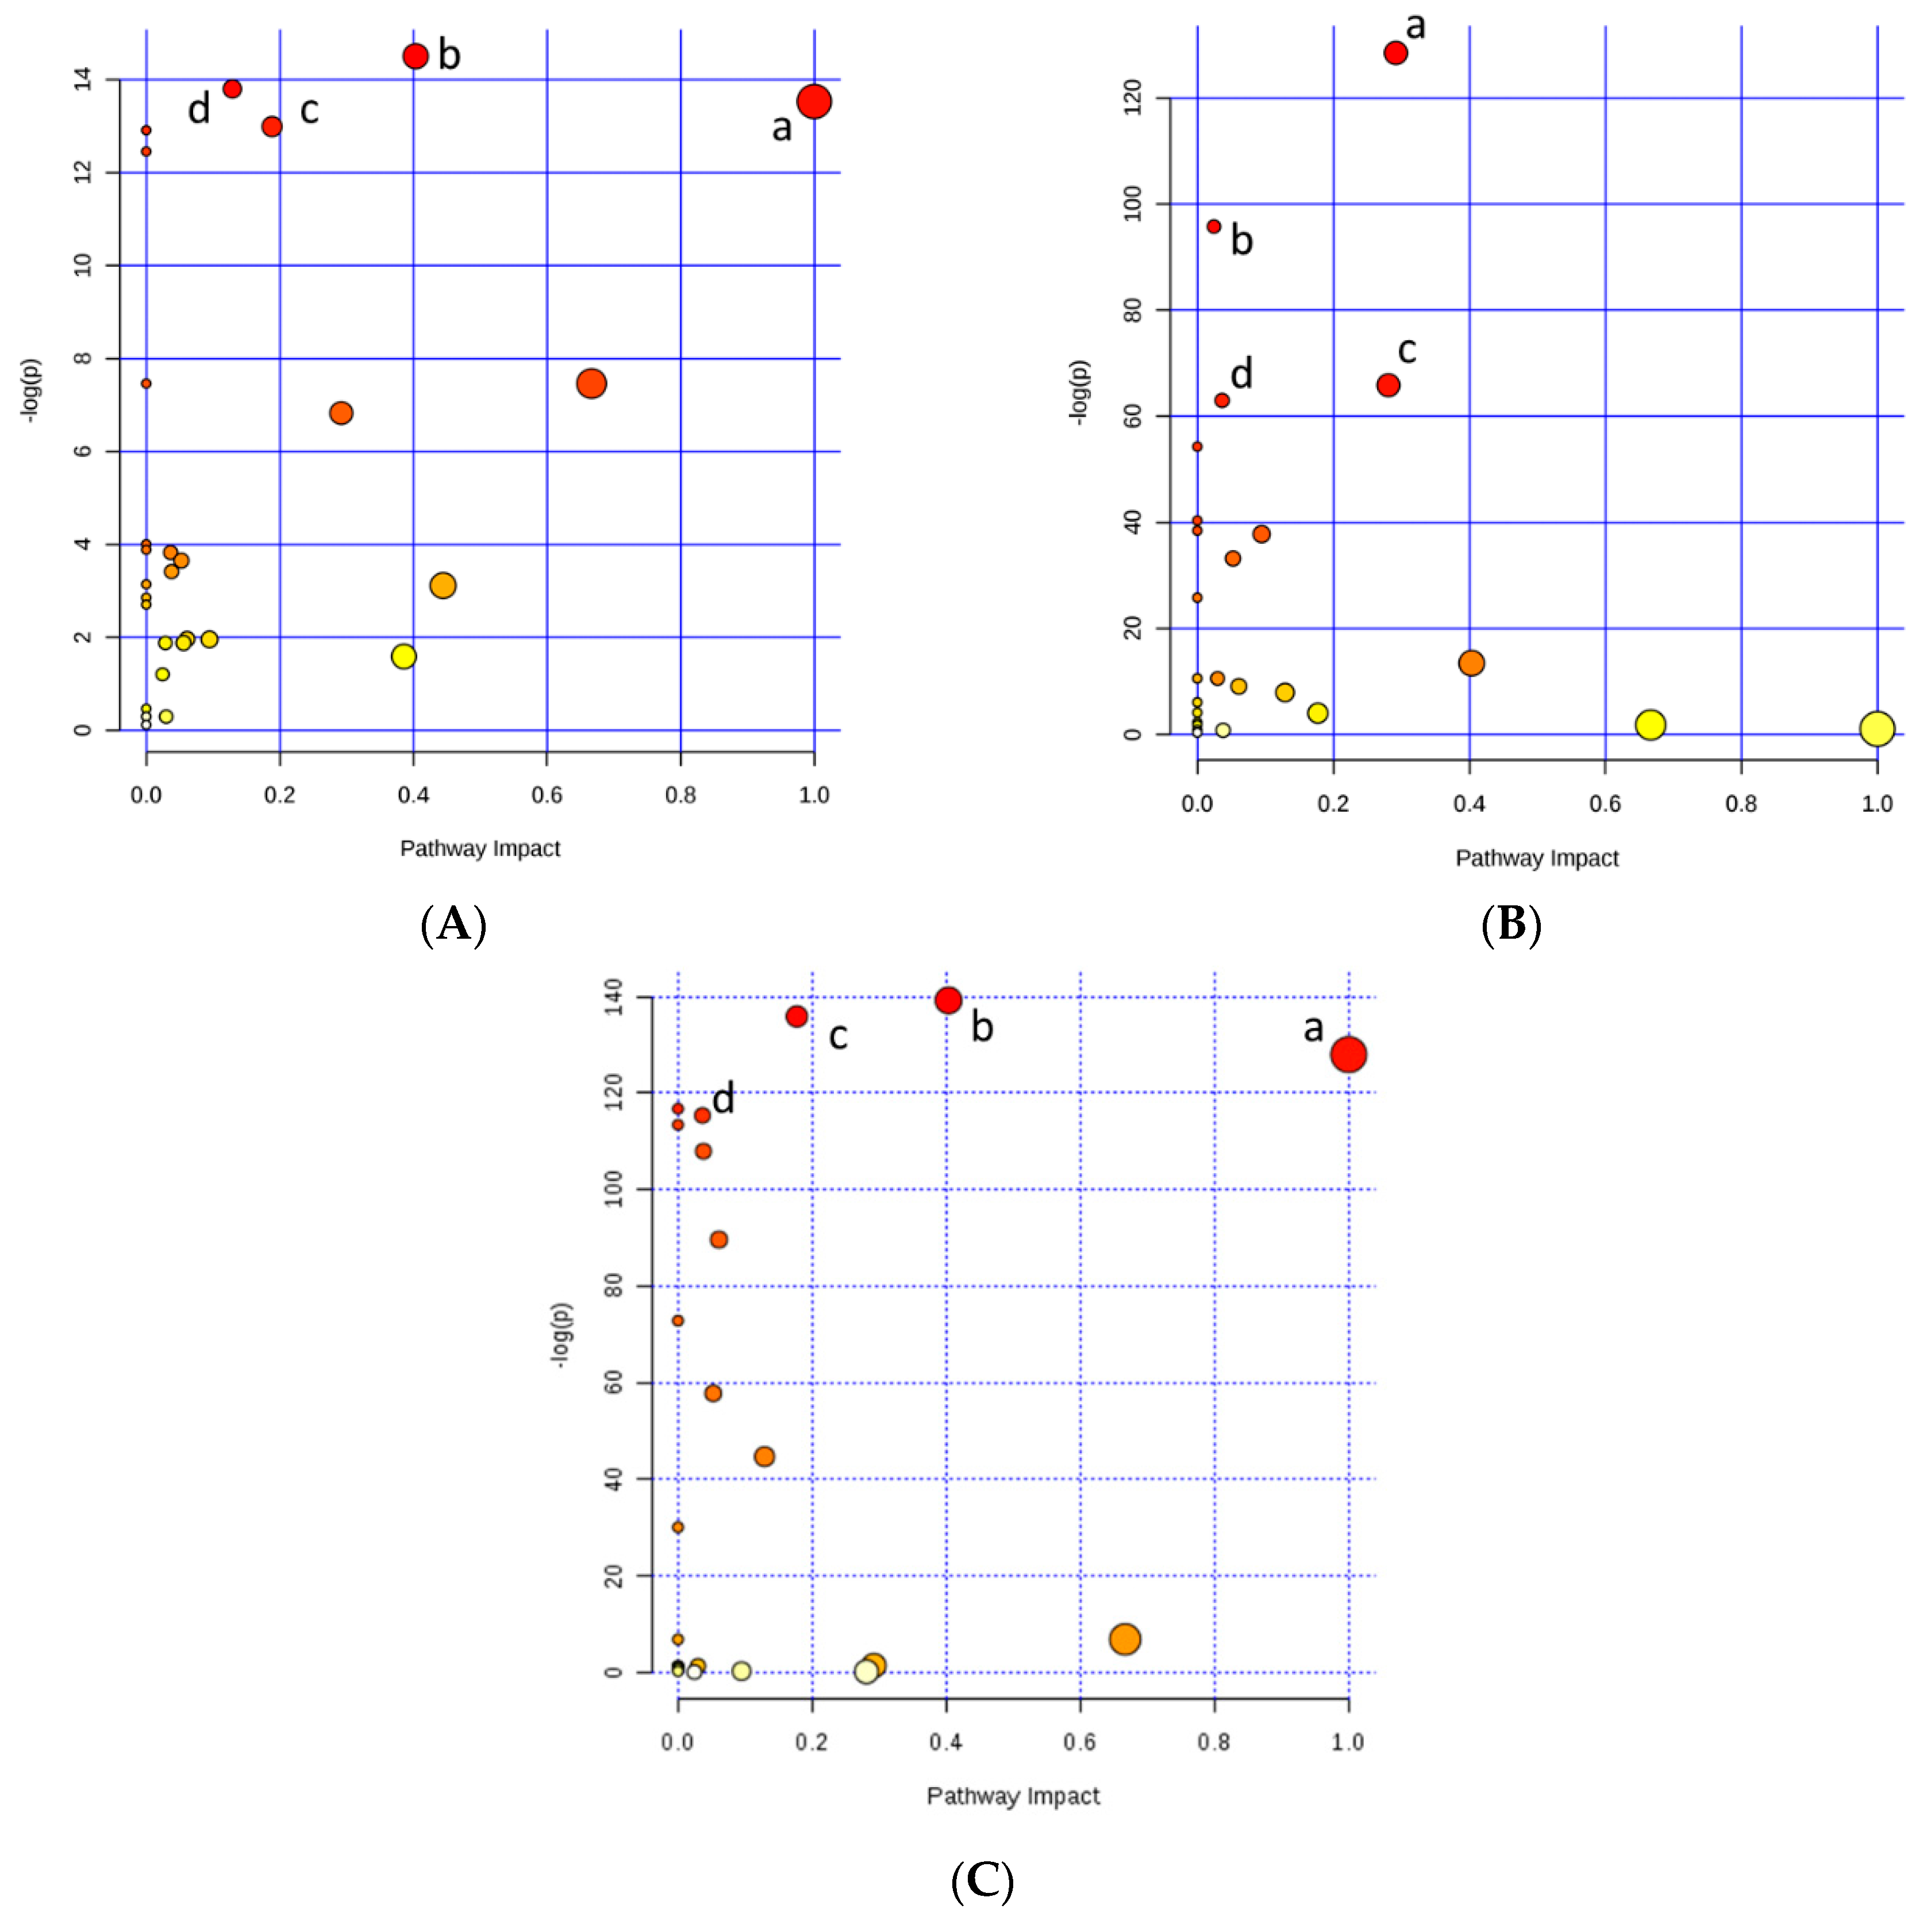
| Metabolic Pathway | Total Cmpd | Hits | Raw p | −log(p) | Impact |
|---|---|---|---|---|---|
| HP and LP | |||||
| Alanine, aspartate and glutamate metabolism | 23 | 4 | 5.01 × 10⁻⁷ | 14.508 | 0.4033 |
| Purine metabolism | 68 | 4 | 1.01 × 10⁻⁶ | 13.803 | 0.1290 |
| D-Glutamine and D-glutamate metabolism | 5 | 2 | 1.33 × 10⁻⁶ | 13.533 | 1 |
| Arginine and proline metabolism | 44 | 5 | 2.27 × 10⁻⁶ | 12.994 | 0.1883 |
| Growth and Precocity | |||||
| Glycine, serine and threonine metabolism | 32 | 3 | 1.58 × 10−56 | 128.49 | 0.2919 |
| Glycerophospholipid metabolism | 29 | 1 | 2.59 × 10−42 | 95.758 | 0.0244 |
| Glycerolipid metabolism | 18 | 1 | 2.52 × 10⁻²⁹ | 65.85 | 0.2809 |
| Galactose metabolism | 26 | 2 | 4.43 × 10⁻²⁸ | 62.984 | 0.0364 |
| High and Low | |||||
| Alanine, aspartate and glutamate metabolism | 23 | 4 | 3.34 × 10−61 | 139.25 | 0.4033 |
| Arginine and proline metabolism | 44 | 4 | 9.38 × 10−60 | 135.92 | 0.1772 |
| D-Glutamine and D-glutamate metabolism | 5 | 2 | 2.56 × 10−56 | 128.01 | 1 |
| Nitrogen metabolism | 9 | 3 | 1.95 × 10−51 | 116.76 | 0 |
| Galactose metabolism | 26 | 2 | 7.87 × 10−51 | 115.37 | 0.0364 |
© 2020 by the authors. Licensee MDPI, Basel, Switzerland. This article is an open access article distributed under the terms and conditions of the Creative Commons Attribution (CC BY) license (http://creativecommons.org/licenses/by/4.0/).
Share and Cite
Cônsolo, N.R.B.; da Silva, J.; Buarque, V.L.M.; Higuera-Padilla, A.; Barbosa, L.C.G.S.; Zawadzki, A.; Colnago, L.A.; Saran Netto, A.; Gerrard, D.E.; Silva, S.L. Selection for Growth and Precocity Alters Muscle Metabolism in Nellore Cattle. Metabolites 2020, 10, 58. https://doi.org/10.3390/metabo10020058
Cônsolo NRB, da Silva J, Buarque VLM, Higuera-Padilla A, Barbosa LCGS, Zawadzki A, Colnago LA, Saran Netto A, Gerrard DE, Silva SL. Selection for Growth and Precocity Alters Muscle Metabolism in Nellore Cattle. Metabolites. 2020; 10(2):58. https://doi.org/10.3390/metabo10020058
Chicago/Turabian StyleCônsolo, Nara Regina Brandão, Juliana da Silva, Vicente Luiz Macedo Buarque, Angel Higuera-Padilla, Luis Carlos Garibaldi Simon Barbosa, Andressa Zawadzki, Luis Alberto Colnago, Arlindo Saran Netto, David Edwin Gerrard, and Saulo Luz Silva. 2020. "Selection for Growth and Precocity Alters Muscle Metabolism in Nellore Cattle" Metabolites 10, no. 2: 58. https://doi.org/10.3390/metabo10020058
APA StyleCônsolo, N. R. B., da Silva, J., Buarque, V. L. M., Higuera-Padilla, A., Barbosa, L. C. G. S., Zawadzki, A., Colnago, L. A., Saran Netto, A., Gerrard, D. E., & Silva, S. L. (2020). Selection for Growth and Precocity Alters Muscle Metabolism in Nellore Cattle. Metabolites, 10(2), 58. https://doi.org/10.3390/metabo10020058