Abstract
Rehabilitation using cryotherapy has widely been used in inflammatory diseases to relieve pain and decrease the disease activity. The aim of this study was to explore the metabolite changes in inflammatory knee-joint synovial fluids following local cryotherapy treatment (ice or cold CO2). We used proton nuclear magnetic resonance (1H NMR) spectroscopy to assess the metabolite patterns in synovial fluid (SF) in patients with knee arthritis (n = 46) before (D0) and after (D1, 24 h later) two applications of local cryotherapy. Spectra from aqueous samples and organic extracts were obtained with an 11.75 Tesla spectrometer. The metabolite concentrations within the SF were compared between D1 and D0 using multiple comparisons with the application of a false discovery rate (FDR) adjusted at 10% for each metabolite. A total of 32 metabolites/chemical structures were identified including amino acids, organic acids, fatty acids or sugars. Pyruvate, alanine, citrate, threonine was significantly higher at D1 vs D0 (p < 0.05). Tyrosine concentration significantly decreases after cryotherapy application (p < 0.001). We did not observe any effect of gender and cooling technique on metabolite concentrations between D0 and D1 (p > 0.05). The present study provides new insight into a short-term effect of cold stimulus in synovial fluid from patients with knee arthritis. Our observations suggest that the increased level of metabolites involved in energy metabolism may explain the underlying molecular pathways that mediate the antioxidant and anti-inflammatory capacities of cryotherapy.
1. Introduction
Inflammatory arthritis is characterized by an inflammation of the synovial membrane (synovitis), which leads to disability and a substantial reduction in quality of life [1]. The inflamed synovium contains infiltrated inflammatory cells (activated T cells and macrophages), as well as an excess of pro-inflammatory cytokines (interleukin-1 (IL-1) and Tumor Necrosis Factor alpha (TNFα)), accelerating thereby the production of reactive oxygen species (ROS) and connective tissue damages [2]. The raised ROS levels can damage tissues, proteins, lipids and matrix components [3]. Further, several studies have shown a raised oxidative stress in synovial fluid in rheumatoid arthritis patients and associated the disease to a declined antioxidant capacity [4]. The impaired antioxidant system amplifies the synovial inflammatory-proliferative response [4], and may provoke a joint degradation and periarticular deformities [5]. Without treatment, synovitis may lead to the destruction of articular cartilage and subchondral bone.
The symptomatic medications for inflammatory rheumatic diseases, including corticosteroids and nonsteroidal anti-inflammatory drugs (NSAIDs), are closely related to the oxidant/antioxidant imbalance and the inflammatory responses [4]. Synthetic disease modifying anti rheumatic drugs or targeted biologics may suppress disease inflammatory activity in rheumatoid arthritis or spondyloarthritis. However, pharmacotherapy alone is not enough to restore complete locomotor functions in patients suffering from knee arthritis. To reduce the oxidant stress and relieve pain in inflammatory diseases, adjuvant non-pharmacological methods are often used, such as cryotherapy [6,7]. It consists of an external application of cold (cooled gas, cooled fluids, ice) in the proximity of the joints. In addition to the low cost, this therapy is well known as efficient method to increase antioxidative buffering capacities [8,9] and to mitigate the symptoms of inflammation, edema, pain and swelling [10]. Cold-induced vasoconstriction induces a decrease in synovial blood flow in arthritic patients [11], reducing thereby the nerve conduction velocity, the nociceptor excitability thresholds, the local inflammatory mediators [12,13] and the enzyme activities [14]. Therefore, several studies suggested the use of cryotherapy as adjuvant therapy in patients with inflammatory diseases to improve the locomotor function and to reduce the disease activity [15,16,17].
Guillot et al. have carried out a series of studies in patients with knee arthritis [6,18] and arthritic rats [19] to investigate the impact of local cryotherapy on inflammatory mediators and enzyme pathways in the synovial fluid. The authors demonstrated that local cryotherapy (ice and cold CO2), applied twice at an interval of 8 h, inhibits pro-inflammatory cytokine and enzyme pathways in the synovial fluid of non-septic arthritic knees through a reduction in synovial levels of interleukin 6 (IL-6), interleukin 1β (IL-1β), vascular endothelial growth factor (VEGF), prostaglandin-E2 (PG-E2), and nuclear factor kappa B p65 (NF-kB-p65) [6]. They also reported that local cryotherapy reduces the synovial Power Doppler activity and pain over 24 h in knee arthritis [18]. Likewise, for the animal model, the authors have observed that local cryotherapy is efficient to reduce the disease activity through a down-regulation of joint and systemic IL-6/IL-17 pathway [19]. The current study comes as part of a continuity of these studies in the same group of patients suffering from knee arthritis.
We aimed to investigate the impact of local cryotherapy (ice and cold CO2), applied twice during 1 day at an 8-h interval, on metabolite content of the synovial fluid. To this end, we have used proton nuclear magnetic resonance (1H NMR) spectroscopy to identify the metabolite patterns in synovial fluid in patients with knee arthritis. Nuclear magnetic resonance (NMR) is a reproducible tool in analytical chemistry. It is used to assess and quantify a wide variety of metabolites in order to correctly diagnose diseases and reveal new therapeutic avenues [20,21,22]. This approach has been previously used to assess the metabolite profiles of knee-joint synovial fluid obtained from patients with knee arthritis [23,24,25] or from animal models of osteoarthritis [26,27]. The present study may provide novel insights into the underlying molecular pathways involved in cryotherapy’s antioxidative and anti-inflammatory effects.
2. Results
2.1. Metabolite Identification in SF Samples
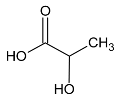
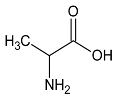
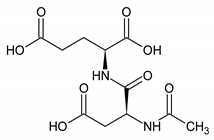
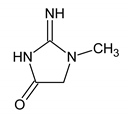
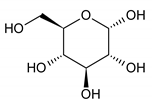
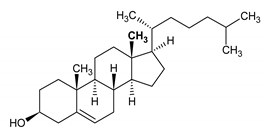
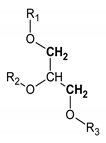
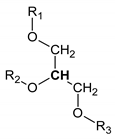
The analyzed spectral allowed us to identify 32 metabolites/chemical structures, characterized by a molecular weight lower than 1000 Da. The metabolites identified within the synovial fluid with 1H NMR spectroscopy included amino acids, organic acids, fatty acids or sugars. Representative spectra from aqueous samples and organic extracts are presented in Figure 1. As depicted in Table 1 and Table 2, the name, the chemical structure, the chemical shift, the integrated signal, the number of 1H and the human metabolome database (HMDB) reference are presented for each annotated metabolite. All the raw data have been registered in MetaboLights database (ref MTBLS1894).
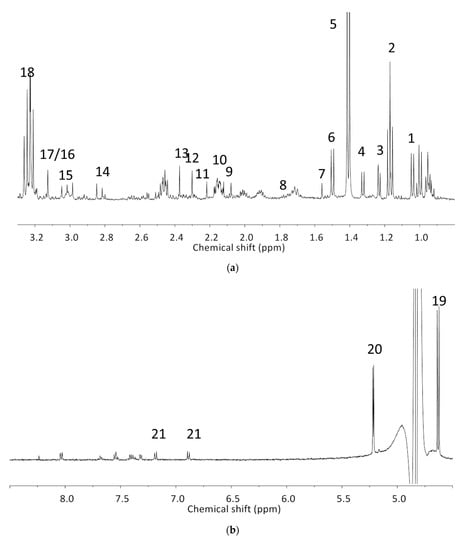
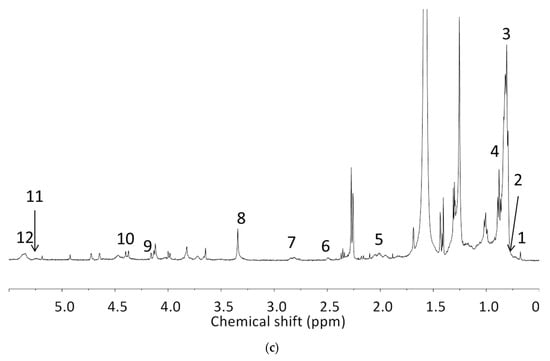

Table 1.
Names, peak numbering on spectra, HMBD ID, chemical structure and chemical shift assignments of the metabolites observed in the NMR spectra of Synovial Fluid samples for the aqueous phase.

Table 2.
Names, peak numbering on spectra, chemical structure and chemical shift assignments of the metabolites observed in the NMR spectra of synovial fluid samples for organic phase.
2.2. Effect of Local Cryotherapy on Metabolite Concentrations
The analysis was conducted on SF samples taken before (D0) and after (D1) the local cryotherapy treatment. A total of 32 signals were analyzed with 1H NMR spectra. Five metabolites were significantly different between D0 and D1 (p < 0.05).
These metabolites are pyruvate, alanine, citrate, threonine and tyrosine. These metabolites’ concentrations (Figure 2, Table 3 and Table 4) were significantly higher at D1 vs D0 (p < 0.05) except tyrosine concentration which was significantly lower at D1 compared with D0 (p < 0.001). Polyunsaturated fatty acid concentration increases after local cryotherapy application, but the changes did not reach statistical significance.
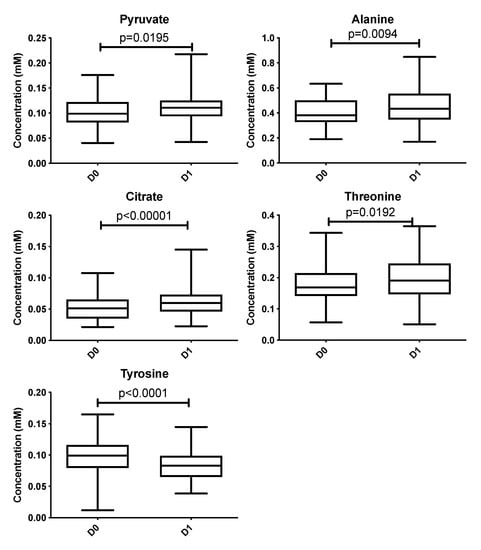
Figure 2.
Boxplots of metabolites identified from multivariate analysis as significantly different between D0 vs. D1 at an adjusted p with a false discovery rate of 10%. Y-axis represents metabolite concentration (mM).

Table 3.
Concentration (mM) of metabolites in aqueous samples before (D0) and after (D1) the local cryotherapy treatment (n = 46) (results are expressed as mean ± SD and adjusted p value; bolding indicates significant changes in the metabolite concentration with a false discovery rate of 10%).

Table 4.
Integration of signal (relative to TMS integrate signal) in organic extract before (D0) and after (D1) the local cryotherapy treatment (n = 44) (Mean ± SD; adjusted p value with a false discovery rate of 10%).
For PCA and PLS-DA, the score and the loading plots were provided as Supplementary data with detailed methods.
Regarding the gender and the cooling technique effects, we did not observe any difference in metabolite concentrations between D0 and D1 (Table 5 and Table 6).

Table 5.
Difference between concentration (mM) of metabolites in aqueous samples measured at D1 and D0 in men and women (Mean ± SD; adjusted p value with a false discovery rate of 10%) and in patient receiving either local ice or hyperbaric cold CO2 (Mean ± SD; adjusted p value with a false discovery rate of 10%).

Table 6.
Integration of signal (relative to TMS integrated signal) in organic extract at D1 and D0 in men and women (Mean ± SD; adjusted p value with a false discovery rate 10%)) and in patients receiving either local ice or hyperbaric cold CO2 (Mean ± SD; adjusted p value with a false discovery rate of 10%).
2.3. Pathway Analysis
The results from pathway analysis are presented in a graphical output (Figure 3) and a table (Table 7) which displays all the matched metabolic pathways. The 20 identified metabolites correlated with 23 metabolic pathways.
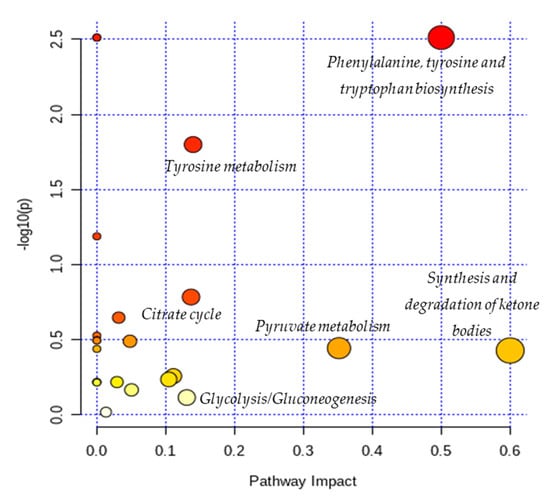
Figure 3.
Overview of pathway analysis arranged according to the scores from enrichment analysis (y axis) and from topology analysis (x axis). The color and size of a circle (pathways) are based on its p-value and pathway impact value, respectively. The circles located in the top right diagonal region represents pathways with significant metabolite changes and higher impact. The pathways names with highest impact values (biggest circles) are mentioned in the figure (Phenylalanine, tyrosine and tryptophan biosynthesis; Tyrosine metabolism; Citrate cycle; Glycolysis/Gluconeogenesis; Pyruvate metabolism; Synthesis and degradation of ketone bodies).

Table 7.
Results of pathway analysis with MetaboAnalyst 4.0 (https://www.metaboanalyst.ca) indicating the total number of the involved metabolites and those detected in our data with the p-value and the impact of each metabolic pathway.
As depicted in Table 7, the topology analysis showed that five pathways (Cysteine and methionine metabolism; Butanoate metabolism; Glycolysis/Gluconeogenesis; Citrate cycle (TCA cycle); Tyrosine metabolism) have an impact value between 0.1 and 0.2, and three pathways (Pyruvate metabolism; Phenylalanine, tyrosine and tryptophan biosynthesis; Synthesis and degradation of ketone bodies) have an impact value higher than 0.2. Among them, two pathways (Phenylalanine, tyrosine and tryptophan biosynthesis; Tyrosine metabolism) have a low p-values according to the enrichment analysis.
3. Discussion
The present study aimed to identify the metabolite changes in synovial fluid taken from patients suffering from knee arthritis before and after two applications of local cryotherapy. The synovial specimens we analyzed were aliquots of the specimens obtained from the patients investigated in the study of Guillot et al. [6], where the level of inflammation was shown to decrease after cold treatment. We observed that local cryotherapy applied twice led to a significant increase in the concentration of pyruvate, alanine, citrate, threonine and a significant decrease in tyrosine concentration in inflammatory synovial fluid. These observations indicate an increased energy metabolism as observed in the pathway analysis (Table 7 and Figure 3). However, previous studies reported that some of these metabolites might have anti-oxidative and anti-inflammatory effects [28,29,30,31,32].
It has been previously reported that pyruvate and alanine are two important metabolites involved in the anti-oxidant and anti-inflammatory responses [28,31,32]. Pyruvate is a very important biological molecule involved in a large number of biological processes, such as the tricarboxylic acid (TCA) cycle, glycolysis, and glycogenesis. Besides its role in energy metabolism, this glucose metabolite is known as an effective scavenger for ROS by protecting cells against the toxic action of hydrogen peroxide (H2O2), suggesting thereby its potent antioxidant action [28,33,34]. Furthermore, pyruvate has been reported as endogenous anti-inflammatory molecules by suppressing nuclear factor (NF)-a secretion, nuclear factor-kappa (NF-k)-B expression and is able to enhance the production of anti-inflammatory cytokines [28]. Other investigators reported that ethyl pyruvate, a derivative of pyruvate, attenuated synovial inflammation and bone destruction in mice with collagen-induced arthritis through suppression of IL-17 and high mobility group box 1 protein (HMGB-1). The increase in the concentration of pyruvate that we observed in the synovial fluid of these patients could partially explain the anti-inflammatory effect of local cryotherapy previously observed in this population [6]. Our results are in line with our previous findings [6], that demonstrated that local cryotherapy inhibits the pro-inflammatory cytokine and enzyme pathways in the synovial fluid of arthritic knees. Moreover, a growing body of literature [10,16] examined the use of cryotherapy to relieve rheumatic and inflammatory diseases such as rheumatoid arthritis. Cryotherapy has been used as a rehabilitation treatment in patients suffering from inflammatory arthritis due its analgesic effect [12,18] and its efficient effects in reducing inflammatory mediator’s activity such as pro-inflammatory cytokines [6], histamine levels [35] and oxidative stress [2].
Further, we have observed that local cryotherapy increases the alanine level in the synovial fluid of arthritic patients. The raised level of alanine may be related to the glucose-alanine cycle, which consists in converting pyruvate to alanine by glutamate-pyruvate transaminase (GPT). Alanine can then be transported to the liver to act as a substrate in the gluconeogenesis process [36]. Beta-alanine is an amino acid directly involved in increasing the intramuscular carnosine content. The antioxidant capacity and the buffering effect of this compound are well documented [37,38,39,40]. Ponist et al. [37] evaluated the therapeutic aspect of carnosine in rats with arthritis. They demonstrated a systemic anti-inflammatory activity and a protective effect of carnosine against the damage caused by oxidative stress on chondrocytes. These cells are involved in preventing the breakdown of cartilage in arthritic joints. Furthermore, β-alanine supplementation has been shown to be effective in delaying neuromuscular fatigue and improving the intramuscular pH stability by reducing acidosis during physical exercise [32,39,41]. The antioxidant action of alanine has also been reported in endothelial cells through an enhanced expression of the antioxidant defense proteins Heme oxygenase (HO)-1 and ferritin [32]. Taken together, the increased level of alanine can partially explain the anti-oxidant effect induced by cold exposure in knee joint.
Moreover, the NMR analysis showed an increased citrate level in synovial fluid following the cold exposure. Despite the lack of a direct role for citrate in inflammation, it has been suggested as an important metabolite in immunity and inflammation [42]. Citrate transportation has been demonstrated to regulate the inflammatory response due to the mitochondrial citrate carrier (CIC). The latter is responsible for the transport of citrate from the mitochondria, where it is produced as part of the TCA cycle, to the cytosol. Citrate is cleaved then by citrate lyase into acetyl-CoA and oxaloacetate, precursors of nitric oxide (NO), ROS, and arachidonic acid. The CIC expression has been demonstrated to increase in the lipopolysaccharide (LPS)-activated immune cells. Moreover, CIC silencing and the CIC activity inhibition have been shown to impair the production of ROS, NO, and prostaglandins (PGs) [43]. The increased level of citrate that we observed may explain an inhibited inflammatory process by a lower degradation of citrate to acetyl-CoA and a lower inflammatory mediator expression (ROS, NO and PGs).
In addition, NMR analysis of SF samples from aqueous phase revealed a decreased concentration of tyrosine after two applications of local cryotherapy. In autoimmune diseases such as rheumatoid arthritis, pro-inflammatory mediators have been shown to activate a series of intracellular signaling pathways such as tyrosine phosphorylation [44]. This specific signaling pathway is regulated by the protein tyrosine kinase [45]. The increased level of this enzyme in SF of patients with rheumatoid arthritis was considered as an indicator of the pathogenesis, the inflammatory process and the disease state [46]. A large number of tyrosine kinase inhibitors (ex: imatinib and dasatinib) have been developed to provide therapeutic benefits in the treatment of inflammatory arthritis [47,48]. Our observations revealed that local cryotherapy reduce the tyrosine concentration, suggesting a possible attenuated inflammation response in SF after exposure to cold stimulus.
We have also observed an increased level of threonine after local cryotherapy exposure in arthritic knee. Threonine is a very important amino acid for the production and stabilization of collagen [49]. It interferes with glycine and serine to strengthen connective tissues and muscles and help them to remain elastic throughout the body [50]. Hence, the increased threonine level in synovial fluid after local cryotherapy application may accelerate the healing and the recovery from joint inflammation.
NMR analysis of organic extracts shows that local cryotherapy tends to increase polyunsaturated fatty acid (PUFA) concentration in synovial fluid. The multiples comparisons did not show a significant increase. A specific investigation of this molecule could be of interest in a future experiment with more volunteers to explore the metabolic pathways used to generate the positive effects of cryotherapy on synovial inflammation. PUFA is characterized by the presence of two or more double bonds. Its anti-inflammatory action in inflammatory diseases is well documented [51,52,53,54,55,56]. The PUFA dietary supplementation, especially by n-3 fatty acid eicosapentaenoic acid (EPA), has also been shown to inhibit the production of arachidonic acid-derived pro-inflammatory eicosanoids (prostaglandin E2 and leukotriene B4), proinflammatory cytokines, reactive oxygen species, lymphocytes reactivity [53,55,57] and to increase anti-inflammatory cytokines (e.g., IL-10) [58]. Moreover, a previous work has demonstrated that PUFA (docosahexaenoic acid) supplementation in mice with rheumatoid arthritis reduces cartilage destruction, bone damage, pro-inflammatory cytokines levels, and anti-collagen antibodies [59]. Therefore, several studies [51,53,54,57] and meta-analysis [60,61] suggested the use of PUFA as an attractive adjunctive treatment for inflammatory diseases, such as rheumatoid arthritis due to its potent capacity in reducing disease activity, NSAIDs consumption, joint pain intensity and duration of morning stiffness. In addition to its anti-inflammatory effect, the high level of PUFA in the synovial fluid may indicate a decrease in oxidative stress [62,63].
In addition, the pathway analysis showed that the metabolites with higher impact values (pyruvate, alanine, citrate, tyrosine and threonine) are involved in energy metabolic pathways such as: glycolysis/gluconeogenesis; pyruvate metabolism; citrate cycle (TCA cycle); tyrosine metabolism; Phenylalanine, tyrosine and tryptophan biosynthesis and synthesis and degradation of ketone bodies. Indeed, we suggest that local cryotherapy stimulates these metabolic pathways in patients with joint inflammation and that is may be involved in the reduced inflammatory reaction as observed in Guillot’s study [6] on this population.
This work presents nevertheless some limitations. The heterogeneous nature (gender, age) of the arthritic patients’ cohort reveals an inter-individual variability which strongly compromised the use of principal component analysis (PCA) for metabolomics approach. With using PCA, we were not able to segregate treated (cooling techniques: D1) and non-treated (without cooling: D0) samples with a high degree of accuracy. Furthermore, we had a rather low number of included individuals. Hence, we have presented only multivariate analyses in order to test the effect of cryotherapy treatment on the evolution of each metabolite. A further limitation of this study was that we were unable to include control SF samples from healthy individuals and from patients. It is always complicated to obtain SF samples from healthy subjects and from patients as joint aspirations (two in our study design) remain invasive and painful procedures.
In our sample preparation, the choice of using TSP as a reference for quantification could be questioned. Indeed, it is known that TSP could bind proteins in biofluids containing proteins such as SF. Beckonert et al. recommend to determine absolute concentrations using an internal standard of known concentration, as formate, or with addition into the sample of a standard of the analyte of interest [64]. However, before the addition of TSP, SF underwent treatment procedure with a filtration step with 10K centrifugal device to remove proteins. We have also checked that spectra did not show any presence of proteins. Finally, it has to be noted that the concentration of glucose, lactate, citrate and pyruvate in SF reported in the scientific literature using various techniques including HPLC and enzymatic assays in human and animal models are in accordance with our data [65,66,67].
4. Experimental Methods
4.1. Patients
The included patients (n = 46, Age: 60 ± 14 years, 22 men and 24 women) were suffering from non-septic knee arthritis. They were enrolled in the investigation, which was declared and approved by the local ethics committee (clinicaltrials.gov: NCT03850392, Comité de Protection des Personnes–Est II: 12-664). The patients were included consecutively after signed informed consent.The patients received no biological or conventional DMARD treatment for 6 months before inclusion. They did not receive any local cryotherapy in the month before inclusion.
4.2. Study Design and Patient Sample Collection
The patients were then randomized to receive either local ice (Thermogel®, Artsana, Grandate, Italy; 30-min application; n = 30) or hyperbaric cold CO2 at −78 °C (Cryo+®, Cryonic, Salins-les-Bains, France; 2-min application; n = 16). They received two applications of cooling technique (ice or cold CO2) at an 8-h interval (9 a.m. and 5 p.m.). Synovial fluid (SF) samples were taken from the knee joint on D0 (just before the first application of cold) then D1 (24 h later) at the same time of the day in order to limit the risk of bias linked to circadian variations. The SF specimens collected in syringe were transferred to Falcon tubes (15 mL) and centrifuged twice at 2500× g at 4 °C during 15 min. Supernatants were then frozen at −80 °C into 500 µL Eppendorf tubes. No blood contamination was observed.
4.3. Sample Preparation for NMR Analysis
Solvents were purchased from Sigma Aldrich®, Saint-Quentin Fallavier, France and NMR tubes from CortecNet®, Voisins-Le-Bretonneux, France. Sample preparation was conducted on 46 patients for aqueous analysis and 44 patients for organic extracts because of low volumes of SF for 2 patients.
Organic extracts were prepared using a biphasic extraction [68,69]. A total of 400 µL of SF samples was thawed at room temperature and mixed with 450 µL of cold methanol and 450 µL of cold chloroform. Samples were vortexed 30 s after each step and were placed into ice for twenty minutes. Samples were centrifugated at 8000× g at 4 °C during 10 min. A total of 400 µL of organic fraction was placed in a 1.5 mL eppendorf tube and evaporated under a nitrogen flow. Dry pellets were stored at −20 °C until NMR analysis. Before NMR analysis, pellets were suspended in 600 µL of a mixture of 90% chloroform-D and 10% chloroform-D containing 0.05% (v/v) of Tetramethylsilane (TMS). A total of 500 µL was placed in a 5 mm pyrex NMR sample tube.
Aqueous samples were prepared by filtration to remove proteins. SF samples were thawed at room temperature. For each sample, two centrifugal devices (Pall Nanosep® centrifugal device (from Merck KGaA, Darmstadt, Germany) with Omega membrane 10 K from Sigma Aldrich in order to remove protein) were washed twice by addition of 500 µL of distilled water by centrifugation at 8000× g at room temperature during 10 min. 200 µL of SF sample was then mixed with 400 µL of deuterium oxide. Diluted samples were centrifuged at 9000× g at room temperature during 25 min, using the first centrifugal device. Non filtrated fraction was put on the second centrifugal devices and were centrifuged at 9000× g at room temperature during 25 min. A total of 250 µL of pooled filtrate was mixed with 250 µL of deuterium oxide and 25 µL of deuterium oxide containing 0.05 wt. % 3-(trimethylsilyl)propionic-2,2,3,3-d4 acid, sodium salt. pH was adjusted at 2.50 ± 0.05 with addition of concentrated chlorhydric acid. A total of 500 µL was introduced in a 5 mm pyrex NMR sample tube. NMR analysis occurred immediately after the preparation.
4.4. Proton NMR Spectroscopy
All NMR experiments and data analysis were performed randomly, on one unique period for each type of samples.
- (a)
- Instrument description: Spectra were obtained with a 11.75 Tesla spectrometer 500SB Bruker (Bruker BioSpin®, Wissenbourg, France)—spectrometer consoles were Avance I and Neo for organic extracts and aqueous samples, respectively. The magnet was equipped with a 5 mm broad band inverse (BBi) 1H/13C probe (Bruker BioSpin®, Wissenbourg, France). Tuning and matching were automated. Automated gradient shimming for Z coils were used and manual optimization were performed when needed. Spectrometer was controlled with TopSpin 4.0.8 software (Bruker BioSpin®, Wissenbourg, France).
- (b)
- Spectra acquisition parameters: Organic extracts were thermostated at 293 K without spinning. One-dimensional (1-D) 1H NMR spectra were obtained at 500.09 MHz using a 1-D experiment impulsion acquisition sequence (zg). Spectra were obtained in 9 min by accumulating 64 free induction decay (FID) and 4 dummy scans. Acquisition time was 5.45 s with a spectral width of 6 kHz collected in 64 K data points and an additional relaxation delay d1 of 2 s. The 90° pulse delay was 6.7 µs with power level at −1 dB. Receiver gain was set at 512 for each sample. Aqueous samples were thermostated at 293 K without spinning. One-dimensional (1-D) 1H NMR spectra were obtained at 500.09 MHz using a 1-D experiment impulsion acquisition sequence using a noesygppr1d pulse sequence (Bruker) with presaturation delay during relaxation delay (d1 = 5 s) and mixing time (d8 = 10 ms). Homospoil/gradient pulse p16 was 1 ms and delay for homospoil/gradient recovery was 200 µs. Spectra were obtained in 23 min and 20 s by accumulating 128 free induction decay (FID) and 4 dummy scans. Acquisition time was 5.57 s with a spectral width of 6 kHz collected in 64 K data points. The 90° pulse delay was 8 µs with power level at −11.78 dB. In addition, the residual water resonance was pre-saturated with a 44.19 dB field strength irradiation. Receiver gain was set at 32 for each sample.
- (c)
- Spectra processing parameters: Raw data were registered in MetaboLights database [70]. All spectra were processed with TopSpin 4.0.8 software (Bruker BioSpin®, Wissenbourg, France). Typical processing parameters were application of Fourier transform without line broadening or zero filling. Chemical shifts (δ in ppm) were reported relative to the signal of the TSP or TMS at 0 ppm. Phase correction and baseline correction were corrected manually when needed. Isolated signal integrations were performed relative to reference signal (TSP or TMS).
For aqueous samples, TSP peak was also used as reference for quantification. Calibration of TPS peak, which had the same intensity in all spectra, was established from a 3 mM creatine solution containing TPS. The concentrations in the NMR tube of each metabolite were calculated in mmoles by liter and formulae for concentration calculations are presented below:
Metabolite concentrations in the SF were then corrected according to dilution factors as presented in the sample preparation section. A comparison of two options of quantification is presented in Supplementary data; it concerns the use of TSP with the SF or in a coaxial NMR tube.
For organic extracts, signals were integrated relative to TMS signal which remained the same in all spectra. Integrated signals corresponding to a chemical function/pattern with a group of metabolites were studied. No absolute quantitation was performed.
Annotation of the metabolites was performed using the Human Metabolome Database [71], the Magnetic Resonance Metabolomics Database [72], our own database performed at pH = 2.50 ± 0.05, and literature on biofluids [73,74]. According to the Metabolite Identification Task Group from the Metabolomics Standards Initiative, the level of identification was 2 for aqueous samples and 3 for organic phase [75].
4.5. Data Processing and Statistical Analysis
4.5.1. Multivariate Analysis
Statistical analyses were performed using specialized statistical software (https://www.graphpad.com/). The Gaussian distribution was tested for each variable using the Shapiro–Wilk test. Multiples comparisons were used to assess the significant difference between metabolite concentrations in synovial fluid of treated arthritic knees (D1) and non-treated arthritic knees (D0) and p-values were adjusted using a false discovery rate (FDR) procedure and a desire FDR set at 10% according to adaptative method of Benjamini, Krieger and Yekutieli with a desire FDR (Q) at 10%. Gender and the technique impacts were also tested for metabolites that presented a significant difference in their concentrations between D0 and D1. The results of the tests were considered significant at p ≤ 0.05 (adjusted p with an FDR of 10%). The results were expressed as mean and standard deviation (SD).
The principal component analysis (PCA) and partial least squares-discriminant analysis (PLS-DA) methods and results were provided in the Supplementary data.
4.5.2. Pathway Analysis
We have performed a pathway analysis using Metaboanalyst 4.0 (https://www.metaboanalyst.ca), an easy-to-use web-based tool suite for comprehensive and integrative metabolomics data analysis [76]. The metabolites’ concentrations table was normalized by a pooled average sample from control group (Day-0) and auto-scaled. We have used KEGG library for “Homo sapiens” and we have launched two forms of pathway analysis: enrichment (global test) and topology (relative-betweenness centrality) to assess the p-values and the pathway impact values respectively.
5. Conclusions
Overall, our observation may explain in part the reduced joint inflammation in synovial fluid following local cooling application reported in the study of Guillot et al. [6] on this population. As observed in the literature, our results suggest that the anti-inflammatory and the antioxidant role of cryotherapy could partially be explained by the increased level of metabolites involved in the energy metabolism: glucose metabolite (pyruvate), organic acid (citrate), amino acids (alanine, tyrosine and threonine) and polyunsaturated fatty acid. However, more specific studies for each metabolite are of utmost importance to investigate the effect of cryotherapy on molecular pathways and on the activity of these metabolites in arthritic synovial fluid. It would also be of great interest to develop investigations where the clinical relevance of using cryotherapy on regular basis in arthritic patients could be highlighted.
Supplementary Materials
The following are available online at https://www.mdpi.com/2218-1989/10/11/460/s1, SD1-Complementary method for multivariate analysis, Figure S1: Multivariate analysis results on aqueous samples from automatic bucketing, Figure S2: Multivariate analysis results on aqueous samples from manual integration, Figure S3: Multivariate analysis results on organic extracts from automatic bucketing, Figure S4: Multivariate analysis results on organic extracts from manual integration, Table S1: Concentration (mM) of metabolites of one SF sample calculated using two methods: reference mixed with the SF and reference in an insert.
Author Contributions
Conceptualization: X.G. and B.D.; investigation: all authors; methodology: W.D., D.B., N.B, F.S., B.D. and O.D.; project administration: X.G., D.W., N.T., D.B. and B.D.; formal analysis: D.B., N.B., F.S. and W.D.; validation: D.B., N.B. and F.S.; writing—original draft: W.D., D.B. and B.D.; writing—review and editing: all authors. All authors provided critical feedbacks and contributed to the manuscript with their inputs. All authors have read and agreed to the published version of the manuscript.
Funding
The authors acknowledge the University of Poitiers and the “Institut National de la Santé et de la Recherche Médicale” (INSERM) for financial support of this work. The authors acknowledge financial support from the European Union (ERDF) and “Région Nouvelle Aquitaine”.
Acknowledgments
The authors wish to thank the volunteers for their participation in this investigation.
Conflicts of Interest
The authors declare no conflict of interest.
References
- Machin, A.R.; Babatunde, O.; Haththotuwa, R.; Scott, I.; Blagojevic-Bucknall, M.; Corp, N.; Chew-Graham, C.A.; Hider, S.L. The association between anxiety and disease activity and quality of life in rheumatoid arthritis: A systematic review and meta-analysis. Clin. Rheumatol. 2020, in press. [Google Scholar]
- Hirvonen, H.; Kautiainen, H.; Moilanen, E.; Mikkelsson, M.; Leirisalo-Repo, M. The effect of cryotherapy on total antioxidative capacity in patients with active seropositive rheumatoid arthritis. Rheumatol. Int. 2017, 37, 1481–1487. [Google Scholar] [CrossRef]
- Hitchon, C.A.; El-Gabalawy, H.S. Oxidation in rheumatoid arthritis. Arthritis Res. Ther. 2004, 6, 265–278. [Google Scholar] [CrossRef][Green Version]
- Hassan, S.Z.; Gheita, T.A.; Kenawy, S.A.; Fahim, A.T.; El-Sorougy, I.M.; Abdou, M.S. Oxidative stress in systemic lupus erythematosus and rheumatoid arthritis patients: Relationship to disease manifestations and activity. Int. J. Rheum. Dis. 2011, 14, 325–331. [Google Scholar] [CrossRef]
- Vasanthi, P.; Nalini, G.; Rajasekhar, G. Status of oxidative stress in rheumatoid arthritis. Int. J. Rheum. Dis. 2009, 12, 29–33. [Google Scholar] [CrossRef]
- Guillot, X.; Tordi, N.; Laheurte, C.; Pazart, L.; Prati, C.; Saas, P.; Wendling, D. Local ice cryotherapy decreases synovial interleukin 6, interleukin 1β, vascular endothelial growth factor, prostaglandin-E2, and nuclear factor kappa B p65 in human knee arthritis: A controlled study. Arthritis Res. Ther. 2019, 21, 180. [Google Scholar] [CrossRef] [PubMed]
- Sadoghi, P.; Hasenhütl, S.; Gruber, G.; Leitner, L.; Leithner, A.; Rumpold-Seitlinger, G.; Kastner, N.; Poolman, R.; Glehr, M. Impact of a new cryotherapy device on early rehabilitation after primary total knee arthroplasty (TKA): A prospective randomised controlled trial. Int. Orthop. 2018, 42, 1265–1273. [Google Scholar] [CrossRef] [PubMed]
- Lubkowska, A.; Dudzińska, W.; Bryczkowska, I.; Dołęgowska, B. Body Composition, Lipid Profile, Adipokine Concentration, and Antioxidant Capacity Changes during Interventions to Treat Overweight with Exercise Programme and Whole-Body Cryostimulation. Oxid. Med. Cell. Longev. 2015, 2015, 803197. [Google Scholar] [CrossRef] [PubMed]
- Dugué, B.; Smolander, J.; Westerlund, T.; Oksa, J.; Nieminen, R.; Moilanen, E.; Mikkelsson, M. Acute and long-term effects of winter swimming and whole-body cryotherapy on plasma antioxidative capacity in healthy women. Scand. J. Clin. Lab. Investig. 2005, 65, 395–402. [Google Scholar] [CrossRef] [PubMed]
- Demoulin, C.; Vanderthommen, M. Cryotherapy in rheumatic diseases. Jt. Bone Spine 2012, 79, 117–118. [Google Scholar] [CrossRef]
- Albrecht, K.; Albert, C.; Lange, U.; Müller-Ladner, U.; Strunk, J. Different effects of local cryogel and cold air physical therapy in wrist rheumatoid arthritis visualised by power Doppler ultrasound. Ann. Rheum. Dis. 2009, 68, 1234–1235. [Google Scholar] [CrossRef] [PubMed]
- Jastrząbek, R.; Straburzyńska-Lupa, A.; Rutkowski, R.; Romanowski, W. Effects of different local cryotherapies on systemic levels of TNF-α, IL-6, and clinical parameters in active rheumatoid arthritis. Rheumatol. Int. 2013, 33, 2053–2060. [Google Scholar] [CrossRef] [PubMed]
- Stålman, A.; Berglund, L.; Dungnerc, E.; Arner, P.; Felländer-Tsai, L. Temperature-sensitive release of prostaglandin E2 and diminished energy requirements in synovial tissue with postoperative cryotherapy: A prospective randomized study after knee arthroscopy. J. Bone Jt. Surg. Am. 2011, 93, 1961–1968. [Google Scholar] [CrossRef] [PubMed]
- Algafly, A.A.; George, K.P. The effect of cryotherapy on nerve conduction velocity, pain threshold and pain tolerance. Br. J. Sports Med. 2007, 41, 365–369, discussion 369. [Google Scholar] [CrossRef]
- Bettoni, L.; Bonomi, F.G.; Zani, V.; Manisco, L.; Indelicato, A.; Lanteri, P.; Banfi, G.; Lombardi, G. Effects of 15 consecutive cryotherapy sessions on the clinical output of fibromyalgic patients. Clin. Rheumatol. 2013, 32, 1337–1345. [Google Scholar] [CrossRef]
- Hirvonen, H.E.; Mikkelsson, M.K.; Kautiainen, H.; Pohjolainen, T.H.; Leirisalo-Repo, M. Effectiveness of different cryotherapies on pain and disease activity in active rheumatoid arthritis. A randomised single blinded controlled trial. Clin. Exp. Rheumatol. 2006, 24, 295. [Google Scholar] [PubMed]
- Stanek, A.; Cholewka, A.; Gadula, J.; Drzazga, Z.; Sieron, A.; Sieron-Stoltny, K. Can whole-body cryotherapy with subsequent kinesiotherapy procedures in closed type cryogenic chamber improve BASDAI, BASFI, and some spine mobility parameters and decrease pain intensity in patients with ankylosing spondylitis? BioMed Res. Int. 2015, 2015, 404259. [Google Scholar] [CrossRef]
- Guillot, X.; Tordi, N.; Prati, C.; Verhoeven, F.; Pazart, L.; Wendling, D. Cryotherapy decreases synovial Doppler activity and pain in knee arthritis: A randomized-controlled trial. Jt. Bone Spine Rev. Rhum. 2017, 84, 477–483. [Google Scholar] [CrossRef]
- Guillot, X.; Martin, H.; Seguin-Py, S.; Maguin-Gaté, K.; Moretto, J.; Totoson, P.; Wendling, D.; Demougeot, C.; Tordi, N. Local cryotherapy improves adjuvant-induced arthritis through down-regulation of IL-6 / IL-17 pathway but independently of TNFα. PLoS ONE 2017, 12, e0178668. [Google Scholar] [CrossRef]
- Vignoli, A.; Ghini, V.; Meoni, G.; Licari, C.; Takis, P.G.; Tenori, L.; Turano, P.; Luchinat, C. High-Throughput Metabolomics by 1D NMR. Angew. Chem. Int. Ed. 2019, 58, 968–999. [Google Scholar] [CrossRef]
- Markley, J.L.; Brüschweiler, R.; Edison, A.S.; Eghbalnia, H.R.; Powers, R.; Raftery, D.; Wishart, D.S. The future of NMR-based metabolomics. Curr. Opin. Biotechnol. 2017, 43, 34–40. [Google Scholar] [CrossRef] [PubMed]
- Gallo, V.; Intini, N.; Mastrorilli, P.; Latronico, M.; Scapicchio, P.; Triggiani, M.; Bevilacqua, V.; Fanizzi, P.; Acquotti, D.; Airoldi, C.; et al. Performance Assessment in Fingerprinting and Multi Component Quantitative NMR Analyses. Anal. Chem. 2015, 87, 6709–6717. [Google Scholar] [CrossRef] [PubMed]
- Dubey, D.; Chaurasia, S.; Guleria, A.; Kumar, S.; Modi, D.R.; Misra, R.; Kumar, D. Metabolite assignment of ultrafiltered synovial fluid extracted from knee joints of reactive arthritis patients using high resolution NMR spectroscopy. Magn. Reson. Chem. MRC 2019, 57, 30–43. [Google Scholar] [CrossRef] [PubMed]
- Anderson, J.R.; Chokesuwattanaskul, S.; Phelan, M.M.; Welting, T.J.M.; Lian, L.-Y.; Peffers, M.J.; Wright, H.L. 1H NMR Metabolomics Identifies Underlying Inflammatory Pathology in Osteoarthritis and Rheumatoid Arthritis Synovial Joints. J. Proteome Res. 2018, 17, 3780–3790. [Google Scholar] [CrossRef] [PubMed]
- Hügle, T.; Kovacs, H.; Heijnen, I.A.F.M.; Daikeler, T.; Baisch, U.; Hicks, J.M.; Valderrabano, V. Synovial fluid metabolomics in different forms of arthritis assessed by nuclear magnetic resonance spectroscopy. Clin. Exp. Rheumatol. 2012, 30, 240–245. [Google Scholar] [PubMed]
- Damyanovich, A.Z.; Staples, J.R.; Marshall, K.W. 1H NMR investigation of changes in the metabolic profile of synovial fluid in bilateral canine osteoarthritis with unilateral joint denervation. Osteoarthr. Cartil. 1999, 7, 165–172. [Google Scholar] [CrossRef] [PubMed][Green Version]
- Mickiewicz, B.; Heard, B.J.; Chau, J.K.; Chung, M.; Hart, D.A.; Shrive, N.G.; Frank, C.B.; Vogel, H.J. Metabolic profiling of synovial fluid in a unilateral ovine model of anterior cruciate ligament reconstruction of the knee suggests biomarkers for early osteoarthritis. J. Orthop. Res. 2015, 33, 71–77. [Google Scholar] [CrossRef]
- Das, U.N. Pyruvate is an endogenous anti-inflammatory and anti-oxidant molecule. Med. Sci. Monit. Int. Med. J. Exp. Clin. Res. 2006, 12, RA79–RA84. [Google Scholar] [PubMed]
- Kao, K.K.; Fink, M.P. The biochemical basis for the anti-inflammatory and cytoprotective actions of ethyl pyruvate and related compounds. Biochem. Pharmacol. 2010, 80, 151–159. [Google Scholar] [CrossRef]
- Wang, Q.; van Hoecke, M.; Tang, X.N.; Lee, H.; Zheng, Z.; Swanson, R.A.; Yenari, M.A. Pyruvate protects against experimental stroke via an anti-inflammatory mechanism. Neurobiol. Dis. 2009, 36, 223–231. [Google Scholar] [CrossRef]
- Herz, H.; Blake, D.R.; Grootveld, M. Multicomponent investigations of the hydrogen peroxide- and hydroxyl radical-scavenging antioxidant capacities of biofluids: The roles of endogenous pyruvate and lactate. Relevance to inflammatory joint diseases. Free Radic. Res. 1997, 26, 19–35. [Google Scholar] [CrossRef] [PubMed]
- Grosser, N.; Oberle, S.; Berndt, G.; Erdmann, K.; Hemmerle, A.; Schröder, H. Antioxidant action of l-alanine: Heme oxygenase-1 and ferritin as possible mediators. Biochem. Biophys. Res. Commun. 2004, 314, 351–355. [Google Scholar] [CrossRef] [PubMed]
- Baguet, A.; Koppo, K.; Pottier, A.; Derave, W. β-Alanine supplementation reduces acidosis but not oxygen uptake response during high-intensity cycling exercise. Eur. J. Appl. Physiol. 2009, 108, 495–503. [Google Scholar] [CrossRef] [PubMed]
- O’Donnell-Tormey, J.; Nathan, C.F.; Lanks, K.; DeBoer, C.J.; de la Harpe, J. Secretion of pyruvate. An antioxidant defense of mammalian cells. J. Exp. Med. 1987, 165, 500–514. [Google Scholar] [CrossRef] [PubMed]
- Wojtecka-Lukasik, E.; Księżopolska-Orłowska, K.; Gaszewska, E.; Krasowicz-Towalska, O.; Rzodkiewicz, P.; Maślińska, D.; Szukiewicz, D.; Maśliński, S. Cryotherapy decreases histamine levels in the blood of patients with rheumatoid arthritis. Inflamm. Res. 2009, 59, 253–255. [Google Scholar] [CrossRef] [PubMed]
- Felig, P.; Wahren, J. Amino acid metabolism in exercising man. J. Clin. Investig. 1971, 50, 2703–2714. [Google Scholar] [CrossRef]
- Ponist, S.; Drafi, F.; Kuncirova, V.; Mihalova, D.; Rackova, L.; Danisovic, L.; Ondrejickova, O.; Tumova, I.; Trunova, O.; Fedorova, T.; et al. Effect of Carnosine in Experimental Arthritis and on Primary Culture Chondrocytes. Oxid. Med. Cell. Longev. 2016, 2016, 8470589. [Google Scholar] [CrossRef]
- Chan, K.M.; Decker, E.A. Endogenous skeletal muscle antioxidants. Crit. Rev. Food Sci. Nutr. 1994, 34, 403–426. [Google Scholar] [CrossRef]
- Harris, R.C.; Tallon, M.J.; Dunnett, M.; Boobis, L.; Coakley, J.; Kim, H.J.; Fallowfield, J.L.; Hill, C.A.; Sale, C.; Wise, J.A. The absorption of orally supplied β-alanine and its effect on muscle carnosine synthesis in human vastus lateralis. Amino Acids 2006, 30, 279–289. [Google Scholar] [CrossRef]
- Boldyrev, A.A.; Koldobski, A.; Kurella, E.; Maltseva, V.; Stvolinski, S. Natural histidine-containing dipeptide carnosine as a potent hydrophilic antioxidant with membrane stabilizing function. A biomedical aspect. Mol. Chem. Neuropathol. 1993, 19, 185–192. [Google Scholar] [CrossRef]
- Smith, A.E.; Walter, A.A.; Graef, J.L.; Kendall, K.L.; Moon, J.R.; Lockwood, C.M.; Fukuda, D.H.; Beck, T.W.; Cramer, J.T.; Stout, J.R. Effects of beta-alanine supplementation and high-intensity interval training on endurance performance and body composition in men; a double-blind trial. J. Int. Soc. Sports Nutr. 2009, 6, 5. [Google Scholar] [CrossRef] [PubMed]
- Mills, E.; O’Neill, L.A.J. Succinate: A metabolic signal in inflammation. Trends Cell Biol. 2014, 24, 313–320. [Google Scholar] [CrossRef] [PubMed]
- Infantino, V.; Convertini, P.; Cucci, L.; Panaro, M.A.; Di Noia, M.A.; Calvello, R.; Palmieri, F.; Iacobazzi, V. The mitochondrial citrate carrier: A new player in inflammation. Biochem. J. 2011, 438, 433–436. [Google Scholar] [CrossRef] [PubMed]
- Okutani, D.; Lodyga, M.; Han, B.; Liu, M. Src protein tyrosine kinase family and acute inflammatory responses. Am. J. Physiol. Lung Cell. Mol. Physiol. 2006, 291, L129–L141. [Google Scholar] [CrossRef] [PubMed]
- Okamoto, H.; Kobayashi, A. Tyrosine kinases in rheumatoid arthritis. J. Inflamm. Lond. Engl. 2011, 8, 21. [Google Scholar] [CrossRef] [PubMed]
- Sano, H.; Engleka, K.; Mathern, P.; Hla, T.; Crofford, L.J.; Remmers, E.F.; Jelsema, C.L.; Goldmuntz, E.; Maciag, T.; Wilder, R.L. Coexpression of phosphotyrosine-containing proteins, platelet-derived growth factor-B, and fibroblast growth factor-1 in situ in synovial tissues of patients with rheumatoid arthritis and Lewis rats with adjuvant or streptococcal cell wall arthritis. J. Clin. Investig. 1993, 91, 553–565. [Google Scholar] [CrossRef] [PubMed]
- Swanson, C.D.; Akama-Garren, E.H.; Stein, E.A.; Petralia, J.D.; Ruiz, P.J.; Edalati, A.; Lindstrom, T.M.; Robinson, W.H. Inhibition of epidermal growth factor receptor tyrosine kinase ameliorates collagen-induced arthritis. J. Immunol. 2012, 188, 3513–3521. [Google Scholar] [CrossRef]
- Swanson, C.; Paniagua, R.T.; Lindstrom, T.M.; Robinson, W.H. Tyrosine kinases as targets for the treatment of rheumatoid arthritis. Nat. Rev. Rheumatol. 2009, 5, 317–324. [Google Scholar] [CrossRef]
- Jiravanichanun, N.; Mizuno, K.; Bächinger, H.P.; Okuyama, K. Threonine in Collagen Triple-helical Structure. Polym. J. 2006, 38, 400–403. [Google Scholar] [CrossRef][Green Version]
- Li, P.; Wu, G. Roles of dietary glycine, proline, and hydroxyproline in collagen synthesis and animal growth. Amino Acids 2017, 50, 1–10. [Google Scholar] [CrossRef]
- Calder, P.C. Polyunsaturated fatty acids and inflammation. Prostaglandins Leukot. Essent. Fatty Acids 2006, 75, 197–202. [Google Scholar] [CrossRef] [PubMed]
- Calder, P.C.; Grimble, R.F. Polyunsaturated fatty acids, inflammation and immunity. Eur. J. Clin. Nutr. 2002, 56 (Suppl. S3), S14–S19. [Google Scholar] [CrossRef] [PubMed]
- Calder, P.C.; Zurier, R.B. Polyunsaturated fatty acids and rheumatoid arthritis. Curr. Opin. Clin. Nutr. Metab. Care 2001, 4, 115–121. [Google Scholar] [CrossRef] [PubMed]
- Navarini, L.; Afeltra, A.; Gallo Afflitto, G.; Margiotta, D.P.E. Polyunsaturated fatty acids: Any role in rheumatoid arthritis? Lipids Health Dis. 2017, 16, 197. [Google Scholar] [CrossRef] [PubMed]
- James, M.J.; Gibson, R.A.; Cleland, L.G. Dietary polyunsaturated fatty acids and inflammatory mediator production. Am. J. Clin. Nutr. 2000, 71, 343S–348S. [Google Scholar] [CrossRef]
- Miles, E.A.; Calder, P.C. Influence of marine n-3 polyunsaturated fatty acids on immune function and a systematic review of their effects on clinical outcomes in rheumatoid arthritis. Br. J. Nutr. 2012, 107 (Suppl. S2), S171–S184. [Google Scholar] [CrossRef]
- Calder, P.C. Marine omega-3 fatty acids and inflammatory processes: Effects, mechanisms and clinical relevance. Biochim. Biophys. Acta BBA 2015, 1851, 469–484. [Google Scholar] [CrossRef]
- Sierra, S.; Lara-Villoslada, F.; Comalada, M.; Olivares, M.; Xaus, J. Dietary eicosapentaenoic acid and docosahexaenoic acid equally incorporate as decosahexaenoic acid but differ in inflammatory effects. Nutrition 2008, 24, 245–254. [Google Scholar] [CrossRef]
- Olson, M.V.; Liu, Y.-C.; Dangi, B.; Paul Zimmer, J.; Salem, N.; Nauroth, J.M. Docosahexaenoic acid reduces inflammation and joint destruction in mice with collagen-induced arthritis. Inflamm. Res. 2013, 62, 1003–1013. [Google Scholar] [CrossRef]
- Lee, Y.-H.; Bae, S.-C.; Song, G.-G. Omega-3 polyunsaturated fatty acids and the treatment of rheumatoid arthritis: A meta-analysis. Arch. Med. Res. 2012, 43, 356–362. [Google Scholar] [CrossRef]
- Goldberg, R.J.; Katz, J. A meta-analysis of the analgesic effects of omega-3 polyunsaturated fatty acid supplementation for inflammatory joint pain. Pain 2007, 129, 210–223. [Google Scholar] [CrossRef] [PubMed]
- Kim, J.-A.; Kong, C.-S.; Kim, S.-K. Effect of Sargassum thunbergii on ROS mediated oxidative damage and identification of polyunsaturated fatty acid components. Food Chem. Toxicol. Int. J. Publ. Br. Ind. Biol. Res. Assoc. 2010, 48, 1243–1249. [Google Scholar] [CrossRef] [PubMed]
- Veselinovic, M.; Barudzic, N.; Vuletic, M.; Zivkovic, V.; Tomic-Lucic, A.; Djuric, D.; Jakovljevic, V. Oxidative stress in rheumatoid arthritis patients: Relationship to diseases activity. Mol. Cell. Biochem. 2014, 391, 225–232. [Google Scholar] [CrossRef] [PubMed]
- Beckonert, O.; Keun, H.C.; Ebbels, T.M.D.; Bundy, J.; Holmes, E.; Lindon, J.C.; Nicholson, J.K. Metabolic profiling, metabolomic and metabonomic procedures for NMR spectroscopy of urine, plasma, serum and tissue extracts. Nat. Protoc. 2007, 2, 2692–2703. [Google Scholar] [CrossRef]
- Treuhaft, P.S.; MCCarty, D.J. Synovial fluid pH, lactate, oxygen and carbon dioxide partial pressure in various joint diseases. Arthritis Rheum. 1971, 14, 475–484. [Google Scholar] [CrossRef]
- Song, Z.; Xu, Y.; Chen, Z.; Yang, J.; Li, X.; Zhang, Z. Quantification of lactate in synovia by microchip with contactless conductivity detection. Anal. Biochem. 2012, 434, 73–77. [Google Scholar] [CrossRef]
- Dechant, J.E.; Symm, W.A.; Nieto, J.E. Comparison of pH, Lactate, and Glucose Analysis of Equine Synovial Fluid using a Portable Clinical Analyzer with a Bench-Top Blood Gas Analyzer. Vet. Surg. 2011, 40, 811–816. [Google Scholar] [CrossRef]
- Henke, J.; Willker, W.; Engelmann, J.; Leibfritz, D. Combined extraction techniques of tumour cells and lipid/phospholipid assignment by two-dimensional NMR spectroscopy. Anticancer Res. 1996, 16, 1417–1427. [Google Scholar]
- Wu, H.; Southam, A.D.; Hines, A.; Viant, M.R. High-throughput tissue extraction protocol for NMR- and MS-based metabolomics. Anal. Biochem. 2008, 372, 204–212. [Google Scholar] [CrossRef]
- Haug, K.; Cochrane, K.; Nainala, V.C.; Williams, M.; Chang, J.; Jayaseelan, K.V.; O’Donovan, C. MetaboLights: A resource evolving in response to the needs of its scientific community. Nucleic Acids Res. 2020, 48, 440–444. [Google Scholar] [CrossRef]
- Wishart, D.S.; Knox, C.; Guo, A.C.; Eisner, R.; Young, N.; Gautam, B.; Hau, D.D.; Psychogios, N.; Dong, E.; Bouatra, S.; et al. HMDB: A knowledgebase for the human metabolome. Nucleic Acids Res. 2009, 37, D603–D610. [Google Scholar] [CrossRef] [PubMed]
- Lundberg, P.; Vogel, T.; Malusek, A.; Lundquist, P.O.; Cohen, L.; Dahlqvist Leinhard, O. MDL–the magnetic resonance metabolomics database. In Proceedings of the ESMRMB 22nd Annual Meeting, Basel, Switzerland, 15–18 September 2005. [Google Scholar]
- Wevers, R.A.; Engelke, U.; Heerschap, A. High-resolution 1H-NMR spectroscopy of blood plasma for metabolic studies. Clin. Chem. 1994, 40, 1245–1250. [Google Scholar] [CrossRef] [PubMed]
- Fan, T.W.-M. Metabolite profiling by one- and two-dimensional NMR analysis of complex mixtures. Prog. Nucl. Magn. Reson. Spectrosc. 1996, 28, 161–219. [Google Scholar] [CrossRef]
- Salek, R.M.; Steinbeck, C.; Viant, M.R.; Goodacre, R.; Dunn, W.B. The role of reporting standards for metabolite annotation and identification in metabolomic studies. GigaScience 2013, 2, 13. [Google Scholar] [CrossRef] [PubMed]
- Chong, J.; Wishart, D.S.; Xia, J. Using MetaboAnalyst 4.0 for Comprehensive and Integrative Metabolomics Data Analysis. Curr. Protoc. Bioinforma. 2019, 68, e86. [Google Scholar] [CrossRef]
Publisher’s Note: MDPI stays neutral with regard to jurisdictional claims in published maps and institutional affiliations. |
© 2020 by the authors. Licensee MDPI, Basel, Switzerland. This article is an open access article distributed under the terms and conditions of the Creative Commons Attribution (CC BY) license (http://creativecommons.org/licenses/by/4.0/).


