Proton NMR Enables the Absolute Quantification of Aqueous Metabolites and Lipid Classes in Unique Mouse Liver Samples
Abstract
1. Introduction
2. Results
2.1. Comparison of Extraction Methods
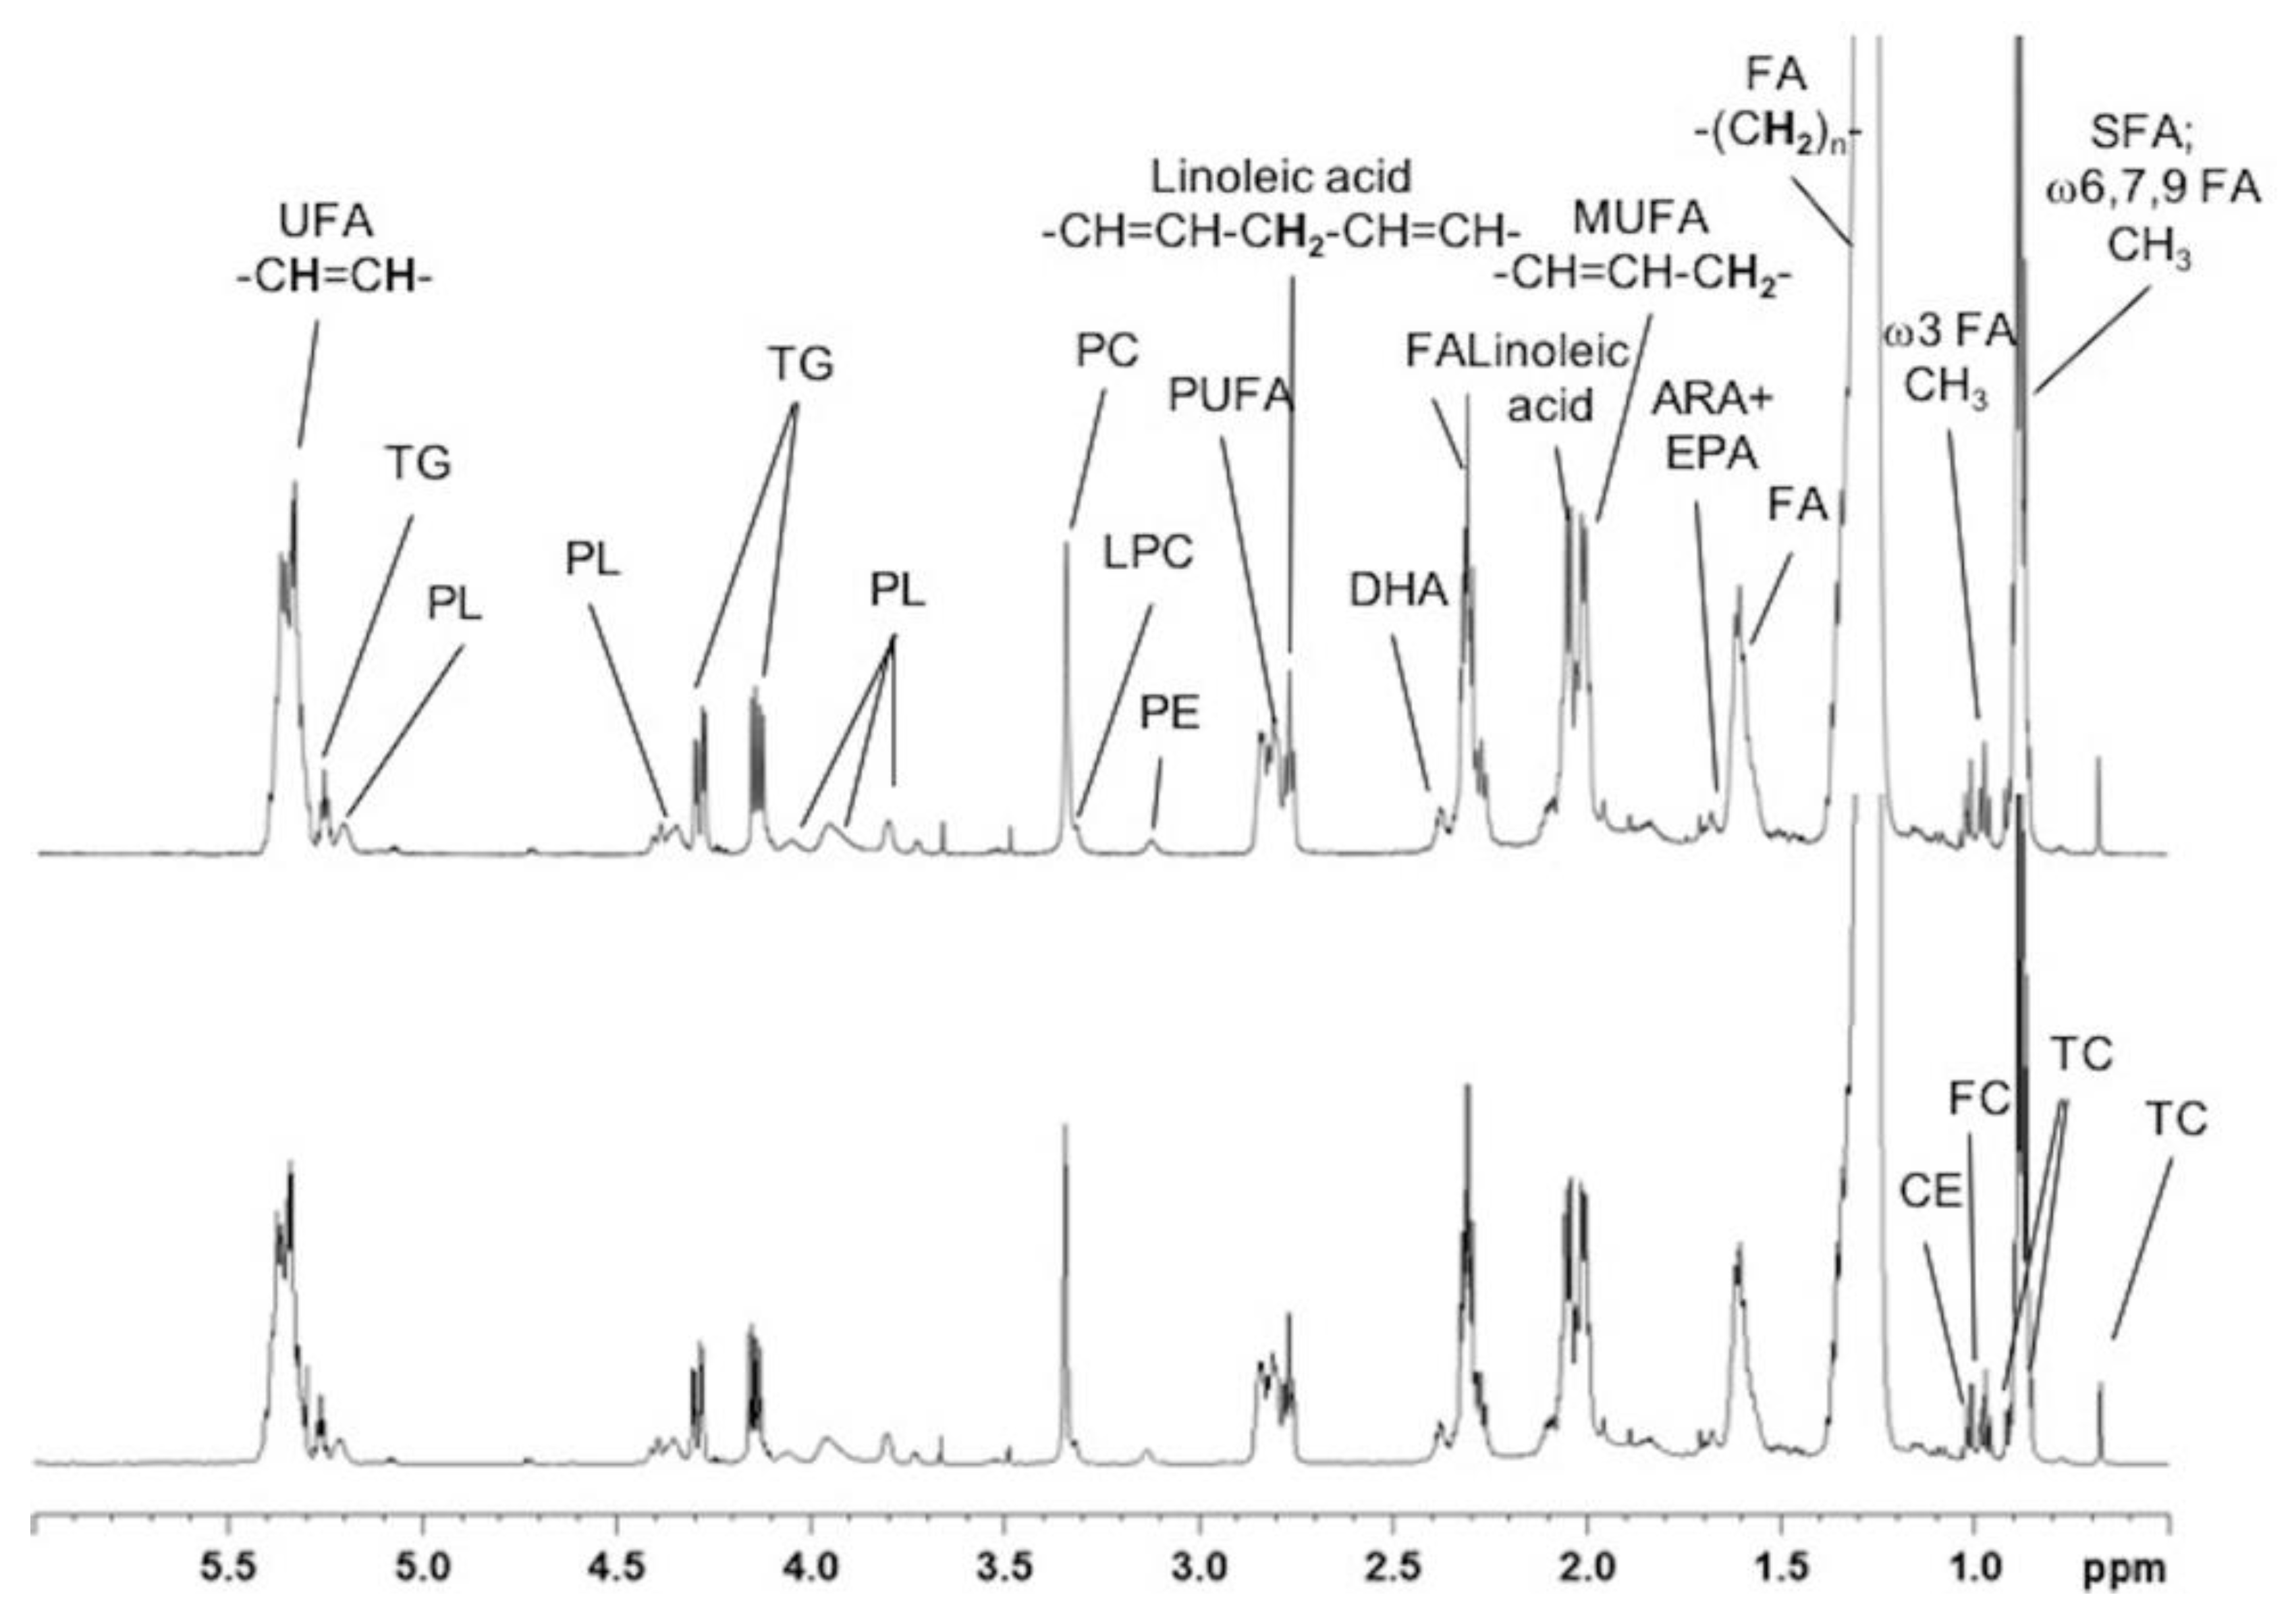
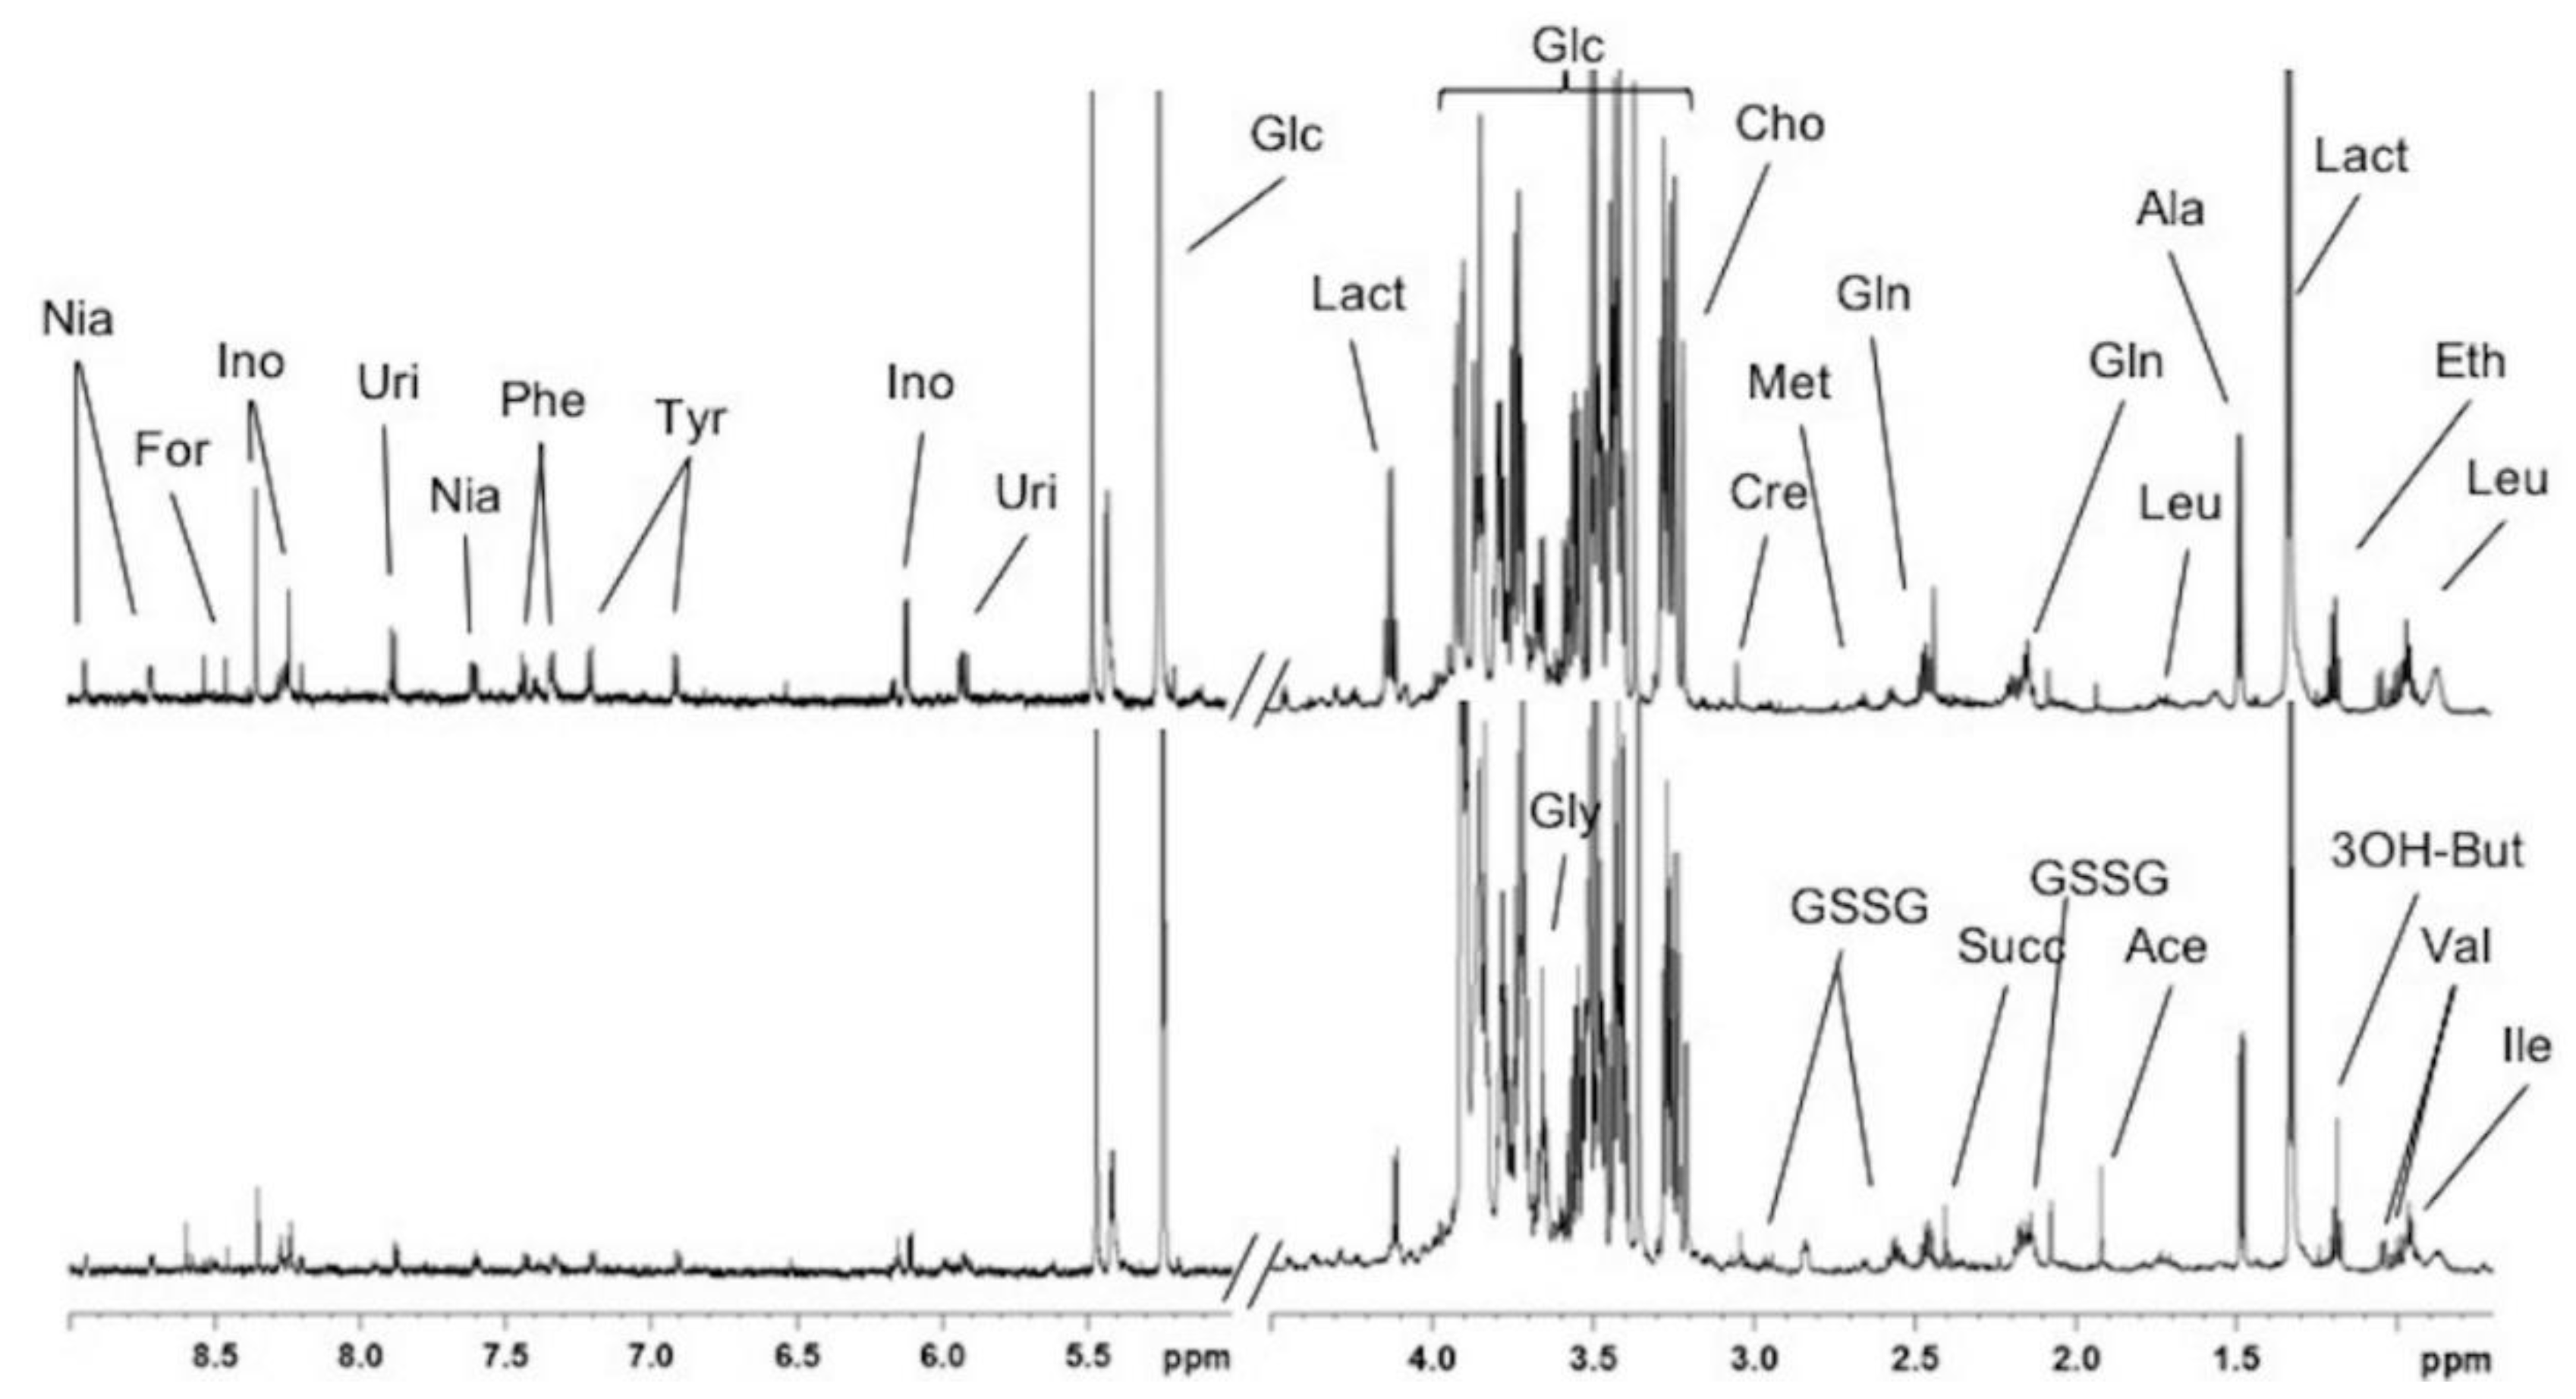
2.2. Absolute Quantification of Lipidic and Aqueous Metabolites
2.3. Analytical Validation with Liver Samples in a Dietary Intervention Study
2.3.1. Comparison with GC-FID Data
2.3.2. Comparison with LC-MS Data
2.3.3. Comparison with LipSpin Results
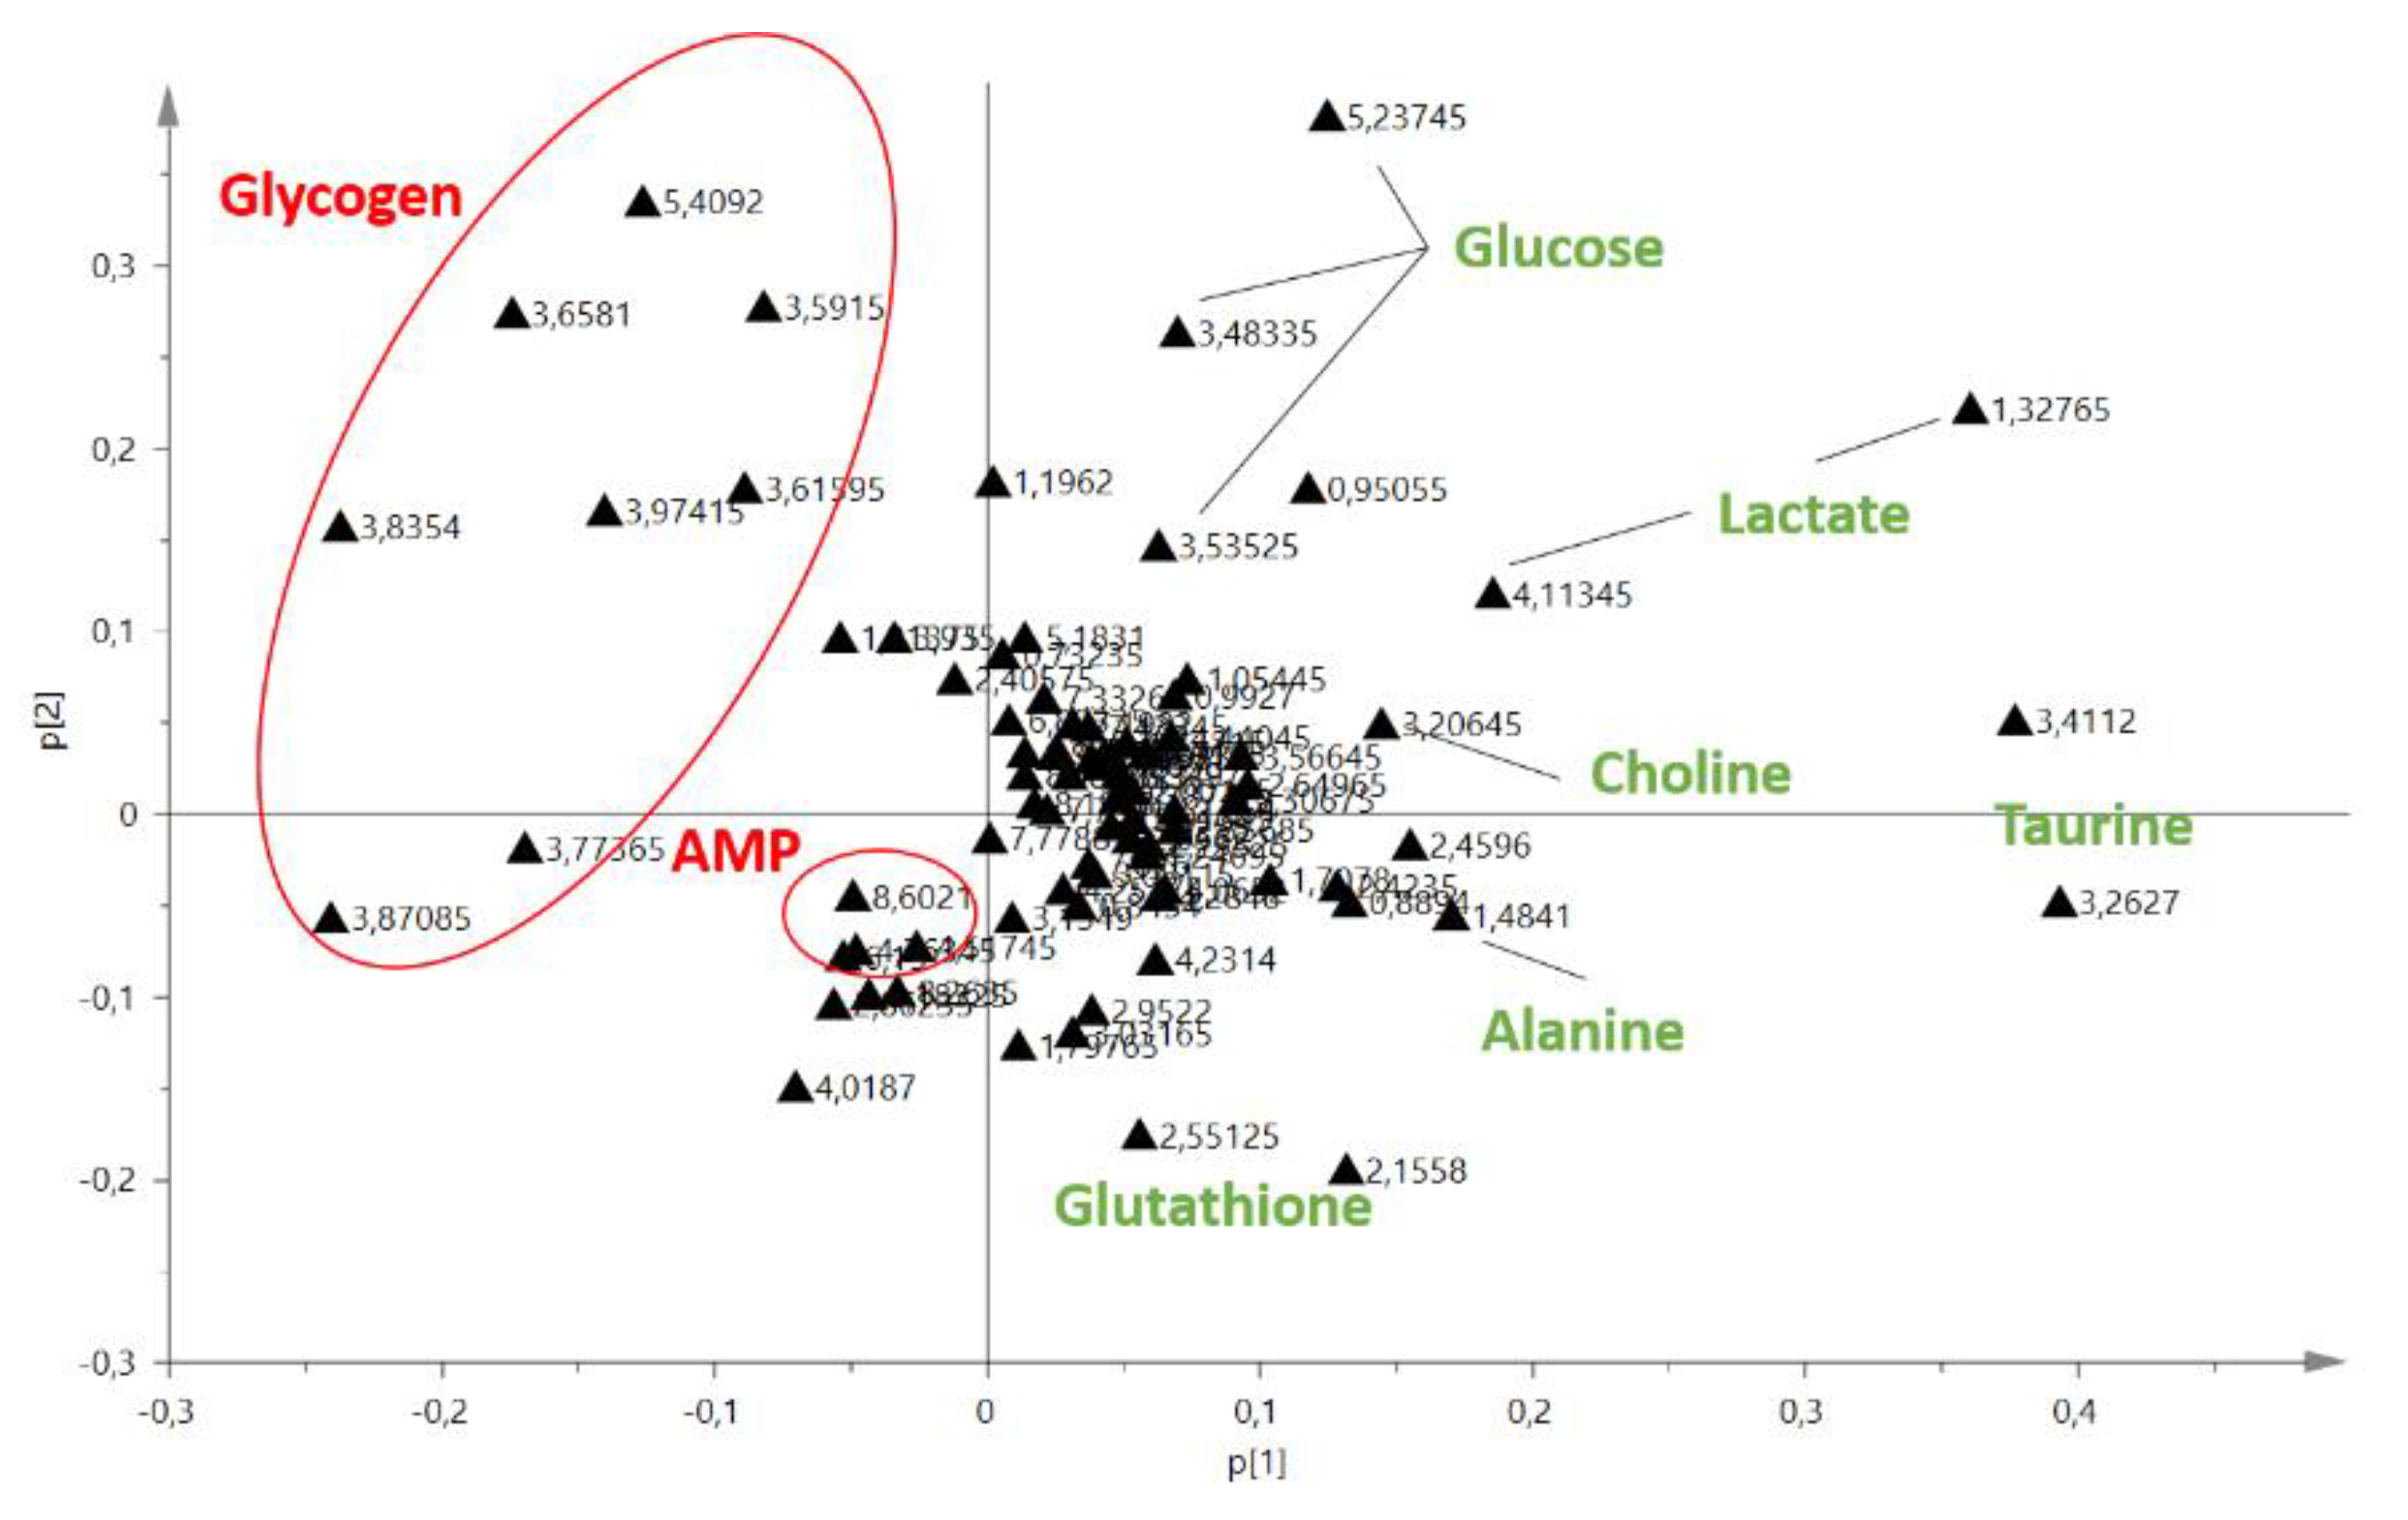
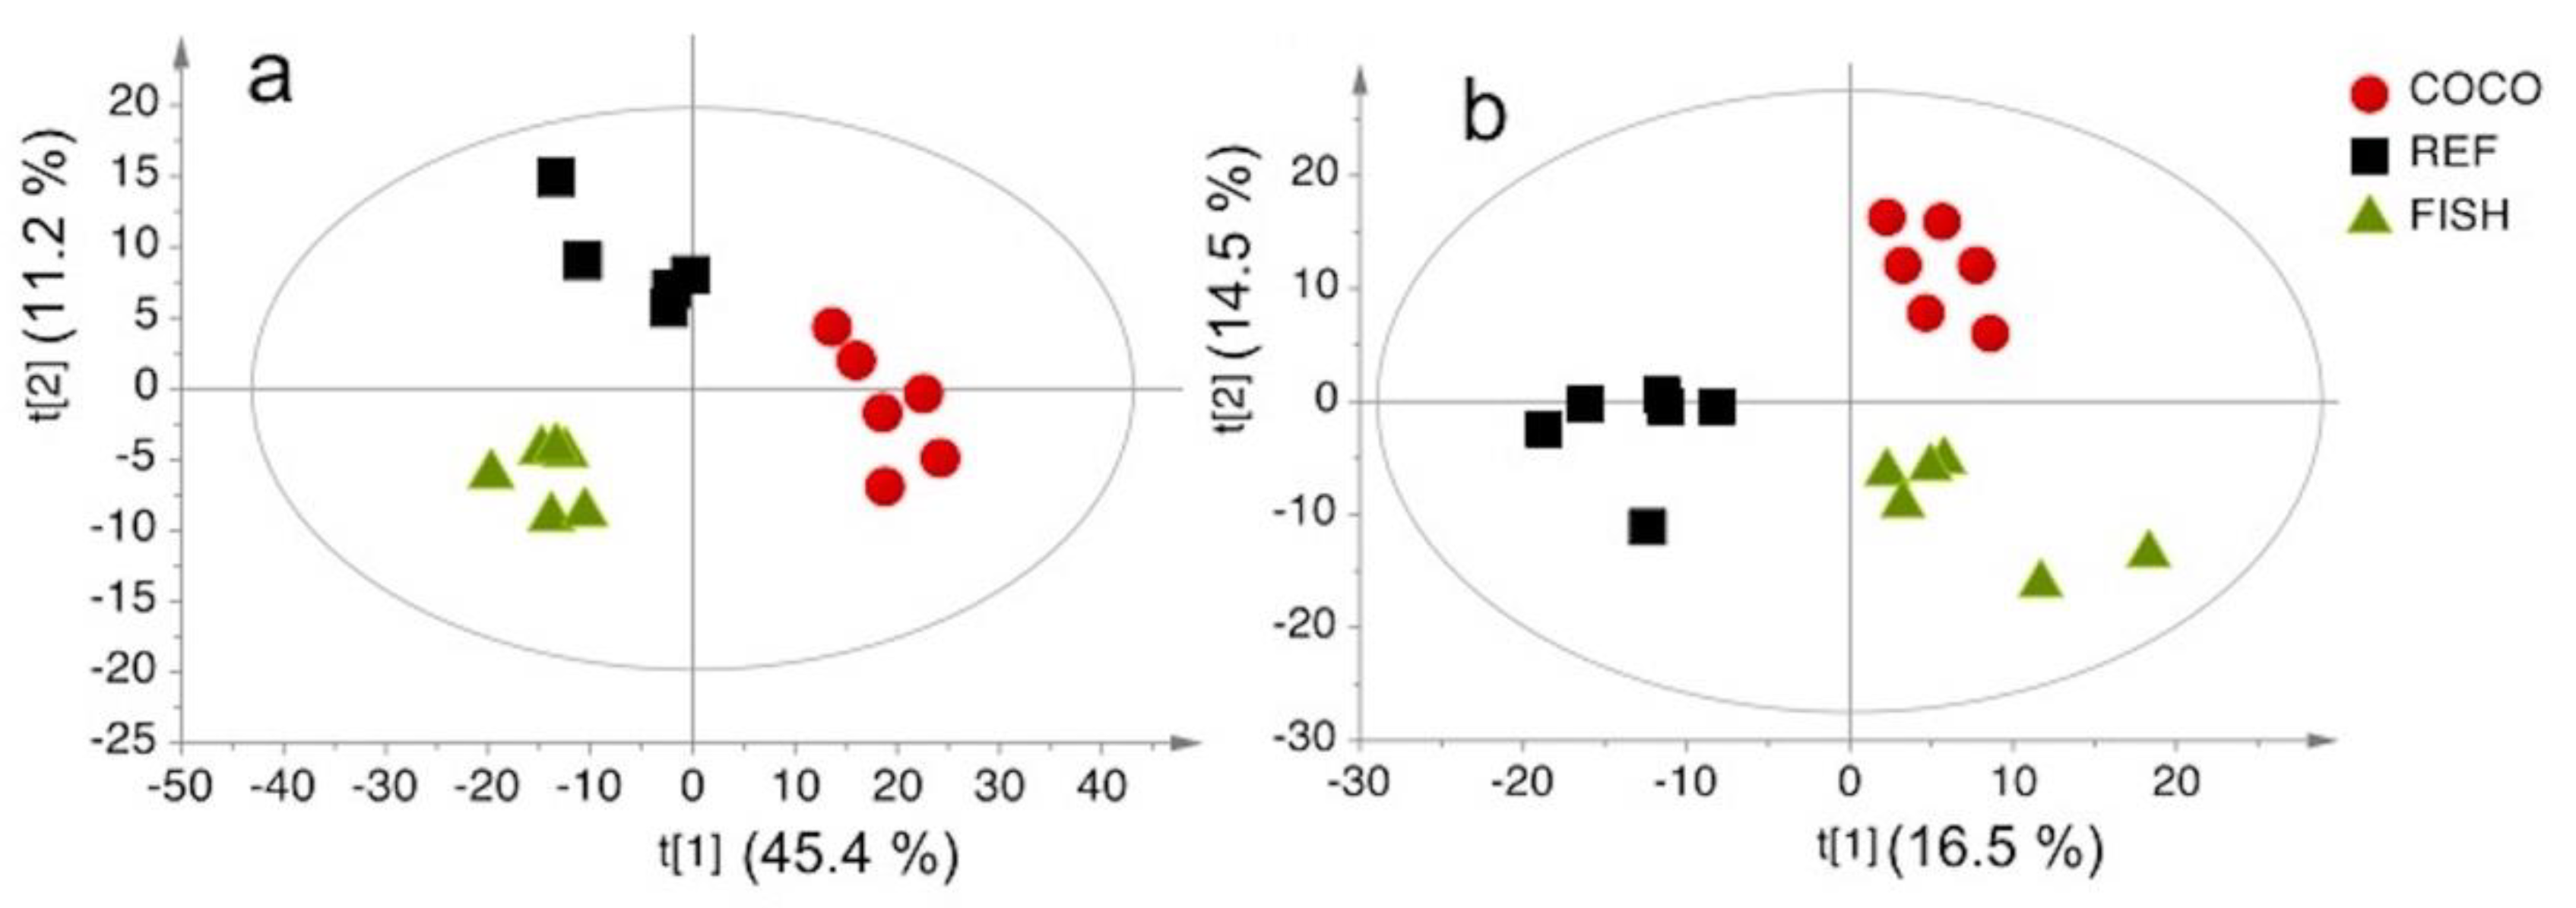
2.3.4. Biological Results
3. Discussion
3.1. Lipid Quantification: Comparison to Other Methods
3.2. Metabolic Differences between Livers of Mice Fed an Essential Fatty Acid-Deficient Diet or a Control Diet
3.3. Advantages and Limitations of 1H-NMR Spectroscopy for Metabolic Profiling in Liver
4. Materials and Methods
4.1. Animals
4.2. Extraction Procedure
4.3. GC Analysis of Neutral Lipids and Fatty Acids
4.4. HPLC-MS Analysis of Phospholipids
4.5. 1H-NMR Measurements
4.6. Data Processing and Multivariate Analysis
4.7. Statistical Analysis
5. Conclusions
Supplementary Materials
Author Contributions
Funding
Conflicts of Interest
References
- Friedman, S.L.; Neuschwander-Tetri, B.A.; Rinella, M.; Sanyal, A.J. Mechanisms of NAFLD development and therapeutic strategies. Nat. Med. 2018, 24, 908–922. [Google Scholar] [CrossRef] [PubMed]
- Younossi, Z.; Tacke, F.; Arrese, M.; Chander Sharma, B.; Mostafa, I.; Bugianesi, E.; Wai-Sun Wong, V.; Yilmaz, Y.; George, J.; Fan, J.; et al. Global Perspectives on Nonalcoholic Fatty Liver Disease and Nonalcoholic Steatohepatitis. Hepatology 2019, 69, 2672–2682. [Google Scholar] [CrossRef] [PubMed]
- Dumas, M.-E.; Kinross, J.; Nicholson, J.K. Metabolic phenotyping and systems biology approaches to understanding metabolic syndrome and fatty liver disease. Gastroenterology 2014, 146, 46–62. [Google Scholar] [CrossRef] [PubMed]
- Mardinoglu, A.; Bjornson, E.; Zhang, C.; Klevstig, M.; Söderlund, S.; Ståhlman, M.; Adiels, M.; Hakkarainen, A.; Lundbom, N.; Kilicarslan, M.; et al. Personal model-assisted identification of NAD+ and glutathione metabolism as intervention target in NAFLD. Mol. Syst. Biol. 2017, 13, 916. [Google Scholar] [CrossRef] [PubMed]
- Emwas, A.-H.; Roy, R.; McKay, R.T.; Tenori, L.; Saccenti, E.; Gowda, G.A.N.; Raftery, D.; Alahmari, F.; Jaremko, L.; Jaremko, M.; et al. NMR Spectroscopy for Metabolomics Research. Metabolites 2019, 9, 123. [Google Scholar] [CrossRef] [PubMed]
- Le Moyec, L.; Triba, M.N.; Nahon, P.; Bouchemal, N.; Hantz, E.; Goossens, C.; Amathieu, R.; Savarin, P. Nuclear magnetic resonance metabolomics and human liver diseases: The principles and evidence associated with protein and carbohydrate metabolism. Biomed. Rep. 2017, 6, 387–395. [Google Scholar] [CrossRef] [PubMed]
- Amathieu, R.; Triba, M.N.; Goossens, C.; Bouchemal, N.; Nahon, P.; Savarin, P.; Le Moyec, L. Nuclear magnetic resonance based metabolomics and liver diseases: Recent advances and future clinical applications. World J. Gastroenterol. 2016, 22, 417–426. [Google Scholar] [CrossRef]
- Jiang, L.; Si, Z.H.; Li, M.H.; Zhao, H.; Fu, Y.H.; Xing, Y.X.; Hong, W.; Ruan, L.Y.; Li, P.M.; Wang, J.S. 1H NMR-based metabolomics study of liver damage induced by ginkgolic acid (15:1) in mice. J. Pharm. Biomed. Anal. 2017, 136, 44–54. [Google Scholar] [CrossRef]
- Dagla, I.; Benaki, D.; Baira, E.; Lemonakis, N.; Poudyal, H.; Brown, L.; Tsarbopoulos, A.; Skaltsounis, A.L.; Mikros, E.; Gikas, E. Alteration in the liver metabolome of rats with metabolic syndrome after treatment with Hydroxytyrosol. A Mass Spectrometry and Nuclear Magnetic Resonance-based metabolomics study. Talanta 2018, 178, 246–257. [Google Scholar] [CrossRef]
- Bonvallot, N.; Canlet, C.; Blas-Y-Estrada, F.; Gautier, R.; Tremblay-Franco, M.; Chevolleau, S.; Cordier, S.; Cravedi, J.P. Metabolome disruption of pregnant rats and their offspring resulting from repeated exposure to a pesticide mixture representative of environmental contamination in Brittany. PLoS ONE 2018, 13, e0198448. [Google Scholar] [CrossRef]
- Chen, M.; Zheng, H.; Xu, M.; Zhao, L.; Zhang, Q.; Song, J.; Zhao, Z.; Lu, S.; Weng, Q.; Wu, X.; et al. Changes in hepatic metabolic profile during the evolution of STZ-induced diabetic rats via an 1H NMR-based metabonomic investigation. Biosci. Rep. 2019, 39. [Google Scholar] [CrossRef] [PubMed]
- Ghosh, S.; Sengupta, A.; Sharma, S.; Sonawat, H.M. Metabolic fingerprints of serum, brain, and liver are distinct for mice with cerebral and noncerebral malaria: A 1H NMR spectroscopy-based metabonomic study. J. Proteome Res. 2012, 11, 4992–5004. [Google Scholar] [CrossRef] [PubMed]
- Ruiz-Rodado, V.; Nicoli, E.R.; Probert, F.; Smith, D.A.; Morris, L.; Wassif, C.A.; Platt, F.M.; Grootveld, M. 1H NMR-Linked Metabolomics Analysis of Liver from a Mouse Model of NP-C1 Disease. J. Proteome Res. 2016, 15, 3511–3527. [Google Scholar] [CrossRef] [PubMed]
- Zheng, H.; Cai, A.; Shu, Q.; Niu, Y.; Xu, P.; Li, C.; Lin, L.; Gao, H. Tissue-Specific Metabolomics Analysis Identifies the Liver as a Major Organ of Metabolic Disorders in Amyloid Precursor Protein/Presenilin 1 Mice of Alzheimer’s Disease. J. Proteome Res. 2019, 18, 1218–1227. [Google Scholar] [CrossRef] [PubMed]
- Fernando, H.; Bhopale, K.K.; Kondraganti, S.; Kaphalia, B.S.; Ansari, G.A.S. Lipidomic Changes in Rat Liver after Long-Term Exposure to Ethanol. Toxicol. Appl. Pharmacol. 2011, 255, 127–137. [Google Scholar] [CrossRef]
- Fernando, H.; Bhopale, K.K.; Kondraganti, S.S.; Kaphalia, B.S.; Ansari, G.A.S. Alcohol-Induced Hepatic Steatosis: A Comparative Study to Identify Possible Indicator(s) of Alcoholic Fatty Liver Disease. J. Drug Alcohol Res. 2018, 7. [Google Scholar] [CrossRef]
- Fernando, H.; Kondraganti, S.; Bhopale, K.K.; Volk, D.E.; Neerathilingam, M.; Kaphalia, B.S.; Luxon, B.A.; Boor, P.J.; Ansari, G.A.S. 1H and 31P NMR Lipidome of Ethanol-Induced Fatty Liver. Alcohol. Clin. Exp. Res. 2010, 34, 1937–1947. [Google Scholar] [CrossRef]
- Cabaton, N.J.; Poupin, N.; Canlet, C.; Tremblay-Franco, M.; Audebert, M.; Cravedi, J.P.; Riu, A.; Jourdan, F.; Zalko, D. An Untargeted Metabolomics Approach to Investigate the Metabolic Modulations of HepG2 Cells Exposed to Low Doses of Bisphenol A and 17β-Estradiol. Front. Endocrinol. 2018, 9, 571. [Google Scholar] [CrossRef]
- Wei, F.; Lamichhane, S.; Orešič, M.; Hyötyläinen, T. Lipidomes in health and disease: Analytical strategies and considerations. TrAC Trends Anal. Chem. 2019, 120, 115664. [Google Scholar] [CrossRef]
- Khoury, S.; Canlet, C.; Lacroix, M.Z.; Berdeaux, O.; Jouhet, J.; Bertrand-Michel, J. Quantification of Lipids: Model, Reality, and Compromise. Biomolecules 2018, 8, 174. [Google Scholar] [CrossRef]
- Martínez-Granados, B.; Morales, J.M.; Rodrigo, J.M.; Del Olmo, J.; Serra, M.A.; Ferrández, A.; Celda, B.; Monleón, D. Metabolic profile of chronic liver disease by NMR spectroscopy of human biopsies. Int. J. Mol. Med. 2011, 27, 111–117. [Google Scholar] [CrossRef] [PubMed]
- Cobbold, J.F.L.; Anstee, Q.M.; Goldin, R.D.; Williams, H.R.T.; Matthews, H.C.; North, B.V.; Absalom, N.; Thomas, H.C.; Thursz, M.R.; Cox, R.D.; et al. Phenotyping murine models of non-alcoholic fatty liver disease through metabolic profiling of intact liver tissue. Clin. Sci. Lond. Engl. 2009, 116, 403–413. [Google Scholar] [CrossRef] [PubMed]
- Teilhet, C.; Morvan, D.; Joubert-Zakeyh, J.; Biesse, A.S.; Pereira, B.; Massoulier, S.; Dechelotte, P.; Pezet, D.; Buc, E.; Lamblin, G.; et al. Specificities of Human Hepatocellular Carcinoma Developed on Non-Alcoholic Fatty Liver Disease in Absence of Cirrhosis Revealed by Tissue Extracts 1H-NMR Spectroscopy. Metabolites 2017, 7, 49. [Google Scholar] [CrossRef] [PubMed]
- Vinaixa, M.; Rodríguez, M.A.; Rull, A.; Beltrán, R.; Bladé, C.; Brezmes, J.; Cañellas, N.; Joven, J.; Correig, X. Metabolomic assessment of the effect of dietary cholesterol in the progressive development of fatty liver disease. J. Proteome Res. 2010, 9, 2527–2538. [Google Scholar] [CrossRef] [PubMed]
- Lin, C.Y.; Wu, H.; Tjeerdema, R.S.; Viant, M.R. Evaluation of metabolite extraction strategies from tissue samples using NMR metabolomics. Metabolomics 2007, 3, 55–67. [Google Scholar] [CrossRef]
- Bligh, E.G.; Dyer, W.J. A rapid method of total lipid extraction and purification. Can. J. Biochem. Physiol. 1959, 37, 911–917. [Google Scholar] [CrossRef]
- Folch, J.; Lees, M.; Sloane Stanley, G.H. A simple method for the isolation and purification of total lipides from animal tissues. J. Biol. Chem. 1957, 226, 497–509. [Google Scholar]
- Beckonert, O.; Keun, H.C.; Ebbels, T.M.D.; Bundy, J.; Holmes, E.; Lindon, J.C.; Nicholson, J.K. Metabolic profiling, metabolomic and metabonomic procedures for NMR spectroscopy of urine, plasma, serum and tissue extracts. Nat. Protoc. 2007, 2, 2692–2703. [Google Scholar] [CrossRef]
- Ulrich, E.L.; Akutsu, H.; Doreleijers, J.F.; Harano, Y.; Ioannidis, Y.E.; Lin, J.; Livny, M.; Mading, S.; Maziuk, D.; Miller, Z.; et al. BioMagResBank. Nucleic Acids Res. 2008, 36, D402–D408. [Google Scholar] [CrossRef]
- Wishart, D.S.; Tzur, D.; Knox, C.; Eisner, R.; Guo, A.C.; Young, N.; Cheng, D.; Jewell, K.; Arndt, D.; Sawhney, S.; et al. HMDB: The Human Metabolome Database. Nucleic Acids Res. 2007, 35, D521–D526. [Google Scholar] [CrossRef]
- Reis, A.; Rudnitskaya, A.; Blackburn, G.J.; Mohd Fauzi, N.; Pitt, A.R.; Spickett, C.M. A comparison of five lipid extraction solvent systems for lipidomic studies of human LDL. J. Lipid Res. 2013, 54, 1812–1824. [Google Scholar] [CrossRef] [PubMed]
- Wu, H.; Southam, A.D.; Hines, A.; Viant, M.R. High-throughput tissue extraction protocol for NMR-and MS-based metabolomics. Anal. Biochem. 2008, 372, 204–212. [Google Scholar] [CrossRef] [PubMed]
- Viant, M.R.; Ebbels, T.M.D.; Beger, R.D.; Ekman, D.R.; Epps, D.J.T.; Kamp, H.; Leonards, P.E.G.; Loizou, G.D.; MacRae, J.I.; van Ravenzwaay, B.; et al. Use cases, best practice and reporting standards for metabolomics in regulatory toxicology. Nat. Commun. 2019, 10, 1–10. [Google Scholar] [CrossRef] [PubMed]
- Bharti, S.K.; Roy, R. Quantitative 1H NMR spectroscopy. TrAC Trends Anal. Chem. 2012, 35, 5–26. [Google Scholar] [CrossRef]
- Vidal, N.P.; Manzanos, M.J.; Goicoechea, E.; Guillén, M.D. Quality of farmed and wild sea bass lipids studied by (1) H NMR: Usefulness of this technique for differentiation on a qualitative and a quantitative basis. Food Chem. 2012, 135, 1583–1591. [Google Scholar] [CrossRef] [PubMed]
- Barrilero, R.; Gil, M.; Amigó, N.; Dias, C.B.; Wood, L.G.; Garg, M.L.; Ribalta, J.; Heras, M.; Vinaixa, M.; Correig, X. LipSpin: A New Bioinformatics Tool for Quantitative 1H NMR Lipid Profiling. Anal. Chem. 2018, 90, 2031–2040. [Google Scholar] [CrossRef]
- Ducheix, S.; Montagner, A.; Polizzi, A.; Lasserre, F.; Marmugi, A.; Bertrand-Michel, J.; Podechard, N.; Al Saati, T.; Chétiveaux, M.; Baron, S.; et al. Essential fatty acids deficiency promotes lipogenic gene expression and hepatic steatosis through the liver X receptor. J. Hepatol. 2013, 58, 984–992. [Google Scholar] [CrossRef]
- Jiang, C.; Yang, K.; Yang, L.; Miao, Z.; Wang, Y.; Zhu, H. A 1H NMR-Based Metabonomic Investigation of Time-Related Metabolic Trajectories of the Plasma, Urine and Liver Extracts of Hyperlipidemic Hamsters. PLoS ONE 2013, 8, e66786. [Google Scholar] [CrossRef]
- Li, J.; Vosegaard, T.; Guo, Z. Applications of nuclear magnetic resonance in lipid analyses: An emerging powerful tool for lipidomics studies. Prog. Lipid Res. 2017, 68, 37–56. [Google Scholar] [CrossRef]
- Botolin, D.; Wang, Y.; Christian, B.; Jump, D.B. Docosahexaneoic acid (22:6, n-3) regulates rat hepatocyte SREBP-1 nuclear abundance by Erk-and 26S proteasome-dependent pathways. J. Lipid Res. 2006, 47, 181–192. [Google Scholar] [CrossRef]
- Jump, D.B. Fatty acid regulation of hepatic lipid metabolism. Curr. Opin. Clin. Nutr. Metab. Care 2011, 14, 115–120. [Google Scholar] [CrossRef] [PubMed]
- Dentin, R.; Benhamed, F.; Pégorier, J.P.; Foufelle, F.; Viollet, B.; Vaulont, S.; Girard, J.; Postic, C. Polyunsaturated fatty acids suppress glycolytic and lipogenic genes through the inhibition of ChREBP nuclear protein translocation. J. Clin. Investig. 2005, 115, 2843–2854. [Google Scholar] [CrossRef] [PubMed]
- Klein, M.S.; Dorn, C.; Saugspier, M.; Hellerbrand, C.; Oefner, P.J.; Gronwald, W. Discrimination of steatosis and NASH in mice using nuclear magnetic resonance spectroscopy. Metabolomics 2011, 7, 237–246. [Google Scholar] [CrossRef]
- Yang, Y.; Li, C.; Nie, X.; Feng, X.; Chen, W.; Yue, Y.; Tang, H.; Deng, F. Metabonomic studies of human hepatocellular carcinoma using high-resolution magic-angle spinning 1H NMR spectroscopy in conjunction with multivariate data analysis. J. Proteome Res. 2007, 6, 2605–2614. [Google Scholar] [CrossRef]
- Schofield, Z.; Reed, M.A.; Newsome, P.N.; Adams, D.H.; Günther, U.L.; Lalor, P.F. Changes in human hepatic metabolism in steatosis and cirrhosis. World J. Gastroenterol. 2017, 23, 2685–2695. [Google Scholar] [CrossRef]
- Chen, I.S.; Shen, C.S.J.; Sheppard, A.J. Comparison of methylene chloride and chloroform for the extraction of fats from food products. J. Am. Oil Chem. Soc. 1981, 58, 599–601. [Google Scholar] [CrossRef]
- Barrans, A.; Collet, X.; Barbaras, R.; Jaspard, B.; Manent, J.; Vieu, C.; Chap, H.; Perret, B. Hepatic lipase induces the formation of pre-beta 1 high density lipoprotein (HDL) from triacylglycerol-rich HDL2. A study comparing liver perfusion to in vitro incubation with lipases. J. Biol. Chem. 1994, 269, 11572–11577. [Google Scholar]
- Lillington, J.M.; Trafford, D.J.; Makin, H.L. A rapid and simple method for the esterification of fatty acids and steroid carboxylic acids prior to gas-liquid chromatography. Clin. Chim. Acta Int. J. Clin. Chem. 1981, 111, 91–98. [Google Scholar] [CrossRef]
- Wold, S.; Antti, H.; Lindgren, F.; Öhman, J. Orthogonal signal correction of near-infrared spectra. Chemom. Intell. Lab. Syst. 1998, 44, 175–185. [Google Scholar] [CrossRef]
- McCombie, G.; Browning, L.M.; Titman, C.M.; Song, M.; Shockcor, J.; Jebb, S.A.; Griffin, J.L. omega-3 oil intake during weight loss in obese women results in remodelling of plasma triglyceride and fatty acids. Metab. Off. J. Metab. Soc. 2009, 5, 363–374. [Google Scholar] [CrossRef]
- Lapins, M.; Eklund, M.; Spjuth, O.; Prusis, P.; Wikberg, J.E. Proteochemometric modeling of HIV protease susceptibility. BMC Bioinform. 2008, 9, 181. [Google Scholar] [CrossRef] [PubMed]


| Lipid Species | External Standard (TSP) | Internal Standard (TMS) | ||||
|---|---|---|---|---|---|---|
| Pearson’s r | p-value a | Slope | Pearson’s r | p-value a | Slope | |
| Total FA | 0.98 | 0.002 | 1.3 | 0.82 | 0.089 | 0.8 |
| Saturated FA | 0.98 | 0.002 | 1.2 | 0.97 | 0.006 | 1.0 |
| ω-3 FA | 0.98 | 0.002 | 1.0 | 0.94 | 0.019 | 1.8 |
| MUFA | 0.98 | 0.001 | 1.2 | 0.93 | 0.019 | 2.0 |
| PUFA | 0.92 | 0.03 | 0.8 | 0.95 | 0.015 | 1.7 |
| UFA | 0.94 | 0.017 | 0.8 | 0.95 | 0.014 | 1.7 |
| DHA | 0.99 | 0.0001 | 1.1 | 0.93 | 0.024 | 1.9 |
| Linoleic acid | 0.98 | 0.002 | 0.9 | 0.93 | 0.025 | 1.7 |
| TC | 0.99 | 0.0003 | 1.2 | 0.89 | 0.04 | 2.5 |
| FC | 0.95 | 0.011 | 1.0 | 0.89 | 0.04 | 1.7 |
| CE | 0.99 | 0.00007 | 0.8 | 0.98 | 0.004 | 1.4 |
| Triglycerides | 0.99 | 0.001 | 1.2 | 0.98 | 0.004 | 1.0 |
| PC | 0.95 | 0.012 | 1.2 | 0.96 | 0.009 | 1.2 |
| PE | 0.55 | 0.33 | 0.1 | 0.99 | 0.0001 | 0.2 |
| SM | 0.94 | 0.018 | 0.8 | 0.98 | 0.002 | 0.9 |
| Total PL | 0.91 | 0.03 | 0.9 | 0.95 | 0.015 | 1.0 |
| Lipid Species | External Standard (TSP) | Internal Standard (TMS) | ||||
|---|---|---|---|---|---|---|
| Pearson’s r | p-value a | Slope | Pearson’s r | p-value a | Slope | |
| Total FA | 0.99 | 5 × 10⁻⁵ | 1.0 | 0.98 | 2 × 10⁻³ | 1.2 |
| Saturated FA | 0.99 | 2 × 10⁻⁵ | 1.0 | 0.98 | 2 × 10⁻³ | 1.2 |
| ω-3 FA | 0.99 | 5 × 10⁻⁵ | 1.0 | 0.98 | 2 × 10⁻³ | 1.0 |
| MUFA | 0.99 | 3 × 10⁻⁵ | 1.1 | 0.99 | 4 × 10⁻⁴ | 1.0 |
| PUFA | 0.99 | 5 × 10⁻⁴ | 1.0 | 0.97 | 6 × 10⁻³ | 1.5 |
| UFA | 0.99 | 3 × 10⁻⁴ | 1.0 | 0.97 | 5 × 10⁻³ | 1.4 |
| DHA | 0.99 | 1 × 10⁻⁵ | 1.1 | 0.99 | 4 × 10⁻⁵ | 0.7 |
| Linoleic acid | 0.99 | 8 × 10⁻⁶ | 0.9 | 0.99 | 2 × 10⁻⁴ | 1.0 |
| TC | 0.98 | 2 × 10⁻³ | 1.1 | 0.96 | 9 × 10⁻³ | 1.6 |
| FC | 0.99 | 6 × 10⁻⁴ | 1.0 | 0.93 | 2 × 10⁻² | 1.5 |
| CE | 0.99 | 8 × 10⁻⁴ | 0.9 | 0.98 | 2 × 10⁻³ | 0.9 |
| Triglycerides | 0.99 | 3 × 10⁻⁶ | 1.0 | 0.99 | 7 × 10⁻⁴ | 1.0 |
| PC | 0.99 | 5 × 10⁻⁵ | 1.2 | 0.99 | 2 × 10⁻⁴ | 1.1 |
| PE | 0.98 | 3 × 10⁻³ | 0.6 | 0.91 | 3 × 10⁻² | 0.5 |
| SM | 0.99 | 8 × 10⁻⁴ | 0.9 | 0.96 | 8 × 10⁻³ | 0.8 |
| Total PL | 0.99 | 3 × 10⁻⁵ | 1.0 | 0.99 | 2 × 10⁻⁵ | 1.2 |
| Lipid Species | Pearson’s r | p-value a |
|---|---|---|
| Total FA | 0.93 | 8.8 × 10⁻⁸ |
| Saturated FA | 0.85 | 1.43 × 10⁻⁵ |
| ω-3 FA | 0.80 | 1.1 × 10⁻⁴ |
| MUFA | 0.96 | 4.5 × 10⁻¹⁰ |
| PUFA | 0.80 | 9.6 × 10⁻⁵ |
| ARA+EPA | 0.69 | 2 × 10⁻³ |
| DHA | 0.95 | 3.4 × 10⁻⁹ |
| Linoleic acid | 0.96 | 6.7 × 10⁻¹⁰ |
| MUFA/PUFA | 0.89 | 1.3 × 10⁻⁶ |
| Total cholesterol | 0.99 | 1.2 × 10⁻¹⁴ |
| Free cholesterol | 0.91 | 1.3 × 10⁻⁶ |
| Cholesterol ester | 0.98 | 6.6 × 10⁻¹² |
| Triglycerides | 0.98 | 7.7 × 10⁻¹² |
| Concentration Ratio | PE | PC + LPC | SM | Total PL, Except LPC | ||||
|---|---|---|---|---|---|---|---|---|
| LC-MS | NMR | LC-MS | NMR | LC-MS | NMR | LC-MS | NMR | |
| COCO/REF | 0.94 | 0.95 | 1.07 | 1.01 | 0.90 | 0.81 | 1.05 | 1.03 |
| FISH/REF | 1.24 | 1.17 | 1.13 | 1.06 | 1.00 | 1.10 | 1.12 | 1.08 |
| Lipid Species | Pearson’s r | p-value a |
|---|---|---|
| Saturated FA | 0.66 | 5.7 × 10⁻³ |
| ω-3 FA | 0.98 | 7.4 × 10⁻¹² |
| MUFA | 0.97 | 3.0 × 10⁻¹⁰ |
| ARA+EPA | 0.001 | 0.99 |
| DHA | 0.31 | 0.24 |
| Linoleic acid | 0.95 | 2.8 × 10⁻⁸ |
| Free cholesterol | 0.54 | 0.031 |
| Esterified cholesterol | 0.80 | 1.8 × 10⁻⁴ |
| Triglycerides | 0.97 | 9.2 × 10⁻¹⁰ |
| Total phospholipids | 0.27 | 0.32 |
| PE | 0.58 | 0.017 |
| SM | 0.14 | 0.59 |
| PC+LPC | 0.37 | 0.15 |
| Metabolites a | FC b COCO | FC b FISH |
|---|---|---|
| FA (CH2)n | 0.71 * | 0.82 |
| EPA+ARA | 0.67 * | 0.80 |
| FA CH3 | 0.73 * | 0.80 |
| Linoleic acid | 0.28 * | 0,92 |
| MUFA | 1.99 * | 0.84 |
| PC+LPC+SM | 0.61 * | 0.94 |
| PL (Except LPC) | 0.65 * | 1.15 |
| TG | 1.63 * | 0.98 |
| 3-Hydroxybutyrate | 1.21 * | 1.10 |
| Alanine | 1.30 * | 0.97 |
| Choline | 1.02 | 1.68 * |
| Glucose | 0.88 * | 0.88 * |
| Glutamine | 1 | 1.18 * |
| Glutathione | 1.07 | 1.30 * |
| GPC | 1.39 * | 1.61 * |
| Inosine | 1.24 * | 1 |
| Lactate | 1.27 * | 1.14 * |
| Leucine | 1.23 * | 1.11 * |
| Phenylalanine | 1.32 * | 1.15 |
| Succinate | 1.50 * | 1.38 * |
| Threonine | 1.28 * | 1.03 |
| Tyrosine | 1.47 * | 1.28 * |
| Valine | ↑1.21 * | 1.07 |
© 2019 by the authors. Licensee MDPI, Basel, Switzerland. This article is an open access article distributed under the terms and conditions of the Creative Commons Attribution (CC BY) license (http://creativecommons.org/licenses/by/4.0/).
Share and Cite
Amiel, A.; Tremblay-Franco, M.; Gautier, R.; Ducheix, S.; Montagner, A.; Polizzi, A.; Debrauwer, L.; Guillou, H.; Bertrand-Michel, J.; Canlet, C. Proton NMR Enables the Absolute Quantification of Aqueous Metabolites and Lipid Classes in Unique Mouse Liver Samples. Metabolites 2020, 10, 9. https://doi.org/10.3390/metabo10010009
Amiel A, Tremblay-Franco M, Gautier R, Ducheix S, Montagner A, Polizzi A, Debrauwer L, Guillou H, Bertrand-Michel J, Canlet C. Proton NMR Enables the Absolute Quantification of Aqueous Metabolites and Lipid Classes in Unique Mouse Liver Samples. Metabolites. 2020; 10(1):9. https://doi.org/10.3390/metabo10010009
Chicago/Turabian StyleAmiel, Aurélien, Marie Tremblay-Franco, Roselyne Gautier, Simon Ducheix, Alexandra Montagner, Arnaud Polizzi, Laurent Debrauwer, Hervé Guillou, Justine Bertrand-Michel, and Cécile Canlet. 2020. "Proton NMR Enables the Absolute Quantification of Aqueous Metabolites and Lipid Classes in Unique Mouse Liver Samples" Metabolites 10, no. 1: 9. https://doi.org/10.3390/metabo10010009
APA StyleAmiel, A., Tremblay-Franco, M., Gautier, R., Ducheix, S., Montagner, A., Polizzi, A., Debrauwer, L., Guillou, H., Bertrand-Michel, J., & Canlet, C. (2020). Proton NMR Enables the Absolute Quantification of Aqueous Metabolites and Lipid Classes in Unique Mouse Liver Samples. Metabolites, 10(1), 9. https://doi.org/10.3390/metabo10010009


