Abstract
The financial valuation of a drug that is still under development is required for various purposes. The risk-adjusted net present value (r-NPV) method, which recently emerged in the biotech industry, uses the development attrition rate as a discount factor to reflect risk during each development phase. The r-NPV method was developed to overcome the disadvantages of the prevailing discounted cash flow and real options methods and considers drug type, as well as the stage of development in its approach. Using this method, the current study examines technology values in the biopharmaceutical industry and matches the clinical development periods and success rates of these new drugs by analyzing datasets from ClinicalTrials.gov and MedTrack DB. It thus provides support for an empirical valuation model for experts in the field. Notably, there is limited research on the attrition rate and development period of new substance drugs and the research results are not consistently presented. In addition to new substance drugs, further research is necessary to deepen understanding of the attrition rate and development period of biologically-based drugs because of their inherent physical and developmental differences. Similarly, research on performance specifics within drug class models would enable refinement of the model.
1. Introduction
1.1. Background
In the biopharmaceutical industry, uncertainty exists due to unknown scientific fundamental properties, and, in these situations, innumerable failures prevail. Overall, biopharmaceutical development takes more than 10 years for technological development [1,2]. If successful, the most important revenue model in the biopharmaceutical industry results from the blockbuster-level manufacturing capacity or licensing-out. In addition, as stated by the Deal Survey, the economic spread of biotechnology technology is far greater than that of any other industry [3]. For these reasons, an objective valuation within the biopharmaceutical industry remains a challenge. Methods of inferring value are currently provided by examining mergers and acquisitions (M&A) of similar firms, in-kind investments, licensing cases, and aggregate value of listed stocks. Accordingly, a great deal of effort is required in this industry for generating suitable technology valuations for investment judgments.
New drug development in the biopharmaceutical industry requires a long time and a great cost, which is why there are more licensing transactions here than other industries [1,2,3]. Royalties from licensing transactions are one of the key sources of revenue in the biopharmaceutical industry and is a preferred exit strategy to overcome crises. In licensing negotiations, technology valuations are used to help establish the value for licensing [4].
The quantitative expansion of the biopharmaceutical industry and the qualitative growth of the technology level are predictable enough. Thus, there are increasing demands for an valuation model to select technologies that can be rendered into actual products and make profits and predict the size of the revenue [5]. However, it is very difficult to objectively evaluate the value of the biopharmaceutical industry that develops drugs. Considering its uncertainty, this will remain a challenge. However, it is important to at least find a way that a majority can relate to for calculating an approximation or a means to determine the merits and demerits among similar biopharmaceutical businesses [6]. The discounted cash flow (DCF) model is widely used among the traditional valuation methods, but there is a large disparity depending on the basic assumption and it is thus likely to lead to arbitrary analysis.
Thus far, technology valuation in the biopharmaceutical industry has been performed only as a single industry. However, the biopharmaceutical industry has a longer product life cycle (PLC) than other industries and a broad spectrum such as Biologics License Application (BLA) and New Drug Application (NDA). Moreover, it also leads to convergence among different technologies and industries [5]. Considering that approximately 40% of technologies that are to be commercialized are in the biopharmaceutical industry, it is necessary to apply a technology valuation method specialized for the industry. Valuation of drugs under development is particularly necessary for various purposes such as licensing and M&A transactions. Predicting the future value of assets is useful and important in deciding what economic action to take in the future [7].
With government support, there are many R&D business startups in the biopharmaceutical industry based on the premise of commercialization. In the current situation with countless technologies pouring out of the laboratories, excellence of technology is not enough to judge biotech companies. Moreover, even the same adjustment disorder shows much difference depending on the contract environment (point of time, success rate, clinical development phase, type) or tendency [8]. Thus, a technology valuation methodology that can evaluate firms by the environment of individual drugs in terms of commercialization should receive more attention.
In the pharmaceutical sector, different methodologies should be applied to the DCF or royalty saving method, which is applied to general manufacturing or service technology, since it is necessary to consider various factors for successful commercialization, such as the probability of passage through each stage of clinical trials. However, there has been limited information on the probability, duration, and cost of each drug class. Therefore, a standardized valuation methodology that can spread the utilization to various purposes of technical valuation and activate the technology trading market, the data that needs to be updated, and the trace that measures the similarity between the actual value and the technical value through database accumulation of existing transaction cases research is needed.
1.2. Research Structure
This study focuses on the evaluated technology’s ability to generate future economic income through DCFs and aims to convert that income to present value. The optimum success rate and development period are applied to come up with a new risk-adjusted net present value (r-NPV) model that estimates the technology valuation indicators by total drug class, drug class, and drug type.
r-NPV valuation methodologies do take into account factors that vary depending on the drug class. The r-NPV valuation methodologies would consider successful probability, development period and investment cost at each clinical trial stage as well as typical principal variables such as technology economic life, cash flow estimation, discount rates, technology factor (or contribution rate). Particularly, successful probability and development period are related to drug class. For this reason, the r-NPV model study that can reveal these variables that can be changed according to the drug class is meaningful. If the expected development cost of drugs is relatively low and the expected operating profit is relatively high, the drug is of course profitable.
According to “Deal Surveys” license providers involved in pre-clinical or post-clinical contracts tend to use r-NPV to evaluate and structuralize transactions. Moreover, license providers using r-NPV demand initial payment, mileage, and royalty that are higher than average, as well as overall transaction value. Thus, a methodology that reflects the specificity of the biopharmaceutical industry is one that can use the results of analyzing uncertain factors—such as possibility of success (POS) in clinical trial, development cost, and development period in new drug development—as input variables. The results of this process can also verify the elements that determine the amount of technology value using Monte Carlo Simulation.
Technology valuation is used for various purposes in many industries, such as licensing-out and transaction, investment in kind, tax calculation, and liquidation. Among the different valuation methods, r-NPV is “risk-adjusted expected future cash flow” that applies the potential risk in cash flow and converts future cash flow to present value. According to the existing r-NPV valuation model, the most important parameters are market share, price, POS, and time spent in development (development period). The development period of drug candidates in the initial stage is as important as r-NPV. The issue of progress is the most important factor for an initial researcher in terms of development cost and time.
Valuation methods that calculate technology value, considering technical contribution and present value based on the product’s ability to generate future profits, are mostly based on DCF. However, DCF fails to reflect continuous investments and uncertainty inherent in the project. Nevertheless, research on r-NPV calculation has not been actively conducted to overcome these limitations.
2. Literature Review
2.1. Characteristics of Biopharmaceutical Technologies
The biopharmaceutical industry needs a licensing procedure for clinical trials, unlike other industries, which involves the process of verifying whether the drug is safe and effective. The U.S. Food and Drug Administration (FDA) and European Medicines Agency (EMA) approve such licenses [7]. The U.S. requires all products to undergo pre-clinical research before testing them on people. This is because, to determine whether performing a drug test on people is safe, it is necessary to provide enough information in the pre-clinical process. Once the drug is considered safe, the Investigational New Drug (IND) application can be submitted. The IND application must include the type and dosage of research participants. The application is reviewed by the FDA and local institutional boards, and, once it is approved, clinical trial on humans may begin.
Drug development from P1 to P4 (Phase 1 to 4) requires a long time and great costs. The development process cost of a typical biopharmaceutical company based on initial studies in the pre-clinical stage is estimated to be at least $960 million [9,10]. The cost and development period vary depending on the project, but they are related to the treatment area and choice of industry. On average, a biotechnology company requires lower clinical trial costs than a pharmaceutical company but a longer period of development and approval [9,11].
Biologics are biological materials that cannot be self-administered and must be injected by medical staff using intravenous injection. Accordingly, biologics tend to be smaller and more expensive, since they must be concentrated only on hospitals. Furthermore, the production cost also tends to increase due to the chemical process unique to the industry [12]. These characteristics of biologics must also be reflected on the technology valuation model.
In the biopharmaceutical industry, uncertainty exists due to scientific fundamental properties, and, in these situations, innumerable failures should be supported for success, requiring step-by-step clinical progress; overall, it has the characteristic that it takes more than 10 years for technological development [1,2]. Drug development is time-consuming and costly, and it has the characteristics of complicated technology and harmlessness of human body in order to pass the clinical stage. Global pharmaceutical companies are seeking to license technologies that have already been under clinical trials or clinical trials, or that have just passed clinical trials, since, as clinical trials progress, the possibility of product launch increases and technology transfer prices increase, which is burdensome for large global pharmaceutical companies. Therefore, one of the commercialization strategies for pharmaceutical companies to reduce their costs economically is to select technology by drug class and clinical stage, and to acquire technology at the optimal time [1,2].
2.2. Technology Valuation Methodology
The r-NPV method is a DCF method estimating the NPV of technology. Real options valuation includes the concept of future opportunity costs for commercialization. These two quantitative approaches, the DCF and real options, are used in technology valuation of the biopharmaceutical industry [13]. However, the DCF method occasionally has negative values when applied to drugs in an early stage. The real options method is complicated and theoretical, and thus related case studies are insufficient. Therefore, it is not preferred by medical specialists [14].
The r-NPV formula is the value of r-NPV () by net income as a limited formula of cost () spent in the development process of profit (.) after market release. The present value () of profit after the release is a value obtained by multiplying total anticipated sales by the likelihood of FDA approval (LOA) and applying the discount rate to the time that is required until the relevant sales are occurred. The discount rate (weighted average cost of capital, WACC) is the rate used in converting cash flow to present value, created while drugs are generating profit, and it is applied as of the present point. Cash flow (CF) indicates the pure cash inflow obtained by subtracting total cash outflow from total cash inflow (income). The present value () of costs in the development process is the total of values applying the discount rate by multiplying the cost of each development phase by the possibility of entering the relevant stage:
Description of variables in the r-NPV formula,
- : Development period in each phase,
- : LOA (Likelihood of Approval),
- : Entry POS (Pro: Probability) in each phase,
- : Discount rate,
- : Cash flow after release,
- : Development cost in each phase,
- t: Period until the expiration of the patent.
POS refers to the probability of entering the relevant development phase and can be calculated by multiplying the POS in the previous stage. In other words, if the current development phase is a Phase 2 clinical trial, this means that the pre-clinical and Phase 1 clinical trial were successful, and thus the probability of entering Phase 2 clinical trial becomes 200%. Moreover, the probability of entering Phase 3 clinical trial is equivalent to the POS (100% × success probability of Phase 2 clinical trial) of Phase 2 clinical trial. The probability of development cost that will be incurred each year can be reflected by distinguishing LOA with POS in each stage. Thus, regardless of which development phase the drug to be valuated is positioned, POS in each development phase and characteristic can be applied to the formula.
Calculating r-NPV is probabilistically evaluating all possible scenarios, adjusting each cash flow with the probability of occurrence. The key variables for the calculation of r-NPV () in the development process are development cost in each development phase of the clinical trial, development period, POS, and discount rate. Applying the optimum success rate and development period in the development process and converting to present value is useful in calculating the entire drug class and drug type.
Here, LOA is an especially important item. Total LOA is the statistical measure of how many projects reached commercialization in certain samples. Samples are the projects that had entered the first stage in the past, and they must show the final status of each project at the present condition. Unlike LOA, POS in each stage is a statistical measure of the number of ongoing projects in the next stage and the number of projects that entered a certain stage. In this process, there are various ways to evaluate POS and LOA in each stage. The difference in each valuation method occurs in the process of handling projects with the criteria of including samples whose end state is undecided (still in development).
The multiplication of POS in each development phase is the same as LOA. This is because there is a difference in clinical data by period, and there are various reasons for that. First, there is new technology. Initial drugs must achieve more goals and thus may lead to failure. Second, changes in regulations may cause negative results. Third, R&D POS in a certain period may be better or worse than other periods.
For these reasons, POS is not consistent according to time but has a specific time structure. Pharmaceutical companies, scientists, and portfolio analysts are striving to determine the disease area or mechanism for measures that are likely to succeed. They highly tend to extrapolate the trend of POS (actually observed success and failure) of the past in the future.
The key variables to calculate the r-NPV of revenue after release are cash flow after release, POS, LOA, development period, period until patent expiration, and discount rate. Just like estimating the period in which revenue is not incurred in the development period of each clinical phase, calculating r-NPV is adjusting the probability in which each cash flow will occur in a specific period. In this case, cash flow in each R&D stage can be differentiated using POS, and the recently observed results are considered highly reliable.
The r-NPV method appears to supplement the weakness of the DCF and real options methods. The r-NPV method uses only the reduction ratio as the discount rate considering risks in the development phases [15]. The loss factor proposed by DiMasi et al. [16] is frequently used in valuation among the technology transfer agents of biotechnology and pharmaceutical companies.
2.3. Key Variables of r-NPV Valuation
2.3.1. Development Period in Each Development Phase of the Clinical Trial
The r-NPV valuation has recently been receiving increasing attention compared to the conventional technology valuation methods due to the unique attributes of the biopharmaceutical industry. This is because it can be used to probabilistically predict the value that can be created by technology in the future and analyze factors that can affect the commercialization of technology. In other words, the results of analyzing uncertain factors such as development period, POS in clinical trials, and investment costs that follow drug development are used as input variables. By doing so, it is possible to reflect the development period in each clinical phase, which is the specificity of the drug development process that can be commercialized only by passing the clinical phases within the time specified.
The r-NPV calculation method is a method to calculate investment until FDA approval according to the development period, and it uses the method of adjusting the development period, using NPV as the starting point.
2.3.2. POS in Each Development Phase of the Clinical Trial
Clinical phases are comprised of P1 (Phase 1 clinical trial), P2 (Phase 2 clinical trial), P3 (Phase 3 clinical trial), and likelihood of FDA approval. It is necessary to consider that the clinical trial design that moves on to the next phase can only be approved when the drug satisfies the safety and effectiveness requirements. POS in each phase of the clinical trial is not influenced by the trial design, and thus it is necessary to evaluate the safety and effectiveness of drugs in each phase. Therefore, the probability multiplication of the clinical trial generally matches that of each phase (P1, P2, P3). Data are unknown regarding the probability of clinical phases, and thus a similar approach using actual clinical trial data can be applied.
The r-NPV calculation method is the simplest way to calculate investments in the POS and FDA stage, and the development period and POS are adjusted based on NPV. When using POS as the probability of cash flow occurrence in each development phase, recent observation results show high reliability. In this case, an approach similar to the probability multiplication is applied through actual clinical trial data.
The first principle of the NPV method is that future monetary value is lower than the present. Thus, to convert future cash flow to present value, it must be discounted using the discount rate. The discount rate reflects the opportunity cost of the capital, which increases along with the potential risk of future value. In other words, a risky project is expected to provide higher revenues. On the other hand, this is not the case for measurement items such as return on investment (ROI) or internal rate of return (IRR) [17].
The discount rate is estimated by calculating the “actual cost” of capital used, that is, weighted average capital and cost of debt used in the project. Small projects for which it is difficult to determine the capital and debt quota used in funding use the cost of capital called WACC. This is calculated using the annual report considering the company’s capital and liabilities [18]. The general discount rates used in projects are 10–15%, but investors of new high-tech companies also use 25–30% considering the risk.
The second principle of the NPV method is to consider all net cash flows related to valuation. On the other hand, indicators such as payment period or upfront investment consider only the initial cash flow. The NPV method requires converting the sum of all future cash flows and final value to present value. Thus, the value of the project is equivalent to the sum of final value and future cash flows converted to the considered present value.
Thoma [19] inferred the POS in the development phase of drugs by type (Table 1). The r-NPV method can be applied considering drug type and development phase, and thus the results of this study will help improve r-NPV. Thus far, the r-NPV method is implemented to supplement the weakness of the DCF and real options methods, but it had limitations in reflecting the characteristics of the biopharmaceutical industry. Table 1 below provides only cumulative POS for all new drugs and thus has limitations in actual application.

Table 1.
POS in the development phase of drugs classified by drug type.
Table 2 below provides POS in each phase by drug type. However, it provides only cumulative POS in each phase, making it inappropriate for the r-NPV model. In other words, the r-NPV model uses only the POS in each phase as the variable.
Table 2.
POS in each development phase.
2.3.3. FDA LOA of the Clinical Trial
The P4 trial, which is referred to as post-marketing surveillance (PMI), supplements the study conducted in the three previous phases using an observational method as a much bigger dataset. P1 focuses on ensuring the safety of drugs taken by humans. P2 tests the effects of the drugs. P3 carried out a large-scale clinical trial, and it may take years to collect data necessary for approval. P4 expands the clinical trial to test the effects of drugs as well as their merits and demerits from many patient samples throughout a long period.
P4 is a test for mandatory reporting to FDA, and, once the drug is approved and sold, the FDA requires the company to track and report its side effects. The FDA Adverse Event Reporting System (FAERS) is a database to collect comprehensive data on the unintentional influence of new drugs and protect public health. The drug manufacturer must report the side effects of a new drug through the Drug Quality Reporting System (DQRS) and Individual Case Study Report (ICSR) in case there is a problem. Employees of FDA’s Center for Drug Evaluation and Research (CDER) regularly review the submitted data and request additional research or product modification if necessary.
Even in the market verification process, the researcher continues to perform clinical trials in P4. This process tends to include patients that have taken the drug for a long time to obtain preliminary marketing data. P4 is performed based on a greater number of patients than previous trials. The bigger the sample, the more effectively the researcher can target specific demographics. This test has been made mandatory by the FDA and helps drug manufacturers identify the new market and determine the application scope of recently approved drugs. Furthermore, P4 LOA will stand out more to delegated persons of license in technology valuation that considers risks.
2.4. Issues of Conventional Research Methodologies
2.4.1. Limitations of Conventional Research Methodologies in Providing r-NPV Variables
The lines between different fields of technology, such as medicine and biotechnology, are becoming blurry with the emergence of the Fourth Industrial Revolution. Moreover, thanks to the government’s business startup nurturing policy, many companies are being founded, and the demand for a technology valuation model is growing in the biopharmaceutical industry to valuate intangible assets. Technology valuation models are used for various purposes, such as selling of technology, investment in kind, technology, finance (security and guarantee for attraction of investment), acquisition, merger, liquidation, and lawsuit. However, the r-NPV method by drug class and drug type in the biopharmaceutical industry fails to provide systematic logic to determine input variables.
BIO [20] is the biggest large-scale study thus far on POS in clinical drug development. It analyzed a total of 9985 records in clinical and regulation phase conversion from 7455 clinical development programs of 1103 companies through the BioMedTracker database from 2006–2015. The conversion of clinical phases occurs when the drug candidate moves on to the next clinical phase or is suspended by the sponsor. By calculating the progress and number of suspensions compared to the program proceeding to the next phase, the clinical development POS of the four phases (P1, P2, P3, and approval application) was evaluated. However, this study only considered programs sponsored by the company and that can be registered by the FDA, while excluding studies sponsored by researchers.
The individual phase POS is calculated by dividing the number that proceeded to the next phase by the number that is converted or suspended. The number of “conversions and temporary suspensions” is referred to as “n” in the study and is considered when coming up with POS. One of the key measures of success used in the study is POS, which is a complex probability that is obtained by multiplying the clinical POS of all four phases.
2.4.2. Limitations of the Clinical Trial Development Period in Conventional Research Methodologies
Bogdan and Villiger claimed that the development period of each clinical phase is 18–22 months in P1, 24–28 months in P2, and 28–32 months in P3 (Table 3) [4]. Other studies did not cover the estimation of the development period in each clinical phase.
Table 3.
Bogdan’s phased development period.
2.4.3. Definition of Clinical Phases in Conventional Research Methodologies
The definition of each clinical phase is used equally in most previous studies and reports, as shown in Table 4 below. The clinical phases of drugs are sometimes not clearly distinguished, but it is necessary to clearly classify the different phases for valuation.
Table 4.
Classification of the clinical phases.
2.4.4. Cases of Calculating r-NPV in Conventional Research Methodologies
The cases of calculating r-NPV in conventional research methodologies are modeled as shown in Table 5 below. The project is just before entering Phase 2, and NPV in each phase is adjusted depending on the probability of reaching the relevant clinical phase, and a 15% discount rate is applied. Phased POS is used in calculating r-PNV [21].
Table 5.
Cases of calculating r-NPV.
DiMasi et al. omitted results on POS of BLA [16]. BIO omitted the development period of BLA [20]. Bogdan and Villiger also omitted results on BLA [4]. In addition, many previous studies tend to come up with different results in terms of phased POS depending on the research period of data for analysis. In other words, the issue of conventional valuation models is that they depend on limited results by clinical data within a limited period as opposed to the whole clinical period. By calculating POS and the development period of each clinical phase with drug type and drug class in the variable model of the improved r-NPV methodology, it will be possible to apply this to actual practice. The issues of conventional models are as shown in Table 6 below.
Table 6.
Current state of previous studies and omitted data.
3. Research Framework/Methodology
3.1. Data for Analysis
In this study, both the ClinicalTrials.gov database from NIH as well as the Medtrack database from Informa cooperation are used for analysis. We analyzed 134,500 NDA and 15,000 BLA clinical trial records from 1970 to 2017 on the ClinicalTrials.gov database, and the Medtrack database was matched to derive the drug class. We classified target diseases into 14 major categories by following DiMasi [16]: cardiovascular, central nervous system, dermatology, endocrine, metabolic, genetic disorder, gastroenterology, genitourinary disorders; hematology, immunology and inflammation, musculoskeletal, oncology, respiratory, others, and two characteristics: NDA or BLA.
The entire period is from 1970 to 2017. Database classification for analysis on all new drugs, and number of datasets are as shown in Table 7.
Table 7.
Description of analysis data.
3.2. Method of Analysis
The problem with the existing value valuation model was that there was a limitation that was dependent on research results from clinical data for a limited period of time, not the entire clinical period, and a biased limitation to the field of new drug new drugs. In addition to the new substance new drug, in addition to this, the clinical data of the last 47 years of bio new drug whole or more to consider the type and disease systematization, cash by initial investment execution time and sales. It is an improvement model study of r-NPV that reflects uncertainty risk in almost all cases where there is a considerable difference in the occurrence time.
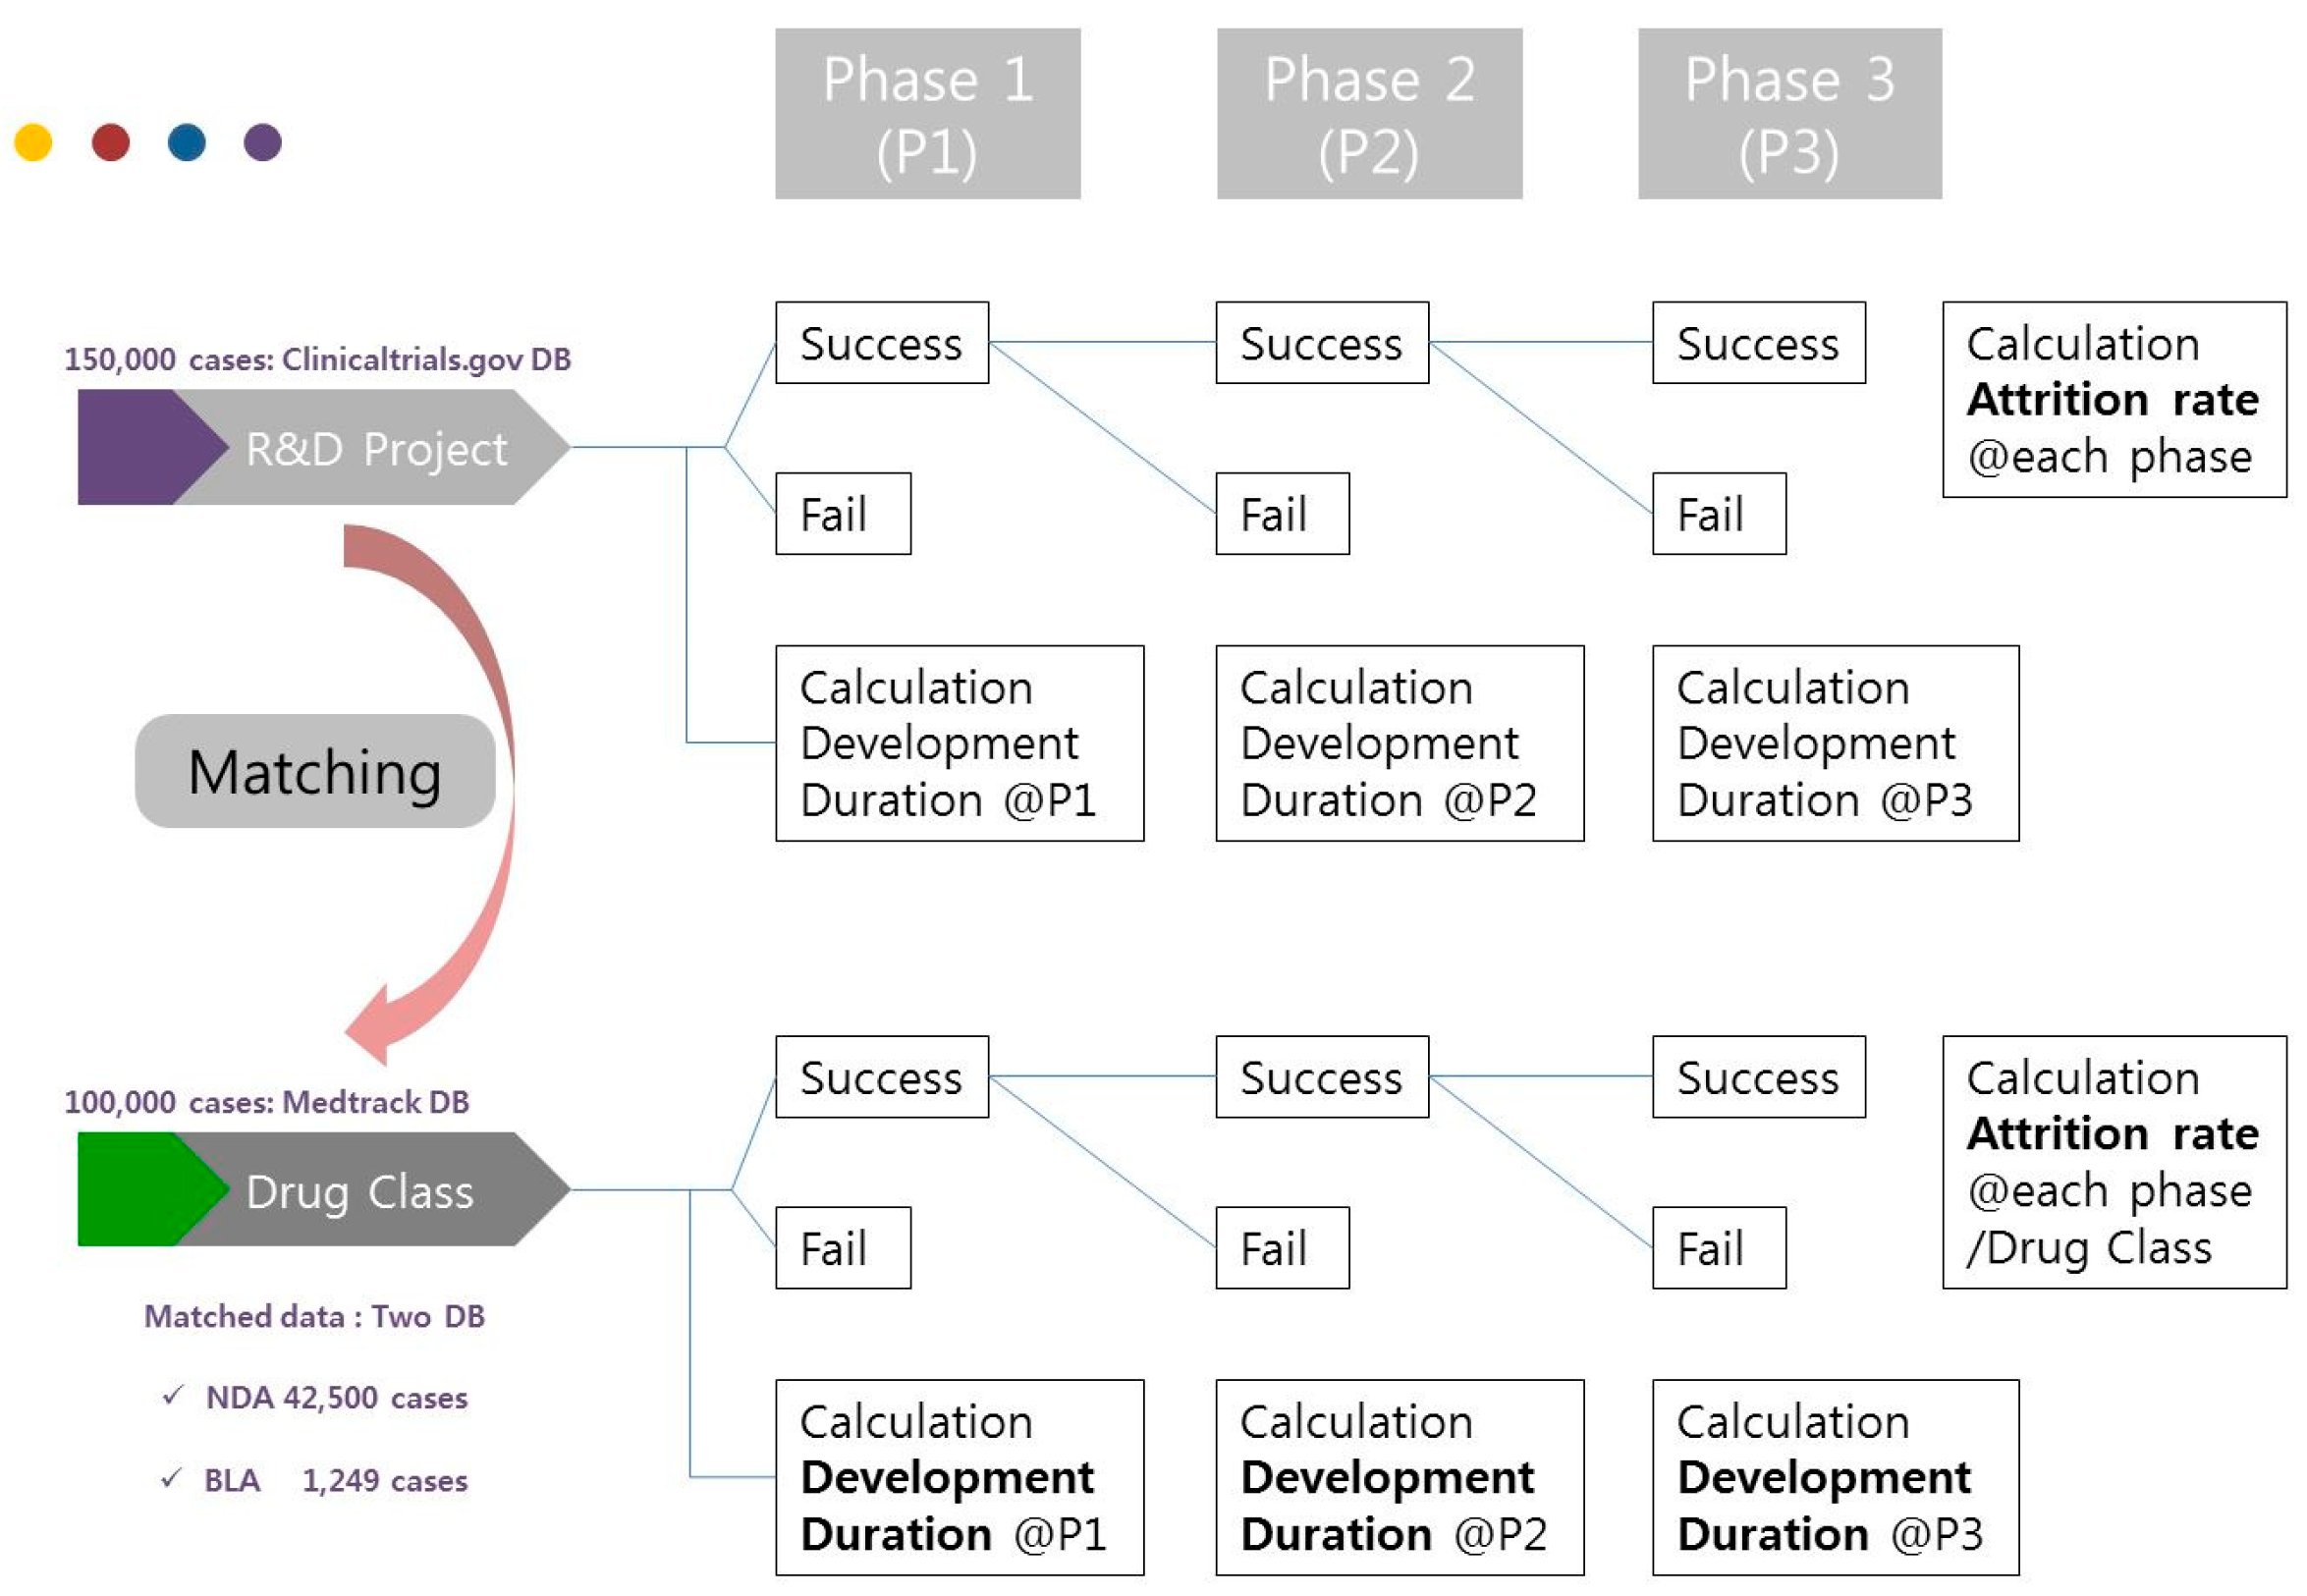
Therefore, this study will evaluate the technology value in the biopharmaceutical industry using the valuation method based on r-NPV and provide an empirical valuation research model for experts. The r-NPV model will be based on the database of Medtrack and ClinicalTrials.gov. By doing so, this study will present valuation indicators such as development period, POS, and LOA by drug class, drug type, and clinical phase of NDA and BLA. The analytical method of this study is as shown in Figure 1 below.
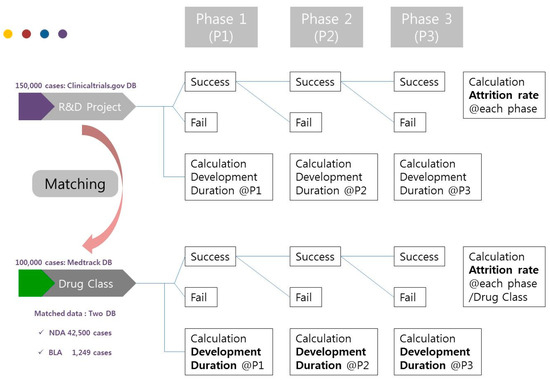
Figure 1.
Analytical method.
4. Results
The type of new drugs is classified into LOA and development period of all drugs, LOA and development period of NDA, and LOA and development period of BLA. This classification facilitates comparison with the results of BIO, a major previous research on the topic [20]. Moreover, the present study provided a new r-NPV variable calculation model to use in calculating the r-NPV of the biopharmaceutical industry.
4.1. Development Period of All New Drugs by Phase and Class
The development period of all new drugs (NDA+BLA) in each phase using the dataset of ClinicalTrials is calculated by drug type (Table 8).
Table 8.
Development period (month) of new drugs in each phase for the whole period (1970–2017).
Table 9 below shows the development period of all new drugs by drug class and phase.
Table 9.
Development period (month) of new drugs in each drug class/phase for the whole period (1970–2017).
The LOA of NDA candidates from phases 1 through 4 was 11.4%, which is 1.0% lower than previous studies. Moreover, the LOA of BLA candidates from phases 1 through 4 was 8.6%, which is 5.1% lower than previous studies (Table 10).
Table 10.
POS/LOA in each phase of new drug development for the whole period (1970–2017).
4.2. NDA Development Period and POS
Table 11 shows the result of calculating the development period in each clinical phase of NDA using 134,500 cases of data from 1970 to 2017 on ClinicalTrials.gov.
Table 11.
Development period (month) in each NDA drug class/phase for the whole period (1970–2017).
The disease with the longest development period was oncology, which required 13.7 years (164 months). The shortest was endocrine disorder that required 8.7 years (104 months). The LOA until Phase 4 was 8.6% (Table 12, Figure 2).
Table 12.
Conversion (approval) rate in each NDA clinical phase for the whole period (1970–2017).
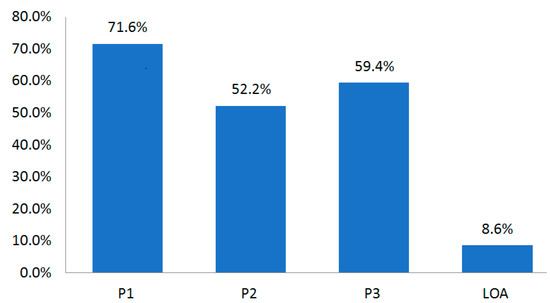
Figure 2.
Conversion (approval) rate in each NDA clinical phase for the whole period (1970–2017).
Table 13 shows the development period in each NDA clinical phase for the whole period. In recent years, the development period has tended to become shorter.
Table 13.
POA in each NDA clinical phase for the whole period (1970–2017).
4.3. BLA Development Period and POS
There were few drug classes of data of BLA (15,000 cases). Moreover, only P1 data could be obtained due to low data match rates of ClinicalTrials and Medtrack (Table 14).
Table 14.
Development period in P1 by BLA drug class for the whole period (1970–2017).
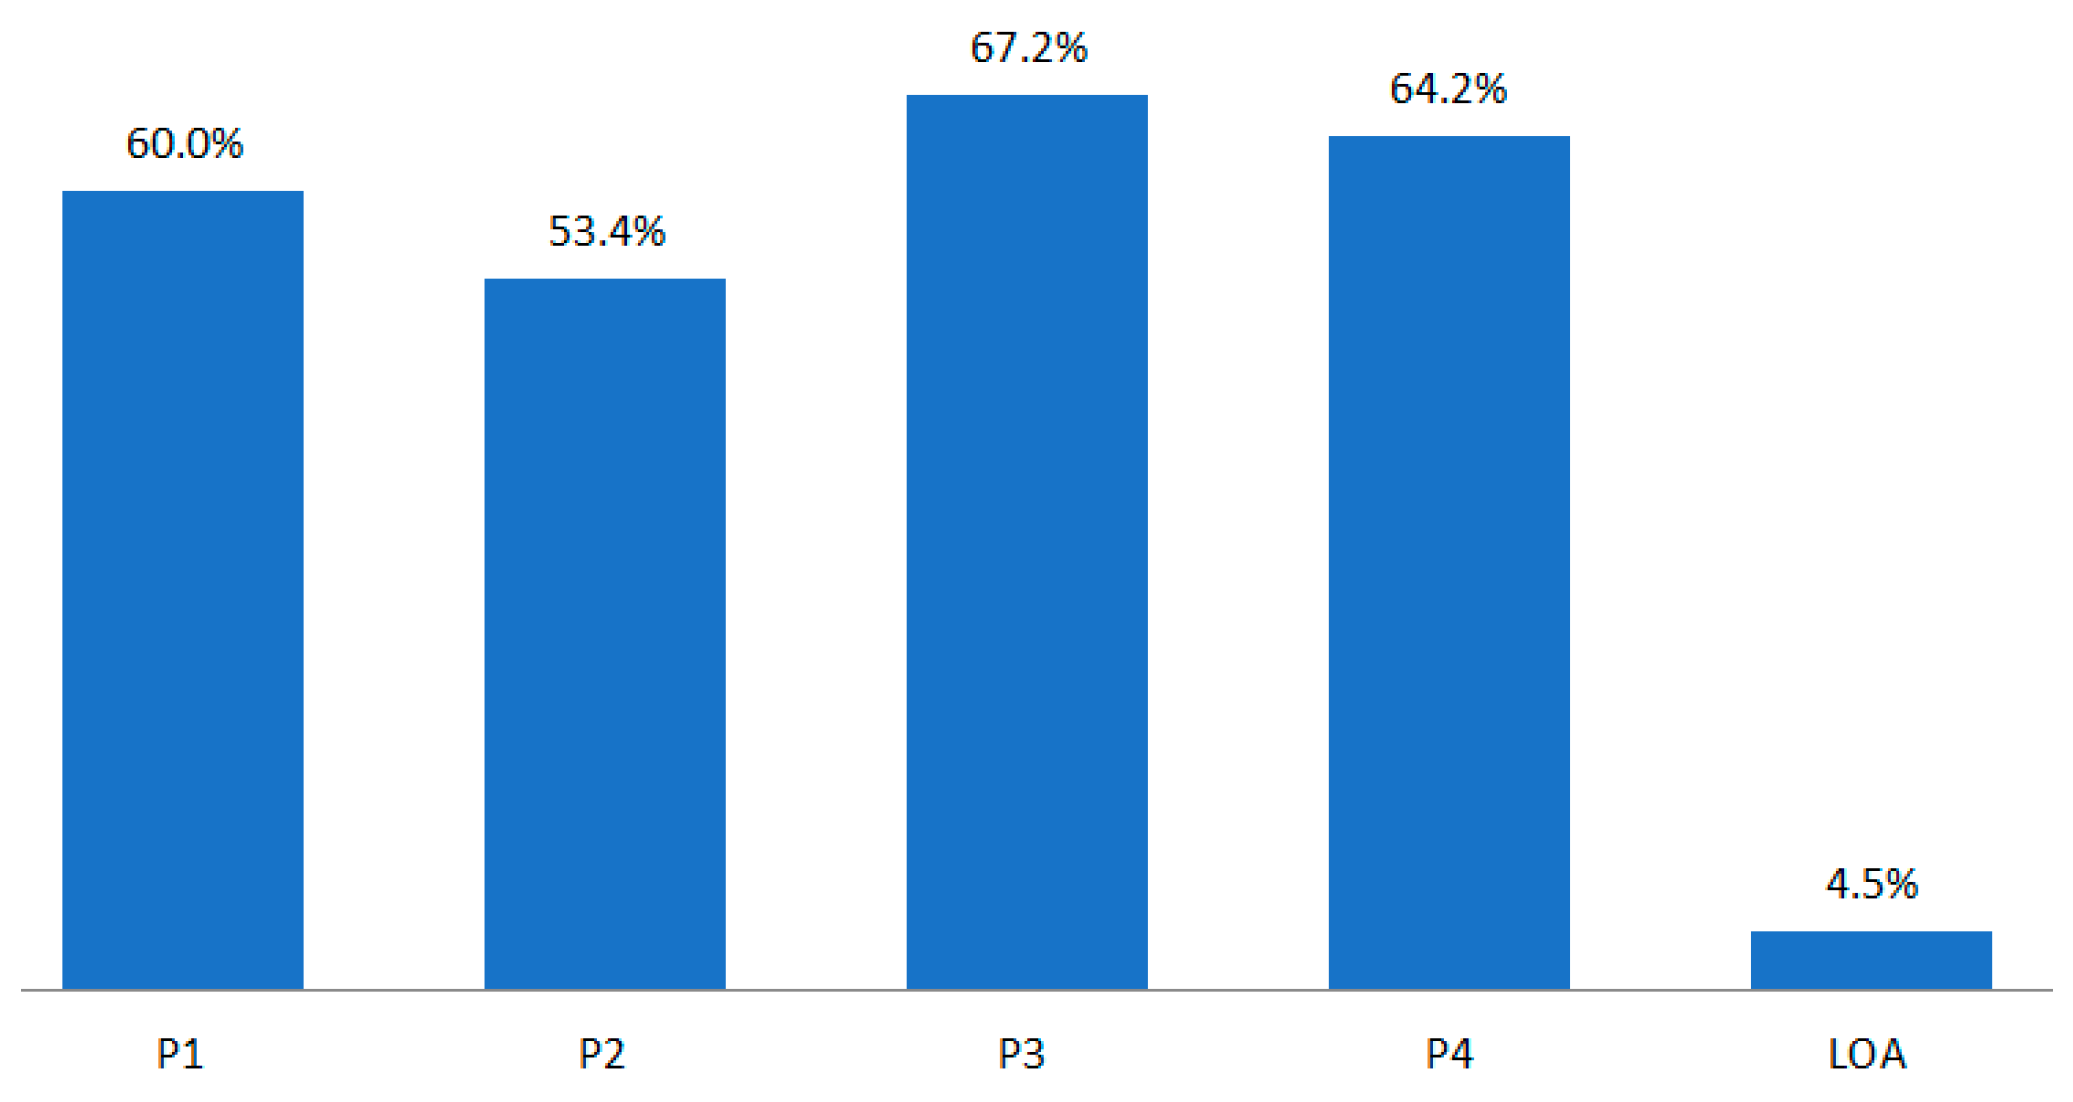
The P1 development period of BLA by drug class was much longer than that of NDA. The POS of BLA by phase was 60.0% in P1, 53.4% in P2, and 67.2% in P3 (Figure 3).

Figure 3.
POS/LOA by BLA drug class for the whole period (1970–2017).
NDA and BLA show a difference of 1.0% and 5.1%, respectively, in terms of the LOA of P1–P4. There is a 2.0% difference in terms of all drugs (NDA + BLA). It is desirable to readjust this considering that post-marketing POS and pre-marketing LOA in P4 are low at approximately 17%, as shown in Figure 3 [22].
According to Ku’s research findings, the P4 POS (NDA-Market) is 83%. Accordingly, this study calculated the result of subtracting LOA*17% from P4 POS as NDA LOA (Table 15).
Table 15.
Refined POS/LOA in each development phase of all new drugs for the whole period (1970–2017).
Compared to the result of BIO, all new drugs (NDA + BLA) had 0.7% lower LOA after readjustment [20]. On the other hand, NDA had 0.5% higher and BLA had 4.3% lower LOA. When perform post-marketing technology valuation (NPVrev.) considering LOA, it seems desirable to readjust NDA to 8.6–10.1%, BLA to 4.5–5.3%, and all new drugs to 7.6–8.9%. By adding 17% to P4 POS in the clinical POS of drug development, the LOA of NDA is 10.32% and that of BLA is 5.4%. On the other hand, previous studies showed the result of 9.6%, which was higher than BLA and lower than NDA. This suggests that it is necessary to adjust the technology valuation indicators by new drug type.
The clinical trial period is rarely covered in previous studies but is necessary in terms of providing a reference point for revenue. The study results showed that NDA required an average of 10.4 years for development, and BLA required an average of 11.3 years for development.
Results that are more beneficial to license providers can be produced by using cumulative POS instead of POS that is generally used to calculate r-NPV. Thus, by applying the scope of POS and cumulative POS, it will be possible to evaluate the value within an adequate scope depending on the bargaining power of seller and buyer. Moreover, it is also possible to readjust additional risks by presenting the new model of NDA and BLA as the scope. The scope of refined POS in each NDA development phase can be adjusted to 63.2–71.6% in P1, 30.7–52.2% in P2, and 58.1–59.4% in P3 (Table 16). Accordingly, the maximum and minimum values in calculating r-NPV can be estimated. Furthermore, it will be possible to adjust the amount within the LOA scope (8.6–9.6%) to reduce the risk in technology transfer before P1.
Table 16.
Refined POS scope by NDA development phase for the whole period (1970–2017).
The scope of refined POS in each BLA development phase can be adjusted to 60.0–63.2% in P1, 30.7–53.4% in P2, and 58.1–67.2% in P3 (Table 17). Accordingly, the maximum and minimum values in calculating r–NPV can be estimated. Furthermore, it will be possible to adjust the amount within the LOA scope (4.5–9.6%) to reduce the risk in technology transfer before P1.
Table 17.
Refined POS scope by BLA development phase for the whole period (1970–2017).
Table 18 below shows the case of calculating r-NPV. P1 of NDA, which is the current PC phase, is set as 2.3 years, P2 as 2.7 years, P3 as 2.9 years, FDA and release period as 2.9 and 1.2 years, FDA approval process as 1.2 years, and market exclusivity period as six years after release. Moreover, the development cost, POS in each phase, and discount rate are presumed as random values. LOA applied in the cash flow after release is based on the assumption that all the processes from development to approval are successful.
Table 18.
r-NPV calculation case (new model for NDA).
- (1)
- POS in each phaseNDA: P1 (67.4), P2 (41.5), P3 (58.8),BLA: P1 (61.7), P2 (42.5), P3 (62.7).
- (2)
- LOA by drug type after releaseNDA (8.6~10.1%), BLA (4.5~5.3%), all (7.6–8.9).
- (3)
- Insert average period for development period (t).
The average development period (P1–P3) of NDA can be set as 8.2 years, and that of BLA as 11.3 years. The refined POS scope in each NDA development phase is 63.2–71.6% in P1, 30.7–52.2% in P2, and 58.1–59.4% in P3. For BLA, it is 60.0–63.2% in P1, 30.7–53.4% in P2, and 58.1–67.2% in P3. Accordingly, the license provider and consumer can estimate the maximum and minimum values. Moreover, they can primarily verify technology value through the final LOA of NDA (8.6–9.6%) and of BLA (4.5–9.6%).
5. Discussion and Conclusions
This study considered the traditional methods of financial valuation being employed in the biopharmaceutical industry and concludes by proposing a risk-adjusted NPV model for more realistic valuations and to better reflect the R&D risk characteristics within this industry. This model is useful in assessing R&D investments at any point in clinical development, or in eventual licensing transactions.
Previous studies have focused only on the development period and POS (attrition rate) calculation model, without considering the classification of drugs. Furthermore, they have only used limited data. To overcome such limitations, it will be more useful to utilize overseas new drug technology transfer data (Medtrack DB) in calculating the indicators for new drug technology valuation in Korea, as attempted by this study. More detailed indicators of technology valuation can be divided into target disease (drug class), drug type, and clinical phases to calculate the development period, POS and LOA. For reference, Table 19 below shows the cumulative POS of all new drugs. This can be applied to the cumulative POS of the new r-NPV calculation case in Table 18.
Table 19.
Cumulative POS of all new drugs (1970–2017).
This study determines the key factors affecting the technology value of biopharmaceutical companies such as POS, development period, and royalty by drug class and type. To apply them to the r-NPV methodology, this study used development period and LOA to present a variable model (tool) for technology valuation. Previous studies had limitations in that they only used data from a limited period of 10 or 15 years. Thus, this study analyzed all cases throughout the entire period from 1970 to 2017 for the biopharmaceutical industry.
The r-NPV valuation model used data matched in the database of 150 thousand cases on ClinicalTrials.gov and 100,000 cases of Medtrack transaction data. Indicators such as development period, POS, and LOA were presented by drug class, drug type, and clinical phase of NDA and BLA. The development period and LOA of all new drugs were calculated from ClinicalTrials.gov data. For drug class and drug type data, this study analyzed the matching data between the drug class field of Medtrack transaction data and the condition field of ClinicalTrials.gov data.
Previous studies did not calculate the variable model that separately classifies NDA and BLA [3]. Moreover, the data used were not for the whole period but were limited to about 10–15 years. Thus, there was a large gap from the development period and LOA variable model of this study.
It is desirable to set the average development period (P1–P3) of NDA within 8.2 years and that of BLA within 11.3 years. Furthermore, new POS in each development phase of NDA is 63.2–71.6% in P1, 30.7–52.2% in P2, and 58.1–59.4% in P3. For BLA, it is 60.0–63.2% in P1, 30.7–53.4% in P2, and 58.1–67.2% in P3. Maximum and minimum amount of valuation can be estimated by calculating r–NPV using this POS scope for each development phase. Moreover, the final amount of technology valuation can be calculated in the pre-clinical phase, as well by calculating the LOA scope of NDA (8.6–9.6%) and LOA scope of BLA (4.5–9.6%) using final LOA.
Previous studies applied 9.6% LOA to the r-NPV model for NDA. On the other hand, this study applied 8.9% LOA for all new drugs (NDA + BLA), 10.1% for NDA, and 5.3% for BLA. This should be applied to the post-marketing technology valuation (rNPVrev) model.
ClinicalTrials data do not provide FDA LOA. Thus, considering that the market release rate after FDA approval is 83% [20], this study has the limitation of making estimates in proportion to the P4 LOA. However, considering that FDA LOA and P4 LOA [20] were recently close to 100%, there would not be a significant difference even if the P4 LOA is applied as it is.
Table 8 and Table 9 showed that the development period of drugs was shortest after 2013 and has been shortening continuously since 1970. This is due to the improved qualifications of researchers in clinical trials and system management capacity. POS in each clinical phase is also increasing.
The overall development process of NDA and BLA is the same, but there is a difference in the optimization and production process due to the differences in source materials in the discovery phase. Thus, the development period for BLA is longer than for NDA. Furthermore, the development period and POS also varied by drug type. Based on the above, this study additionally calculated the development period of NDA and BLA by drug class and proposed a more subdivided r-NPV variable model.
Therefore, there is a need for an improvement model to calculate LOA for new drugs with differences according to research subject. Moreover, it is also necessary to develop a new model on the royalty deduction method used in the pre-clinical (PC) phase. This is because the conventional r-NPV model tends to be used from P1 and is thus not suitable to apply to the pre-clinical phase. In addition, there is a need for an r-NPV LOA variable model subdivided into the rate of first market release (FDA approval) and second market release (P4 LOA). This is because, considering the mandatory process of reporting the post-FDA approval (first market release) and P4 clinical trial results to the FDA (second market release), it is not suitable to apply the same rate of market release to the r-NPV model in a lump.
The r-NPV method is the most frequently used for practical work in the biopharmaceutical industry. Valuation for the drug under development is required for various purposes, including merger and acquisition transactions, and two major quantitative valuation approaches, the discounted cash flow (DCF) method and the real options method are applied in the biotech industry. The risk-adjusted Net Present Value (r-NPV) method is an NPV method that uses only the development stage attrition rate as a discount rate to consider the risk at each development phase and has been developed to overcome the disadvantages of DCF and real options methodology. The r-NPV method, which considers the drug type as well as the development phase, has recently emerged in the biotech industry and provides accurate valuation for drugs in each phase.
The existing r-NPV model studies do not present results subdivided by drug type and drug class, and we used only the short-term sample data as a whole. In addition, existing study results vary since they do not simultaneously present results for clinical development periods and success rates, which are the main variables of the r-NPV model. In this research, we try to present clinical development periods and success rates by matching and analyzing the clinicaltrials.gov and Medtrack DB data sets.
Accordingly, the attrition rate and the development period, which are important variables in the r-NPV model, are limited to the previous research on new substance drugs, and the results of the attrition rate and development period are not consistently presented. Furthermore, research on simultaneously improving the attrition rate and development period of new drugs is necessary because results relating to them in the literature are presented separately by individual researchers. The problem with the existing valuation model was its dependence on research results from clinical data for a limited period of time, not the entire clinical period, and a biased limitation to the field of new matter drugs. In addition to this, the clinical data from the last 47 years of new biologic drug development largely consider the type of disease and its systematization, cash by initial investment execution time and sales. It is an improvement model study of r-NPV that reflects uncertainty risk in almost all cases where there is a considerable difference in the occurrence time of. In other words, there is much research on bio valuation, but the research in all of the sectors has the limitations discussed above. Our work eliminates these omissions in all the sectors.
r-NPV valuation methodologies do take into account factors that vary depending on the drug class. The r-NPV valuation methodologies would consider successful probability, development period and investment cost at each clinical trial stage, as well as typical principal variables such as technology economic life, cash flow estimation, discount rates, and technology factor (or contribution rate). Particularly, successful probability and development periods are related to the drug class. Therefore, an r-NPV model-based study that can identify the variables that can be changed according to the drug class is significant. If the expected development cost of drugs is relatively low and the expected operating profit is relatively high, the drug becomes profitable.
Therefore, our study attempts to address the need for an accurate valuation as biotechnological development takes a relatively long time, and its value is thus inflated. In particular, new drugs and bio-new drugs were classified typologically, and a detailed approach according to the disease category was made to enable accurate valuation. Through such accurate valuation, we provide tools to promote transactions such as technology transfer.
Technology valuation predicts the value that new drug candidate substances will contain. In this paper, we have discussed the clinical development period and success rate, which are the main factors in technology value valuation, based on the ClinicalTrials.gov big data that contain all data submitted to the U.S. FDA for clinical application. The data surveyed span a period of 10 years. In total, 150,000 cases were considered in this research [3,23,24,25].
The Food and Drug Administration (FDA) approves, manages and controls such items as medical devices, cosmetics, food, and all types of pharmaceutical products that are to be produced, distributed, and sold in the United States. The FDA is considered the world’s most rigorous and carefully-managed, approval organization for pharmaceuticals, etc. New drugs approved by the FDA are recognized as safe and effective, so virtually all over the world they can be released without special further procedures [26,27]. The overall development processes of NDA and BLA are the same, but there are differences in the complexity, optimization and production processes of BLA due to its fundamental difference in nature [28,29]. Thus, the development period for BLA is currently longer than NDA. In the future, further research on the method of coordinating among DBs is needed. In addition to the current research methods, a potential research theme would be to consider using Pubchem and Pubmed DB in conjunction with our dataset.
Author Contributions
Conceptualization, J.W. and E.K.; Methodology, J.W. and E.K; Software, T.S. and J.T.L.; Validation, T.S. and J.H.L.; Resources, J.W., K.S. and E.K.; Writing-Original Draft Preparation, J.W., E.K. and K.S.; Visualization, J.W.; Supervision, E.K. and K.S.; Funding Acquisition, E.K. All authors read and approved the final manuscript.
Funding
This paper received ‘best paper award’ at SOItmC 2019 conference. This study has been supported by the Innopolis Foundation grant funded by the Korea government (Ministry of Science and ICT: MSIT) (No. 2019-DD-SB-0202-01), and by the Medical Research Information Center (MedRIC) through the National Research Foundation of Korea (NRF), funded by the Ministry of Science and ICT of Korean Government (NRF No. 2018R1A6A6040880).
Conflicts of Interest
The authors declare no conflict of interest.
References
- Lee, J.H.; Kim, E.; Sung, T.-E.; Shin, K. Factors affecting pricing in patent licensing contracts in the biopharmaceutical industry. Sustainability 2018, 10, 3143. [Google Scholar] [CrossRef]
- Lee, J.H.; Sung, T.-E.; Kim, E.; Shin, K. Evaluating determinant priority of license fee in biotech industry. J. Open Innov. Technol. Mark. Complex. 2018, 4, 30. [Google Scholar] [CrossRef]
- Deloitte. Health Care Consumer Engagement No. “One-Size-Fits-All” approach. Available online: https://www2.deloitte.com/content/dam/Deloitte/us/Documents/life-sciences-health-care/us-dchs-consumer-engagement-healthcare.pdf (accessed on 2 December 2018).
- Borshell, N.; Ahmed, T. Approaches to Valuation of Pharmaceutical Licensing Deals. Available online: http://files.pharmadeals.net/contents/Sample_Valuation.pdf (accessed on 1 March 2018).
- Mergermarket. Global and regional M&A: 2014. Available online: https://www.mergermarket.com/assets/MergermarketTrendReport.2014.LegalAdvisorLeagueTables.pdf (accessed on 31 December 2018).
- Bogdan, B.; Villiger, R. Valuation in Life Sciences: A Practical Guide, 3rd ed.; Springer: New York, NY, USA, 2010. [Google Scholar]
- Shin, K.; Kim, E.; Jeong, E.S. Structural relationship and influence between open innovation capacities and performances. Sustainability 2018, 10, 2787. [Google Scholar] [CrossRef]
- Yun, J.H.J.; Zhao, X.; Hahm, S.D. Harnessing the value of open innovation: Change in the moderating role of absorptive capability. Knowl. Manag. Res. Pract. 2018, 16, 305–314. [Google Scholar] [CrossRef]
- Trotta, F.; Leufkens, H.G.; Schellens, J.H.; Laing, R.; Tafuri, G. Evaluation of oncology drugs at the European Medicines Agency and US Food and Drug Administration: When differences have an impact on clinical practice. J. Clin. Oncol. 2011, 29, 2266–2272. [Google Scholar] [CrossRef] [PubMed]
- Grabowski, H.; Vernon, J.; DiMasi, J.A. Returns of research and development for 1990s new drug introductions. Pharmacoeconomics 2002, 20, 11–29. [Google Scholar] [CrossRef]
- DiMasi, J.A.; Grabowski, H.G. The cost of biopharmaceutical R&D: Is biotech different? Manag. Decis. Econ. 2007, 28, 285–291. [Google Scholar]
- Hwang, J.; Kim, E.; Kim, S. Factors affecting open technological innovation in open source software companies in Korea. Innov. Manag. Policy Pract. 2009, 11, 279–290. [Google Scholar] [CrossRef]
- Lee, J.H.; In, Y.; Lee, I.; Lee, J.W. Valuations using royalty data in the life sciences area-focused on anticancer and cardiovascular therapies. J. Open Innov. Technol. Mark. Complex. 2016, 2, 1–25. [Google Scholar] [CrossRef]
- Lee, J.H.; Khee-Su, B.; Lee, J.W.; In, Y.; Kwon, T.; Lee, W. Valuation method by regression analysis on real royalty-related data by using multiple input descriptors in royalty negotiations in life science area-focused on Anticancer Therapies. J. Open Innov. Technol. Mark. Complex. 2016, 2, 21. [Google Scholar] [CrossRef]
- Kim, E.; Kim, S.; Kim, H. Development of an evaluation framework for publicly funded R&D projects: The case of Korea’s next generation network. Eval. Program Plan. 2017, 63, 18–28. [Google Scholar] [CrossRef]
- DiMasi, J.A.; Feldman, L.; Seckler, A.; Wilson, A. Trends in risks associated with new drug development: success rates for investigational drugs. Clin. Pharmacol. Ther. 2010, 87, 272–277. [Google Scholar] [CrossRef] [PubMed]
- Yourgenome. How Are Drugs Designed and Developed? Available online: https://www.yourgenome.org/facts/how-are-drugs-designed-and-developed (accessed on 26 April 2018).
- Abrantes-Metz, R.M.; Adams, C.; Metz, A.D. Pharmaceutical development phases: A duration analysis. J. Pharm. Financ. Econ. Policy 2004, 14, 19–42. [Google Scholar] [CrossRef]
- Hay, M.; Thomas, D.W.; Craighead, J.L.; Economides, C.; Rosenthal, J. Clinical development success rates for investigational drugs. Nat. Biotechnol. 2014, 32, 40–51. [Google Scholar] [CrossRef] [PubMed]
- Clinical Development Success Rates 2006–2015. Available online: https://www.bio.org/sites/default/files/Clinical%20Development%20Success%20Rates%202006-2015%20-%20BIO,%20Biomedtracker,%20Amplion%202016.pdf (accessed on 26 April 2018).
- Källgren, F. Finding the Value of Biotechnology—A Risk-Adjusted Net Present Value Approach. Available online: https://www.ibg.uu.se/digitalAssets/162/c_162804-l_3-k_rapport-fredrik-kallgren.pdf (accessed on 26 April 2018).
- Ku, M.S. Recent trends in specialty pharma business model Author links open overlay panel. J. Food Drug Anal. 2015, 23, 595–608. [Google Scholar] [CrossRef] [PubMed]
- Young, P. Biotech Financial and M&A Trends—Two Steps Forward, One Step Back. Available online: http://www.pharmexec.com/biotech-financial-and-ma-trends-two-steps-forward-one-step-back (accessed on 5 March 2018).
- Kim, H.; Kim, E. How an open innovation strategy for commercialization affects the firm performance of Korean healthcare IT SMEs. Sustainability 2018, 10, 2476. [Google Scholar] [CrossRef]
- Griffin, J.M.; Lemmon, M.L. Book-to-market equity, distress risk, and stock returns. J. Financ. 2002, 57, 2317–2336. [Google Scholar] [CrossRef]
- Dimson, E.; Marsh, P.; Staunton, M. Risk and return in the 20th and 21th centuries. Bus. Strategy Rev. 2000, 11, 1–18. [Google Scholar] [CrossRef]
- Cappa, F.; Del Sette, F.; Hayes, D.; Rosso, F. How to deliver open sustainable innovation: An integrated approach for a sustainable marketable product. Sustainability 2016, 8, 1341. [Google Scholar] [CrossRef]
- Smietana, K.; Siatkowski, M.; Møller, M. Trends in clinical success rates. Nat. Rev. Drug Discov. 2016, 15, 379–380. [Google Scholar] [CrossRef] [PubMed]
- Chiesa, V.; Frattini, F.; Lazzarotti, V.; Manzini, R. Performance measurement of research and development activities. Eur. J. Innov. Manag. 2009, 12, 25–61. [Google Scholar] [CrossRef]

© 2019 by the authors. Licensee MDPI, Basel, Switzerland. This article is an open access article distributed under the terms and conditions of the Creative Commons Attribution (CC BY) license (http://creativecommons.org/licenses/by/4.0/).