

On Spatiotemporal Overdispersion and Macroparasite Accumulation in Hosts Leading to Aggregation: A Quantitative Framework


Abstract
1. Introduction
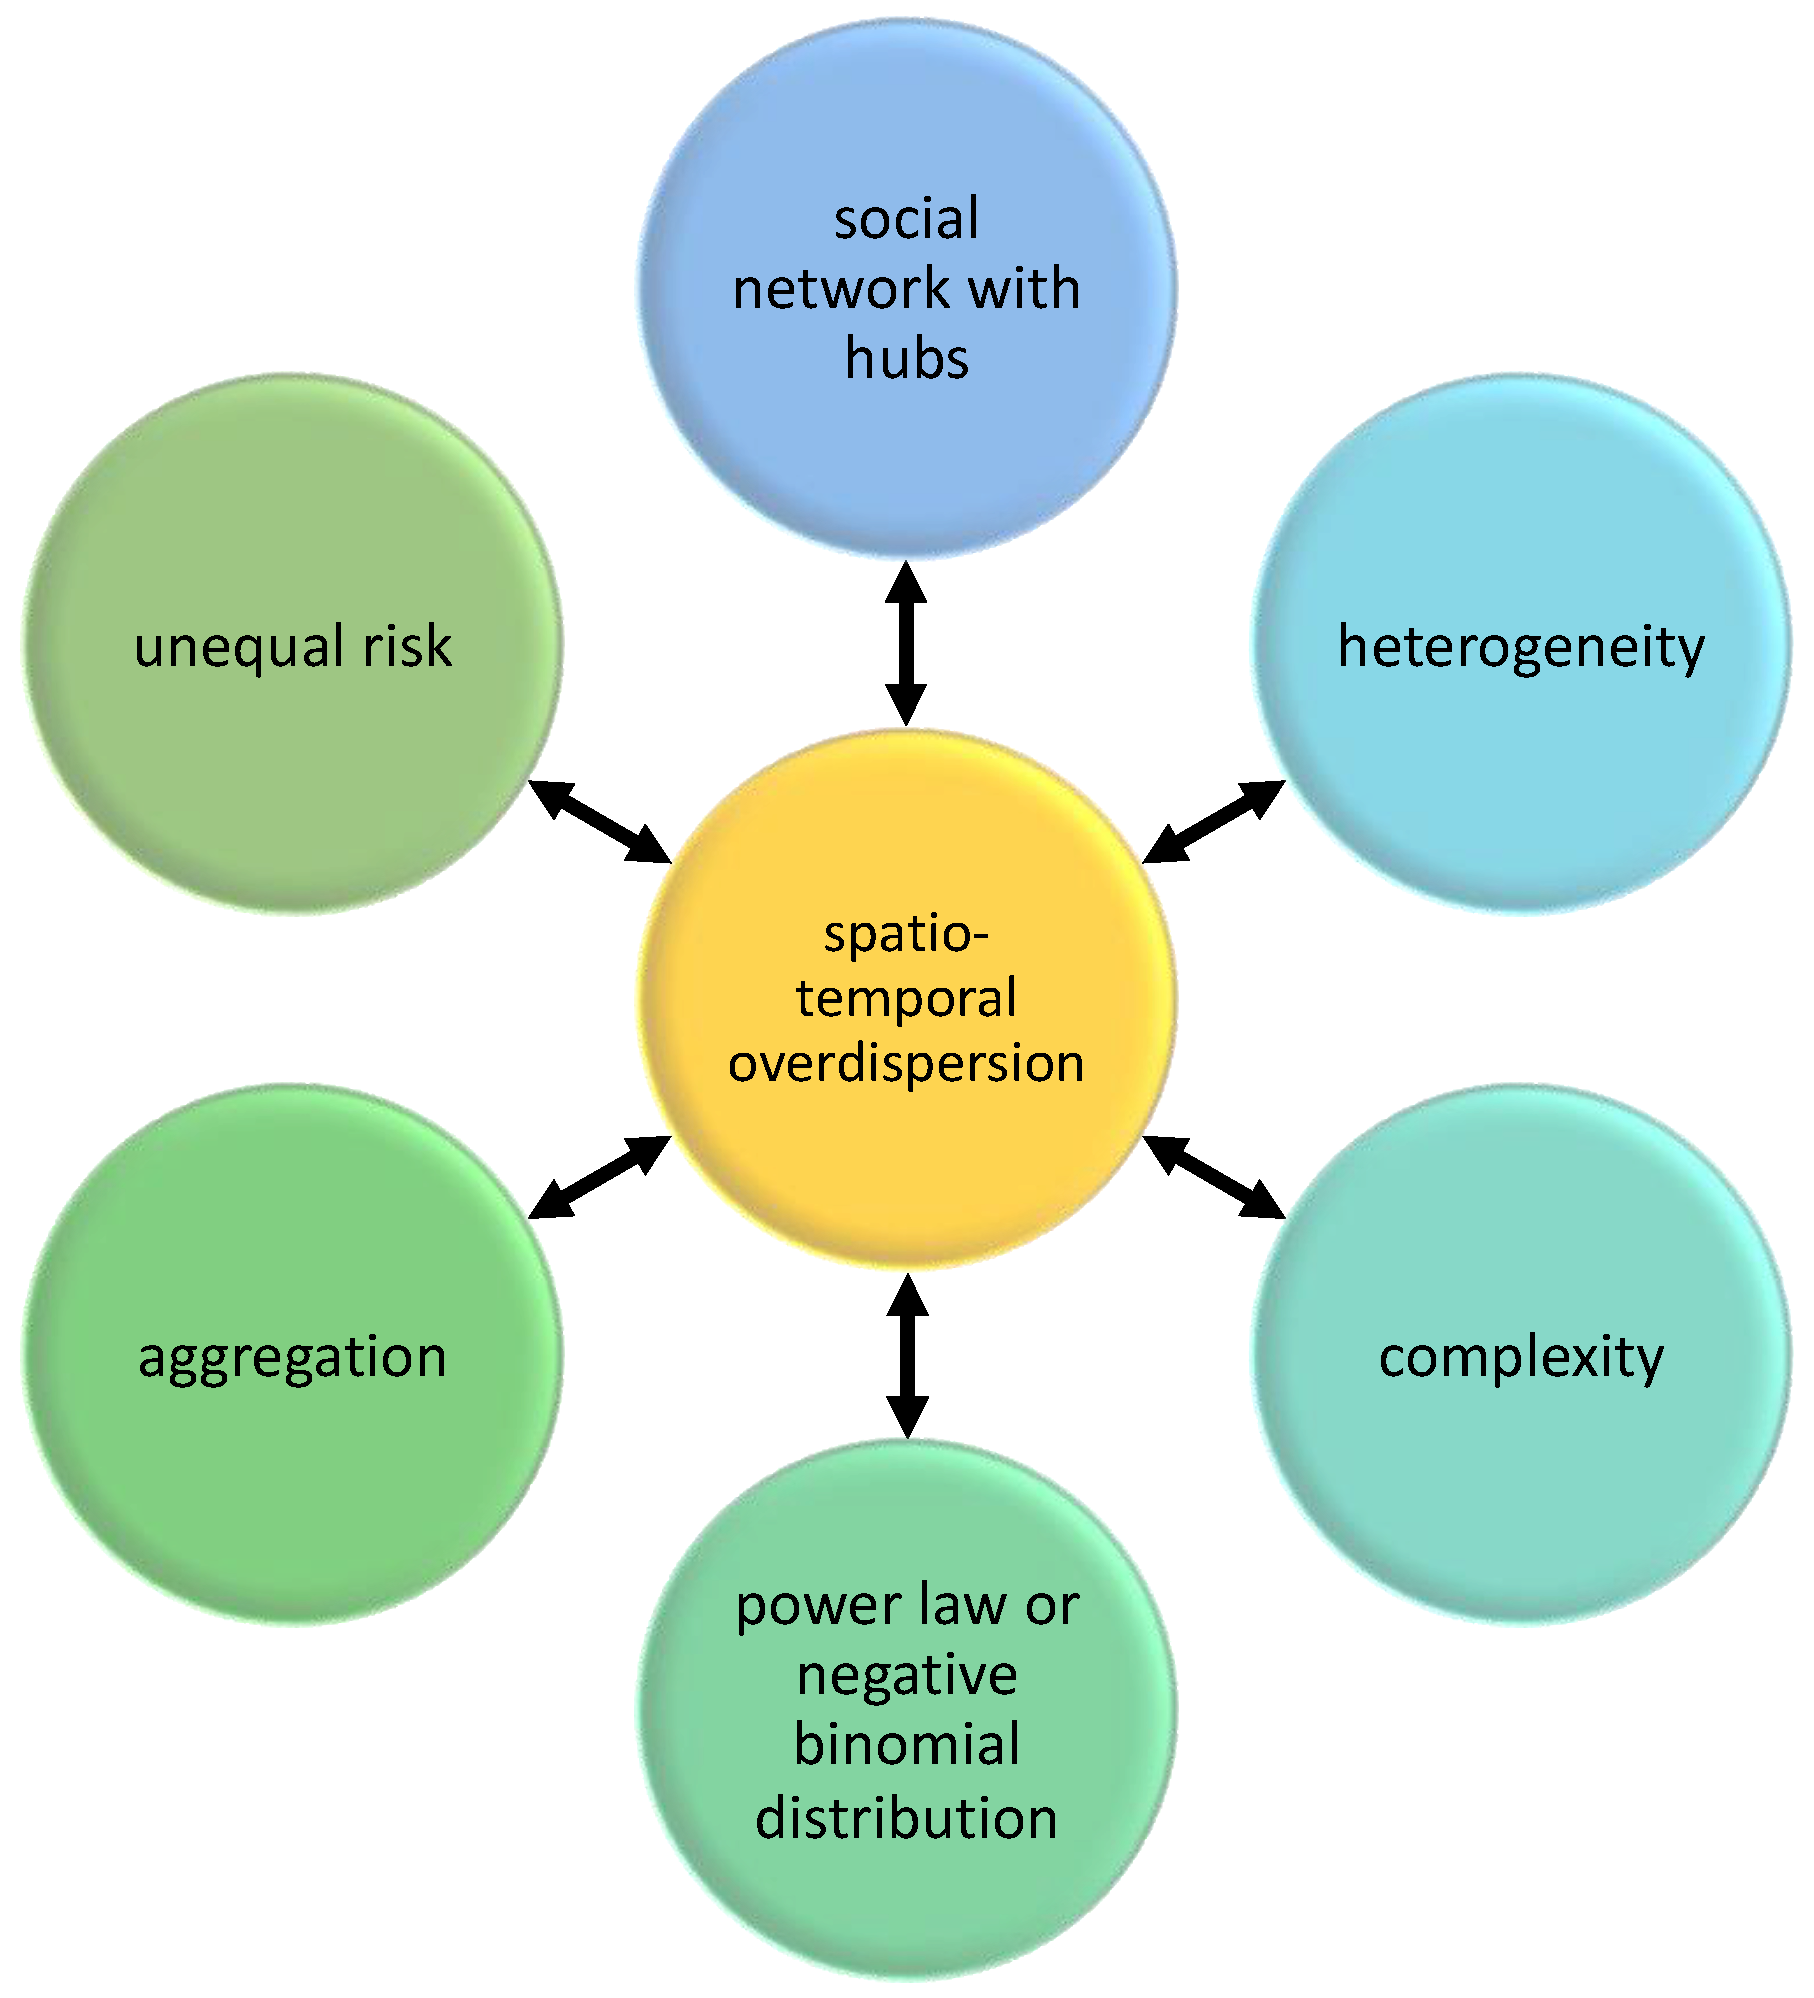
2. Framework
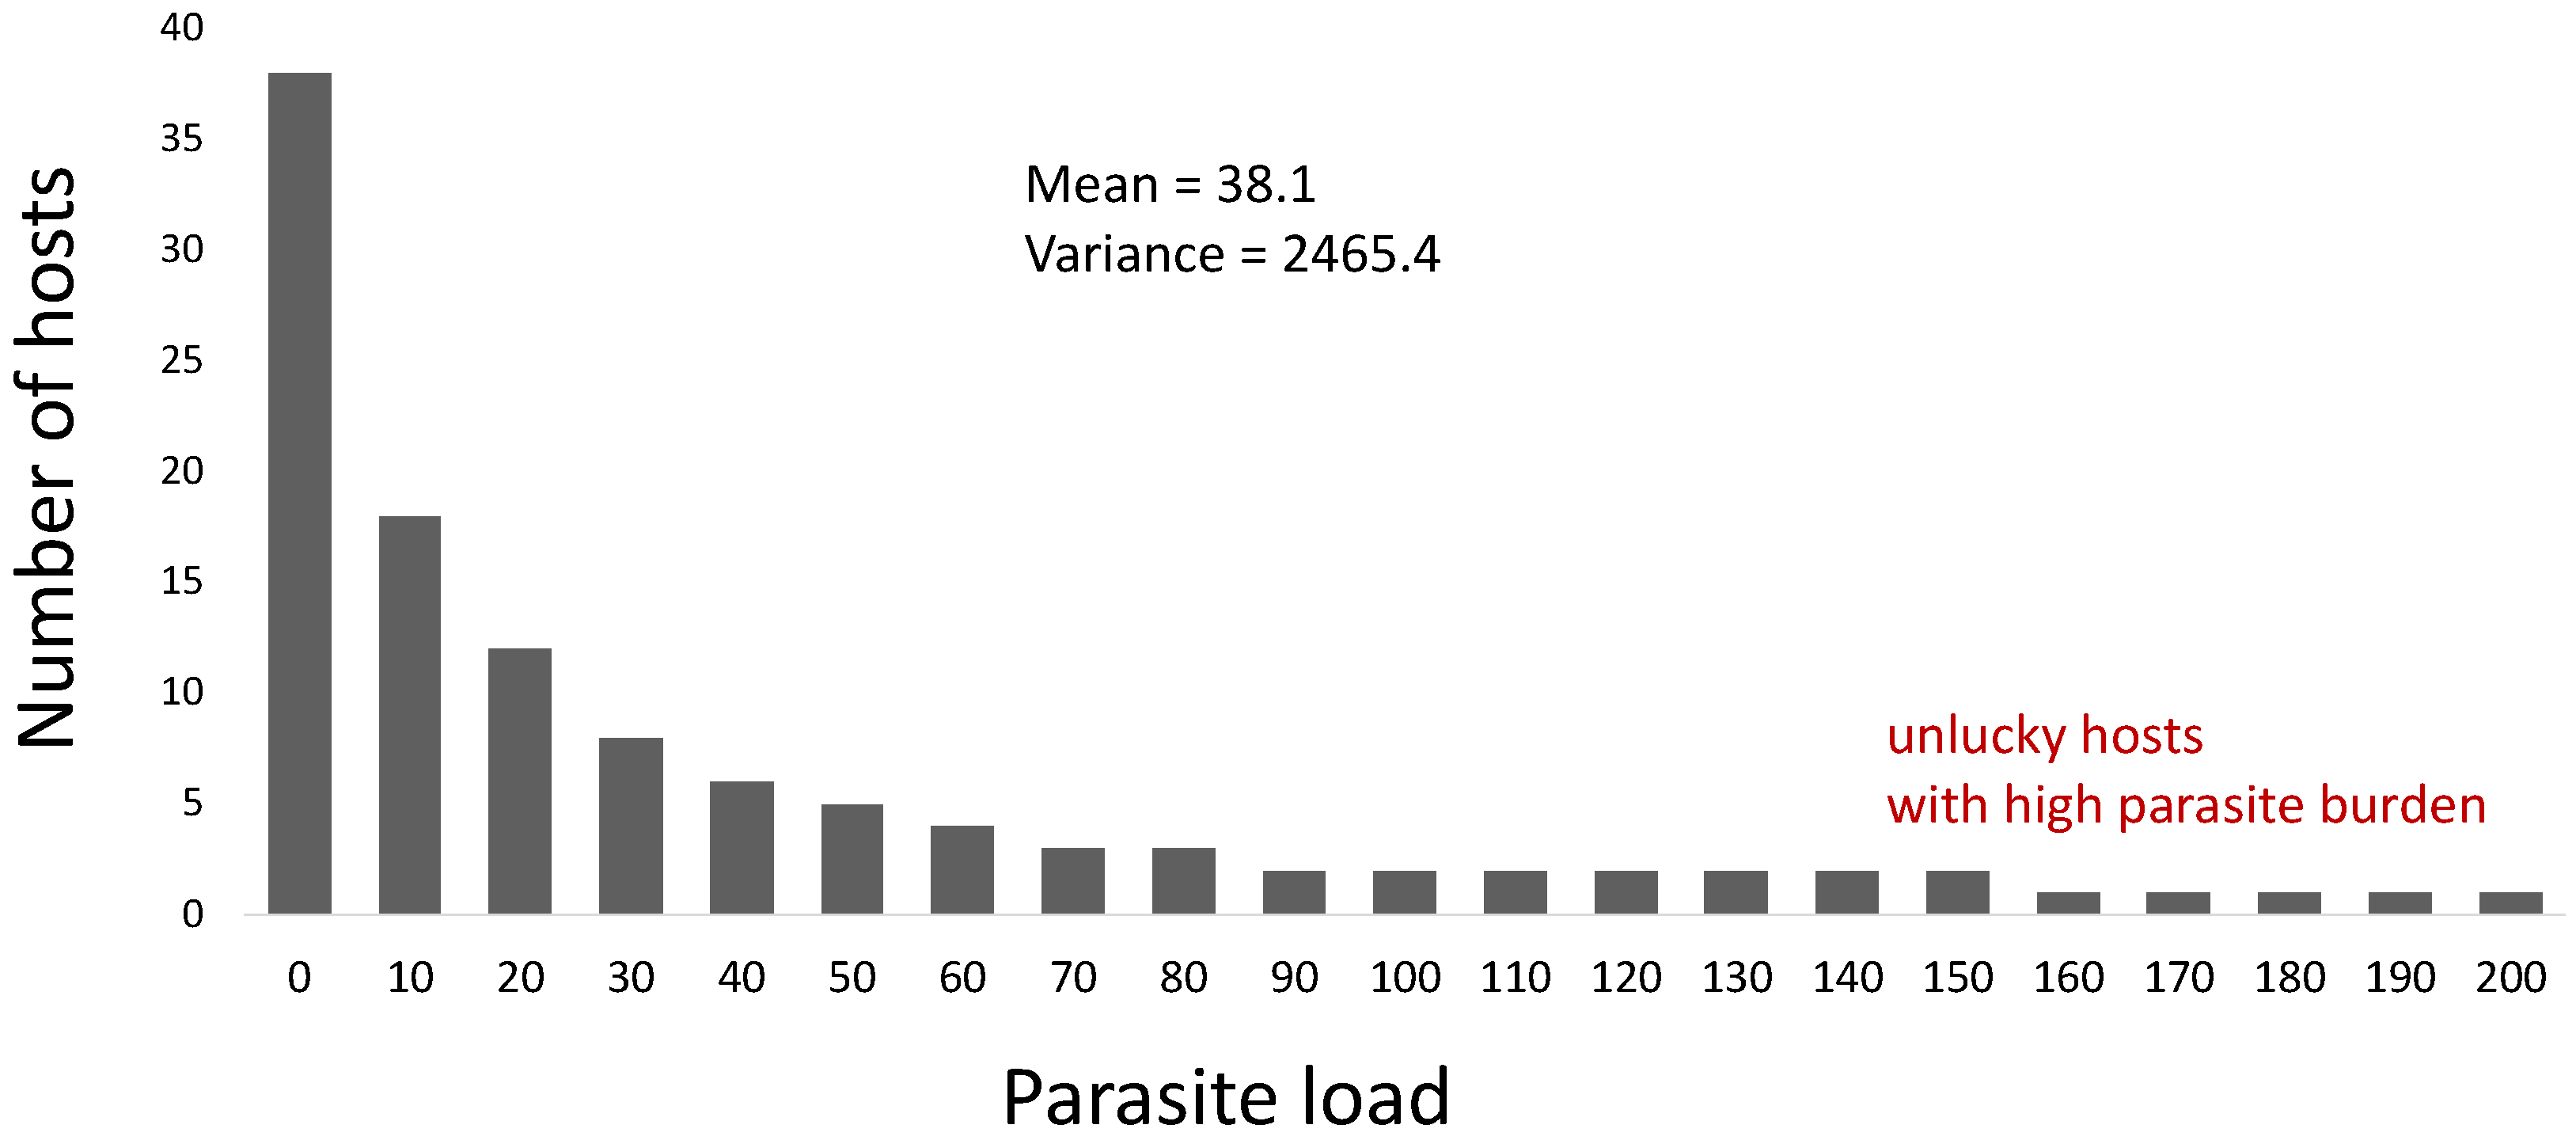
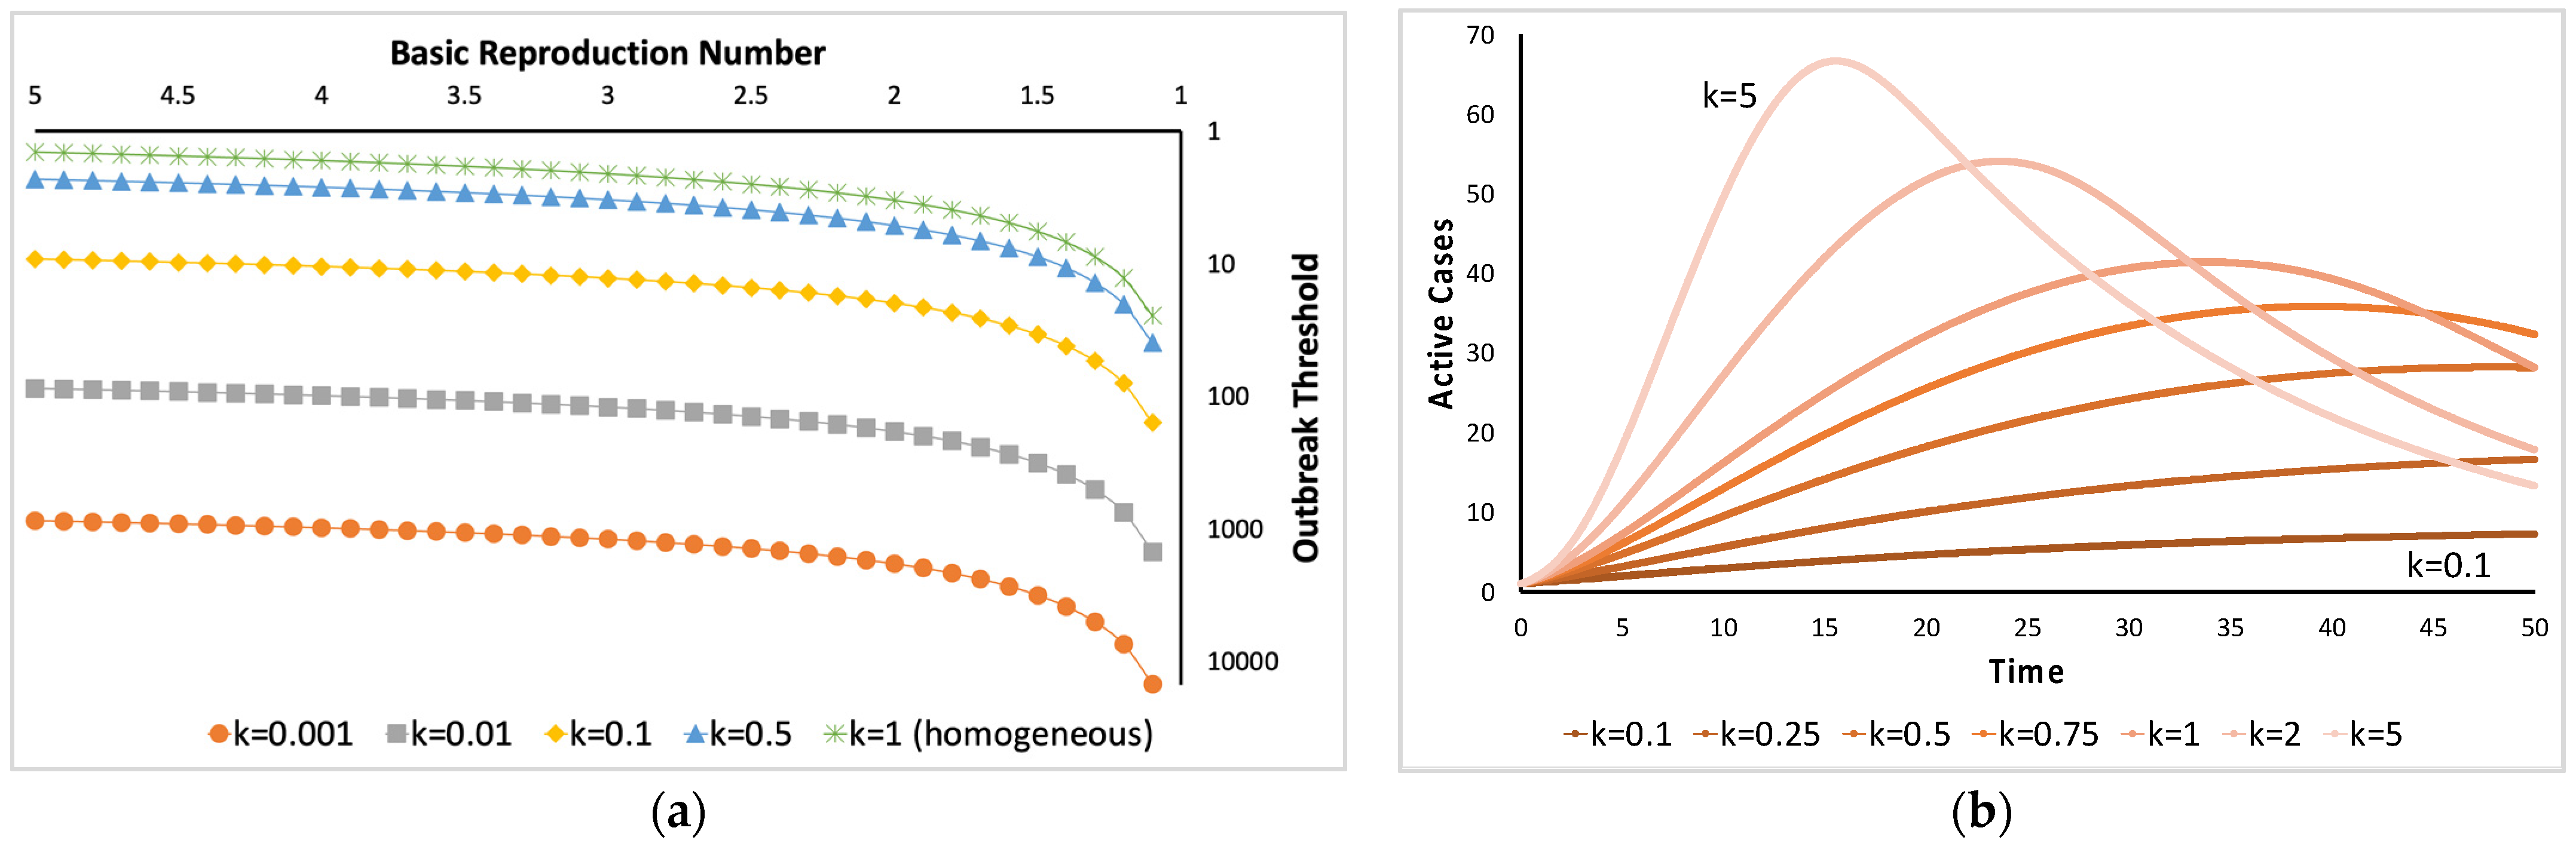
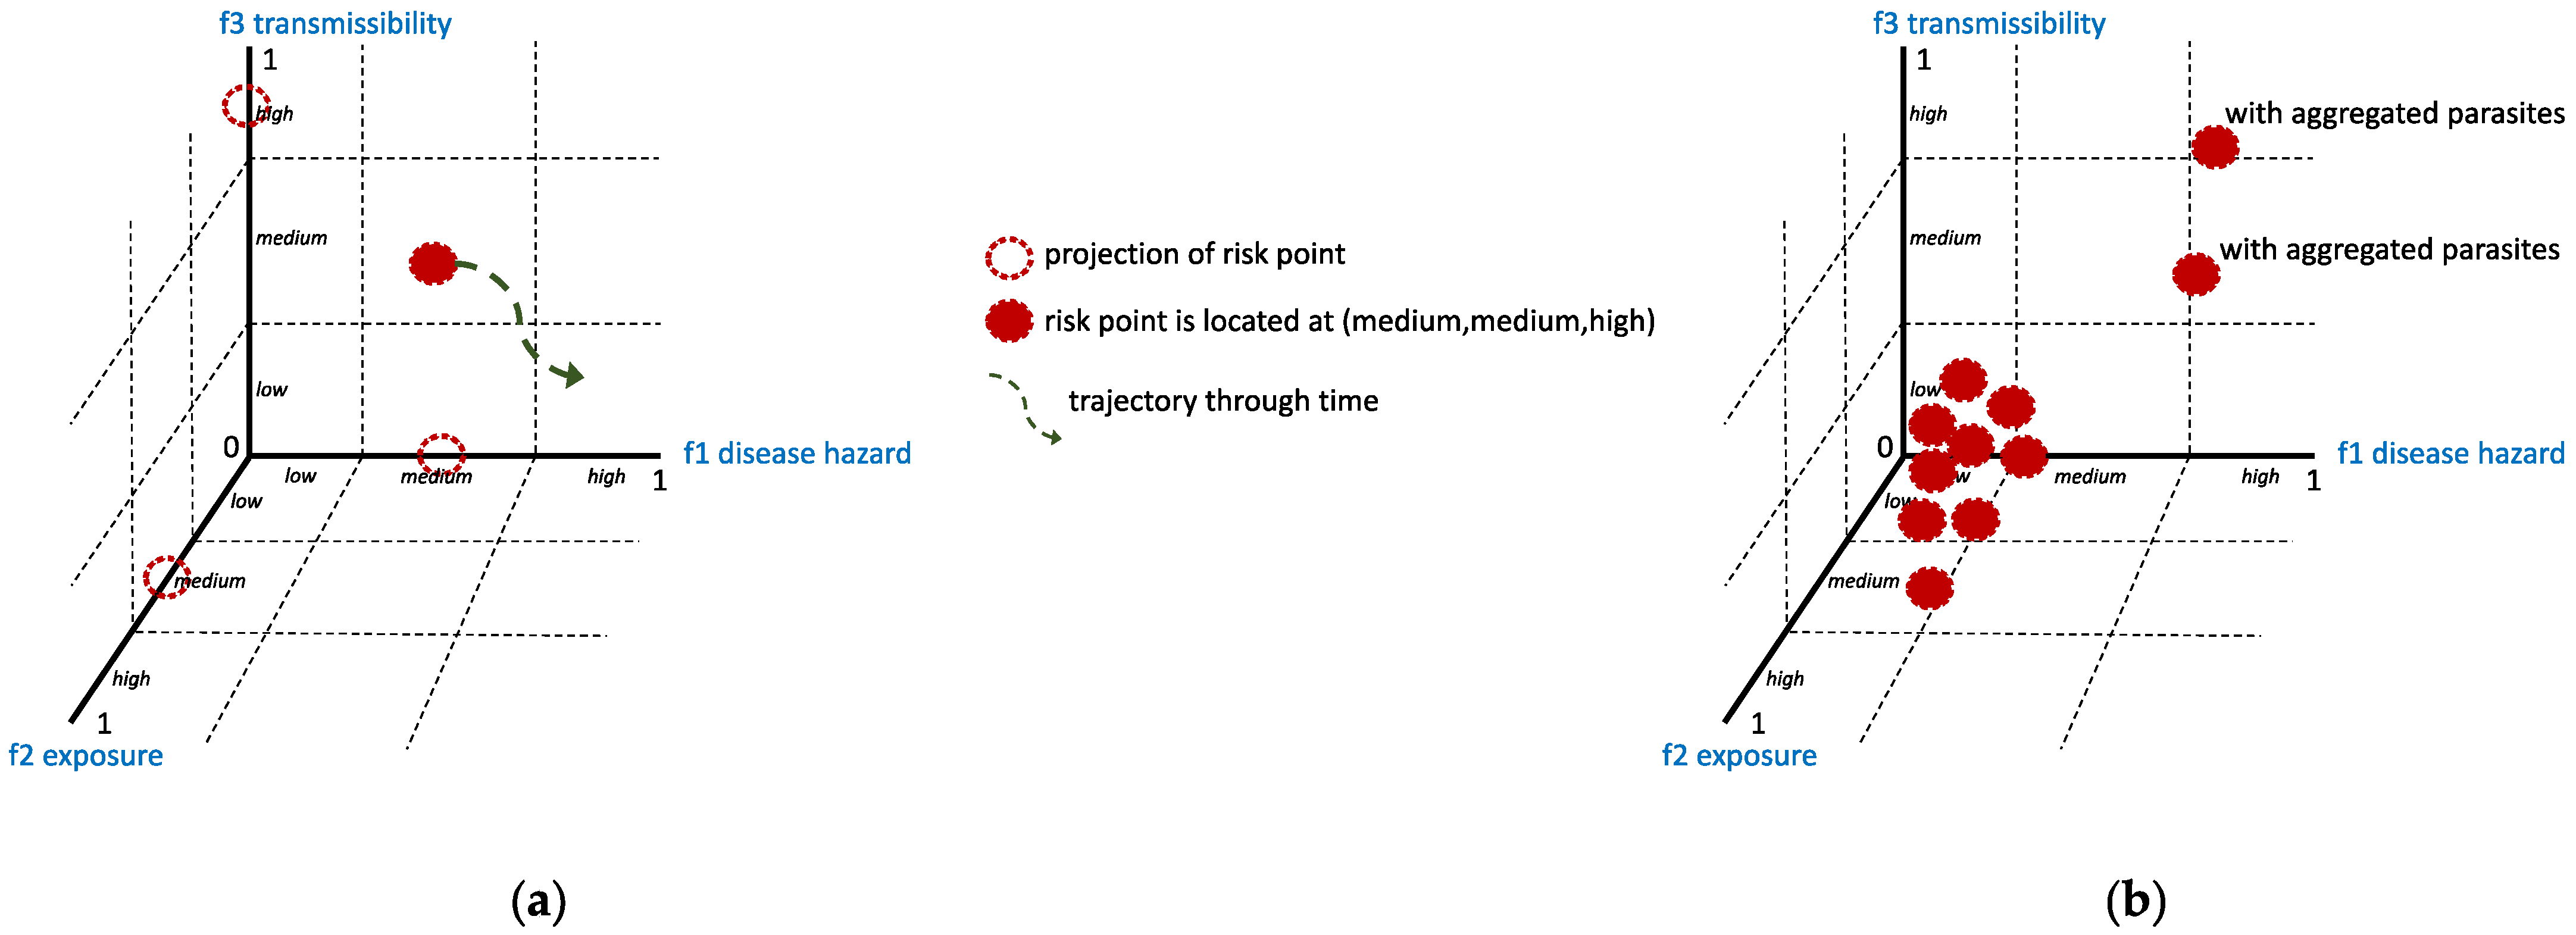
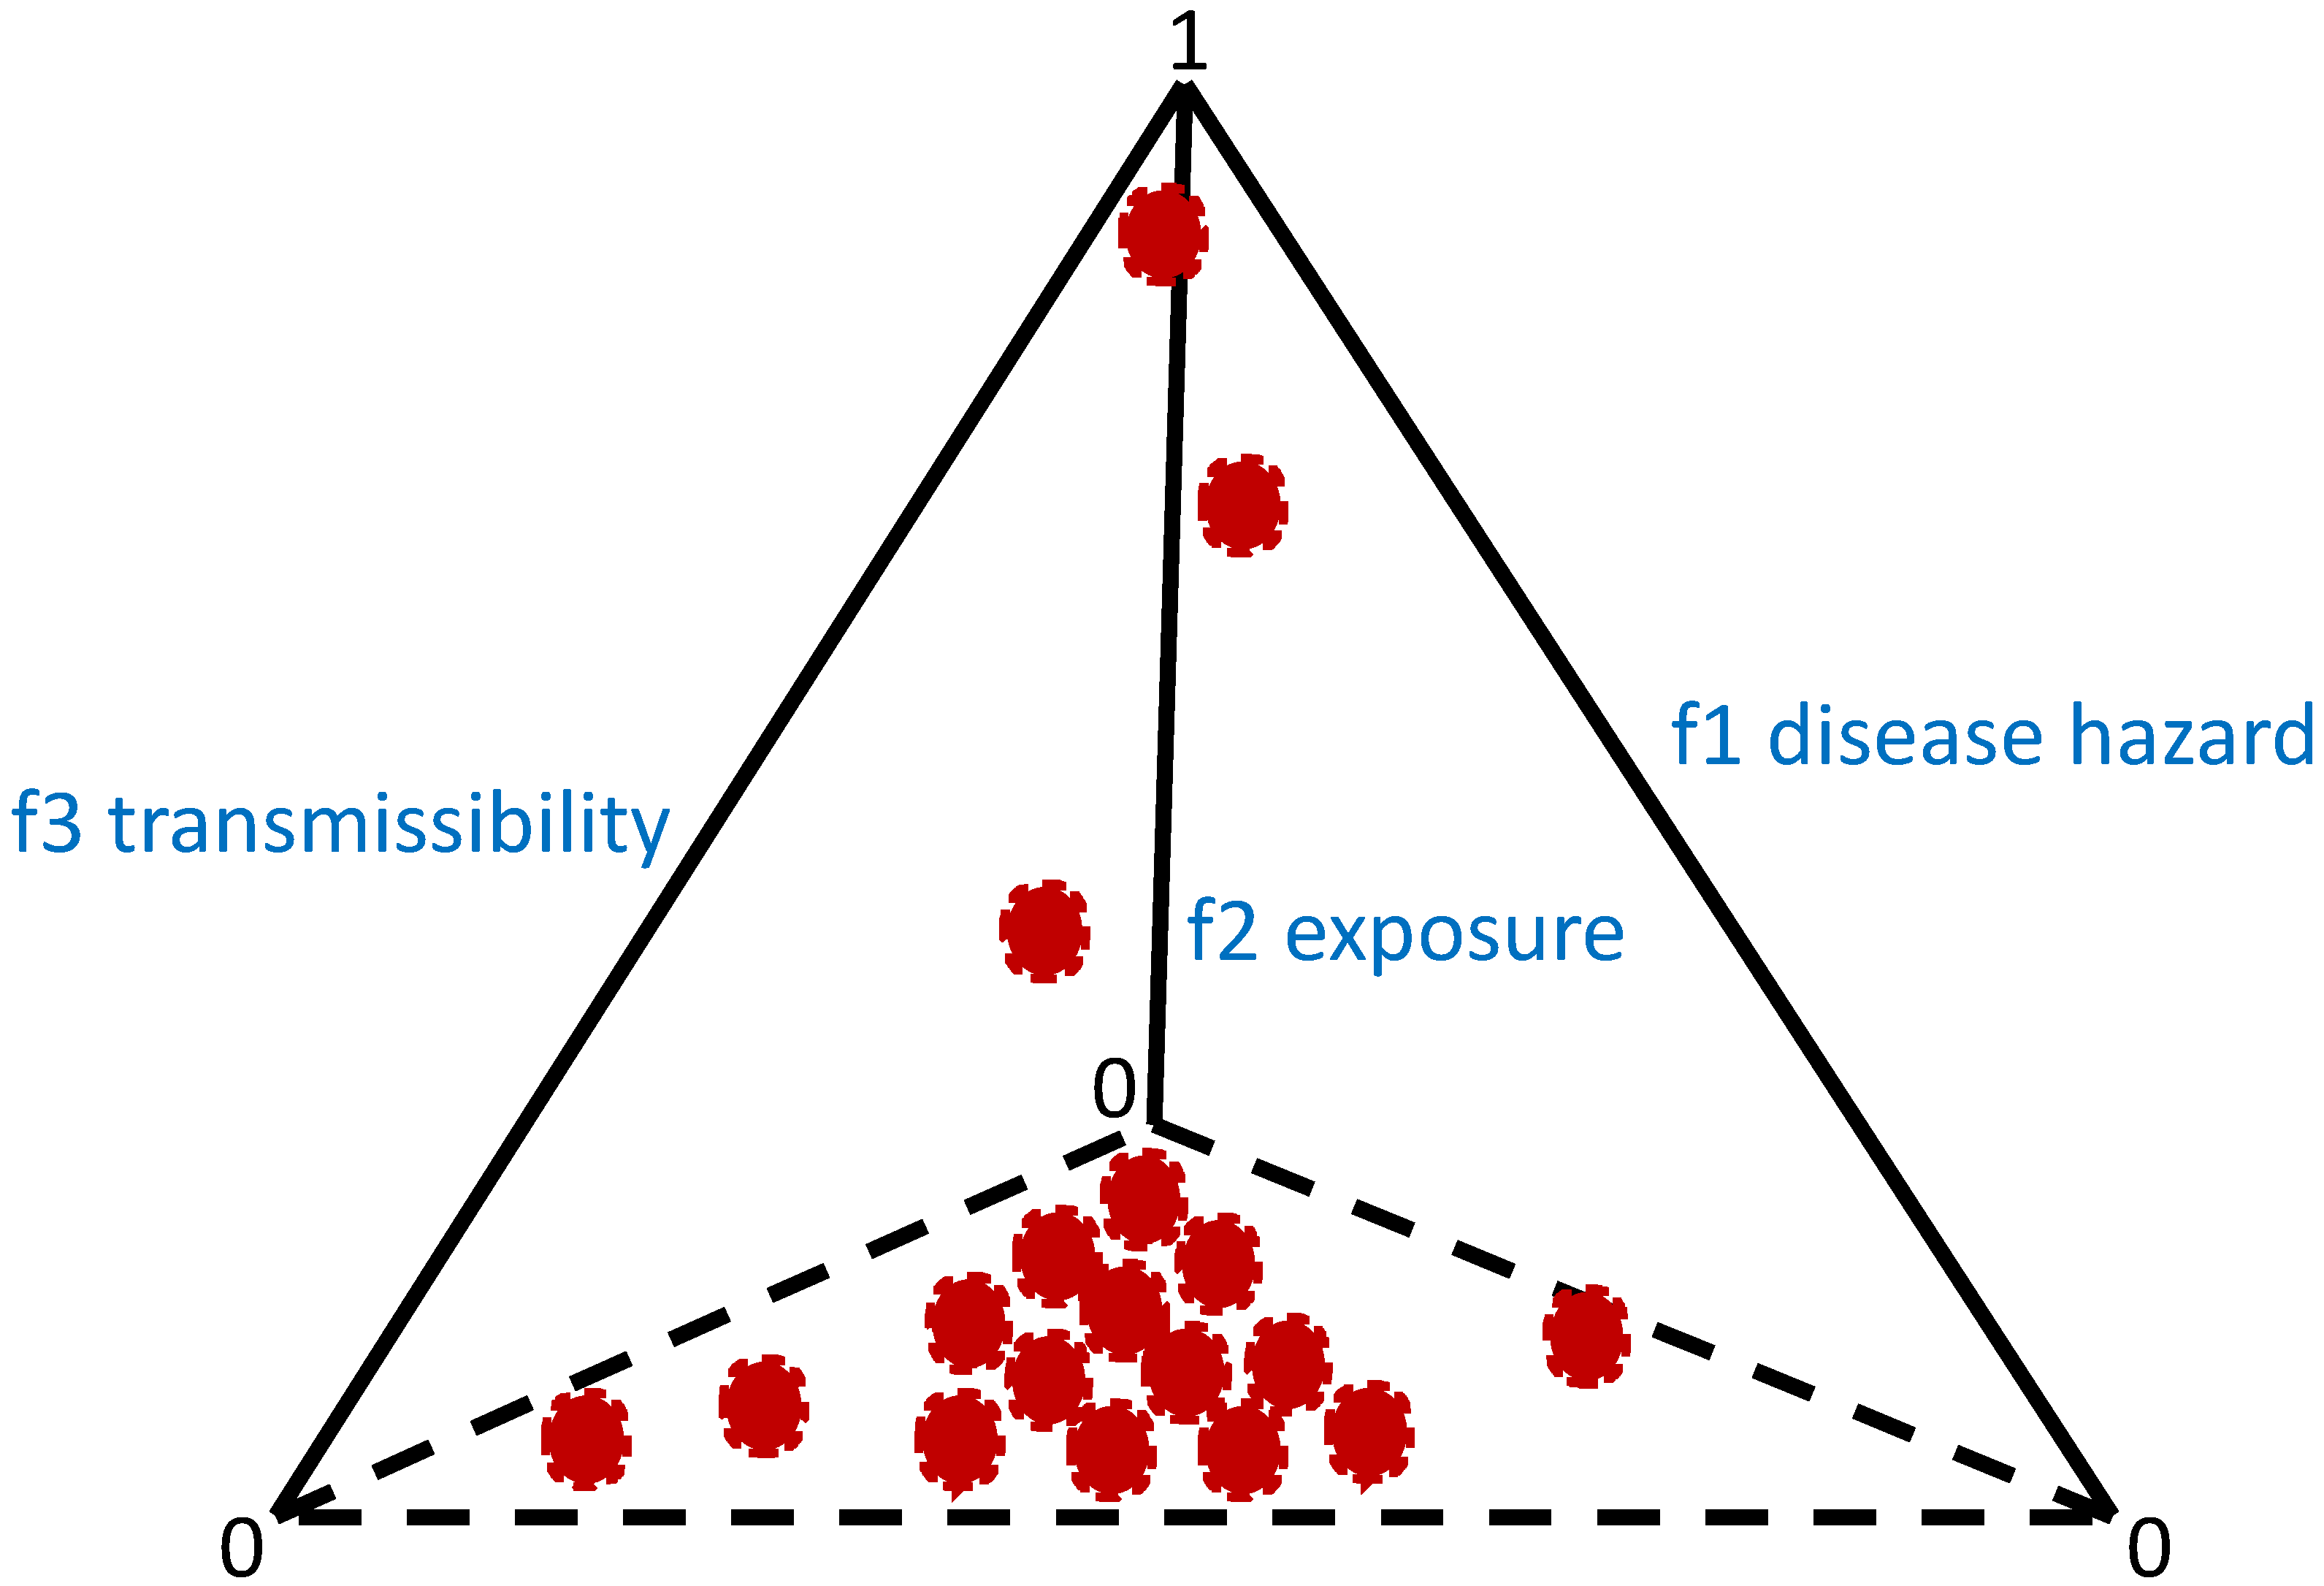
- Variance-to-mean ratio, where if this ratio is approximately equal to 1, then a Poisson (random) distribution could characterize the distribution of parasites in the host population. If it is greater than 1, then parasite aggregation may occur. Smaller values (<1) may represent a distribution following the binomial distribution; if the value is near zero, the parasite distribution could be uniformly or evenly distributed. The variance-to-mean ratio is related to the index of dispersion (), which can be described by the following [6,23]:where is the mean, and is the variance of the distribution of parasites in the host population. The parameter is the number of sampled hosts.
- Negative binomial parameter , which can be described as
- Here, and are fitted against the collected data. The distribution of the parasites in the host population could be uniform if is zero, random if is approximately equal to 1, and aggregated if is significantly greater than 1.
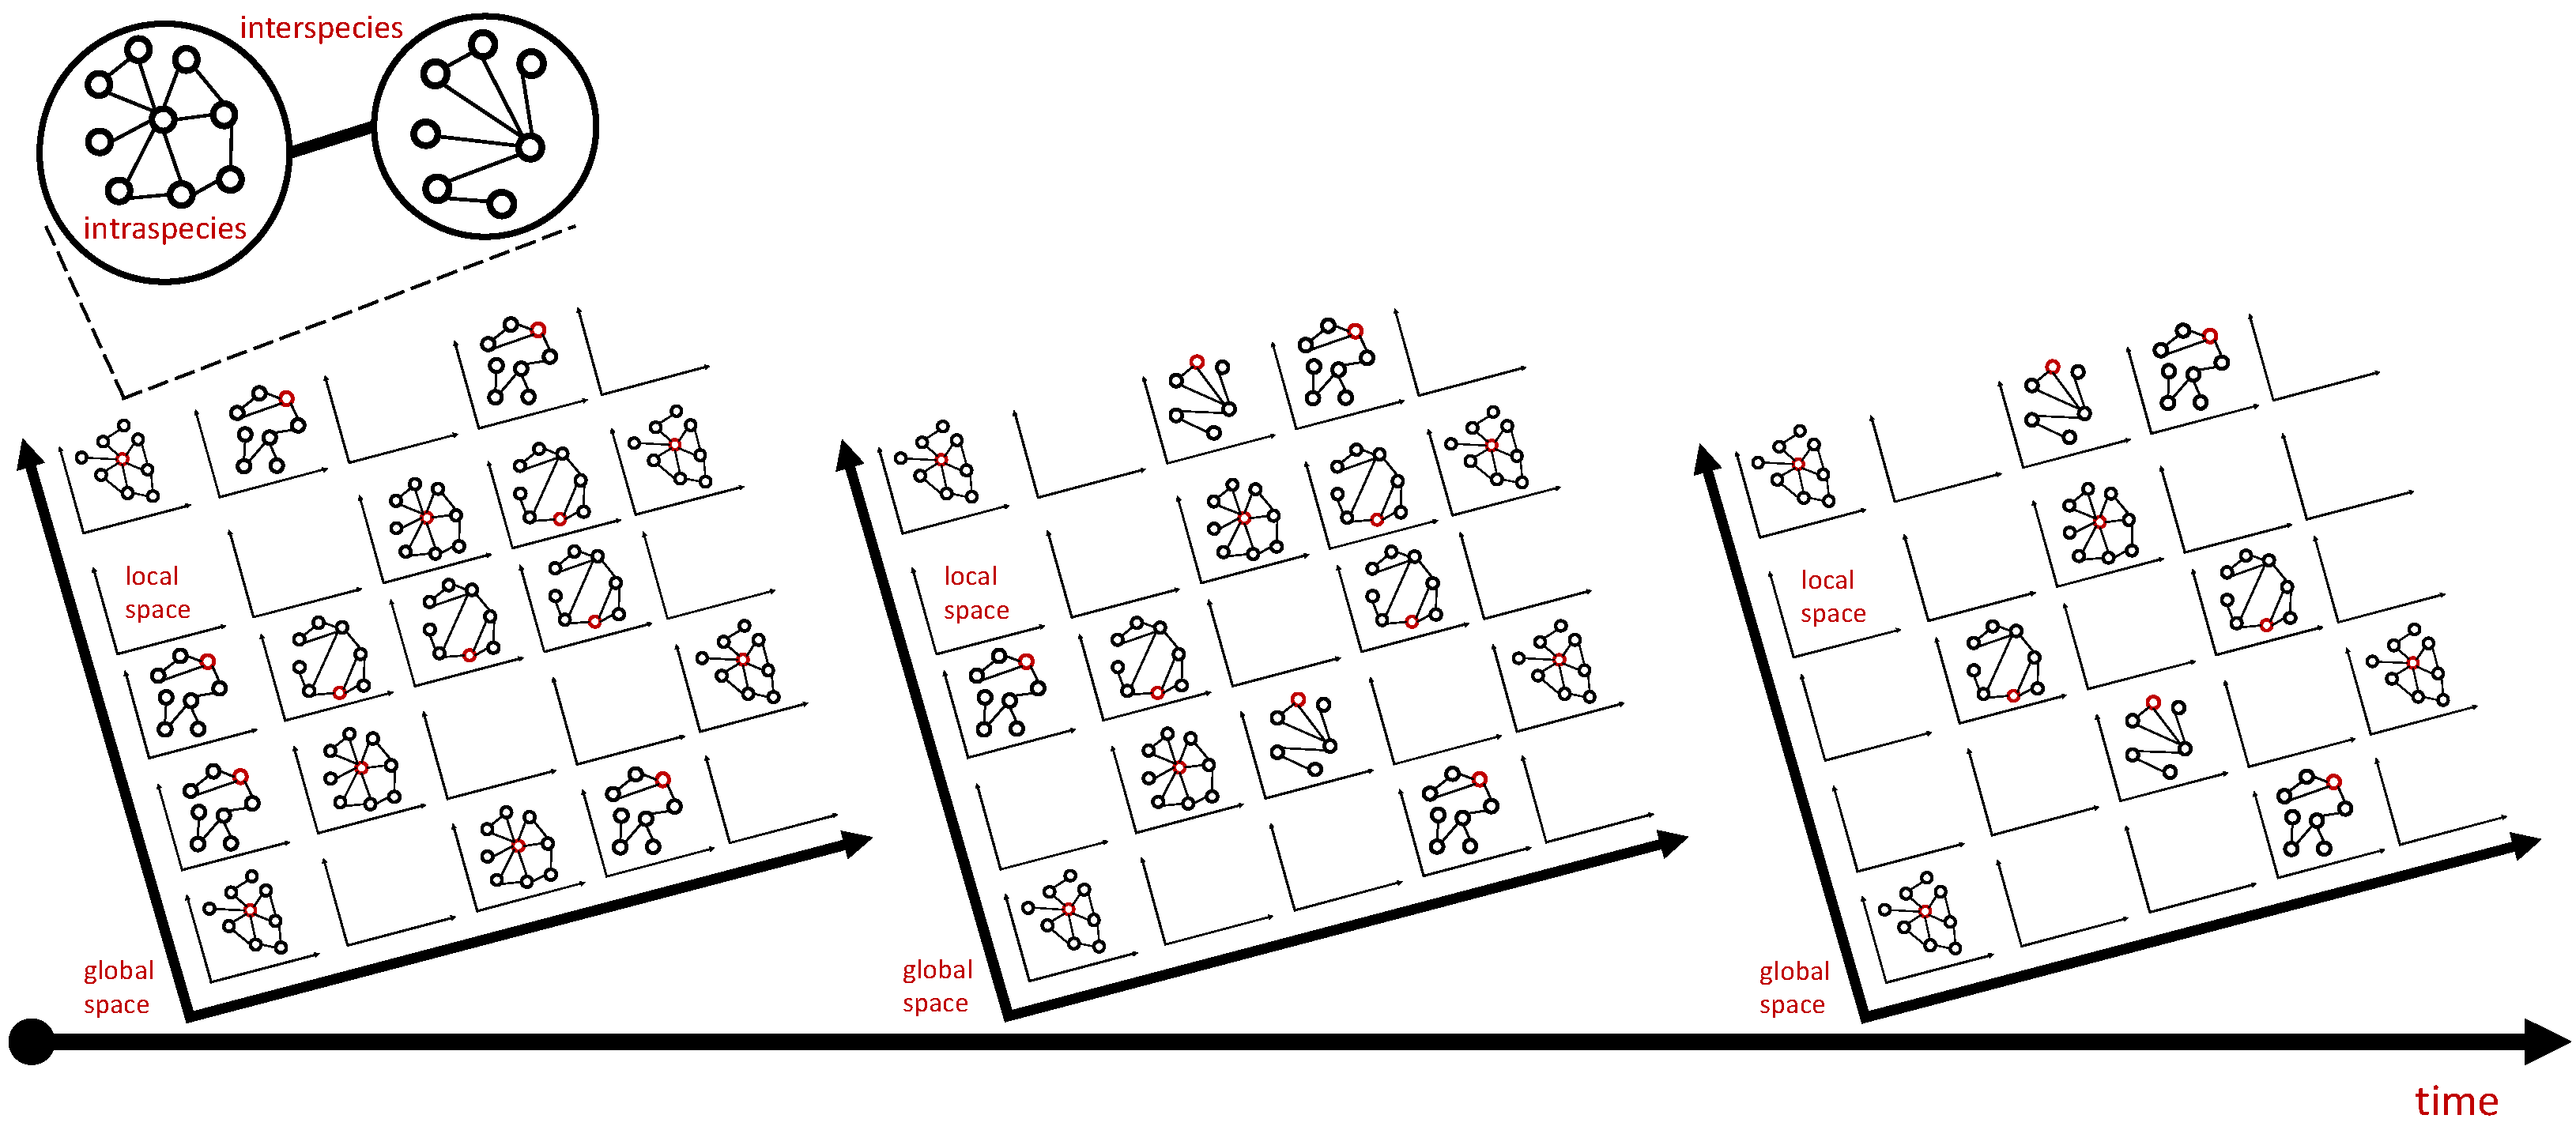
3. Method
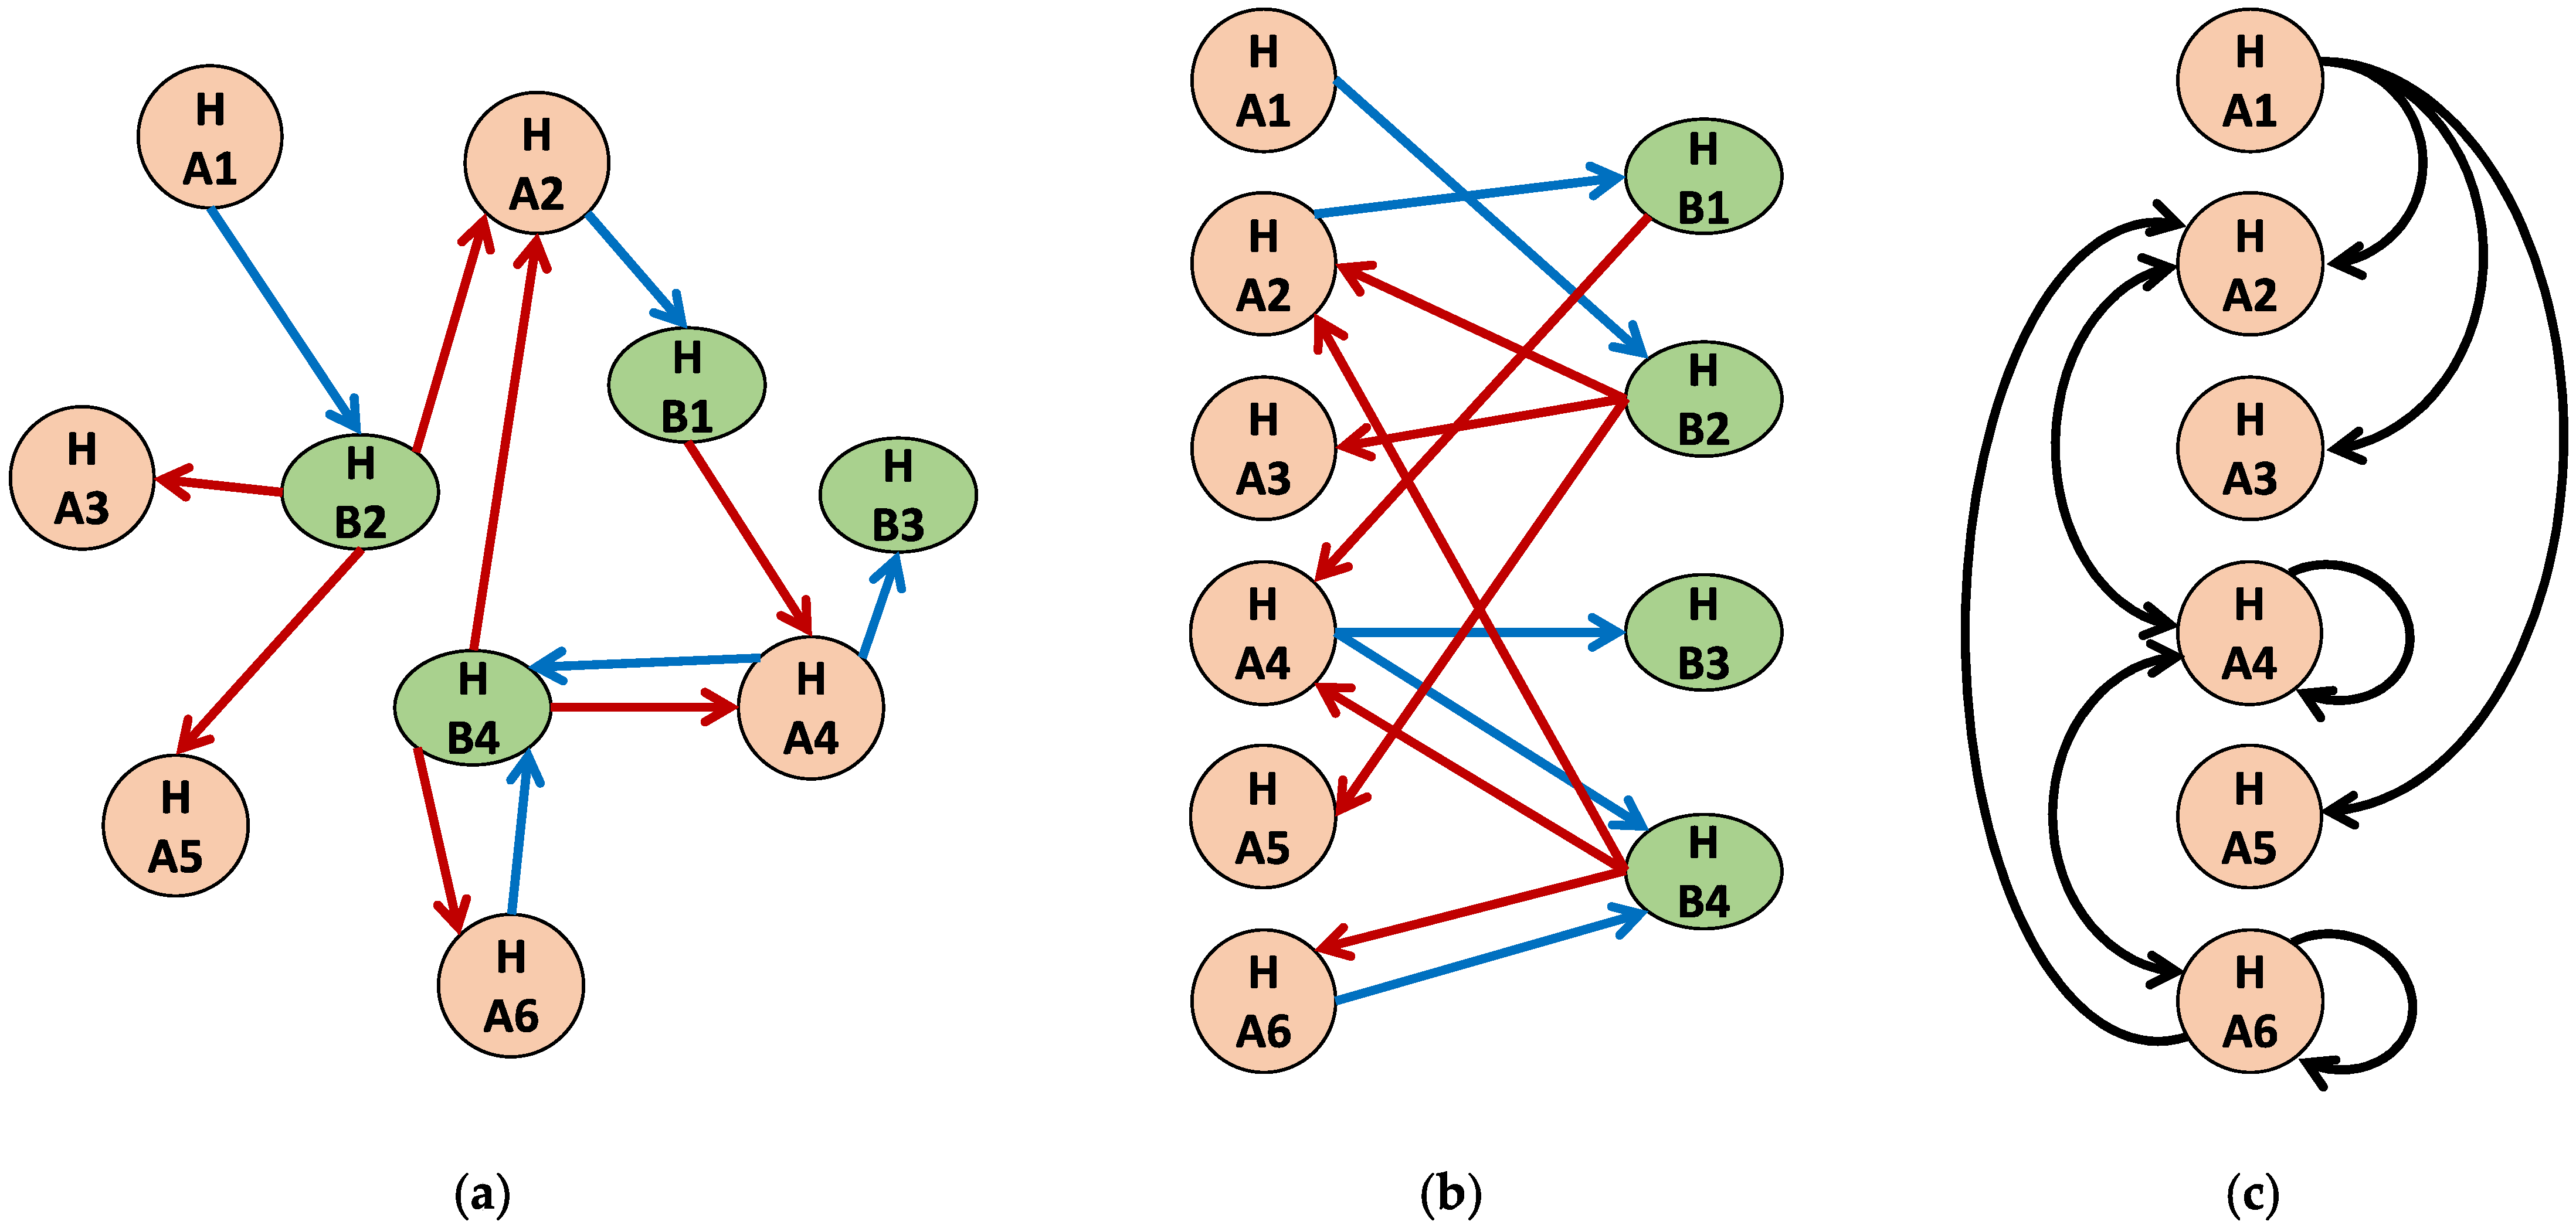
- What is the degree distribution of the contact or interaction network (e.g., from contact tracing)?
- What are characteristics of the hosts (e.g., age, sex, body size, and foraging behavior)?
- What are the characteristics of the parasites (e.g., age, body size, and complex life cycle)?
- What are the characteristics of the environment (e.g., microlocality, mixing dynamics, temperature, and food distribution)?
- What are the characteristics of the host–parasite interaction (e.g., preferential attachment and host immunity)?
- What is the spatiotemporal parasite load of sampled hosts?
4. Conclusions
Author Contributions
Funding
Institutional Review Board Statement
Informed Consent Statement
Data Availability Statement
Acknowledgments
Conflicts of Interest
References
- Sayama, H. Introduction to the Modeling and Analysis of Complex Systems; Open SUNY: Binghamton, NY, USA, 2015; ISBN 978-1-942341-06-2. [Google Scholar]
- Kong, L.; Wang, J.; Han, W.; Cao, Z. Modeling Heterogeneity in Direct Infectious Disease Transmission in a Compartmental Model. IJERPH 2016, 13, 253. [Google Scholar] [CrossRef] [PubMed]
- Rabajante, J.F.; Anzia, E.L.; Gokhale, C.S. On the Mechanistic Roots of an Ecological Law: Parasite Aggregation. bioRxiv 2020, 680041. [Google Scholar] [CrossRef]
- Buhat, C.A.H.; Rabajante, J.F.; Paller, V.G.V. Spatiotemporal Modeling of Parasite Aggregation among Fish Hosts in a Lentic Ecosystem. Model. Earth Syst. Environ. 2021, 7, 2179–2195. [Google Scholar] [CrossRef]
- Lau, M.S.Y.; Grenfell, B.; Thomas, M.; Bryan, M.; Nelson, K.; Lopman, B. Characterizing Superspreading Events and Age-Specific Infectiousness of SARS-CoV-2 Transmission in Georgia, USA. Proc. Natl. Acad. Sci. USA 2020, 117, 22430–22435. [Google Scholar] [CrossRef] [PubMed]
- Wilson, K.; Bjornstad, O.N.; Dobson, A.P.; Merler, S.; Poglayen, G.; Randolph, S.E.; Read, A.F.; Skorping, A. Heterogeneities in Macroparasite Infections: Patterns and Processes. In The Ecology of Wildlife Diseases; Hudson, P.J., Ed.; Oxford University Press: New York, NY, USA, 2002; pp. 6–44. ISBN 978-0-19-850620-1. [Google Scholar]
- Morrill, A.; Dargent, F.; Forbes, M.R. Explaining Parasite Aggregation: More than One Parasite Species at a Time. Int. J. Parasitol. 2017, 47, 185–188. [Google Scholar] [CrossRef] [PubMed]
- Poulin, R. Are There General Laws in Parasite Ecology? Parasitology 2007, 134, 763. [Google Scholar] [CrossRef]
- Virta, M.; Huitu, O.; Heikkinen, J.; Holmala, K.; Jokelainen, P. High Toxocara Cati Prevalence in Wild, Free-Ranging Eurasian Lynx (Lynx Lynx) in Finland, 1999–2015. Int. J. Parasitol. Parasites Wildl. 2022, 17, 205–210. [Google Scholar] [CrossRef]
- Poulin, R. Evolutionary Ecology of Parasites, 2nd ed.; Princeton University Press: Princeton, NJ, USA, 2007; ISBN 978-1-4008-4080-9. [Google Scholar]
- Von Zuben, C.J. Implicações Da Agregação Espacial de Parasitas Para a Dinâmica Populacional Na Interação Hospedeiro-Parasita. Rev. Saúde Pública 1997, 31, 523–530. [Google Scholar] [CrossRef]
- Blower, S.M.; Roughgarden, J. Parasites Detect Host Spatial Pattern and Density: A Field Experimental Analysis. Oecologia 1989, 78, 138–141. [Google Scholar] [CrossRef]
- Gurarie, D.; King, C.H.; Yoon, N.; Li, E. Refined Stratified-Worm-Burden Models That Incorporate Specific Biological Features of Human and Snail Hosts Provide Better Estimates of Schistosoma Diagnosis, Transmission, and Control. Parasites Vectors 2016, 9, 428. [Google Scholar] [CrossRef]
- Morrill, A.; Nielsen, Ó.K.; Skírnisson, K.; Forbes, M.R. Identifying Sources of Variation in Parasite Aggregation. PeerJ 2022, 10, e13763. [Google Scholar] [CrossRef] [PubMed]
- McVinish, R.; Lester, R.J.G. Measuring Aggregation in Parasite Populations. J. R. Soc. Interface. 2020, 17, 20190886. [Google Scholar] [CrossRef] [PubMed]
- Hollingsworth, T.D.; Pulliam, J.R.C.; Funk, S.; Truscott, J.E.; Isham, V.; Lloyd, A.L. Seven Challenges for Modelling Indirect Transmission: Vector-Borne Diseases, Macroparasites and Neglected Tropical Diseases. Epidemics 2015, 10, 16–20. [Google Scholar] [CrossRef] [PubMed]
- Johnson, P.T.J.; Wilber, M.Q. Biological and Statistical Processes Jointly Drive Population Aggregation: Using Host–Parasite Interactions to Understand Taylor’s Power Law. Proc. R. Soc. B. 2017, 284, 20171388. [Google Scholar] [CrossRef]
- Cuesta-Astroz, Y.; Santos, A.; Oliveira, G.; Jensen, L.J. Analysis of Predicted Host–Parasite Interactomes Reveals Commonalities and Specificities Related to Parasitic Lifestyle and Tissues Tropism. Front. Immunol. 2019, 10, 212. [Google Scholar] [CrossRef]
- Greenwood, J.M.; Ezquerra, A.L.; Behrens, S.; Branca, A.; Mallet, L. Current Analysis of Host–Parasite Interactions with a Focus on next Generation Sequencing Data. Zoology 2016, 119, 298–306. [Google Scholar] [CrossRef]
- Gurarie, D.; King, C.H.; Wang, X. A New Approach to Modelling Schistosomiasis Transmission Based on Stratified Worm Burden. Parasitology 2010, 137, 1951–1965. [Google Scholar] [CrossRef]
- Basáñez, M.-G.; McCarthy, J.S.; French, M.D.; Yang, G.-J.; Walker, M.; Gambhir, M.; Prichard, R.K.; Churcher, T.S. A Research Agenda for Helminth Diseases of Humans: Modelling for Control and Elimination. PLoS Negl. Trop. Dis. 2012, 6, e1548. [Google Scholar] [CrossRef]
- Barabasi, A.-L. Network Science; Cambridge University Press: Cambridge, UK, 2016; ISBN 978-1-107-07626-6. [Google Scholar]
- Poulin, R. The Disparity between Observed and Uniform Distributions: A New Look at Parasite Aggregation. Int. J. Parasitol. 1993, 23, 937–944. [Google Scholar] [CrossRef] [PubMed]
- Kretzschmar, M.E.; Ashby, B.; Fearon, E.; Overton, C.E.; Panovska-Griffiths, J.; Pellis, L.; Quaife, M.; Rozhnova, G.; Scarabel, F.; Stage, H.B.; et al. Challenges for Modelling Interventions for Future Pandemics. Epidemics 2022, 38, 100546. [Google Scholar] [CrossRef]
- Prem, K.; Cook, A.R.; Jit, M. Projecting Social Contact Matrices in 152 Countries Using Contact Surveys and Demographic Data. PLoS Comput. Biol. 2017, 13, e1005697. [Google Scholar] [CrossRef] [PubMed]
- Dy, L.F.; Rabajante, J.F. A COVID-19 Infection Risk Model for Frontline Health Care Workers. Netw. Model Anal. Health Inf. Bioinforma 2020, 9, 57. [Google Scholar] [CrossRef]
- Gourbière, S.; Morand, S.; Waxman, D. Fundamental Factors Determining the Nature of Parasite Aggregation in Hosts. PLoS ONE 2015, 10, e0116893. [Google Scholar] [CrossRef] [PubMed]
- Morrill, A.; Forbes, M.R. Aggregation of Infective Stages of Parasites as an Adaptation and Its Implications for the Study of Parasite-Host Interactions. Am. Nat. 2016, 187, 225–235. [Google Scholar] [CrossRef] [PubMed]
- Basáñez, M.-G.; Ricárdez-Esquinca, J. Models for the Population Biology and Control of Human Onchocerciasis. Trends Parasitol. 2001, 17, 430–438. [Google Scholar] [CrossRef] [PubMed]
- Hardwick, R.J.; Vegvari, C.; Collyer, B.; Truscott, J.E.; Anderson, R.M. Spatial Scales in Human Movement between Reservoirs of Infection. J. Theor. Biol. 2021, 524, 110726. [Google Scholar] [CrossRef]
- Yakob, L.; Soares Magalhães, R.J.; Gray, D.J.; Milinovich, G.; Wardrop, N.; Dunning, R.; Barendregt, J.; Bieri, F.; Williams, G.M.; Clements, A.C.A. Modelling Parasite Aggregation: Disentangling Statistical and Ecological Approaches. Int. J. Parasitol. 2014, 44, 339–342. [Google Scholar] [CrossRef]
- Martin, J.; Hall, D.B. Marginal Zero-Inflated Regression Models for Count Data. J. Appl. Stat. 2017, 44, 1807–1826. [Google Scholar] [CrossRef]
- Huber-Carol, C.; Balakrishnan, N.; Nikulin, M.S.; Mesbah, M. (Eds.) Goodness-of-Fit Tests and Model Validity; Birkhäuser Boston: Boston, MA, USA, 2002; ISBN 978-1-4612-6613-6. [Google Scholar]
- Luz, P.M.; Struchiner, C.J.; Galvani, A.P. Modeling Transmission Dynamics and Control of Vector-Borne Neglected Tropical Diseases. PLoS Negl. Trop. Dis. 2010, 4, e761. [Google Scholar] [CrossRef]
- Hartfield, M.; Alizon, S. Introducing the Outbreak Threshold in Epidemiology. PLoS Pathog. 2013, 9, e1003277. [Google Scholar] [CrossRef]
- Duerr, H.P.; Dietz, K.; Eichner, M. On the Interpretation of Age–Intensity Profiles and Dispersion Patterns in Parasitological Surveys. Parasitology 2003, 126, 87–101. [Google Scholar] [CrossRef] [PubMed]
- Irvine, M.A.; Reimer, L.J.; Njenga, S.M.; Gunawardena, S.; Kelly-Hope, L.; Bockarie, M.; Hollingsworth, T.D. Modelling Strategies to Break Transmission of Lymphatic Filariasis-Aggregation, Adherence and Vector Competence Greatly Alter Elimination. Parasites Vectors 2015, 8, 547. [Google Scholar] [CrossRef] [PubMed]
- Buhat, C.A.H.; Lutero, D.S.M.; Olave, Y.H.; Quindala, K.M.; Recreo, M.G.P.; Talabis, D.A.S.J.; Torres, M.C.; Tubay, J.M.; Rabajante, J.F. Using Constrained Optimization for the Allocation of COVID-19 Vaccines in the Philippines. Appl. Health Econ. Health Policy 2021, 19, 699–708. [Google Scholar] [CrossRef] [PubMed]
- Thompson, R.N.; Stockwin, J.E.; van Gaalen, R.D.; Polonsky, J.A.; Kamvar, Z.N.; Demarsh, P.A.; Dahlqwist, E.; Li, S.; Miguel, E.; Jombart, T.; et al. Improved Inference of Time-Varying Reproduction Numbers during Infectious Disease Outbreaks. Epidemics 2019, 29, 100356. [Google Scholar] [CrossRef] [PubMed]
- Zhao, S.; Shen, M.; Musa, S.S.; Guo, Z.; Ran, J.; Peng, Z.; Zhao, Y.; Chong, M.K.C.; He, D.; Wang, M.H. Inferencing Superspreading Potential Using Zero-Truncated Negative Binomial Model: Exemplification with COVID-19. BMC Med. Res. Methodol. 2021, 21, 30. [Google Scholar] [CrossRef] [PubMed]
- Miller, J.C. A Note on the Derivation of Epidemic Final Sizes. Bull. Math. Biol. 2012, 74, 2125–2141. [Google Scholar] [CrossRef]
- Morrill, A.; Forbes, M.R. Random Parasite Encounters Coupled with Condition-Linked Immunity of Hosts Generate Parasite Aggregation. Int. J. Parasitol. 2012, 42, 701–706. [Google Scholar] [CrossRef]


| Term | Definition |
|---|---|
| Aggregation | Clustering of parasites in few hosts, while many other hosts have few or none. |
| Complexity | A characteristic of systems with many dynamic and interacting components. The interaction among the components usually results in an emergent behavior. The interaction among components can be modeled using networks. |
| Heterogeneity | Presence of variability in the system. Variance is not zero. |
| Overdispersion | Variance is greater than the mean. Usually, an overdispersed distribution is often characterized by the negative binomial or by the power law. |
Disclaimer/Publisher’s Note: The statements, opinions and data contained in all publications are solely those of the individual author(s) and contributor(s) and not of MDPI and/or the editor(s). MDPI and/or the editor(s) disclaim responsibility for any injury to people or property resulting from any ideas, methods, instructions or products referred to in the content. |
© 2022 by the author. Licensee MDPI, Basel, Switzerland. This article is an open access article distributed under the terms and conditions of the Creative Commons Attribution (CC BY) license (https://creativecommons.org/licenses/by/4.0/).
Share and Cite
Rabajante, J.F. On Spatiotemporal Overdispersion and Macroparasite Accumulation in Hosts Leading to Aggregation: A Quantitative Framework. Diseases 2023, 11, 4. https://doi.org/10.3390/diseases11010004
Rabajante JF. On Spatiotemporal Overdispersion and Macroparasite Accumulation in Hosts Leading to Aggregation: A Quantitative Framework. Diseases. 2023; 11(1):4. https://doi.org/10.3390/diseases11010004
Chicago/Turabian StyleRabajante, Jomar Fajardo. 2023. "On Spatiotemporal Overdispersion and Macroparasite Accumulation in Hosts Leading to Aggregation: A Quantitative Framework" Diseases 11, no. 1: 4. https://doi.org/10.3390/diseases11010004
APA StyleRabajante, J. F. (2023). On Spatiotemporal Overdispersion and Macroparasite Accumulation in Hosts Leading to Aggregation: A Quantitative Framework. Diseases, 11(1), 4. https://doi.org/10.3390/diseases11010004