Article

Efficient and Versatile Modeling of Mono- and Multi-Layer MoS2 Field Effect Transistor

1
Departement of Information Engineering, Marche Polytechnic University, 60131 Ancona, Italy
2
Department of Materials, Environmental Sciences and Urban Planning, Marche Polytechnic University, 60131 Ancona, Italy
*
Author to whom correspondence should be addressed.
Electronics 2020, 9(9), 1385; https://doi.org/10.3390/electronics9091385
Submission received: 1 August 2020 / Revised: 17 August 2020 / Accepted: 24 August 2020 / Published: 27 August 2020
(This article belongs to the Section Semiconductor Devices)

Abstract

:
Two-dimensional (2D) materials with intrinsic atomic-level thicknesses are strong candidates for the development of deeply scaled field-effect transistors (FETs) and novel device architectures. In particular, transition-metal dichalcogenides (TMDCs), of which molybdenum disulfide (MoS 2 ) is the most widely studied, are especially attractive because of their non-zero bandgap, mechanical flexibility, and optical transparency. In this contribution, we present an efficient full-wave model of MoS 2 -FETs that is based on (1) defining the constitutive relations of the MoS 2 active channel, and (2) simulating the 3D geometry. The former is achieved by using atomistic simulations of the material crystal structure, the latter is obtained by using the solver COMSOL Multiphysics. We show examples of FET simulations and compare, when possible, the theoretical results to the experimental from the literature. The comparison highlights a very good agreement.

1. Introduction

Mono-layer transition metal dicalchogenides are chemical compounds in which molecules are formed by one transition metal atom (Mo, W, Pt, etc.) and two atoms belonging to group 16 of the periodic table of elements (S, O, Pt). During the last decade, an increasing interest on the use of MoS 2 has gradually emerged since this material exhibits several unprecedented properties, such as scalability [1], tunability [2], low noise figure [3], ambipolarity [3], non-zero bandgap, and, in the meantime, compatibility with the current complementary metal oxide semiconductor (CMOS) technology, as shown in literature [4]. MoS 2 suits for a large plethora of applications in the nano-electronics area [5], ranging from field-effect transistors (MoS 2 -FETs) and gas sensors [6,7], to photo-detectors [8] and solar cells [9].
MoS 2 -FETs have been broadly studied by the literature, providing important and promising experimental data showing how these devices behave ([10,11,12]). However, from a design point of view, it is equally important to establish numerical methods that can predict the electrical properties of MoS 2 based FETs. Cao et al. reported a model of FET specifically realized for monolayer TMDCs, considering interface traps, mobility degradation and inefficient doping effects [13]; in literature [14] it is possible to find a simulation study of a MoS 2 FET for analog circuits; Zhang et al. illustrated another approach to model MoS 2 FETs in [15], completed with a comparative study between CMOS FETs and MOS 2 -FETs. In 1992, Miller showed a FET modeled with a ferroelectric gate oxide, called ferroelectric-metal field-effect transistor (FEM-FET), by means of approximated methods [16], demonstrating how this device could be used as a non volatile memory unit.
In this work, we present an efficient and versatile model for the analysis and simulation of the FET, based on the following steps: (1) study of the material (MoS 2 ) at the atomistic level, (2) derivation of constitutive relations and (3) their insertion in the full-wave solver (COMSOL) for the simulation at the continuum (device) level. It is remarkable to note that the set (2) is a key-development, as it introduces the possibility of simulating defects and particular contacts with the substrate. In the following, we firstly provide the theoretical foundations of the FET model; then, we describe the computational platform for the ab-initio (atomistic) simulations. Subsequently, we perform COMSOL simulations, present and compare some results with respect to data from the literature. As a further issue, we consider the use of hafnium-zirconium oxide (Hf x Zr 1 x O 2 , x = 0.3 ) as a substrate ferroelectric material, which exhibits high tunability and compatibility with the CMOS technology [17,18]. The last part provides conclusions of our work.

2. Materials and Methods

2.1. Theoretical Background

The benchmark models have been realized using the semiconductor physics module provided by COMSOL Multiphysics. This module implements Poisson’s equation, which links the potential (V) to the charge density ( ρ ), according to expression (1):
· ( ϵ 0 ϵ r V ) = ρ
where ϵ 0 and ϵ r are the vacuum and relative permittivities, respectively.

2.1.1. Semiconductor Material Model Interface

The semiconductor material model interface is used to implement the equations for semiconducting materials derived from the semi-classical model. The charge present in the channel is computed by Equation (2):
ρ + = q ( p n + N d + N a )
where q = e , being e the elementary electron charge, p and n are the carrier concentration and N d + and N a are the donor and acceptor concentration, respectively, which correspond to the particle density in the ionized regions. Complete ionization is assumed.
Both electron ( J n ) and hole ( J p ) currents respect the conservation law according to Equation (3):
· J n = 0 · J p = 0
Carrier currents are then computed according Equation (4a,b):
J n = q n μ n E c + μ n k B T n + q n D n , t h ln T
J p = q p μ p E c μ p k B T p q p D p , t h ln T
where μ p and μ n are holes and electrons mobility respectively, D p , t h and D n , t h are the thermal diffusion coefficients for holes and electrons, T is the room temperature and k B is the Boltzman constant. Conduction band E c and valence band E v are calculated as follows:
E c = ( V + χ 0 )
E v = ( V + χ 0 + E g , 0 )
with χ 0 electron affinity and E g , 0 energy bandgap of the semiconductor material.

2.1.2. Metal Contacts (Ideal Ohmic and Ideal Schottky)

The potential in ohmic contacts is defined as:
V = V 0 + V e q
where V 0 is the applied potential and V e q is the Fermi level offset in terms of electric potential at a given temperature T.
The inputs for the Schottky contact interface are the metal work function and the effective Richardson constant [19] of the semiconducting material. The effective Richardson constant ( A * ) is given by:
A * = 4 π q k B 2 m * h 3
where m * is the effective mass for electrons/holes and h is the Planck constant. The Richardson constant is related to thermionic effects. The potential at in the Schottky contact is defined as:
V = V 0 + Φ B χ 0 V e q , a d j
where V 0 is the applied potential, Φ B is the metal work function and V e q , a d j has the same meaning of V e q in Equation (6).

2.1.3. Dielectric Materials and Intrinsic n-Type Behavior

Since insulators are considered dielectric materials, it is sufficient to apply a charge conservation condition according to Gauss’ law for the electric displacement ( D ) and electric field ( E ):
D = ϵ 0 ϵ r E
MoS 2 layers usually behave as n-type doped semiconductors [20,21], thus an analytic doping model has been defined to set doping type and concentration in the channel, with donor concentration N d = 10 18 cm 3 .

2.1.4. Trap-Assisted Recombination

The trap-assisted recombination interface includes an additional contribute to the carrier current. The trapping model used is the Shockley–Reed–Hall model. This interface implements the following equations:
· J n = q R n
· J p = q R p
with R n and R p electron and holes recombination rates. Recombination rates depend on the carrier lifetimes τ n and τ p [22].

2.1.5. Atomistic Simulations Platform

As outlined, we avail of a software platform for the (1) simulations at the atomistic level of the active material (be it MoS 2 or others), (2) the self-consistent derivation of constitutive relations and (3) their insertion in the full-wave solver as permittivity, permeability and/or conductivity. This permits, for example, the inclusions of lattice defects. In the present case (further and more complex cases will be investigated in future works), a single MoS 2 layer was built using the Macromodel MAESTRO suite [23]. Density Functional Theory (DFT) was used with an extended Perdew–Burke–Ernzerhof (PBE) functional combined with a Gaussian type orbital (GTO) basis set 6-311G* to optimize MoS 2 three-dimensional geometry and to extrapolate bandgap values. DFT results were used as a starting point for subsequent computational investigations. Four different models were created, with one, two, three, and four MoS 2 layers, using DFT optimization MoS 2 geometry. A simulation box of 2.24 nm × 2.24 nm × 1.4 nm was prepared for each system. Periodic boundary conditions (PBC) were then set up on simulation boxes along x and y axes, but not on z axes, to avoid the possibility of considering more than four MoS 2 layers (Figure 1). The four systems were minimized using steepest descent and conjugate gradient algorithms, then an initial 200 ps NVT-ensemble of molecular dynamics (MD) simulation was used for the equilibration, following an NPT-ensemble of MD simulation 10 ns long at 298 K and 1 atm pressure. All MD simulations were performed using the GROMACS 5.1.5 suite [24]. PBC and Ewald summation were used to consider the long range electrostatic interatomic interactions.
The CLAYFF force field interatomic potentials [25] was used to describe the MoS 2 layers along MD simulation after a previous enrichment with new MoS 2 parameters determined at the DFT level. Visual molecular dynamics (VMD) [26] and Chimera [27] software were used for trajectory visualization and analyses, while Xmgrace (Grace 5.1.21 GNU public license, Cambridge, MA, USA) was used for generating plots.

2.2. Model Validation

2.2.1. MoS 2 FET with n+ Si Back Gate

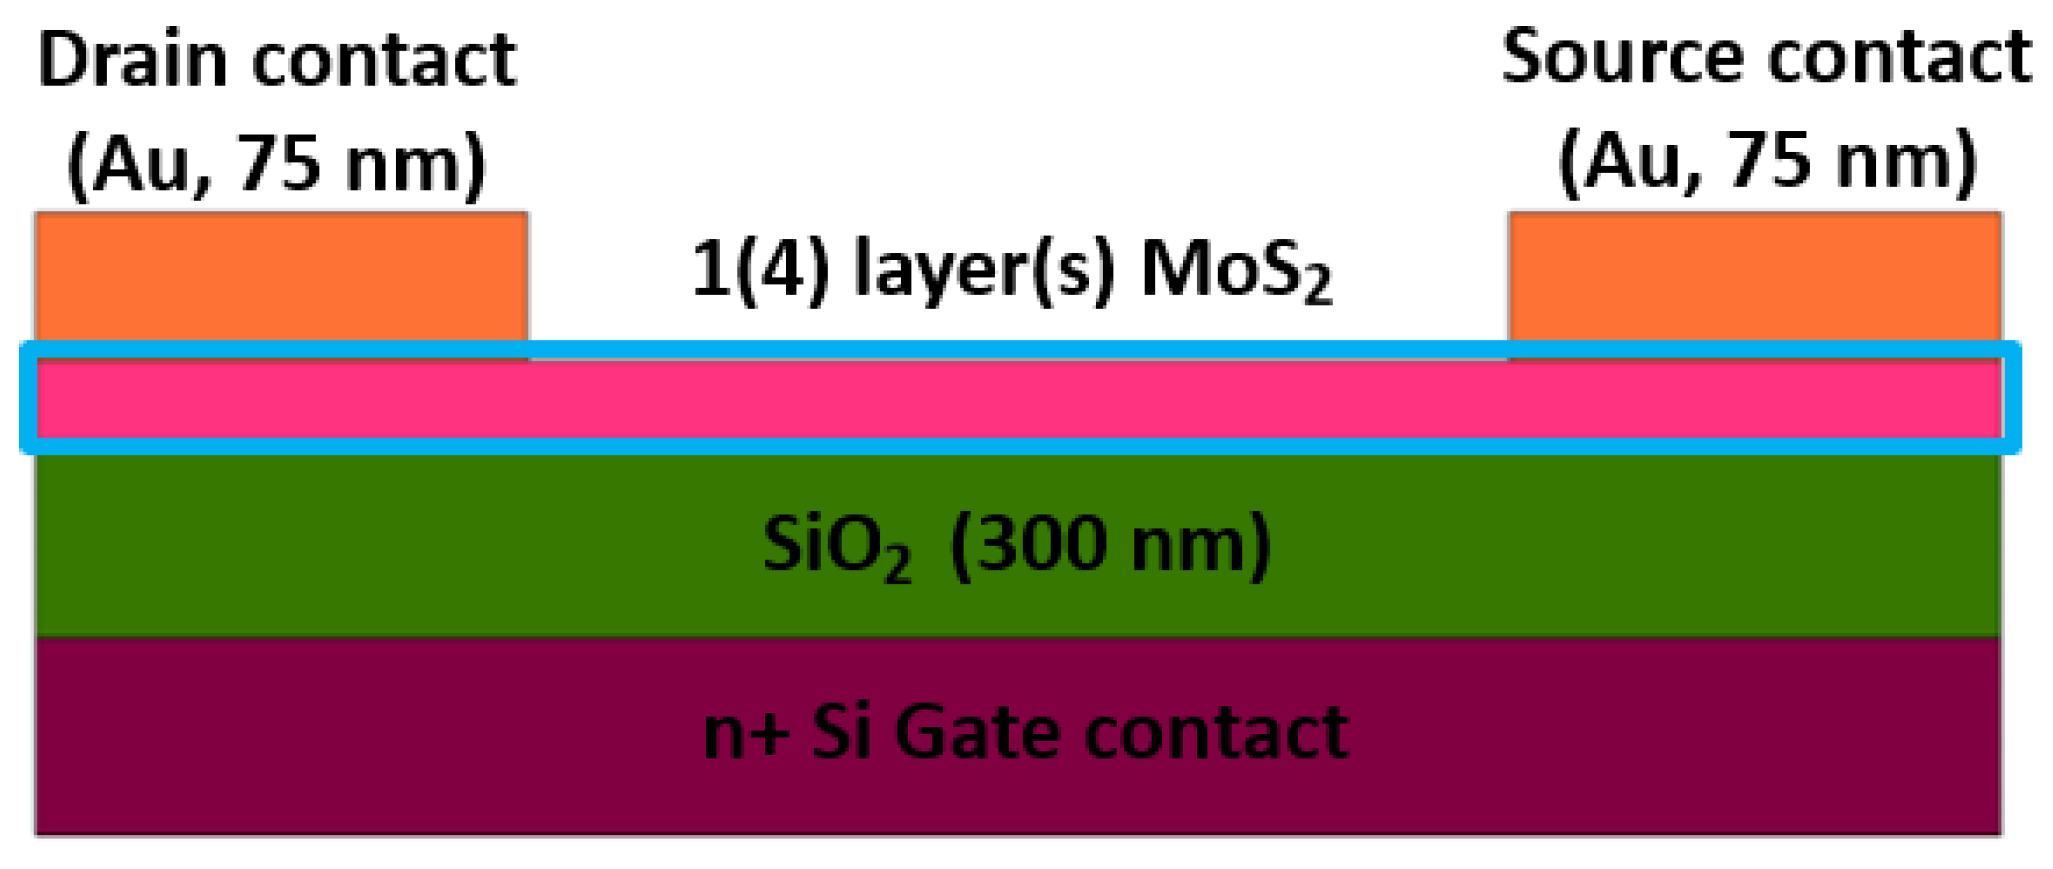
The first model used for the validation is the one reported by Howell et al. [28]. Here, the simulation settings both for a monolayer and a 4-layer MoS 2 FET are shown. A schematic view of the device is shown in Figure 2. All the parameters used for the simulations are listed in Table 1.
Drain and source metal contacts have been placed at the boundary between gold (orange) and MoS 2 (magenta). The semiconductor material interface is defined in the active region (magenta), while the charge conservation is applied in the insulator region (green). The gate contact is modeled with a terminal physics interface placed between the gate oxide and the gate region (plum).
The last interface mentioned is used for connections to outer circuits and requires a metal work function to be properly modeled. The doping concentration is specified through an analytic doping model defined in the active region.

2.2.2. MoS 2 Transistor with HfO 2

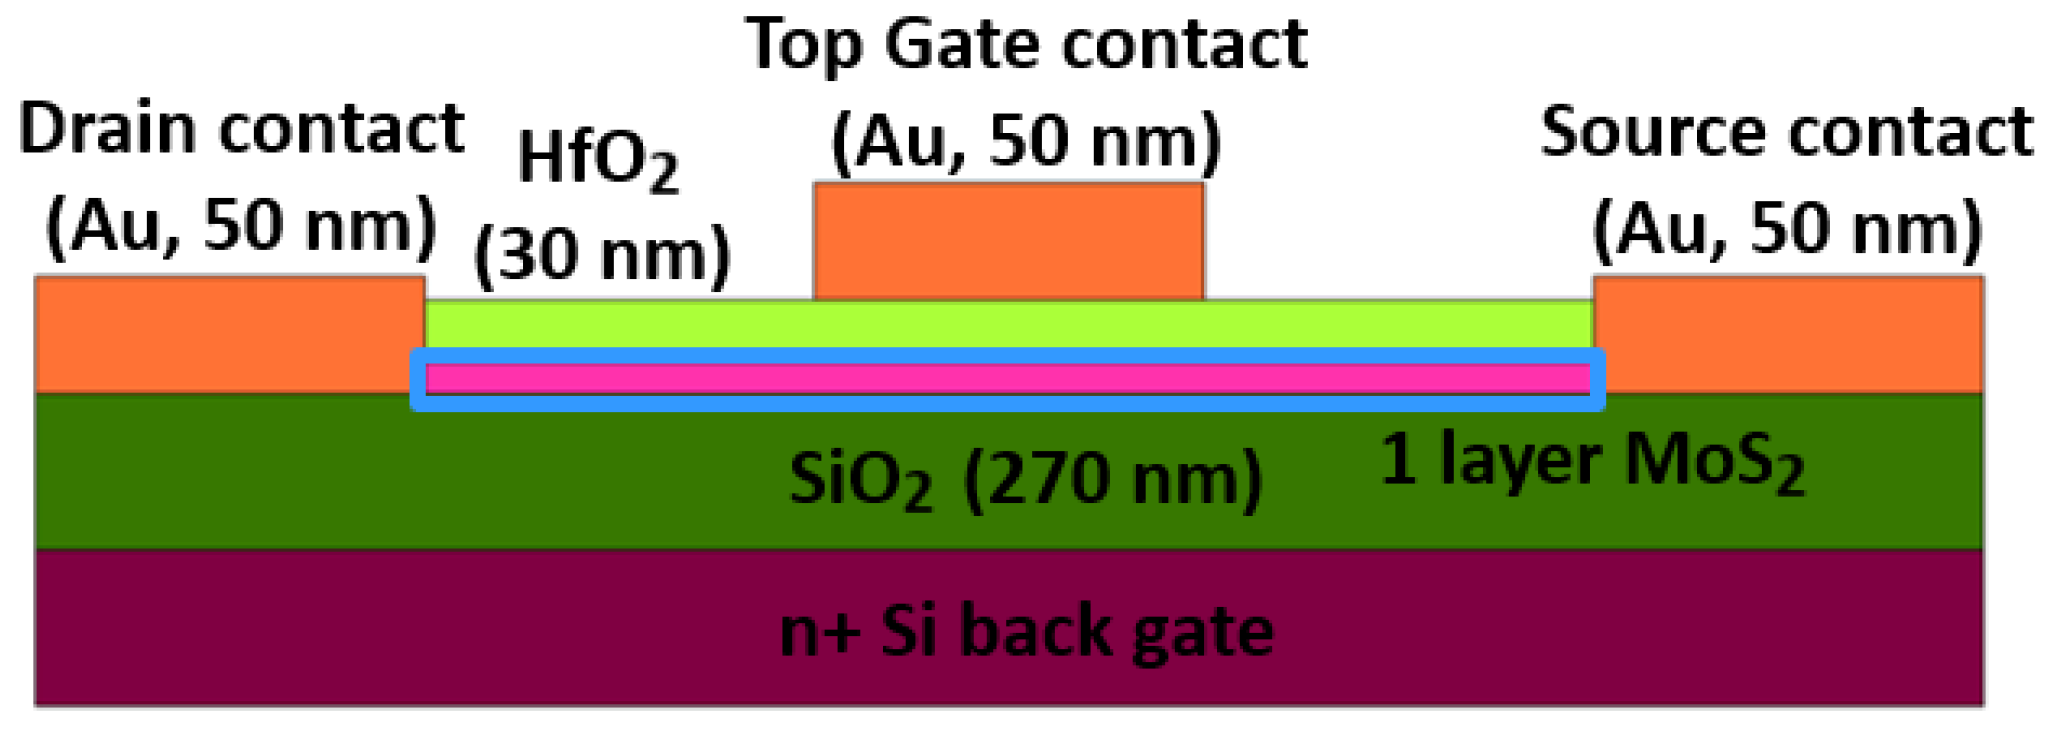
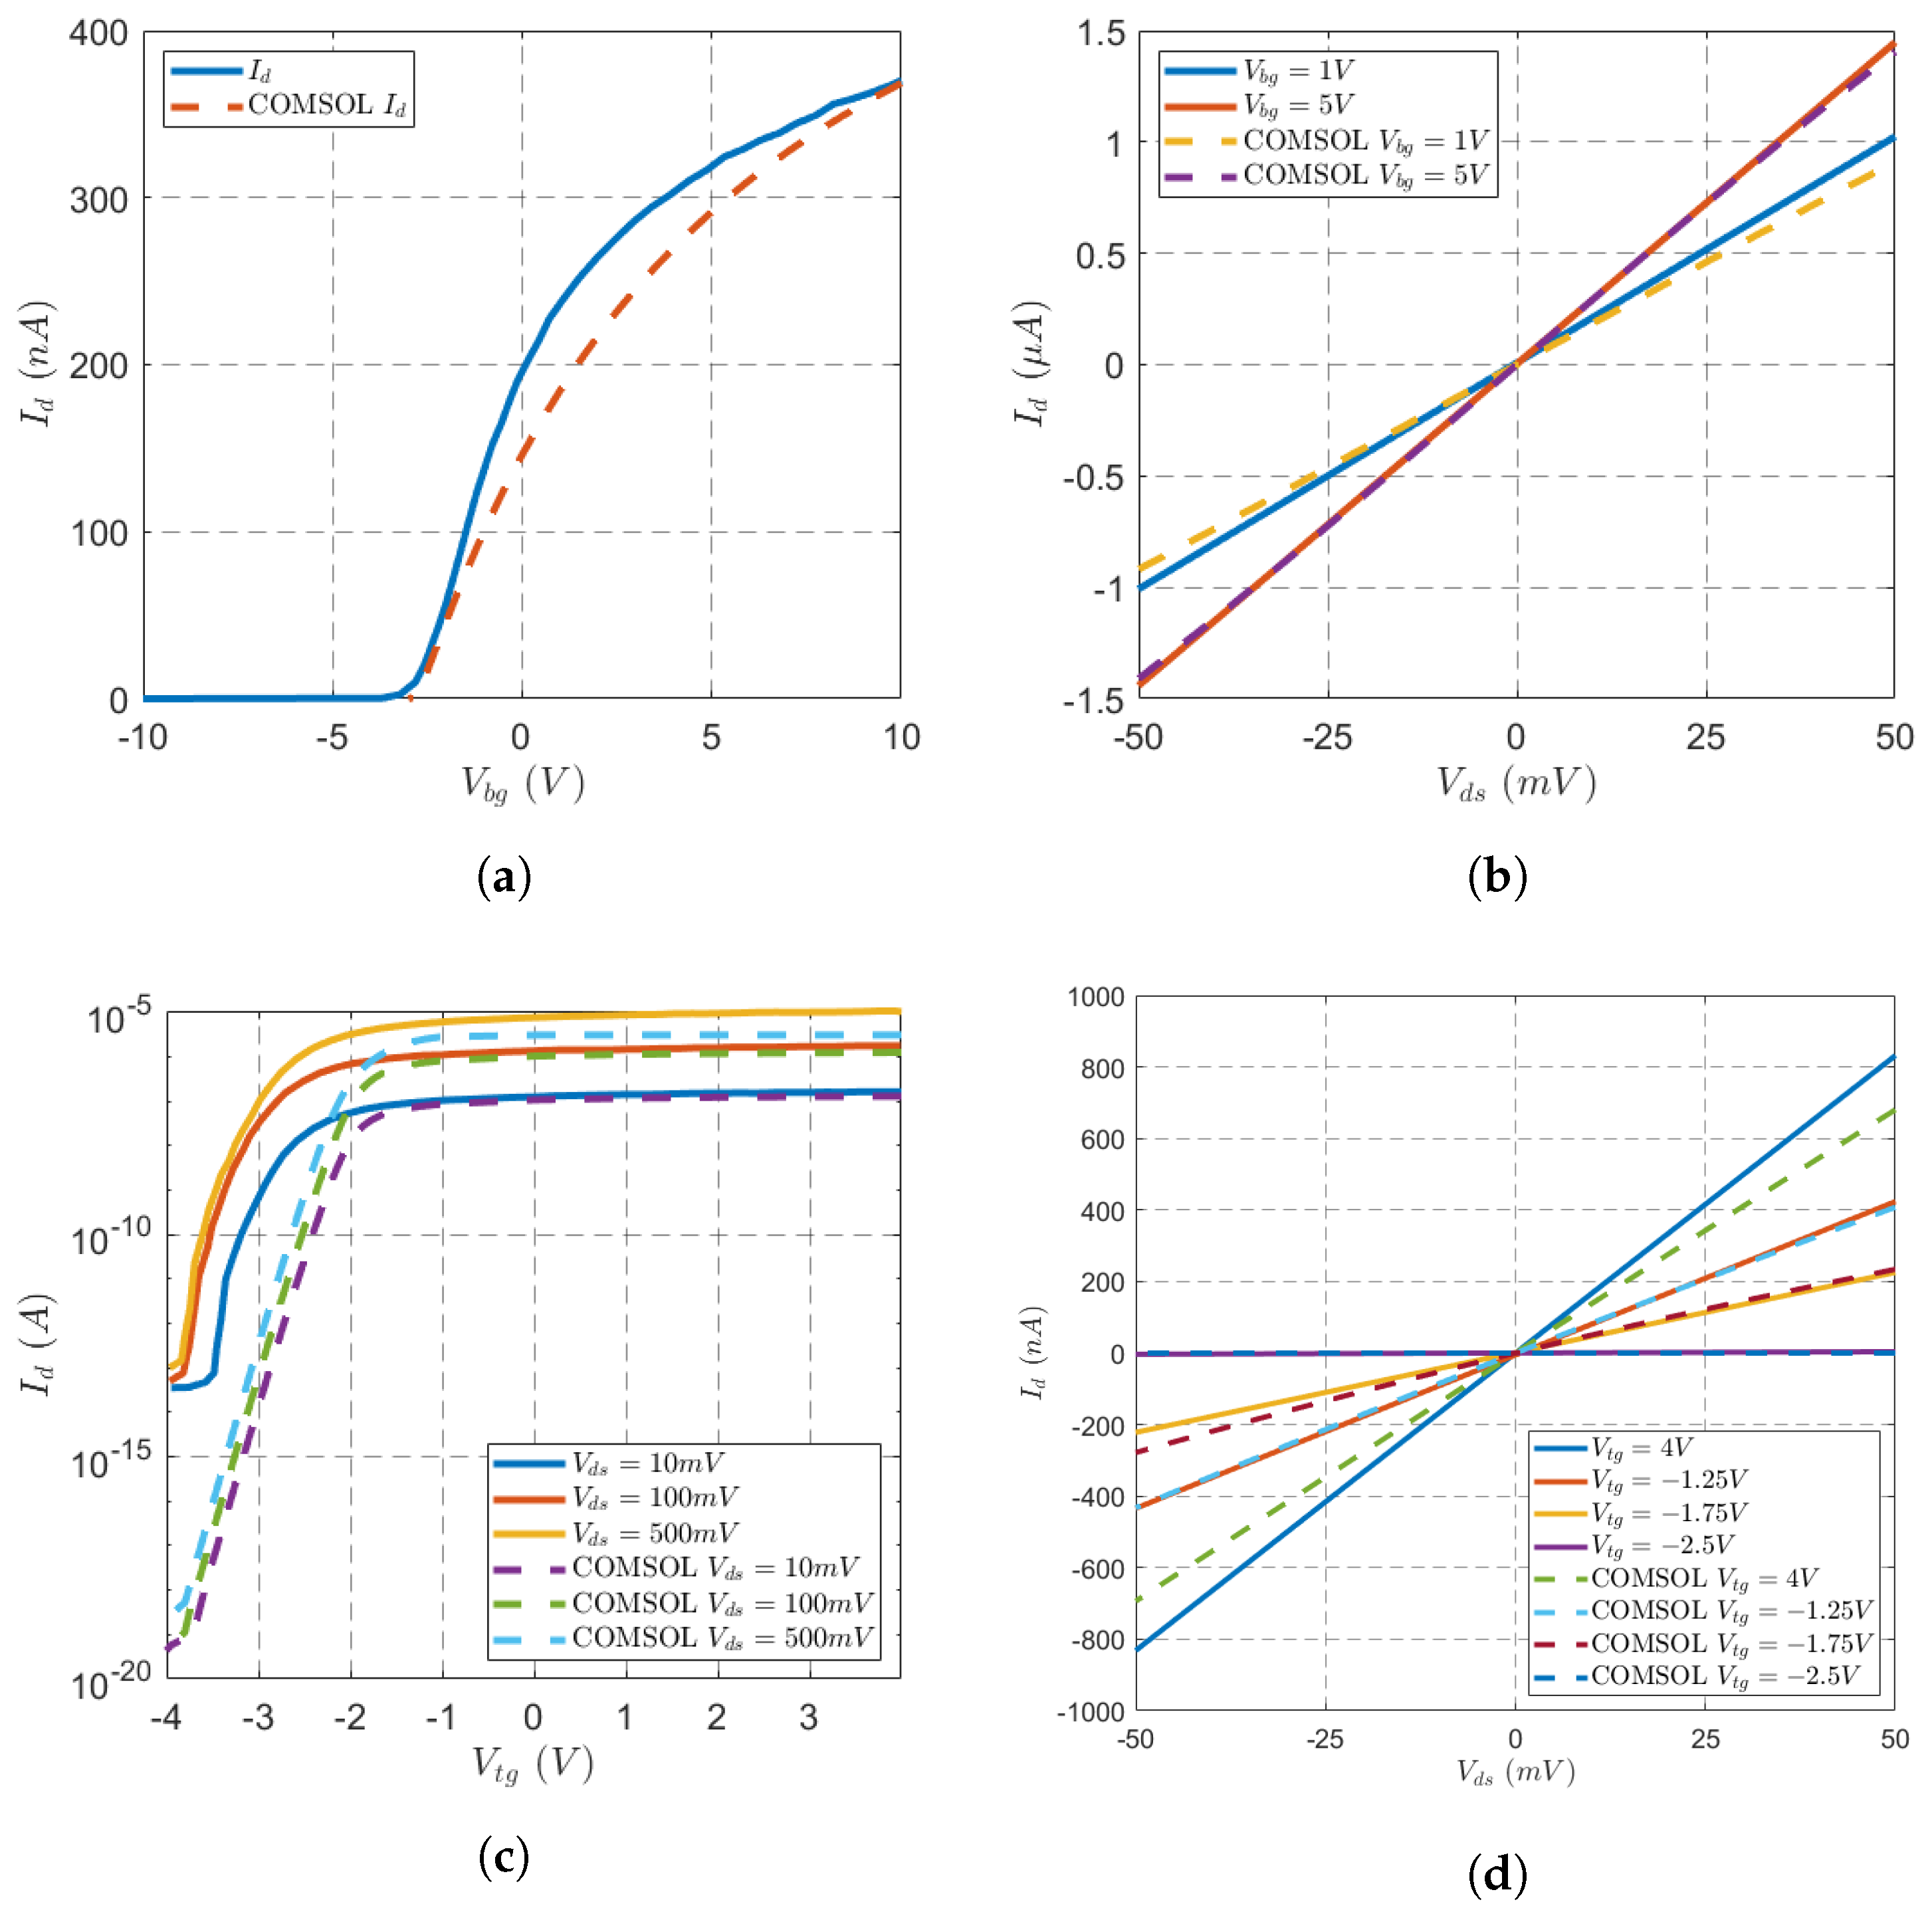
The second structure analyzed is presented by Radisavljevic et al. [10]. The main differences with respect to the previous model are the presence of a gold top gate with a 30 nm thick HfO 2 insulator, the type of metal contact chosen for the drain, source and back gate contacts (Schottky) and finally the method used to model the back gate. In this case the silicon back gate is modeled as a degenerate semiconductor by defining a high doping level in the gate region, which is contacted with a Schottky metal contact. All the remaining regions are modeled in the same way as the first model presented. In Figure 3, we can see the metal contacts (orange), the HfO 2 top gate insulator (light green), the monolayer MoS 2 active region (magenta), the SiO 2 back gate insulator (green), finally a n+ Si back gate contact. All the simulation parameters used for the structure modeling are shown in Table 2. Since the MoS 2 electron affinity is not provided in [10], it has been tuned in order to fit the results from the just mentioned paper.

2.3. MoS 2 Transistor with Hf 0.3 Zr 0.7 O 2

In this section, on the basis of the previous MoS 2 models, and taking into account the remarkable insulating properties of the HfO 2 , we present a concept model and simulations of an FeM-FET device (Figure 4). This model should pave the way for the fabrication of novel kinds of high performance MoS 2 based devices. Simulations have been performed starting from the model described in Section 2.2.2 and adding a 6 n m thick layer of Hf 0.3 Zr 0.7 O 2 .
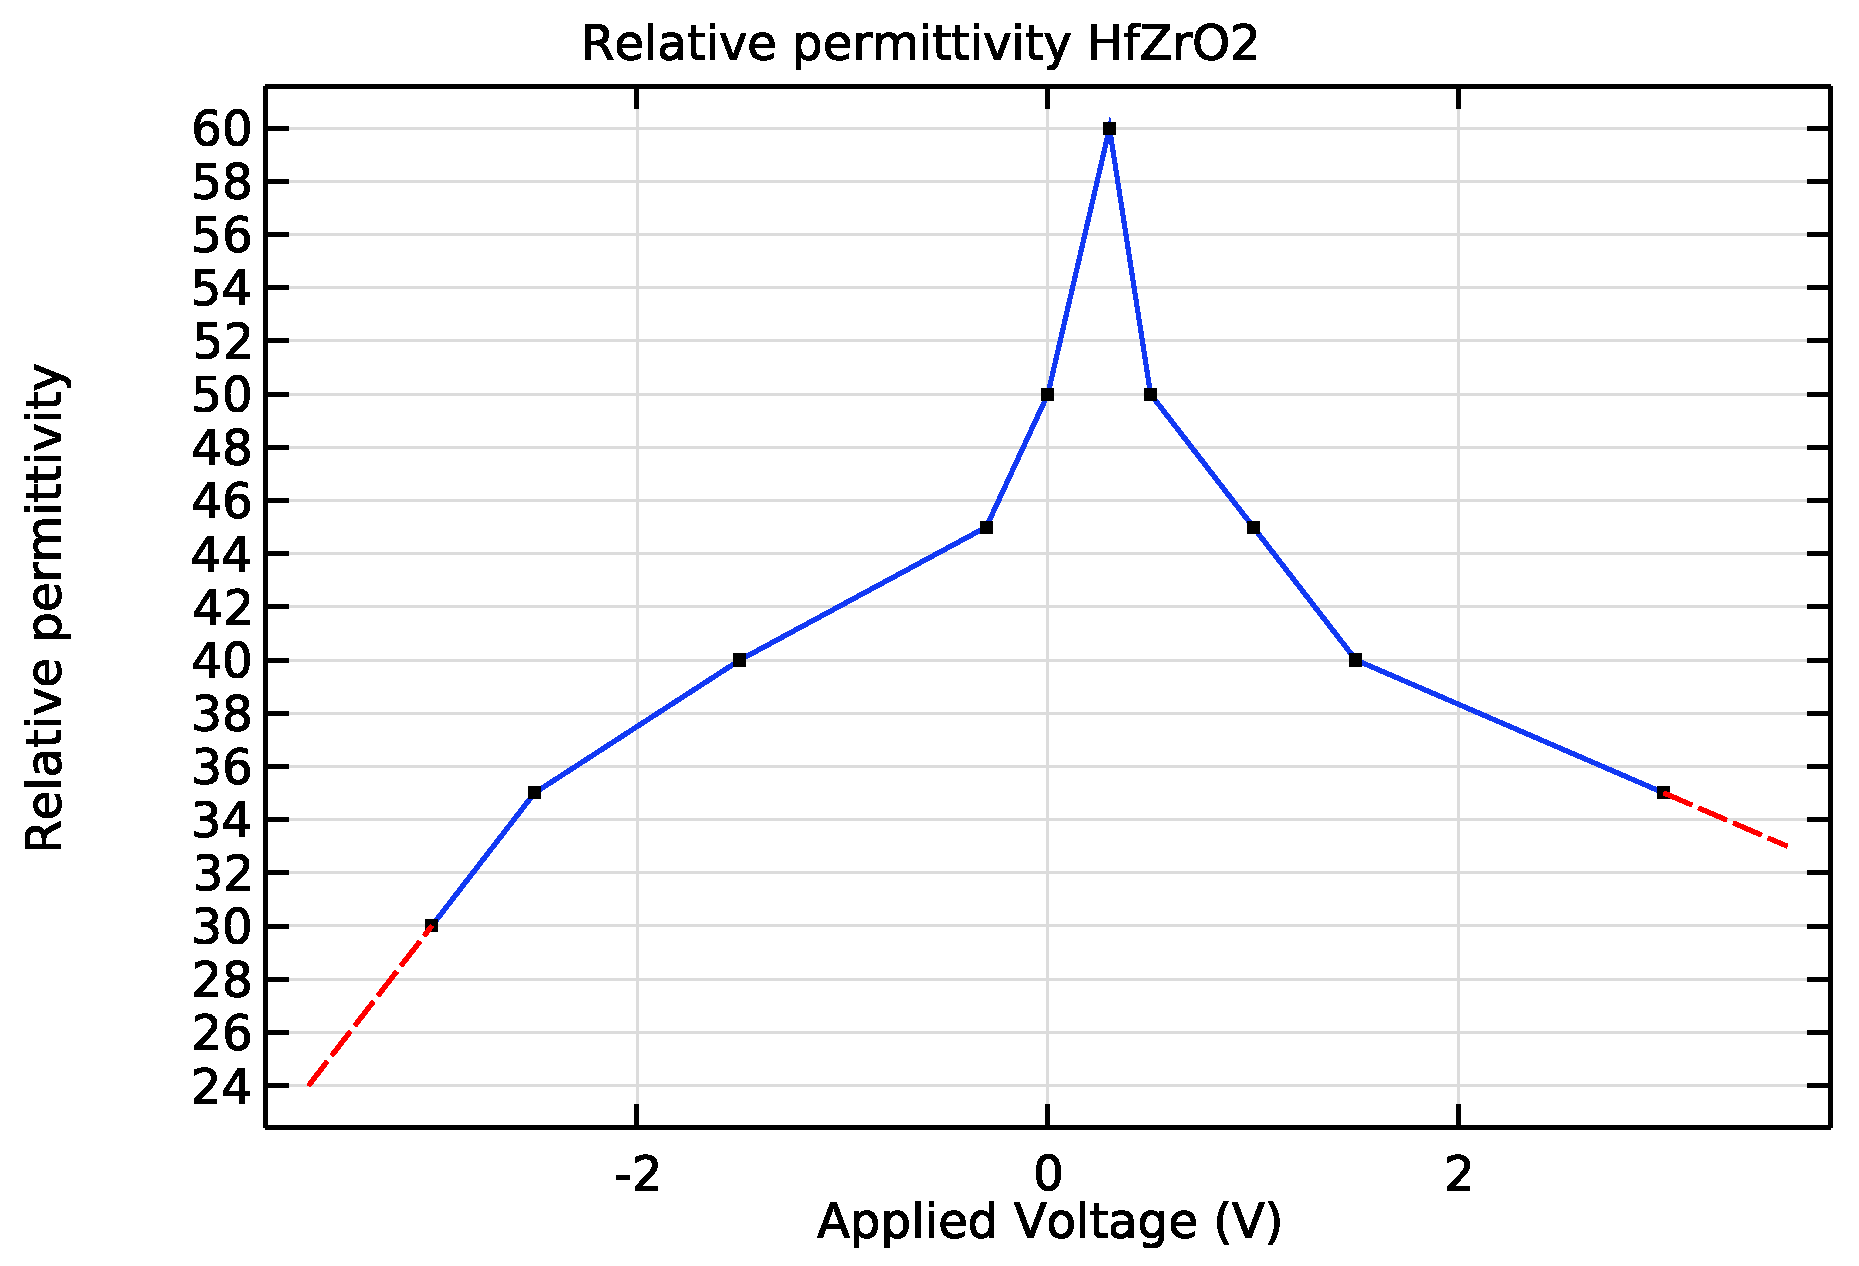
The values of the permittivity in function of the applied potential are taken from [17] and shown in Figure 5. The ϵ -V curve is interpolated with a linear method, extrapolation is performed using the nearest function method.
Table 3 lists the parameter values used for this simulation run.

3. Results and Discussion

3.1. Atomistic Simulations Results

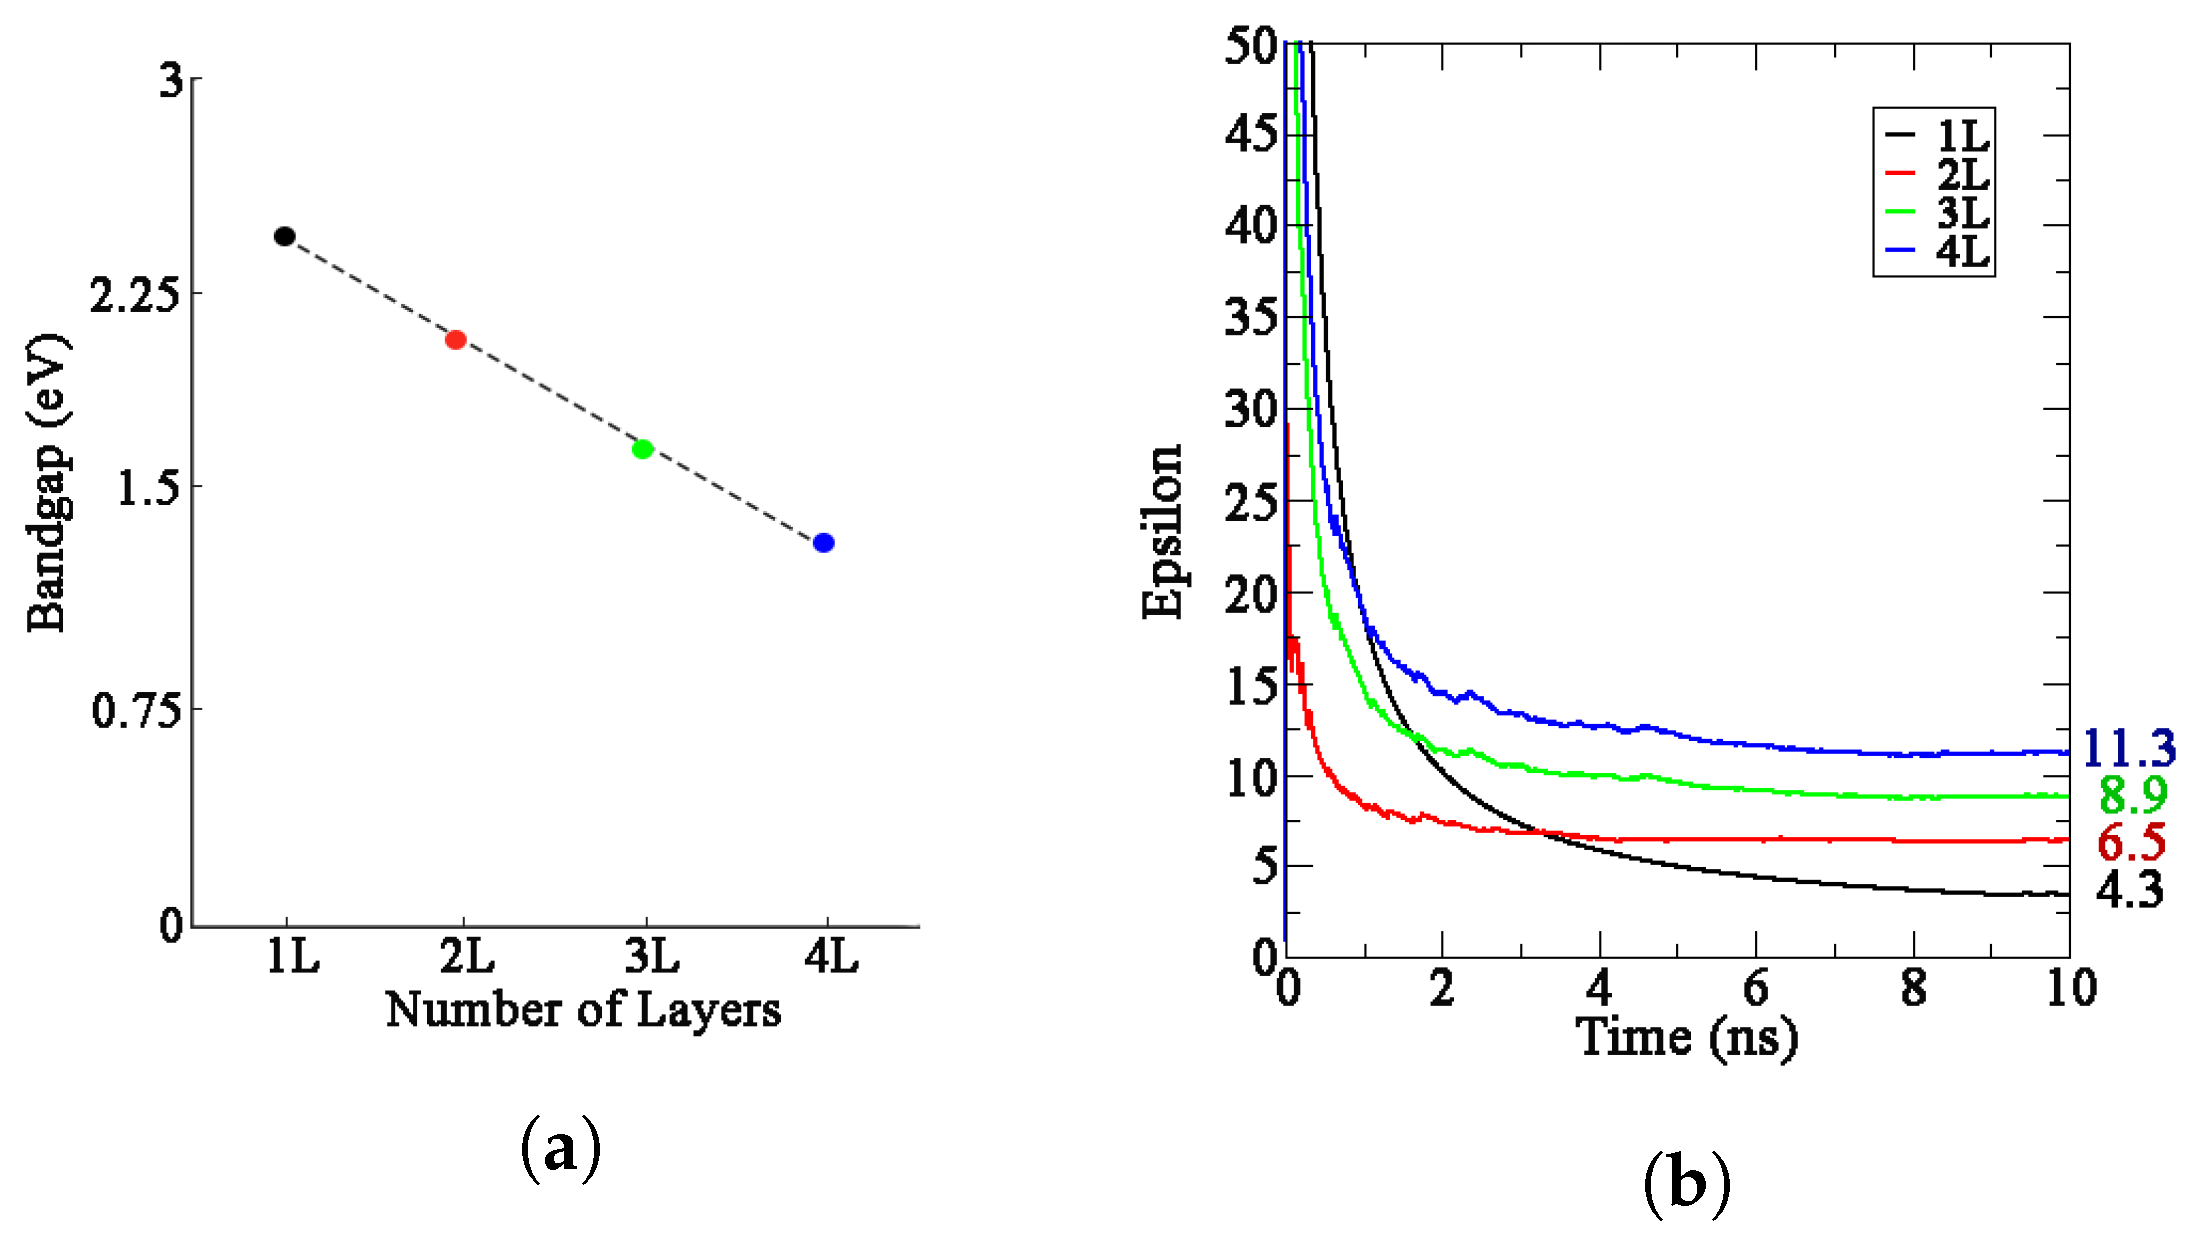
In the following, we will consider the MoS 2 without any substrate or superstrate material. From DFT results, the intrinsic electronic bandgap of 1L MoS 2 was determined to be 2.4 eV, decreasing to 2.1 eV for 2L MoS 2 . 3L MoS 2 showed a bandgap value of 1.75 eV, while 4L MoS 2 presented a lower value as 1.43 eV. Data revealed that MoS 2 bandgaps decreased with increasing layers’ number (Figure 6a). This is caused by the quantum confinement effect, which is due to changes in the atomic structure as a result of direct influence of ultra-small length scale on the energy band structure [29].
Numerical values of dielectric constant were extrapolated from MD simulation of MoS 2 systems through a combined use of gmx_dipoles and gmx_dielectric GROMACS tools. The 4.3 value of 1L MoS 2 was increased to 6.5 for 2L, while 8.9 and 11.3 were the dielectric constant values obtained for 3L and 4L MoS 2 , respectively (Figure 6b). A direct correlation between the number of layers and the dielectric constant value was observed.

3.2. MoS 2 FET with n+ Si Back Gate Results

Figure 7 and Figure 8 show a comparison between the results reported in literature [28] and the COMSOL simulations. We can observe a general good agreement both in terms of behavior and order of magnitude; the mismatch is almost due to the doping variations in the synthesis of the different MoS 2 samples, that is an intrinsic, not predictable, fabrication characteristic. The ohmic nature of gold contacts is visible in Figure 7b since the drain current has a linear behavior for small voltages.
The original structure showed by Howell et al. [28] presents side contacts. However, in order to find a better matching between COMSOL simulation and experimental results and to take into account possible imperfections during the fabrication process, we tried a top contact configuration (Figure 2). The latter led to not substantially different results. From this consideration we can assume that in this particular case, the contacting method has no influence on the structure.

3.3. MoS 2 Transistor with HfO 2 Top Gate Insulator

The gating characteristics of the transistor is shown in Figure 9a and this is typical of FET devices with an n-type channel. The source current versus source bias characteristics (Figure 9b) is linear in the ± 50   m V range of voltages.
In Figure 9b, it can see that the drain current behaves as also shown in Figure 7b, this means that contacts are ohmic, even though we used Schottky contacts to better fit the results from our simulation.
From overall evaluations, we can state that our model provided good results also for this different kind of structure.

3.4. MoS 2 Transistor with Hf 0.3 Zr 0.7 O 2 —Simulation Results

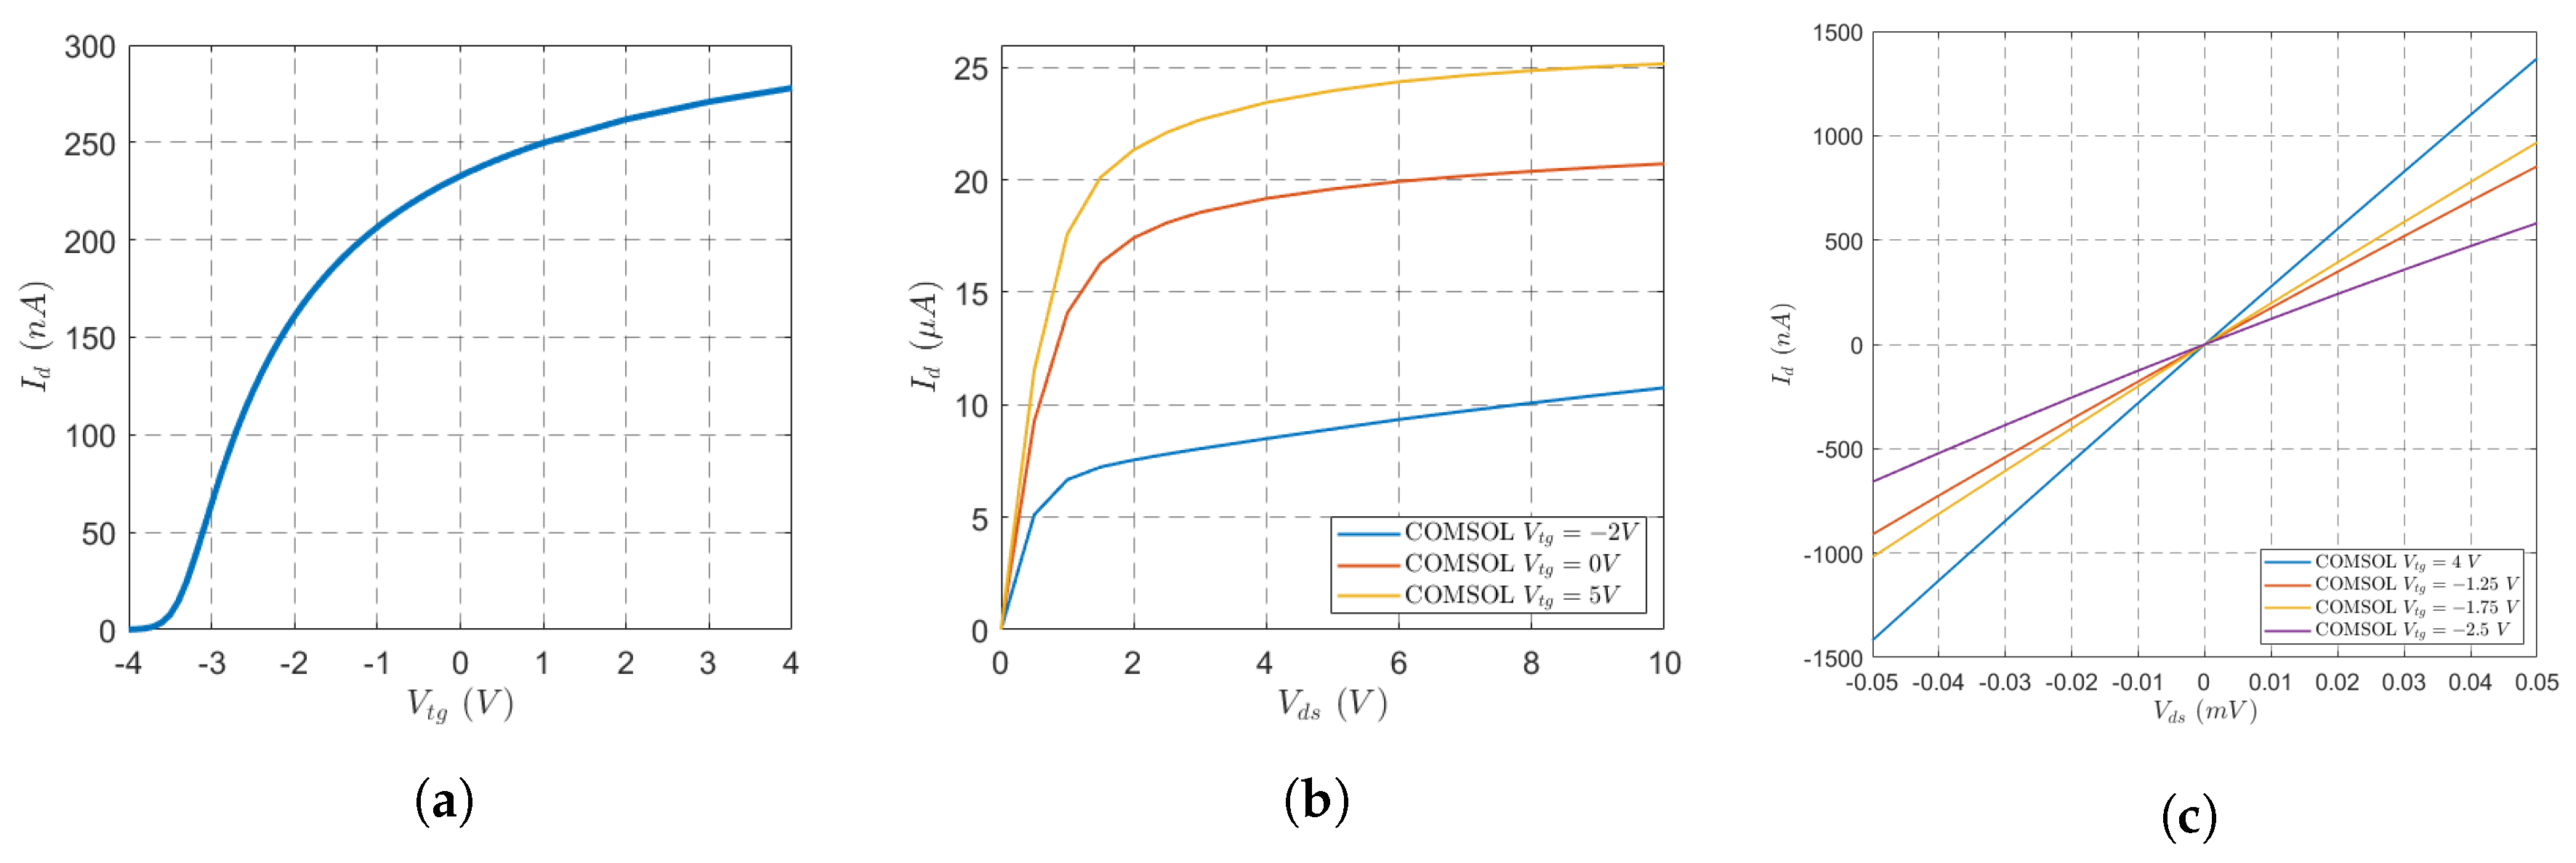
Figure 10a shows the I d V t g curve with V d s = 10   m V , the silicon substrate, which is also considered as bulk, is grounded. The Figure 10b shows the I d V d s curve with V b g = 0 V for V t g = 2 V, 0 V and 5 V. In this case the maximum drain current is about 25 μ A obtained for V t g = 5 V. In the resistive region the slope is higher than the previous study from Section 2.2.2 but the maximum current is lower.
Figure 10c indicates that for V t g = 2.5 V the device in still on, while in the same conditions the device is completely turned off in Figure 9d, also we can predict an ohmic behavior of the drain and source contacts.
Figure 11 shows a worse I o n / I o f f ratio than Figure 9c. With a ferroelectric material we have an I o n / I o f f ratio of 10 5 for V d s = 500   m V and about 10 3 for V d s = 10   m V while in [10] for V d s = 500   m V , the I o n / I o f f ratio is 10 8 and for V d s = 10   m V , the I o n / I o f f ratio is 10 6 .

4. Conclusions

In this work, we introduce a full-wave a model of a MoS 2 -based FET, by using COMSOL Multiphysics. A remarkable issue, that is also a research route for further works, relies on the fact that we first analyze the 2D active material (in the actual case MoS 2 ) at the atomistic level. The ab-initio (atomistic) simulations are based on a combination of the DFT and molecular dynamics techniques. From the atomistic simulations we derive the complete electronic band structure, as well as effective mass, permittivity, permeability and/or conductivity to be used as material constitutive relations in the subsequent full-wave simulations. The combination of atomistic vs. full-wave techniques gives high efficiency and versatility for the analysis of very different structures, devices and systems, ranging from the ballistic to the diffusive regime [30]. Then, we present examples of FET simulations and compare, for the devices described in Section 2.2.1 and Section 2.2.2, the theoretical results to the experimental ones from the literature [10,28], showing very good agreement.

Author Contributions

Conceptualization, L.P., D.M. and P.S.; methodology, N.P.; software, N.P. and E.L.; validation, N.P.; writing—original draft preparation, N.P. and E.L. All authors have read and agreed to the published version of the manuscript.

Funding

This research was supported by the European Project “NANO components for electronic SMART wireless circuits and systems (NANOSMART)”, H2020—ICT-07-2018-RIA, n. 825430.

Conflicts of Interest

The authors declare no conflict of interest.

References

  1. Xue, Y.; Zhang, Y.; Liu, Y.; Liu, H.; Song, J.; Ponraj, J.; Liu, J.; Xu, Z.; Xu, Q.; Wang, Z.; et al. Scalable Production of a Few-Layer MoS2/WS2 Vertical Heterojunction Array and Its Application for Photodetectors. ACS Nano 2016, 10, 573–580. [Google Scholar] [CrossRef] [PubMed]
  2. Tao, C.; Hesameddin, I.; Gerhard, K.; Rajib, R.; Chen, Z. Electrically Tunable Bandgaps in Bilayer MoS2. Nano Lett. 2015, 15, 8000–8007. [Google Scholar] [CrossRef]
  3. Yazyev, O.V.; Kis, A. MoS2 and semiconductors in the flatland. Mater. Today 2014, 20–30. [Google Scholar] [CrossRef]
  4. Xiong, K.E.A. CMOS-compatible batch processing of monolayer MoS2 MOSFETs. J. Phys. D Appl. Phys. 2018, 51, 15LT02. [Google Scholar] [CrossRef] [Green Version]
  5. Pierantoni, L.; Coccetti, F.; Russer, P. Nanoelectronics: The paradigm shift. IEEE Microw. Mag. 2010, 11, 8–10. [Google Scholar] [CrossRef]
  6. Donarelli, M.; Ottaviano, L. 2D Materials for Gas Sensing Applications: A Review on Graphene Oxide, MoS2, WS2 and Phosphorene. Sensors 2018, 18, 3638. [Google Scholar] [CrossRef] [Green Version]
  7. Varghese, S.; Varghese, S.; Swaminathan, S.; Singh, K.; Mittal, V. Two-Dimensional Materials for Sensing: Graphene and Beyond. Electronics 2015, 4, 651–687. [Google Scholar] [CrossRef] [Green Version]
  8. Wang, H.; Liu, F.; Fu, W.; Fang, Z.; Zhou, W.; Liu, Z. Two-dimensional heterostructures: Fabrication, characterization, and application. Nanoscale 2014, 6, 12250–12272. [Google Scholar] [CrossRef]
  9. Wi, S.; Hyunsoo, K.; Chen, M.; Hongsuk, N.; Guo, L.J.; Edgar, M.; Liang, X. Enhancement of Photovoltaic Response in Multilayer MoS2 Induced by Plasma Doping. ACS Nano 2014, 8, 5270–5281. [Google Scholar] [CrossRef]
  10. Radisavljevic, B.; Radenovic, A.; Brivio, J.; Giacometti, V.; Kis, A. Single-layer MoS2 transistors. Nat. Nanotechnol. 2011, 6, 147–150. [Google Scholar] [CrossRef]
  11. Krasnozhon, D.; Lembke, D.; Nyffeler, C.; Leblebici, Y.; Kis, A. MoS2 Transistors Operating at Gigahertz Frequencies. Nano Lett. 2014, 14, 5905–5911. [Google Scholar] [CrossRef] [PubMed] [Green Version]
  12. Wu, C.C.; Jariwala, D.; Sangwan, V.K.; Marks, T.J.; Hersam, M.C.; Lauhon, L.J. Elucidating the Photoresponse of Ultrathin MoS2 Field-Effect Transistors by Scanning Photocurrent Microscopy. J. Phys. Chem. Lett. 2013, 4, 2508–2513. [Google Scholar] [CrossRef] [Green Version]
  13. Cao, W.; Kang, J.; Liu, W.; Banerjee, K. A Compact Current-Voltage Model for 2D Semiconductor Based Field-Effect Transistors Considering Interface Traps, Mobility Degradation, and Inefficient Doping Effect. IEEE Trans. Electron Devices 2014, 61, 4282–4290. [Google Scholar] [CrossRef]
  14. Wei, B.; Lu, C. Transition metal dichalcogenide MoS2 field-effect transistors for analog circuits: A simulation study. AEU—Int. J. Electron. Commun. 2018, 88, 110–119. [Google Scholar] [CrossRef]
  15. Zhang, M.; Chien, P.; Woo, J.C.S. Comparative simulation study on MoS2 FET and CMOS transistor. In Proceedings of the 2015 IEEE SOI-3D-Subthreshold Microelectronics Technology Unified Conference (S3S), Rohnert Park, CA, USA, 5–8 October 2015; pp. 1–2. [Google Scholar]
  16. Miller, S.L.; McWhorter, P.J. Physics of the ferroelectric nonvolatile memory field effect transistor. J. Appl. Phys. 1992, 72, 5999. [Google Scholar] [CrossRef]
  17. Dragoman, M.; Aldrigo, M.; Modreanu, M.; Dragoman, D. Extraordinary tunability of high-frequency devices using Hf0.3Zr0.7O2 ferroelectric at very low applied voltages. Appl. Phys. Lett. 2017, 110, 103–104. [Google Scholar] [CrossRef] [Green Version]
  18. Mikolajick, T.; Slesazeck, S.; Park, M.H.; Schroeder, U. Ferroelectric hafnium oxide for ferroelectric random-access memories and ferroelectric field-effect transistors. Mrs Bull. 2018, 43, 340–346. [Google Scholar] [CrossRef]
  19. Shur, M. Physics of Semiconductor Devices; Prentice Hall: Upper Saddle River, NJ, USA, 1990. [Google Scholar]
  20. Li, X.; Zhu, H. Two-dimensional MoS2: Properties, preparation, and applications. J. Mater. 2015, 1, 33–44. [Google Scholar] [CrossRef] [Green Version]
  21. Lee, Y.H.; Zhang, X.Q.; Zhang, W.; Chang, M.T.; Lin, C.T.; Chang, K.D.; Yu, Y.C.; Wang, J.T.W.; Chang, C.S.; Li, L.J.; et al. Synthesis of Large-Area MoS2 Atomic Layers with Chemical Vapor Deposition. Adv. Mater. 2012, 24, 2320–2325. [Google Scholar] [CrossRef] [Green Version]
  22. Hall, R.N. Electron-Hole Recombination in Germanium. Phys. Rev. 1952, 87, 387. [Google Scholar] [CrossRef]
  23. Migalska-Zalas, A.; Kityk, I.; Bakasse, M.; Sahraoui, B. Features of the alkynyl ruthenium chromophore with modified anionic subsystem UV absorption. Spectrochim. Acta—Part A Mol. Biomol. Spectrosc. 2008, 69, 178–182. [Google Scholar] [CrossRef] [Green Version]
  24. Weiner, S.; Kollman, P.; Singh, U.; Case, D.; Ghio, C.; Alagona, G.; Profeta, S.J.; Weiner, P. A New Force Field for Molecular Mechanical Simulation of Nucleic Acids and Proteins. J. Am. Chem. Soc. 1984, 106, 765–784. [Google Scholar] [CrossRef]
  25. Cygan, R.; Liang, J.J.; Kalinichev, A. Molecular models of hydroxide, oxyhydroxide, and clay phases and the development of a general force field. J. Phys. Chem. B 2004, 108, 1255–1266. [Google Scholar] [CrossRef]
  26. Mayne, C.; Saam, J.; Schulten, K.; Tajkhorshid, E.; Gumbart, J. Rapid parameterization of small molecules using the force field toolkit. J. Comput. Chem. 2013, 34, 2757–2770. [Google Scholar] [CrossRef] [PubMed] [Green Version]
  27. Pettersen, E.; Goddard, T.; Huang, C.; Couch, G.; Greenblatt, D.; Meng, E.; Ferrin, T. UCSF Chimera—A visualization system for exploratory research and analysis. J. Comput. Chem. 2004, 25, 1605–1612. [Google Scholar] [CrossRef] [PubMed] [Green Version]
  28. Howell, S.L.; Jariwala, D.; Wu, C.C.; Chen, K.S.; Sangwan, V.K.; Kang, J.; Marks, T.J.; Hersam, M.C.; Lauhon, L.J. Investigation of Band-Offsets at Monolayer-Multilayer MoS2 Junctions by Scanning Photocurrent Microscopy. Nano Lett. 2015, 15, 2278–2284. [Google Scholar] [CrossRef] [PubMed] [Green Version]
  29. Zhao, X.; Wei, C.M.; Chou, M. Quantum confinement and electronic properties in silicon nanowires. Phys. Rev. Lett. 2003, 92, 236805. [Google Scholar] [CrossRef]
  30. Vincenzi, G.; Deligeorgis, G.; Coccetti, F.; Dragoman, M.; Pierantoni, L.; Mencarelli, D.; Plana, R. Extending ballistic graphene FET lumped element models to diffusive devices. Solid-State Electron. 2012, 76, 8–12. [Google Scholar] [CrossRef] [Green Version]
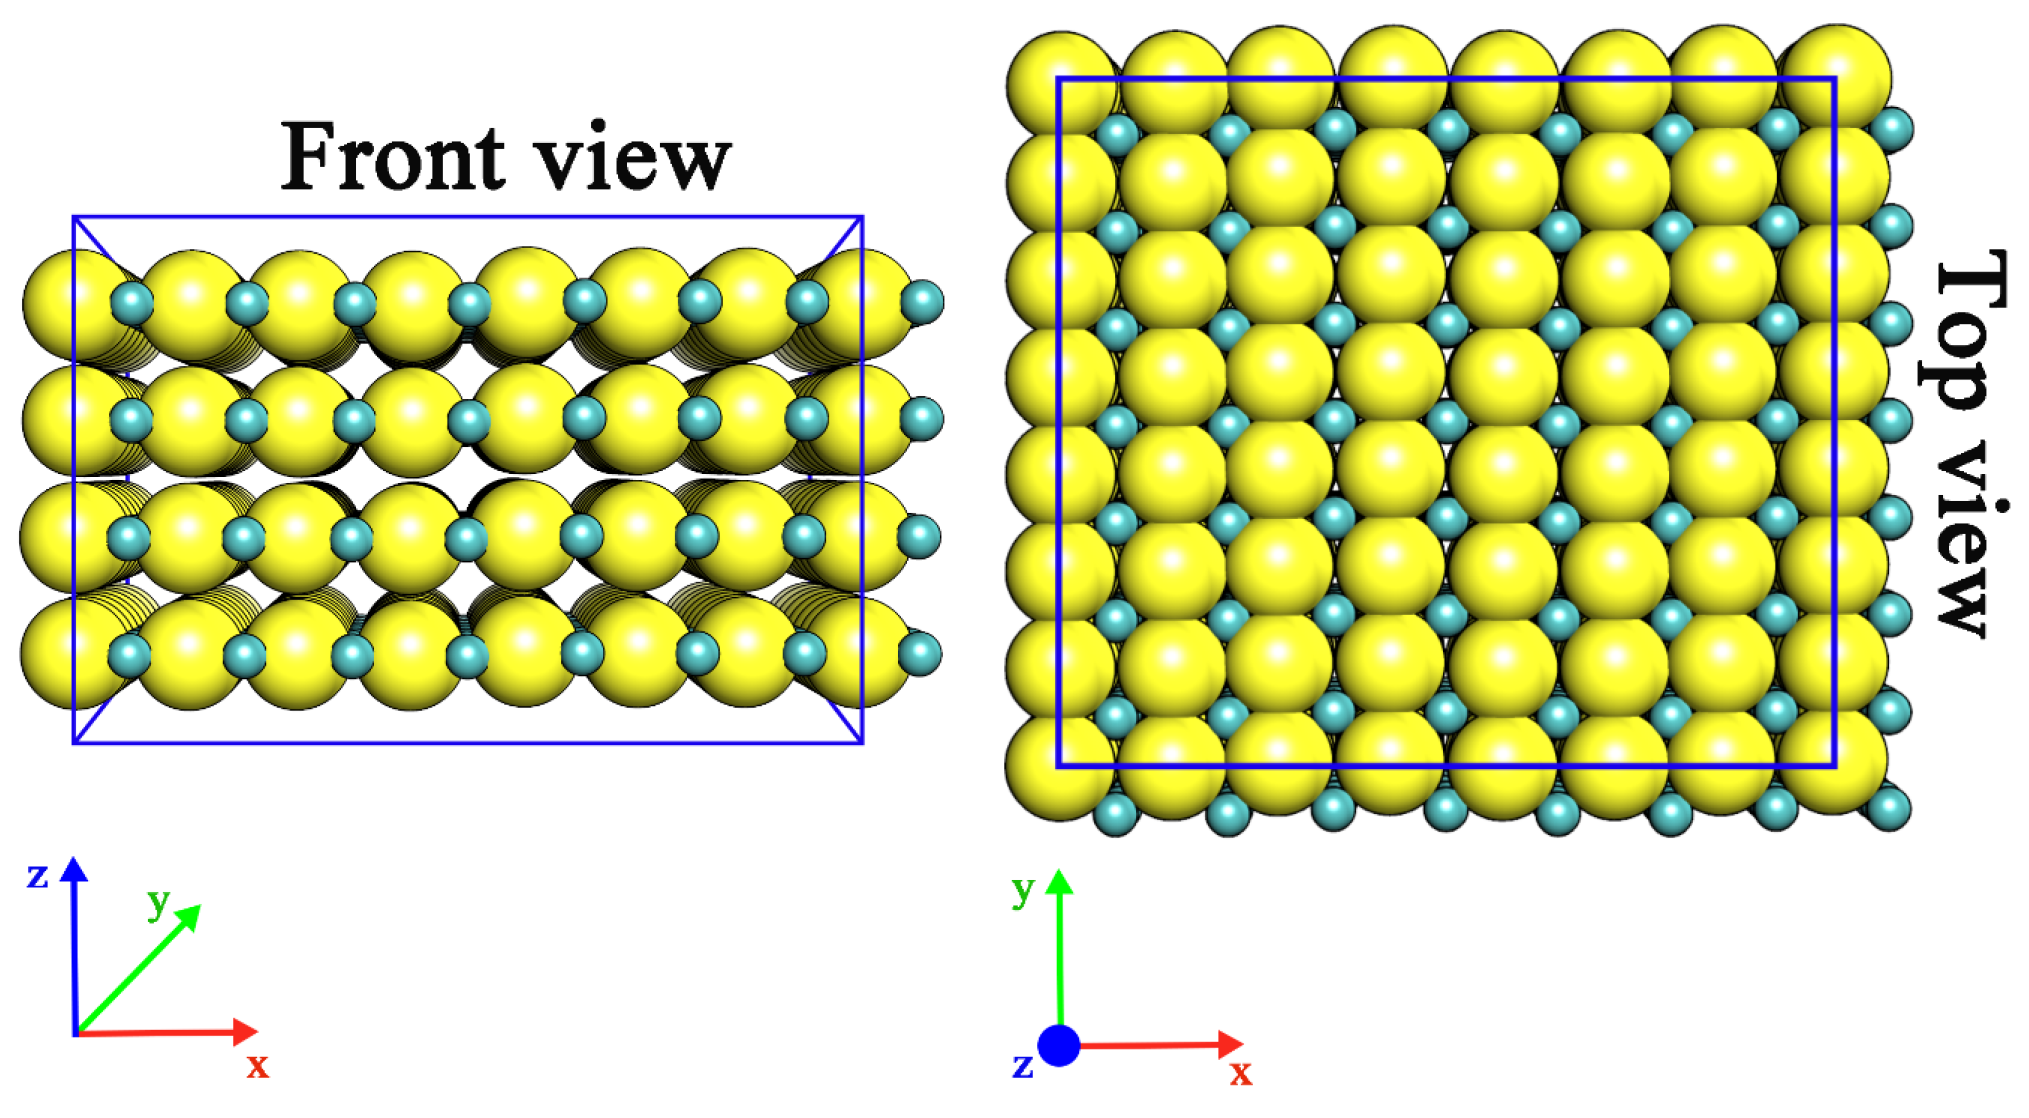
Figure 1. Front view and Top view of 4L MoS 2 . Mo atoms were reported in green sticks, while S atoms were highlighted in yellow VdW spheres.
Electronics 09 01385 g001
Figure 2. COMSOL schematic view of the MoS 2 field-effect transistors (FET) (not in scale). The device is 3.5 μ m long and the out-of-plane thickness (width) of the device is 6.8 μ m. The gold contacts (orange) are 75 nm thick, the active region (magenta) has a varying thickness depending on the number of layers (see Table 1), the thickness of the SiO 2 gate insulator (green) is 300 nm, the n+ Si gate (plum) has a thickness of 2 μ m.
Electronics 09 01385 g002
Figure 3. COMSOL HfO 2 model.
Electronics 09 01385 g003
Figure 4. COMSOL schematic view of the ferroelectric-metal field-effect transistor (FEM-FET) structure.
Electronics 09 01385 g004
Figure 5. Relative permittivity of Hf 0.3 Zr 0.7 O 2 in function of applied potential.
Electronics 09 01385 g005
Figure 6. Bandgap values of MoS2 structures in function of the number of layers (a). Dielectric constant values of MoS2 systems in function of simulation time (b).
Electronics 09 01385 g006
Figure 7. I-V curves for monolayer MoS2. Transfer characteristic for different doping concentration and V d s = 0.01 V (a), output characteristic for V g s = 10 V (b).
Electronics 09 01385 g007
Figure 8. I-V curves for 4-layer MoS2. Transfer characteristic for different doping concentration and V d s = 0.01 V (a), output characteristic for V g s = 10 V (b).
Electronics 09 01385 g008
Figure 9. Results comparison between experimental (solid) and simulated (dashed) data. Transfer characteristic when V d s = 10 mV (a) and the top gate is disconnected. Output characteristic (b) with disconnected top gate. Transfer characteristic when V b g = 0 V (c). Output characteristic for different values of V t g and grounded back gate (d).
Electronics 09 01385 g009
Figure 10. Transfer characterstic for V d s = 10 mV (a), output characteristic for different values of V t g (b), output characteristic for small values of V d s and different values of V t g (c).
Electronics 09 01385 g010
Figure 11. Transfer characteristic for different values of V d s .
Electronics 09 01385 g011
Table 1. Simulation parameters. Material properties are from the supporting information provided in attachment to [28].
ParameterValueParameterValue
Thickness of MoS 2 0.7 n m /layerElectron effective mass0.5 m 0
Bandgap 1L MoS 2 2.76   e V Hole effective mass0.5 m 0
Bandgap 4L MoS 2 1.6   e V Thickness gold contact75 n m
Electron affinity 1L Mo 2 4.7   e V Length MoS 2 3.5   μ m
Electron affinity 4L MoS 2 4 e V Silicon thickness2 μ m
Relative permittivity 1L4.2SiO 2 thickness300 n m
Relative permittivity 4L11Width 6.8   μ m
Mobility 1L6 cm2 V−1 s−1Work function of gate 4.05   V
Mobility 4L25 cm2 V−1 s−1SiO 2 Relative Permittivity3.9
Drain and Source contact typeIdeal ohmicDonor concentration (N_D) 1 × 10 18 cm 3
Table 2. Simulation parameters. All the data are taken from [10,28].
ParameterValueParameterValue
Thickness of MoS 2 0.65   n m SiO 2 Relative Permittivity3.9
Bandgap MoS 2 1.8   e V Electron effective mass0.5 m 0
Electron affinity MoS 2 5 e V Hole effective mass0.5 m 0
Relative permittivity MoS 2 4.2   e V Gold contact length500 n m
Relative permittivity HfO 2 25Source-gate spacing500 n m
Mobility217 cm2 V−1 s−1Gate-drain spacing500 n m
SRH lifetimes 1.5   n s Thickness gold contact50 n m
Metal work function of top gate 4.5   V SiO 2 thickness270 n m
Work function of bottom gate 4.05   V HfO 2 thickness30 n m
Metal work function source 5.1   V Width4 μ m
Metal work function drain 5.1   V Donor concentration (N_d) 1 × 10 18 cm 3
Table 3. Simulation parameters. All the data are taken from [10,28].
ParameterValueParameterValue
Thickness of MoS 2 0.65   n m Hf 0.3 Zr 0.7 O 2 thickness6 nm
Bandgap MoS 2 1.8   e V Electron effective mass0.5 m 0
Electron affinity MoS 2 5 e V Hole effective mass0.5 m 0
Relative permittivity MoS 2 4.2   e V Gold contact length500 n m
Relative permittivity HfO 2 20Source-gate spacing500 n m
Mobility217 cm2 V−1 s−1Gate-drain spacing500 n m
SRH lifetimes 1.5   n s Thickness gold contact50 n m
Metal work function of top gate 4.5   V SiO 2 thickness270 n m
Work function of bottom gate 4.05   V HfO 2 thickness30 n m
Metal work function source 5.1   V Width4 μ m
Metal work function drain 5.1   V Donor concentration (N_d) 1 × 10 18 cm 3