Article

NDE Terahertz Wave Techniques for Measurement of Defect Detection on Composite Panels of Honeycomb Sandwiches

1
Department of Automotive Engineering, Woosuk University, Wanju-kun, Jeonbuk-do 55338, Korea
2
Division of Mechanical System Engineering, Jeonbuk National University, Jeonju, Jeonbuk-do 54896, Korea
3
Department of Mechanical and Automotive Engineering, Songwon University, Gwangju 33209, Korea
4
Department of Basic Science, Jeonju University, Jeonju, Jeonbuk-do 55069, Korea
5
Center for Nondestructive Evaluation, Iowa State University, Ames, IA 50011, USA
*
Author to whom correspondence should be addressed.
Electronics 2020, 9(9), 1360; https://doi.org/10.3390/electronics9091360
Submission received: 20 July 2020 / Revised: 15 August 2020 / Accepted: 19 August 2020 / Published: 21 August 2020
(This article belongs to the Special Issue Terahertz Technology and Its Applications)

Abstract

:
Terahertz wave (T-ray) technologies have become a popular topic in scientific research over the last two decades, and can be utilized in nondestructive evaluation (NDE) techniques. This study suggests an optimal scanning technique method for honeycomb sandwich composite panels, where skins were utilized with two different skins, namely, carbon fiber-reinforced plastic (CFRP) skin and glass fiber-reinforced plastic (GFRP) skin, as layers of the panel surfaces. Foreign objects were artificially inserted between the skins and honeycomb cells in the honeycomb sandwich composite panels. For this experiment, optimal T-ray scanning methods were performed to examine defects based on the angle between the one-ply thin fiber skin axis and the angle of the electric field (E-field) according to the amount of conductivity of the honeycomb sandwich composite panels. In order to confirm the fundamental characteristics of the terahertz waves, the refractive index values of the GFRP composites were experimentally obtained and analyzed, with the data agreeing with known solutions. Terahertz waves (T-rays) were shown to have limited penetration in honeycomb sandwich composite panels when utilized with a skin of carbon fibers. Therefore, T-rays were found to interact with the electrical conductivity and electric field direction of honeycomb sandwich composite panels with glass fiber skins. The T-ray images were obtained regardless of the electric field direction and the fiber direction. In the honeycomb sandwich composite panels with carbon fiber skins, the T-ray images with higher signal-to-noise (S/N) ratios depended on the scanning angle between the angle of the carbon fiber and the angle of the electric field. Thus, the angle of optimum detection measurement was confirmed to be 90° between the E-field and the fiber direction, particularly when using a carbon fiber skin.

1. Introduction

Recently, utilization of terahertz wave (T-ray) technologies have increased exponentially in technical applications such as mechanical aviation, aerospace, and advanced medical fields, with field practical applications also revealing broad application prospects. T-rays, which have relatively short wavelength and high resolution, are widely used in fields of inspection using electric and electronic spectra. In particular, T-rays are critically important in security devices used in airports, advanced imaging, liquids, various industrial areas, and spectroscopic evaluation of advanced composite materials [1,2,3,4,5]. Terahertz time–domain spectroscopy (THz-TDS) plays an important role in contactless detection of discontinuity or defects, which are present in various composite materials. The THz system is based on photoconductivity and depends on the generation of low-cycle terahertz waveforms utilizing photoconductive sensors mounted with femtosecond (10–15 s) lasers [6]. This system has the ability to generate picosecond terahertz waves and obtain a high signal-to-noise ratio (S/N). This energy affects a wide range of bandwidths and the resistance of photoconductive switches could cause a temporary change in THz wave emission to be produced over the THz timescale baseline [6,7,8,9].
The other method uses a laser of two continuous waves (CW) via optical conversion and optical mixing. Much attention surrounds T-ray signals because of their use in monitoring, such as management and inspection of nonconductive products, chemical components, and physical properties and substance toxicity analysis. Since T-rays are employed in small, portable pieces of equipment using previously discovered foundation technologies, its range of applicability is wide and the utilization of these technologies may be significant.
More recently, the importance of fiber-reinforced plastics (FRP), which are used in industrial regions as well as state-of-the-art aviation sectors, was identified. Characteristic evaluations of refraction coefficient (n), absorption coefficient (α), and electrical conductivity of epoxy resin in composite materials, which are present in fibers, were conducted by directly applying T-rays to FRP-laminated plates. Furthermore, T-ray scan imaging techniques were studied to detect defects in carbon fiber-reinforced plastics (CFRP) composites. Carbon fibers are conductive, whereas epoxy matrices are not conductive. Therefore, the interaction between the conductivity of carbon fibers in CFRP-laminated plates and T-ray applications were identified. Measurements regarding nanoparticle detection and sizing were also made by using microcavity cost and challenge based on spectra estimations [4,10,11,12,13,14].
Composite panels of honeycomb sandwiches, which are excellent in terms of their lightness, were used in this study. Foreign materials were inserted during composite manufacture, leading to decreased strength, shape change, and poor adhesion. After the carbon fibers were utilized as a skin, the foreign materials became not more visible than if a transparent glass fiber skin was used. Detecting these foreign materials is an important step toward checking the soundness of composite materials. This approach focused on a technique to monitor foreign materials on the honeycomb cell cores of these panels. Assuming that the foreign materials (e.g., foils) were present between the upper side of the honeycomb cells and a thin layer of carbon/glass fibers used as a skin while manufacturing the honeycomb sandwich panels, several artificial honeycomb sandwich panels with foreign materials were produced. Two kinds of skins were utilized and defined as “carbon skin” or “glass skin”, with the skins being unidirectional for both carbon and glass fibers.
Experimental results of T-rays are herein presented for honeycomb sandwich composite panels. We also demonstrate a technique for measuring the refractive index (n), which is one of the properties of various materials that use THz waves, and consider a correlation between the angle of the electric field and the fiber angle of CFRP and GFRP composite panels to consider conductivity. The investigation regarding T-rays was found to successfully monitor the soundness of honeycomb sandwich composite panels. Two kinds of glass- and carbon-skin honeycomb sandwich composite panels were tested to examine honeycomb sandwich composite panel defects and optimal scanning methods were confirmed regarding the angle of the electric field versus the angle of fibers in glass and carbon skins for honeycomb sandwich composite panels.

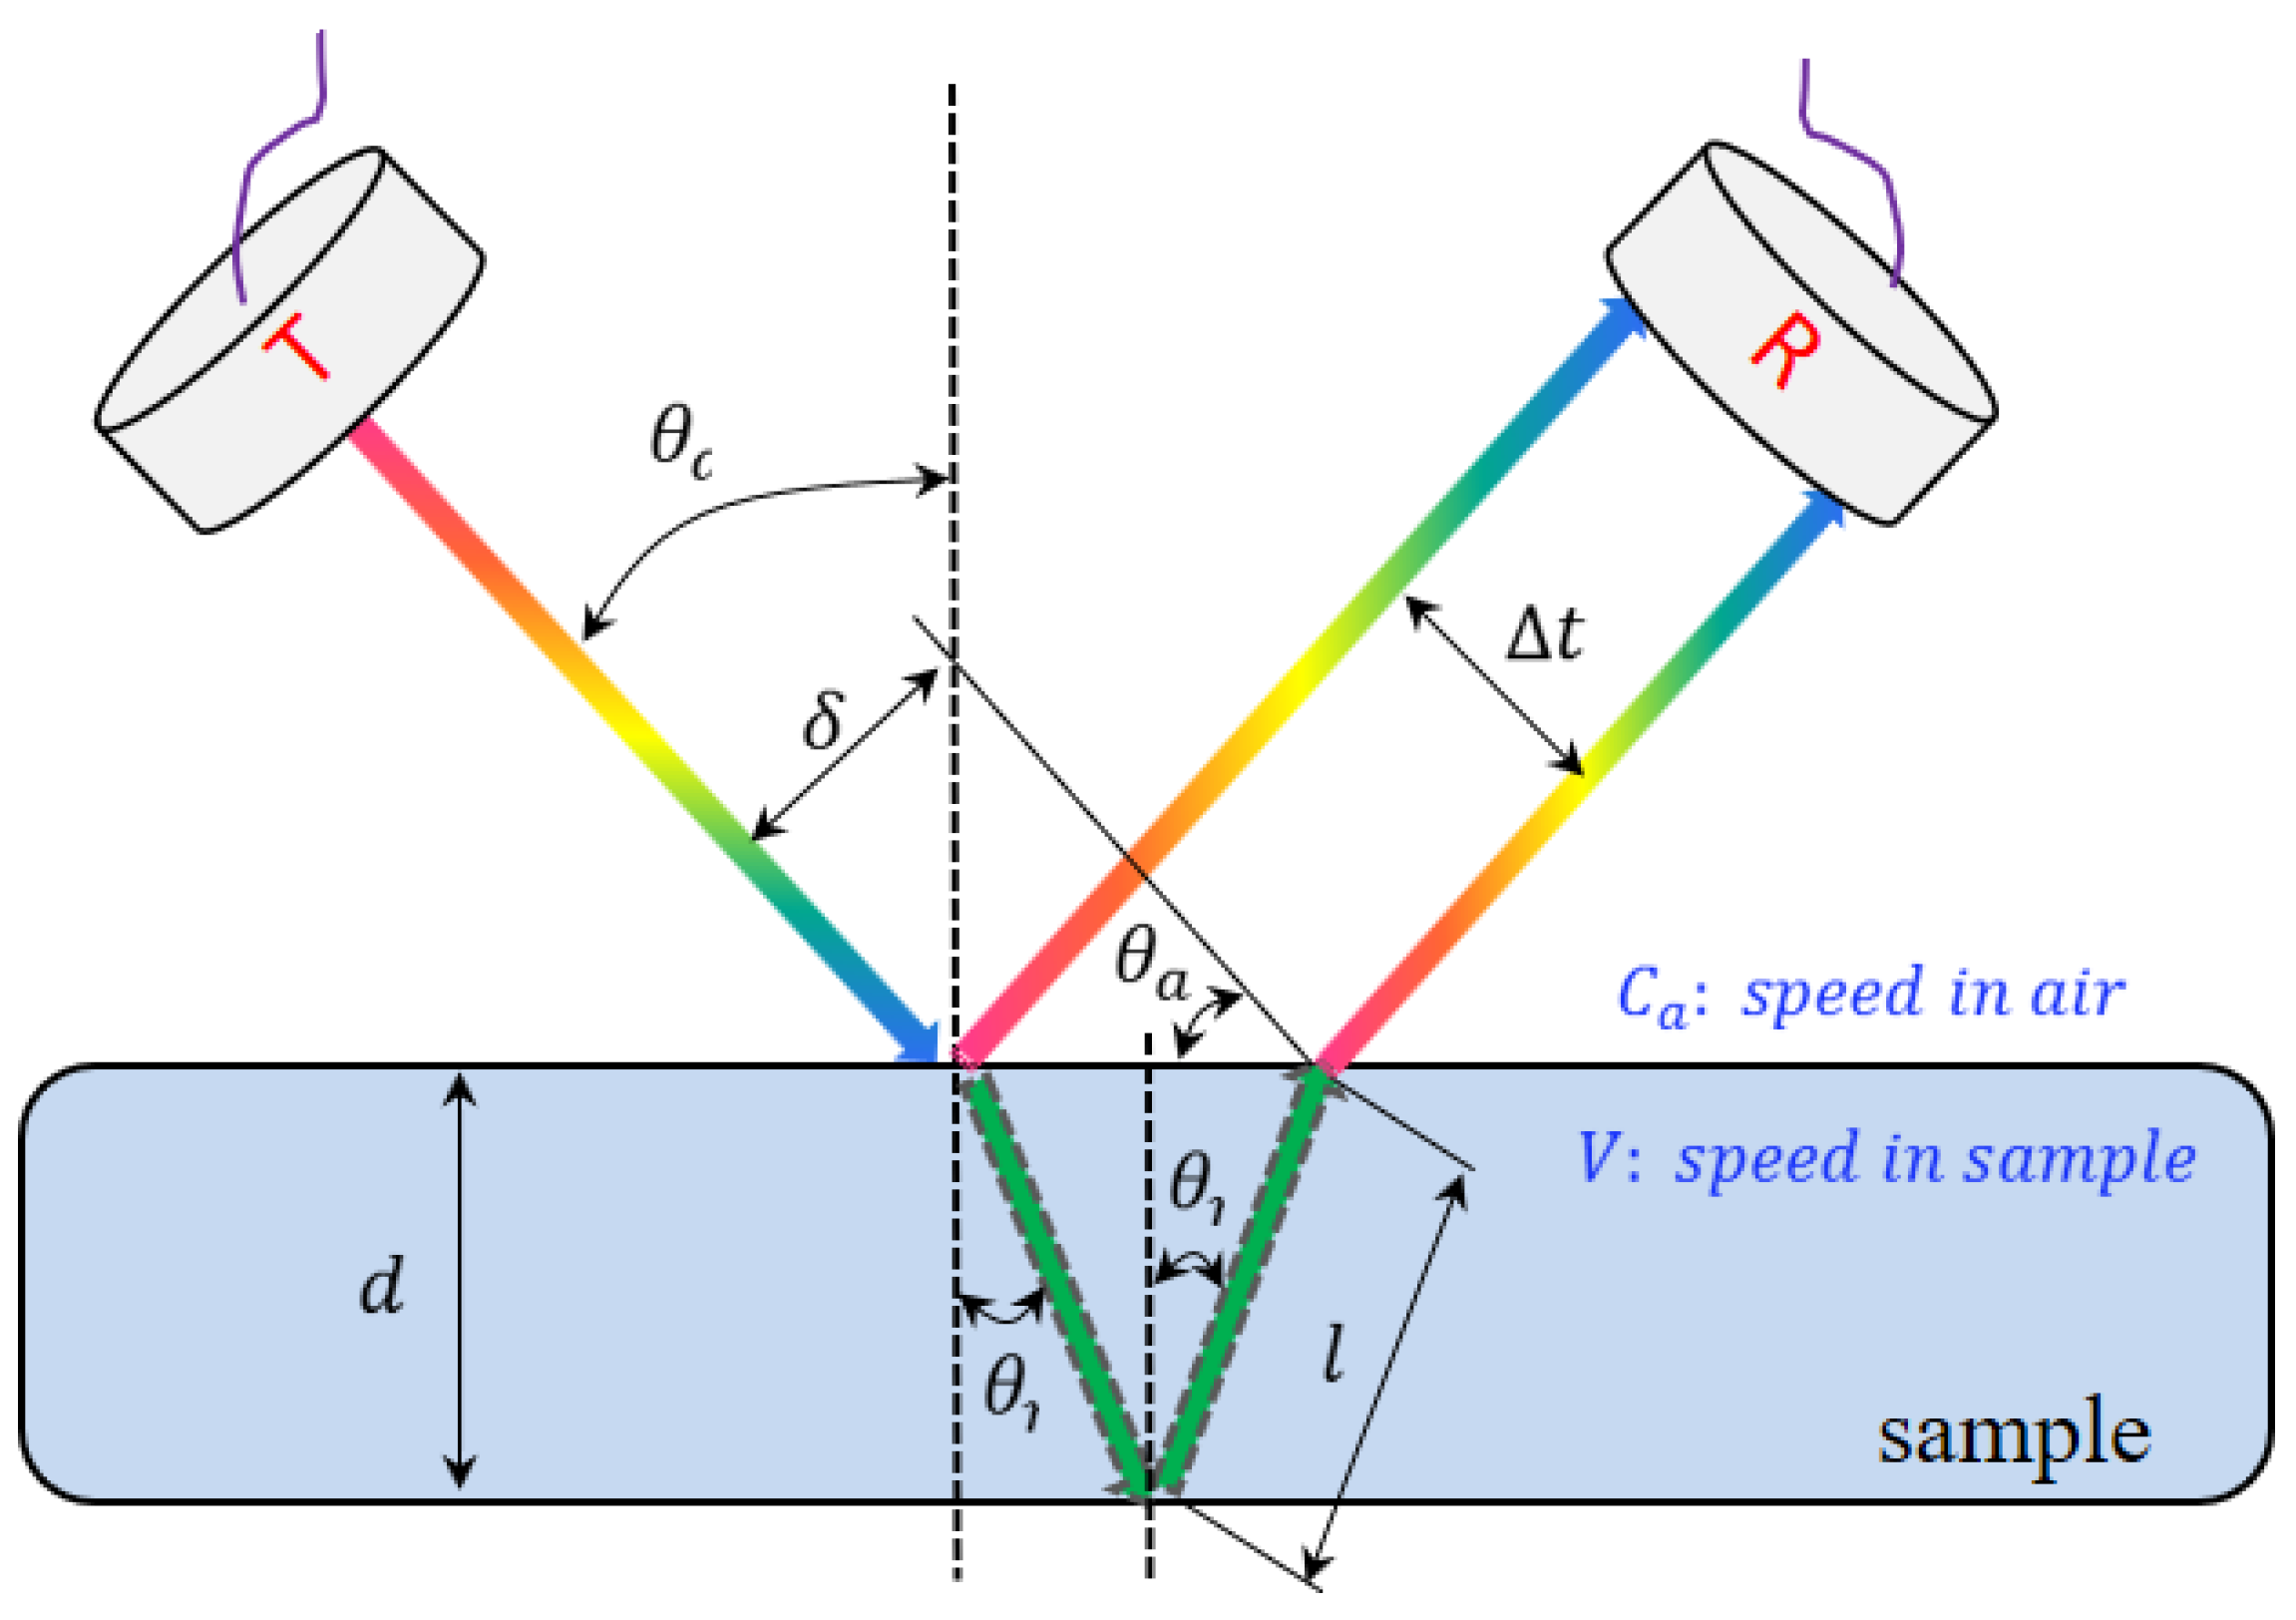
2. Basic Theory Approach

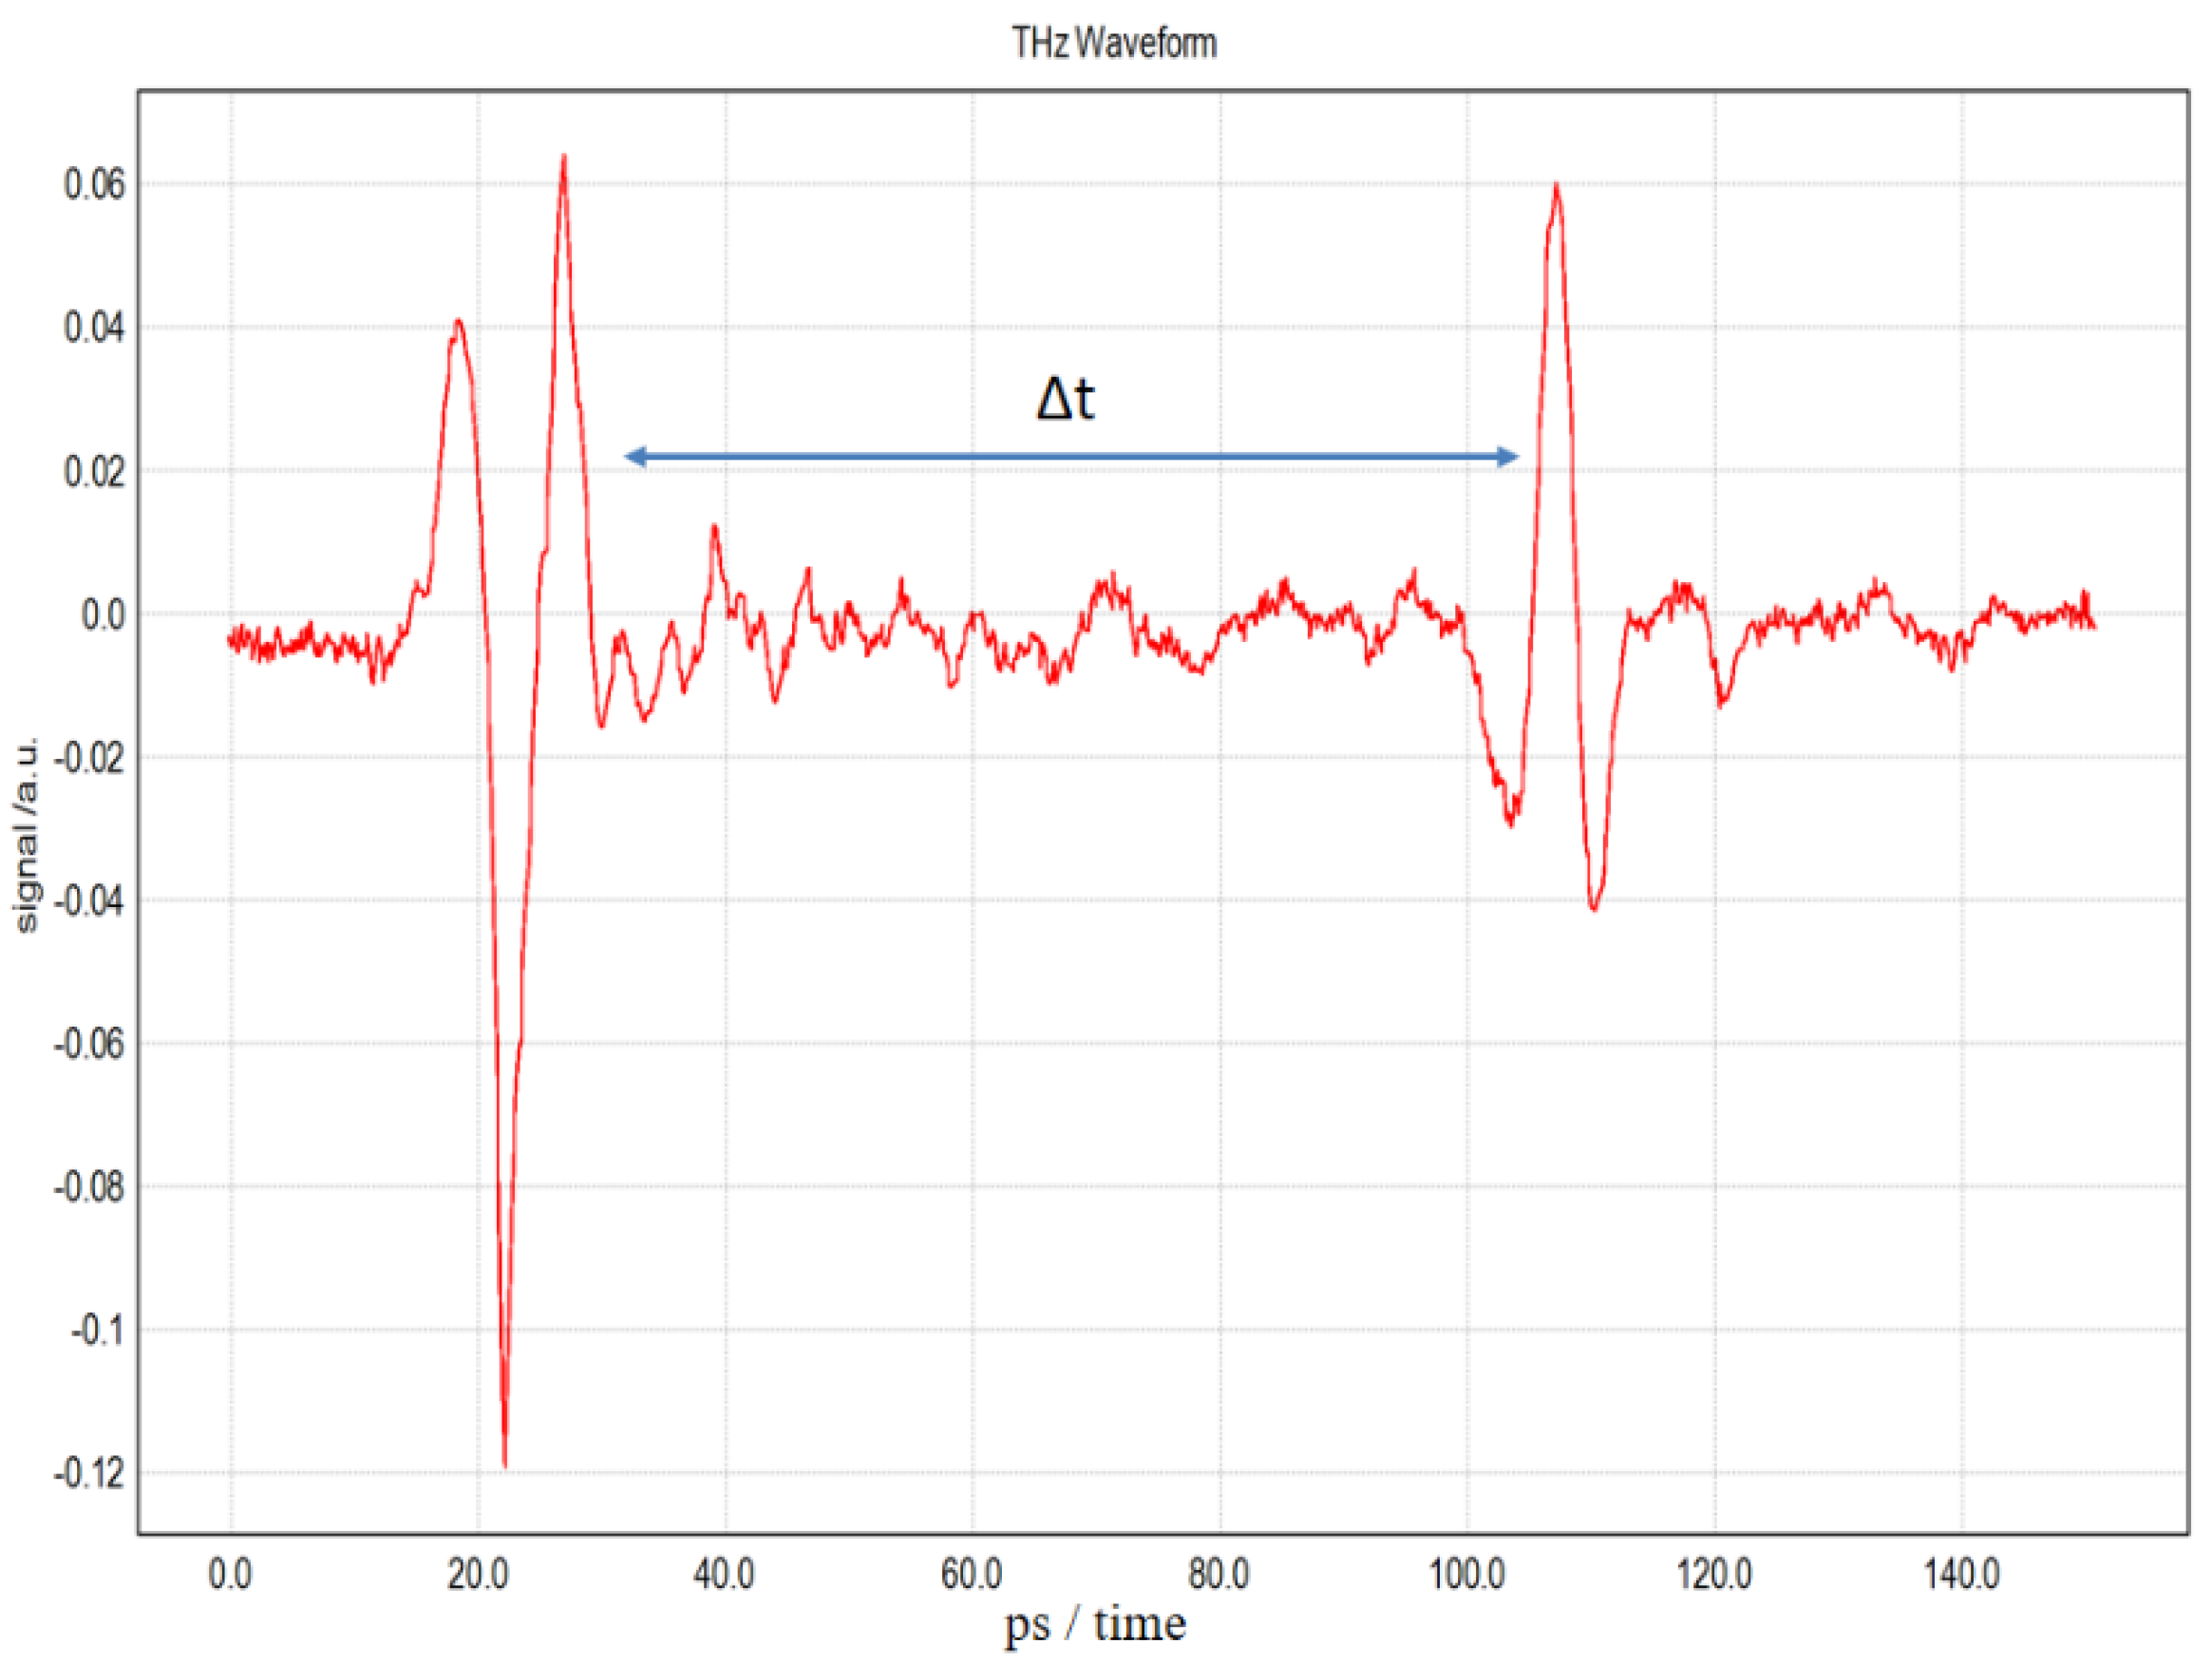
Refractive Index Measurements

A reflection mode for T-rays is applied in the time domain to calculate a refractive index by analyzing the signals of T-rays reflected from the specimen, and a refractive index is induced by catching two surface and bottom signals reflected through the specimen. Figure 1 shows the direction of the T-ray. When a T-ray is reflected from the THz pulse emitter, a refractive index can be solved by utilizing time-of-flight (TOF) for a sample [1].
This reflection mode aims to acquire a refractive index by obtaining a length where the reflected fiber optics are passed through the upper and lower sides of the specimen out of the T-ray TOF.
Figure 1 shows the shape and direction of a T-ray. T in the figure refers to the transmitter, and R refers to the receiver; d means the thickness of the sample. Assuming that the T-ray is perpendicular to the sample, the time difference (∆t) can be calculated as follows [2,3,4,5,6]:
Δ t = 2 d v
As shown in Figure 1, the time difference (∆t) between the surface reflection wave and back reflector of the sample can be calculated by considering the time delay due to the sample thickness and the T-ray propagation path in reflection mode.
Δ t = 2 l v = δ C a
where l = d / c o s θ r , δ = 2 l s i n 2 θ a = 2 ( d / c o s θ r ) s i n θ 2 , d refers to the specimen thickness, C a refers to the T-ray speed in the air, n refers to the refractive index, and v refers to the T-ray speed inside the sample [2].
The resonance frequency ( Δ f ) can be expressed as follows when the time delay due to the sample thickness and inclined T-ray path are tracked [2,14].
Δ f = 1 ( 2 d v c o s θ r δ C a ) = 1 ( 2 d v c o s θ r 2 d s i n 2 θ a c o s θ a C a ) = 1 2 d c o s θ r ( 1 v s i n 2 θ a C a )
where d refers to the sample thickness, θ r refers to the inclination angle inside the sample, and θ a refers to the inclination angle in the air. As presented above, the refractive index, which is one of the electromagnetic properties, can be obtained [2].
n 4 A n 2 A s i n 2 θ p 1 = 0
where A is T 2 V a i r 2 / 4 d 2 2 . In addition, T refers to the transmission time through the specimen and θ p 1 denotes the inclination angle inside the sample.
The refractive index can be solved using Equation (5) under the transmission method [2].
n = 1 + Δ t V a i r t
where Δ t refers to the time delay between trials with and without sample and V a i r refers to light speed in the air ( 3 × 10 10 cm/s).

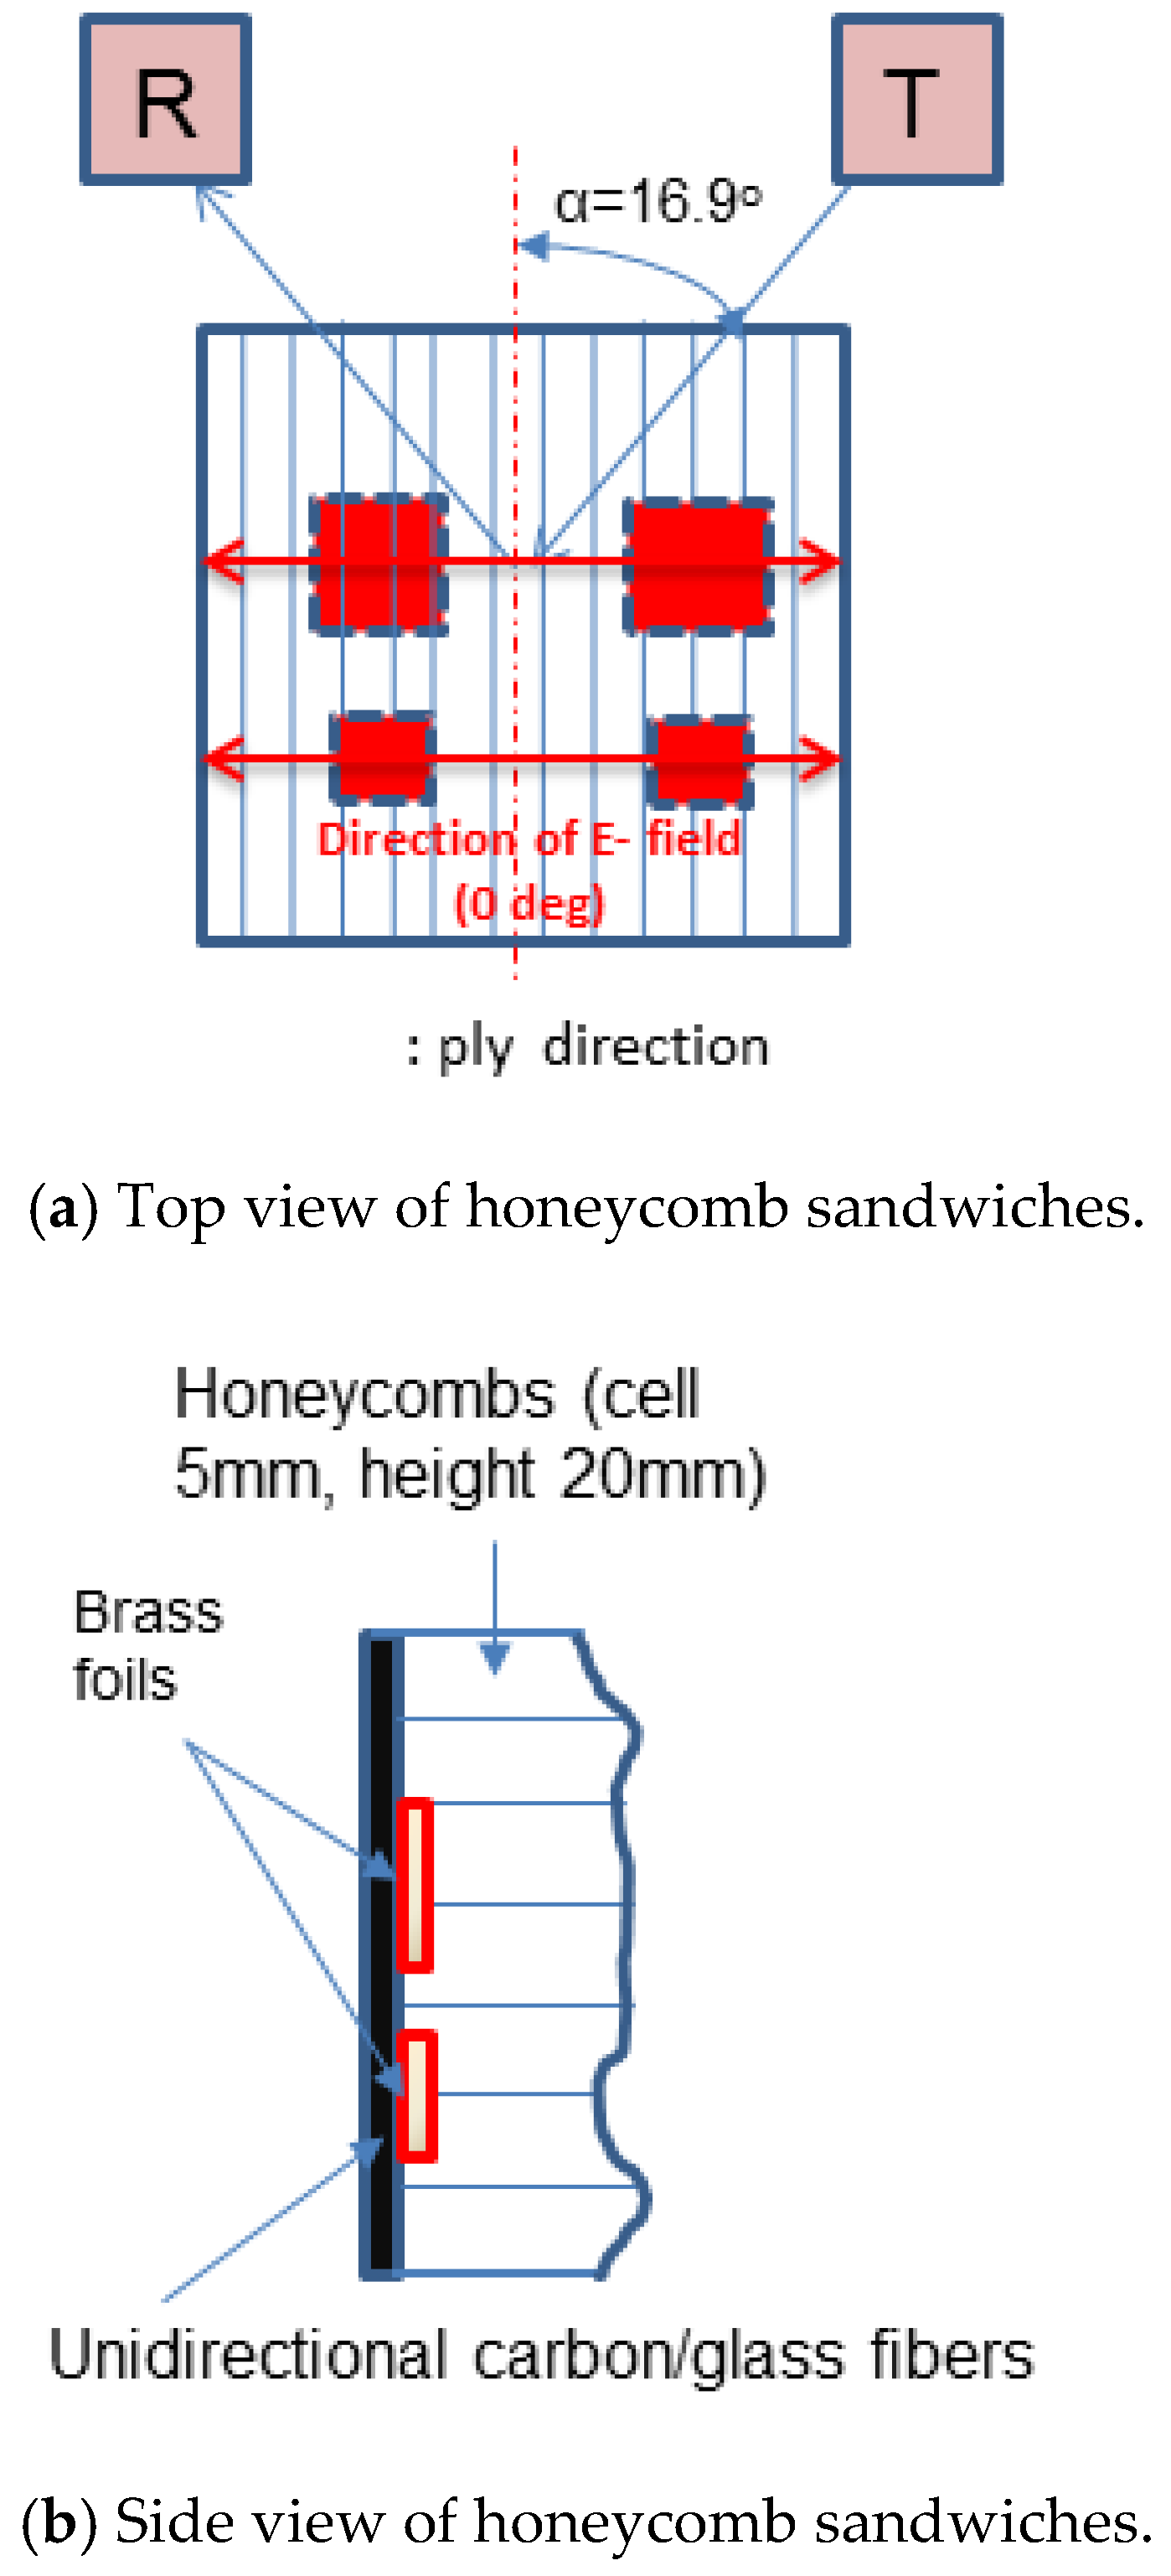
3. Experimental Device and Measurements

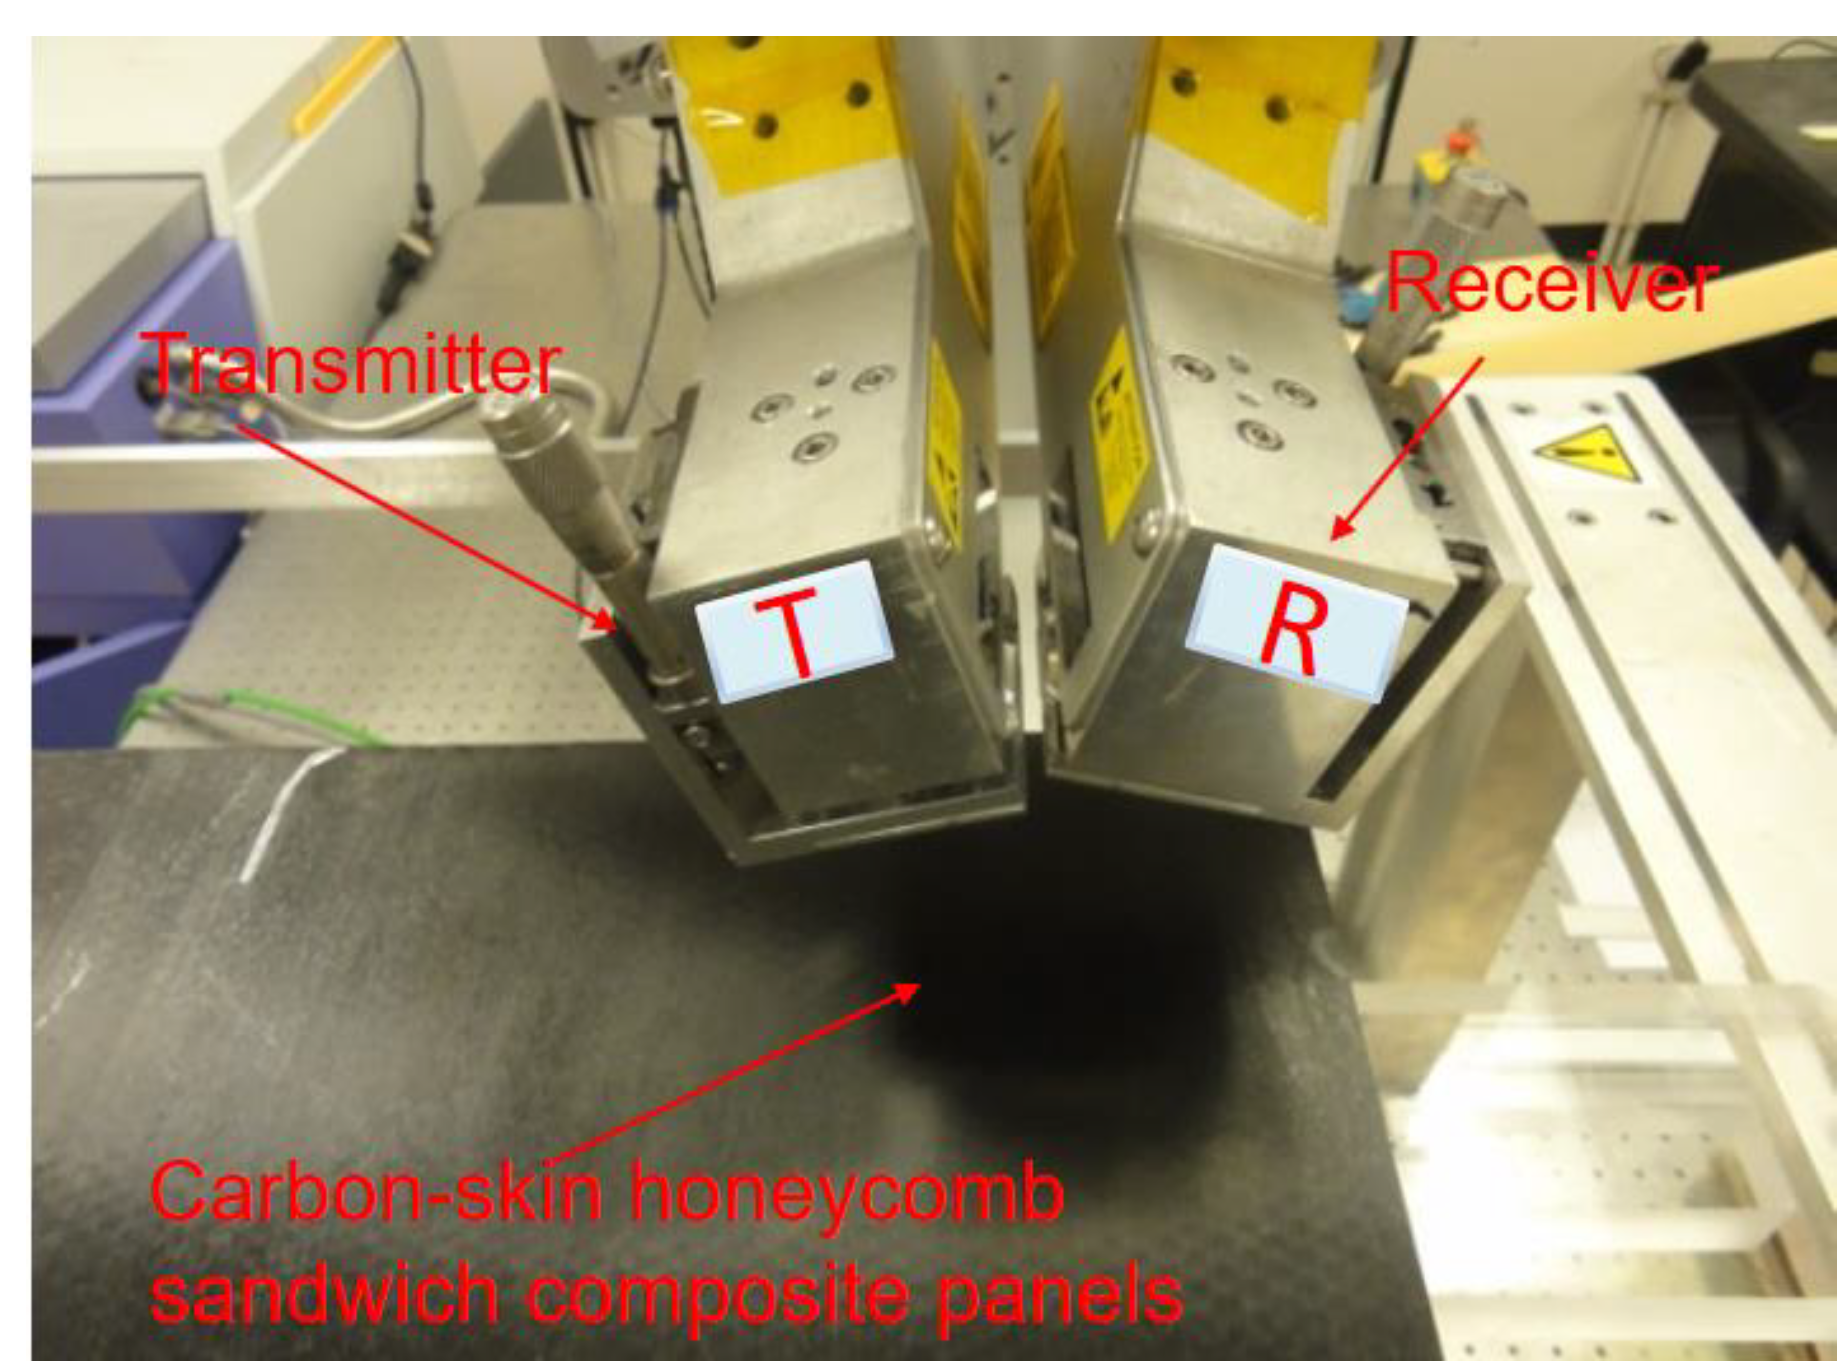
3.1. Measurement Device

Figure 2 shows the test method of nondestructive evaluation (NDE) THz-TDS to test sample characteristics. The NDE system collected and analyzed specimen characteristics and signals. The T-ray system in this experiment was made by Tera View (England). The NDE device consisted of a time–domain spectroscope (TDS) pulse tool and a frequency–domain continuous wave (CW) tool, which are TDS technologies to generate and control T-ray pulses and detect defects. The THz-TDS system acquired signals and valid data with a structural characteristic and optical device to adjust and control T-rays. The TDS device had a frequency bandwidth from 50 GHz to 4 THz, a window range of 300 ps, and was able to implement focal lengths for both 50 mm and 150 mm (full width at half maximum (FWHM)) of T-ray beams. In addition, the TDS system measured either under transmission or reflection mode (a pitch–catch technique with a small angle). The CW system had a frequency bandwidth of 50 GHz to 1.5 THz, with a focal length ranging from 50 mm to 150 mm. The TDS device was connected to the CW device via optical fibers. Figure 3 shows a simplified diagram of the T-ray system, where θ means a different angle surface fiber and E-field direction for the THz-TDS system.

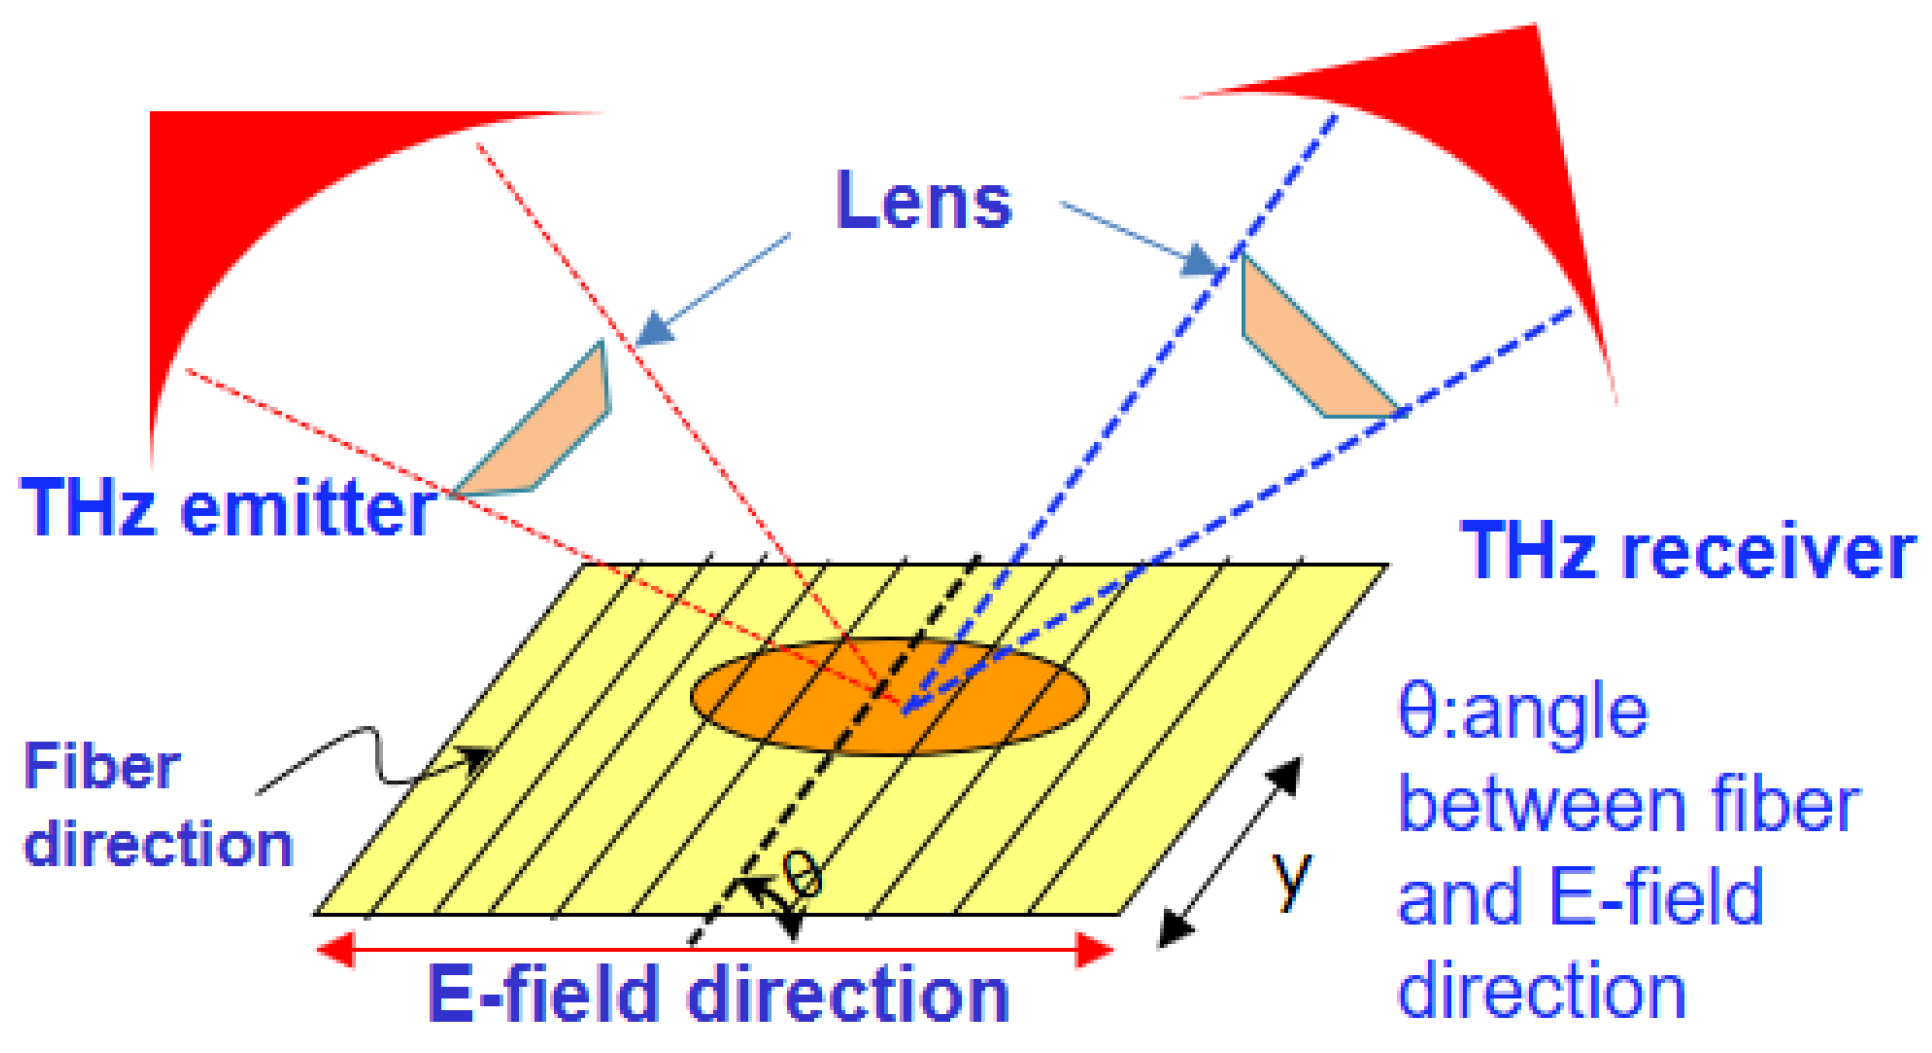
3.2. Measurement Technique

Figure 3 shows the T-ray measurement configuration under reflection mode. At the emitter, a T-ray was generated and sent to the receiver. A preferred sample was prepared with matching focal points for both the emitter and the receiver to conduct the experiment. The inclination angle of the T-ray lens was set to 16.6°. Figure 4 shows samples of carbon-skin and glass-skin honeycomb sandwich composite panels with foreign materials. For the case shown in Figure 4a, the foreign materials were invisible; however, the foreign materials in Figure 4b were visible. Figure 4c shows the locations of inserted foreign materials (brass foils). The dimensions of the foreign matters were 12.5 mm × 12.5 mm × 0.025 mm and 6.3 mm × 6.3 mm × 0.025 mm. Here, unidirectional carbon fibers were utilized and the diameter of fibers is 7 μm. The content of epoxy is around 37.0%.

4. Results and Discussion

4.1. Measurement of the Refractive Index

In order to measure the properties of the materials as T-ray parameters, T-ray pulses were acquired under transmission mode of GFRP composite materials. A time difference in reflection mode between the surface and bottom of the sample can clearly be seen in Figure 5. The GFRP specimen had a thickness of approximately 5.79 mm.
The time difference (Δt) measured using the reflective wave of the specimen was 80.8 ps. Thus, an optical time difference was easily obtained under reflection mode, which was one of the measurement techniques used to calculate the refractive index using Equation (2). The GFRP composite material and Poly methyl methacrylate (PMMA) and GFRP specimens were measured under reflection mode, as presented in Table 1. When compared to data in previous literature, less than 2.0 % difference was revealed [6,12,13,14,15] due to the reflection mode measurement technique of T-rays during the experiment having unidirectional access considering a number of factors; therefore, the experiment was conducted conveniently. It was difficult to compare specimens with existing data because the GFRP samples were different from the existing samples in terms of manufacturing method and characteristics.

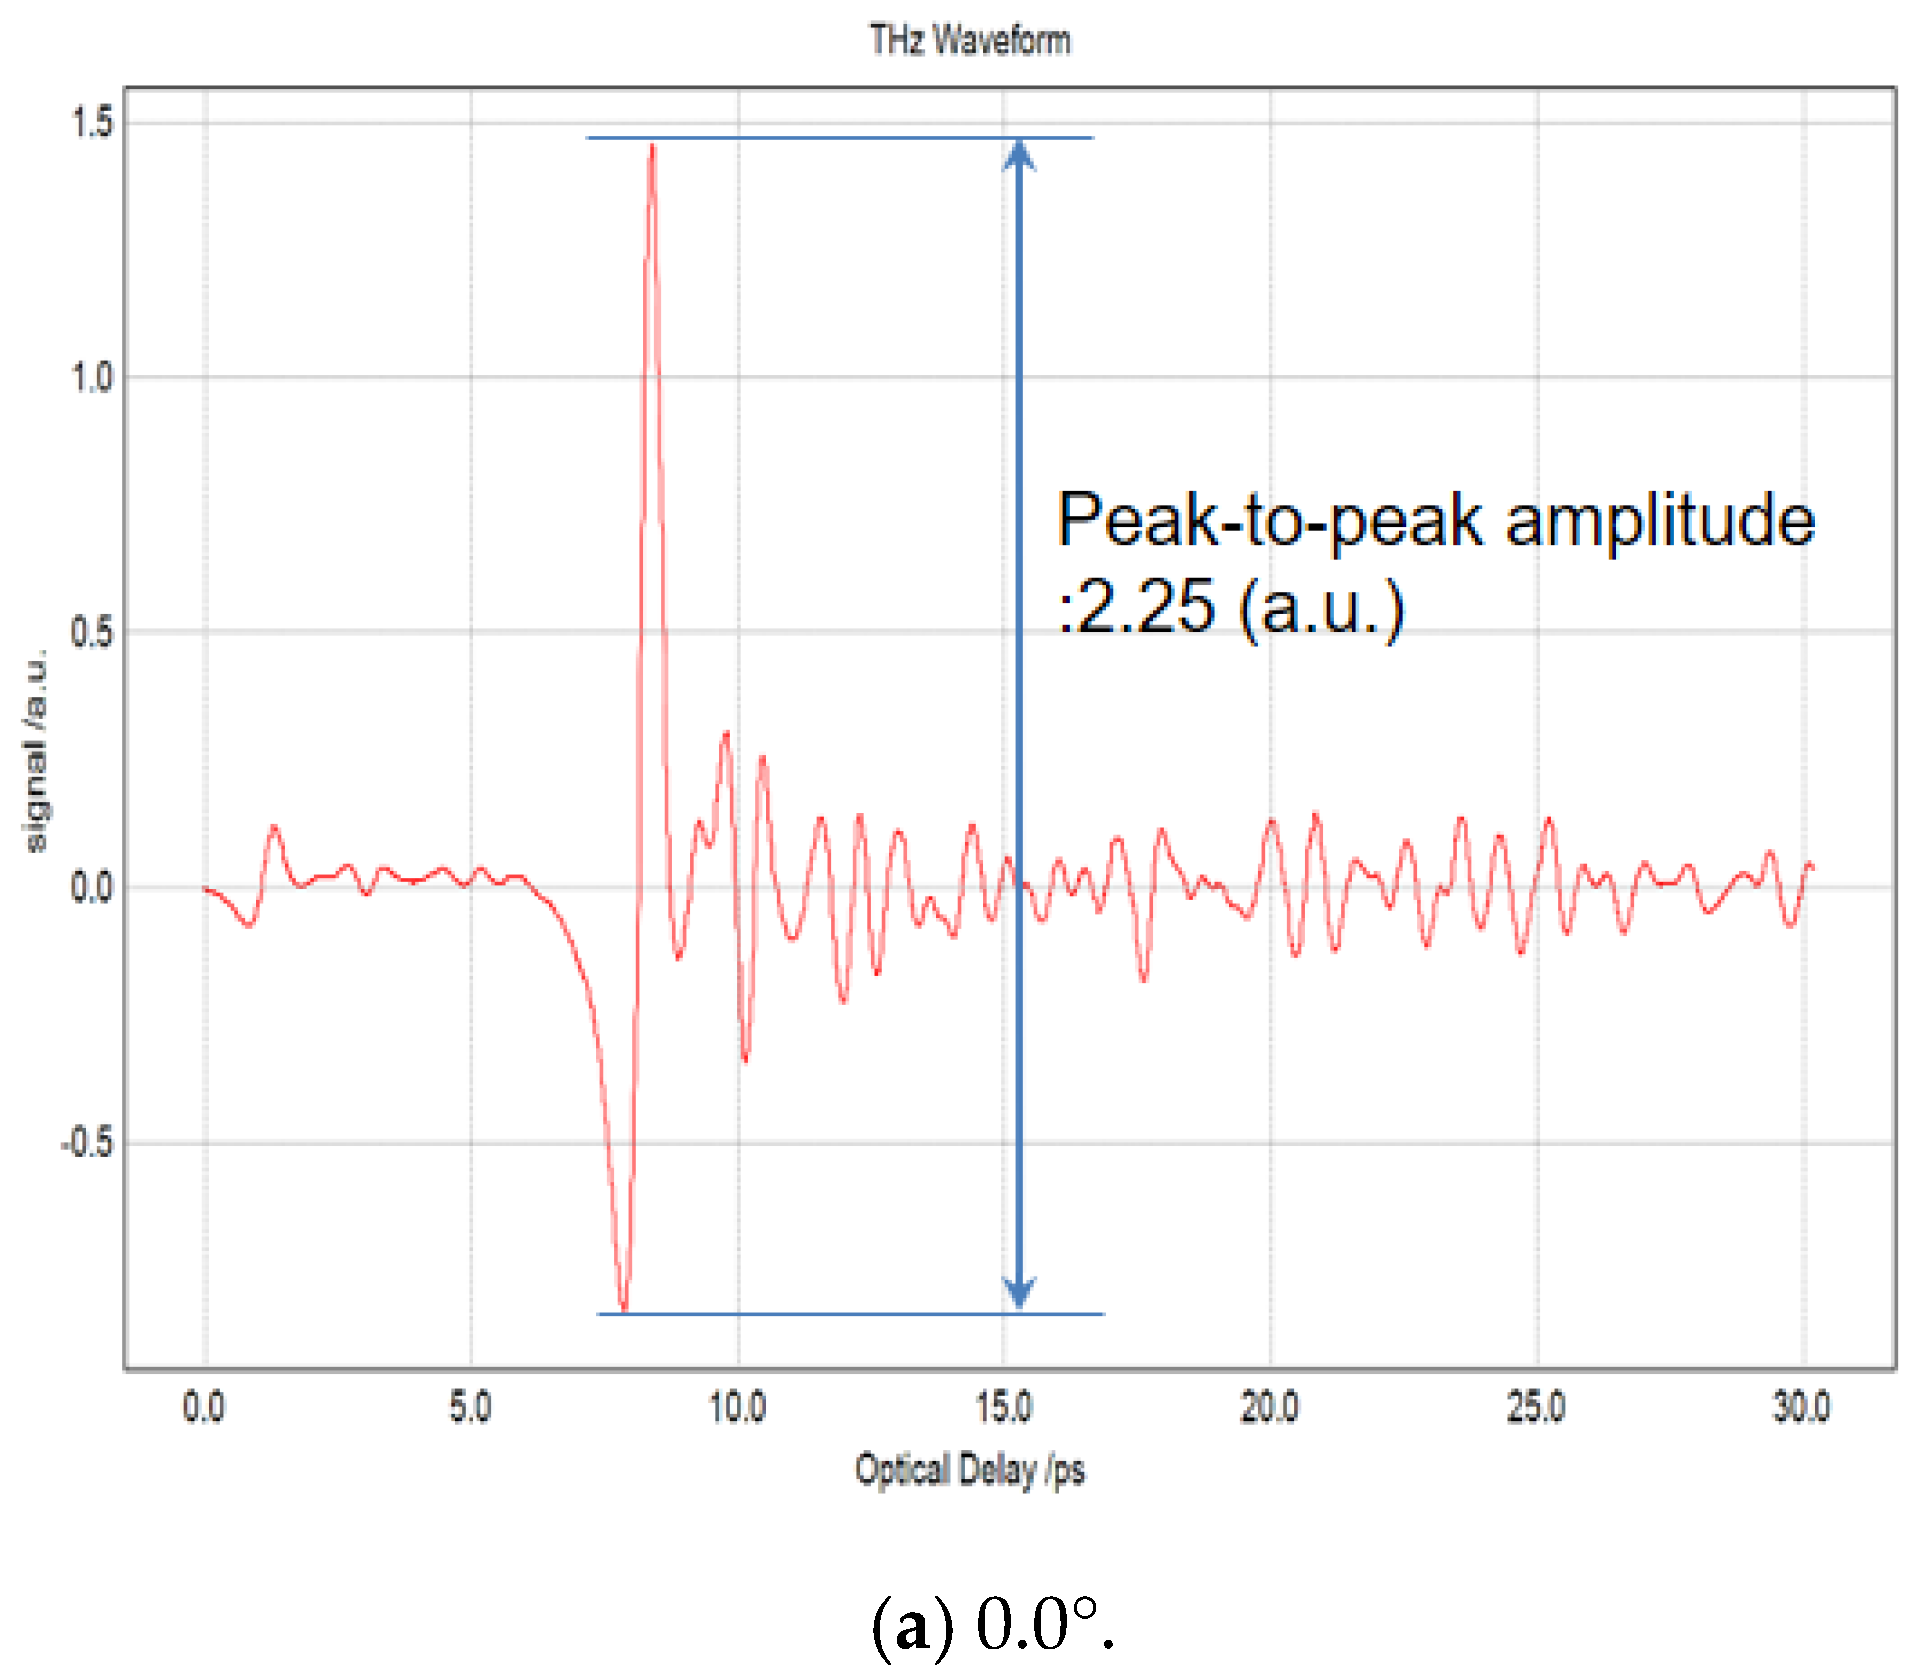
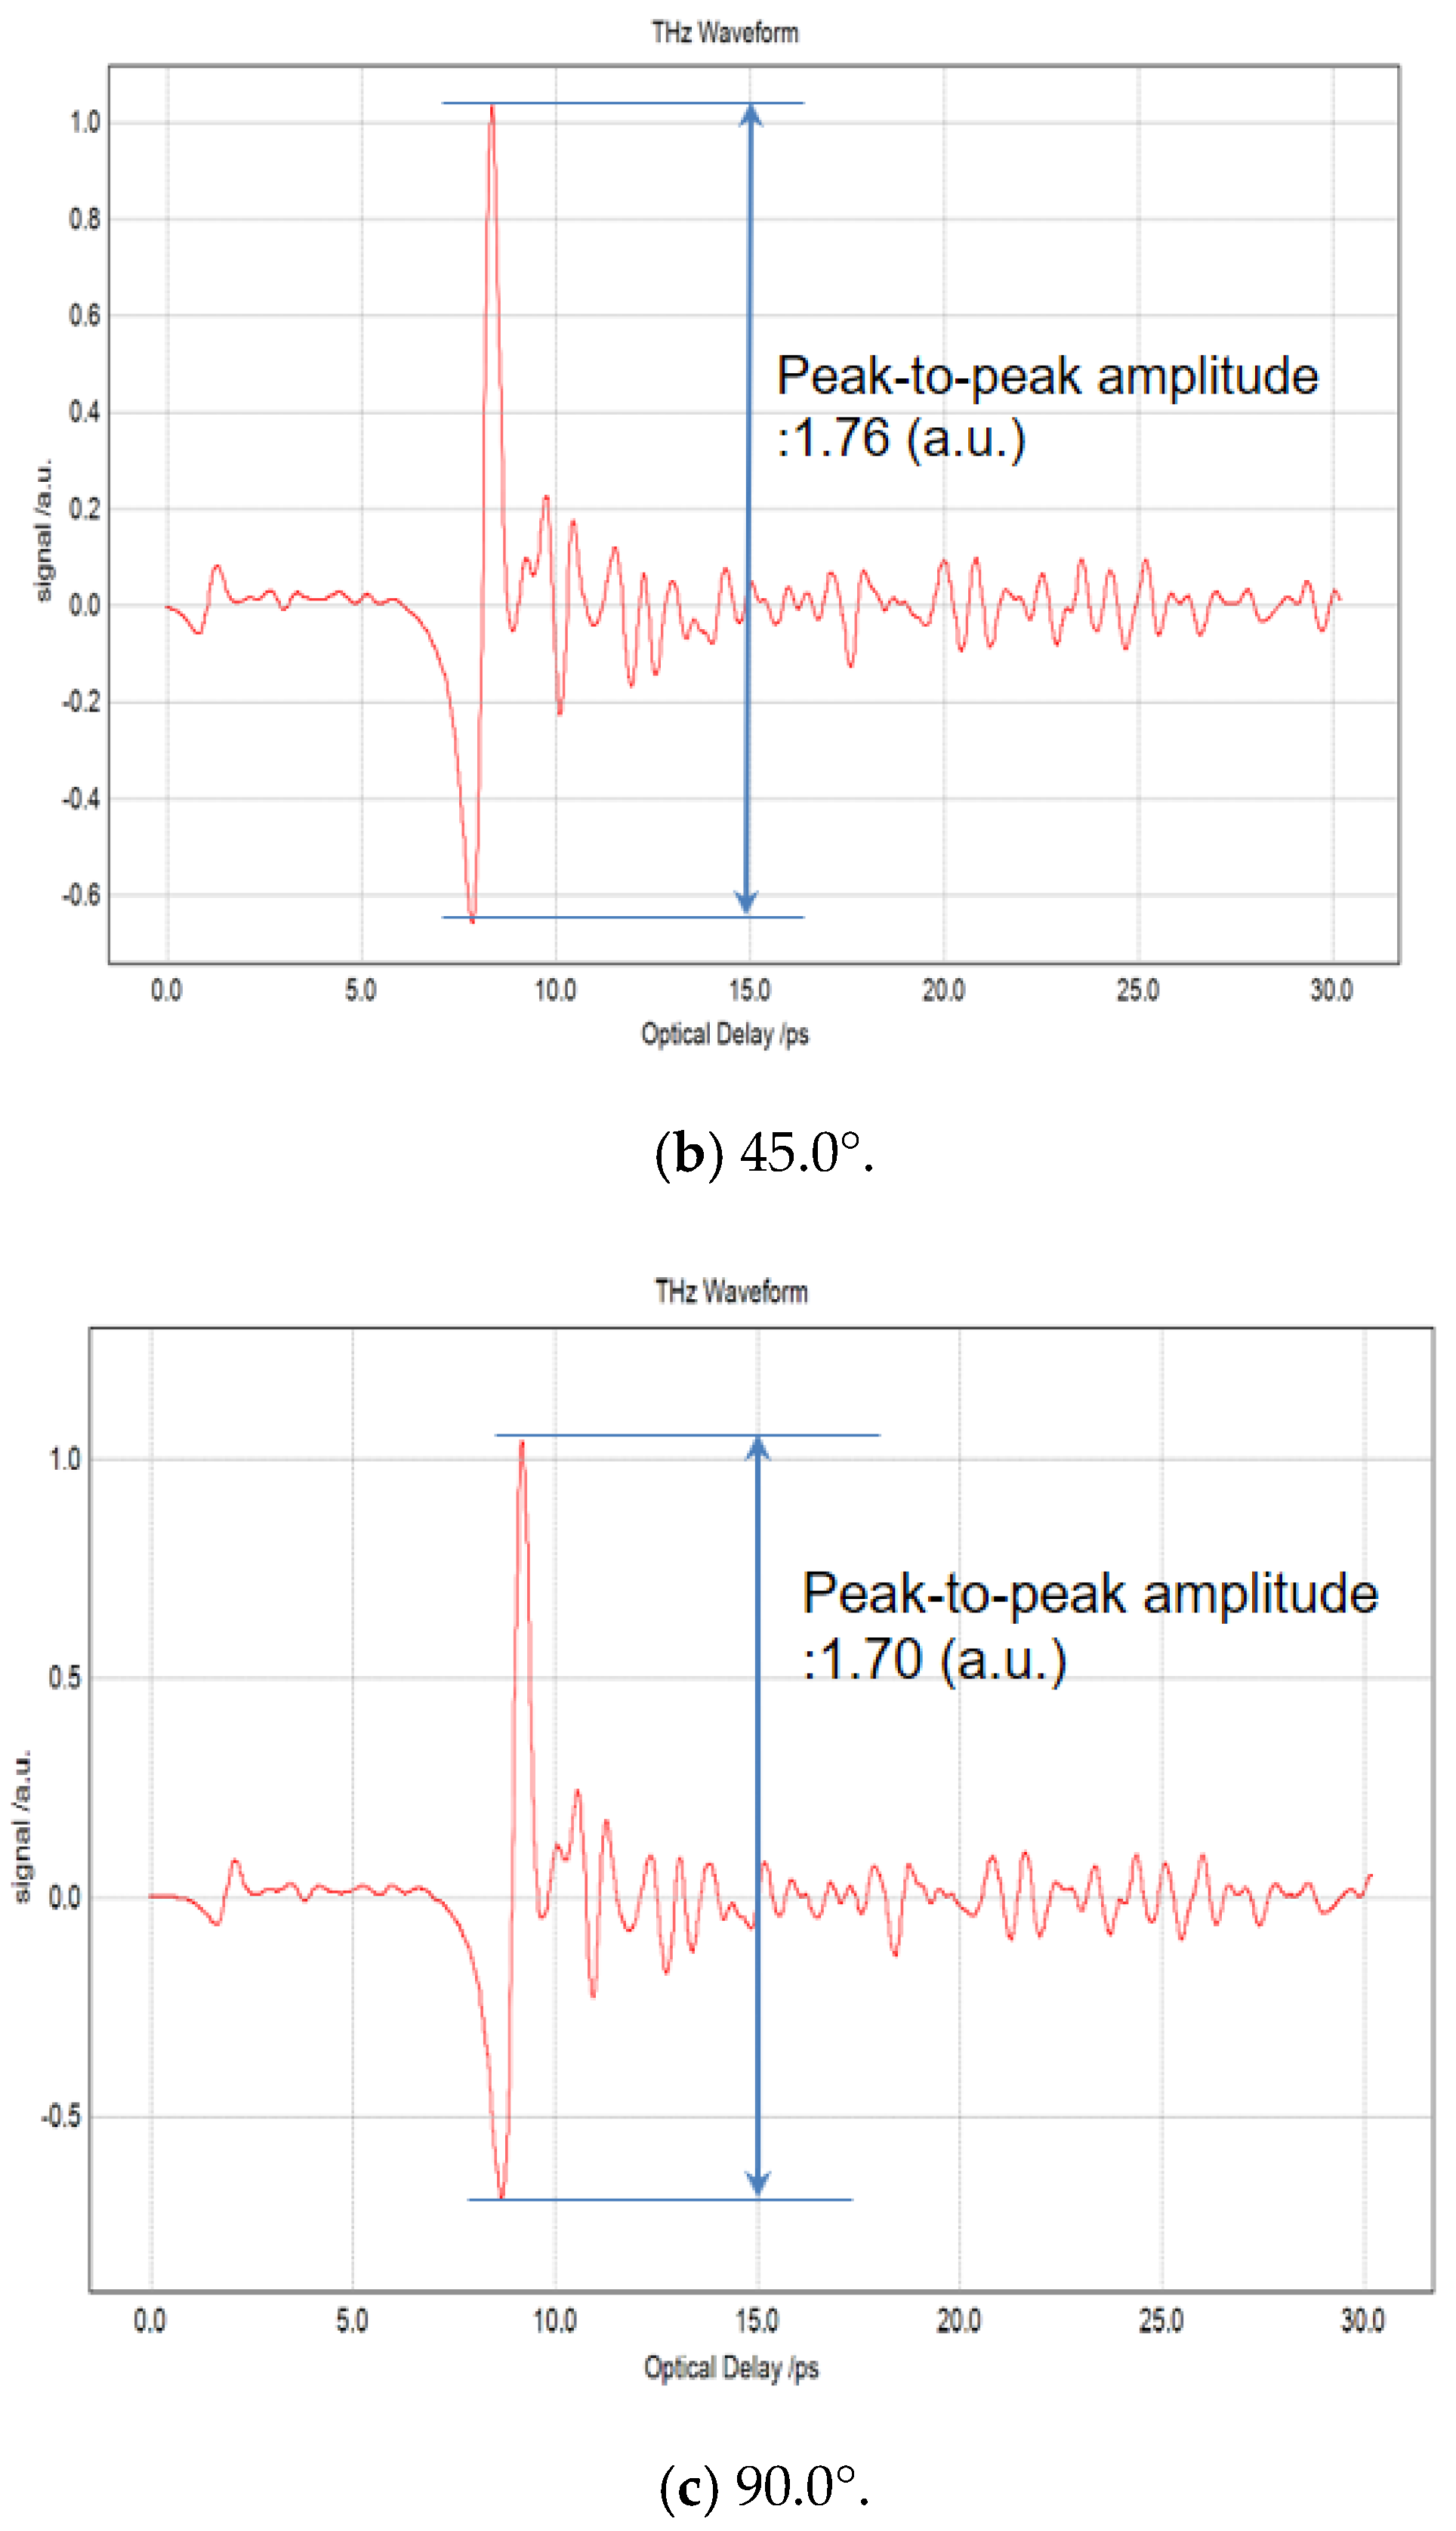
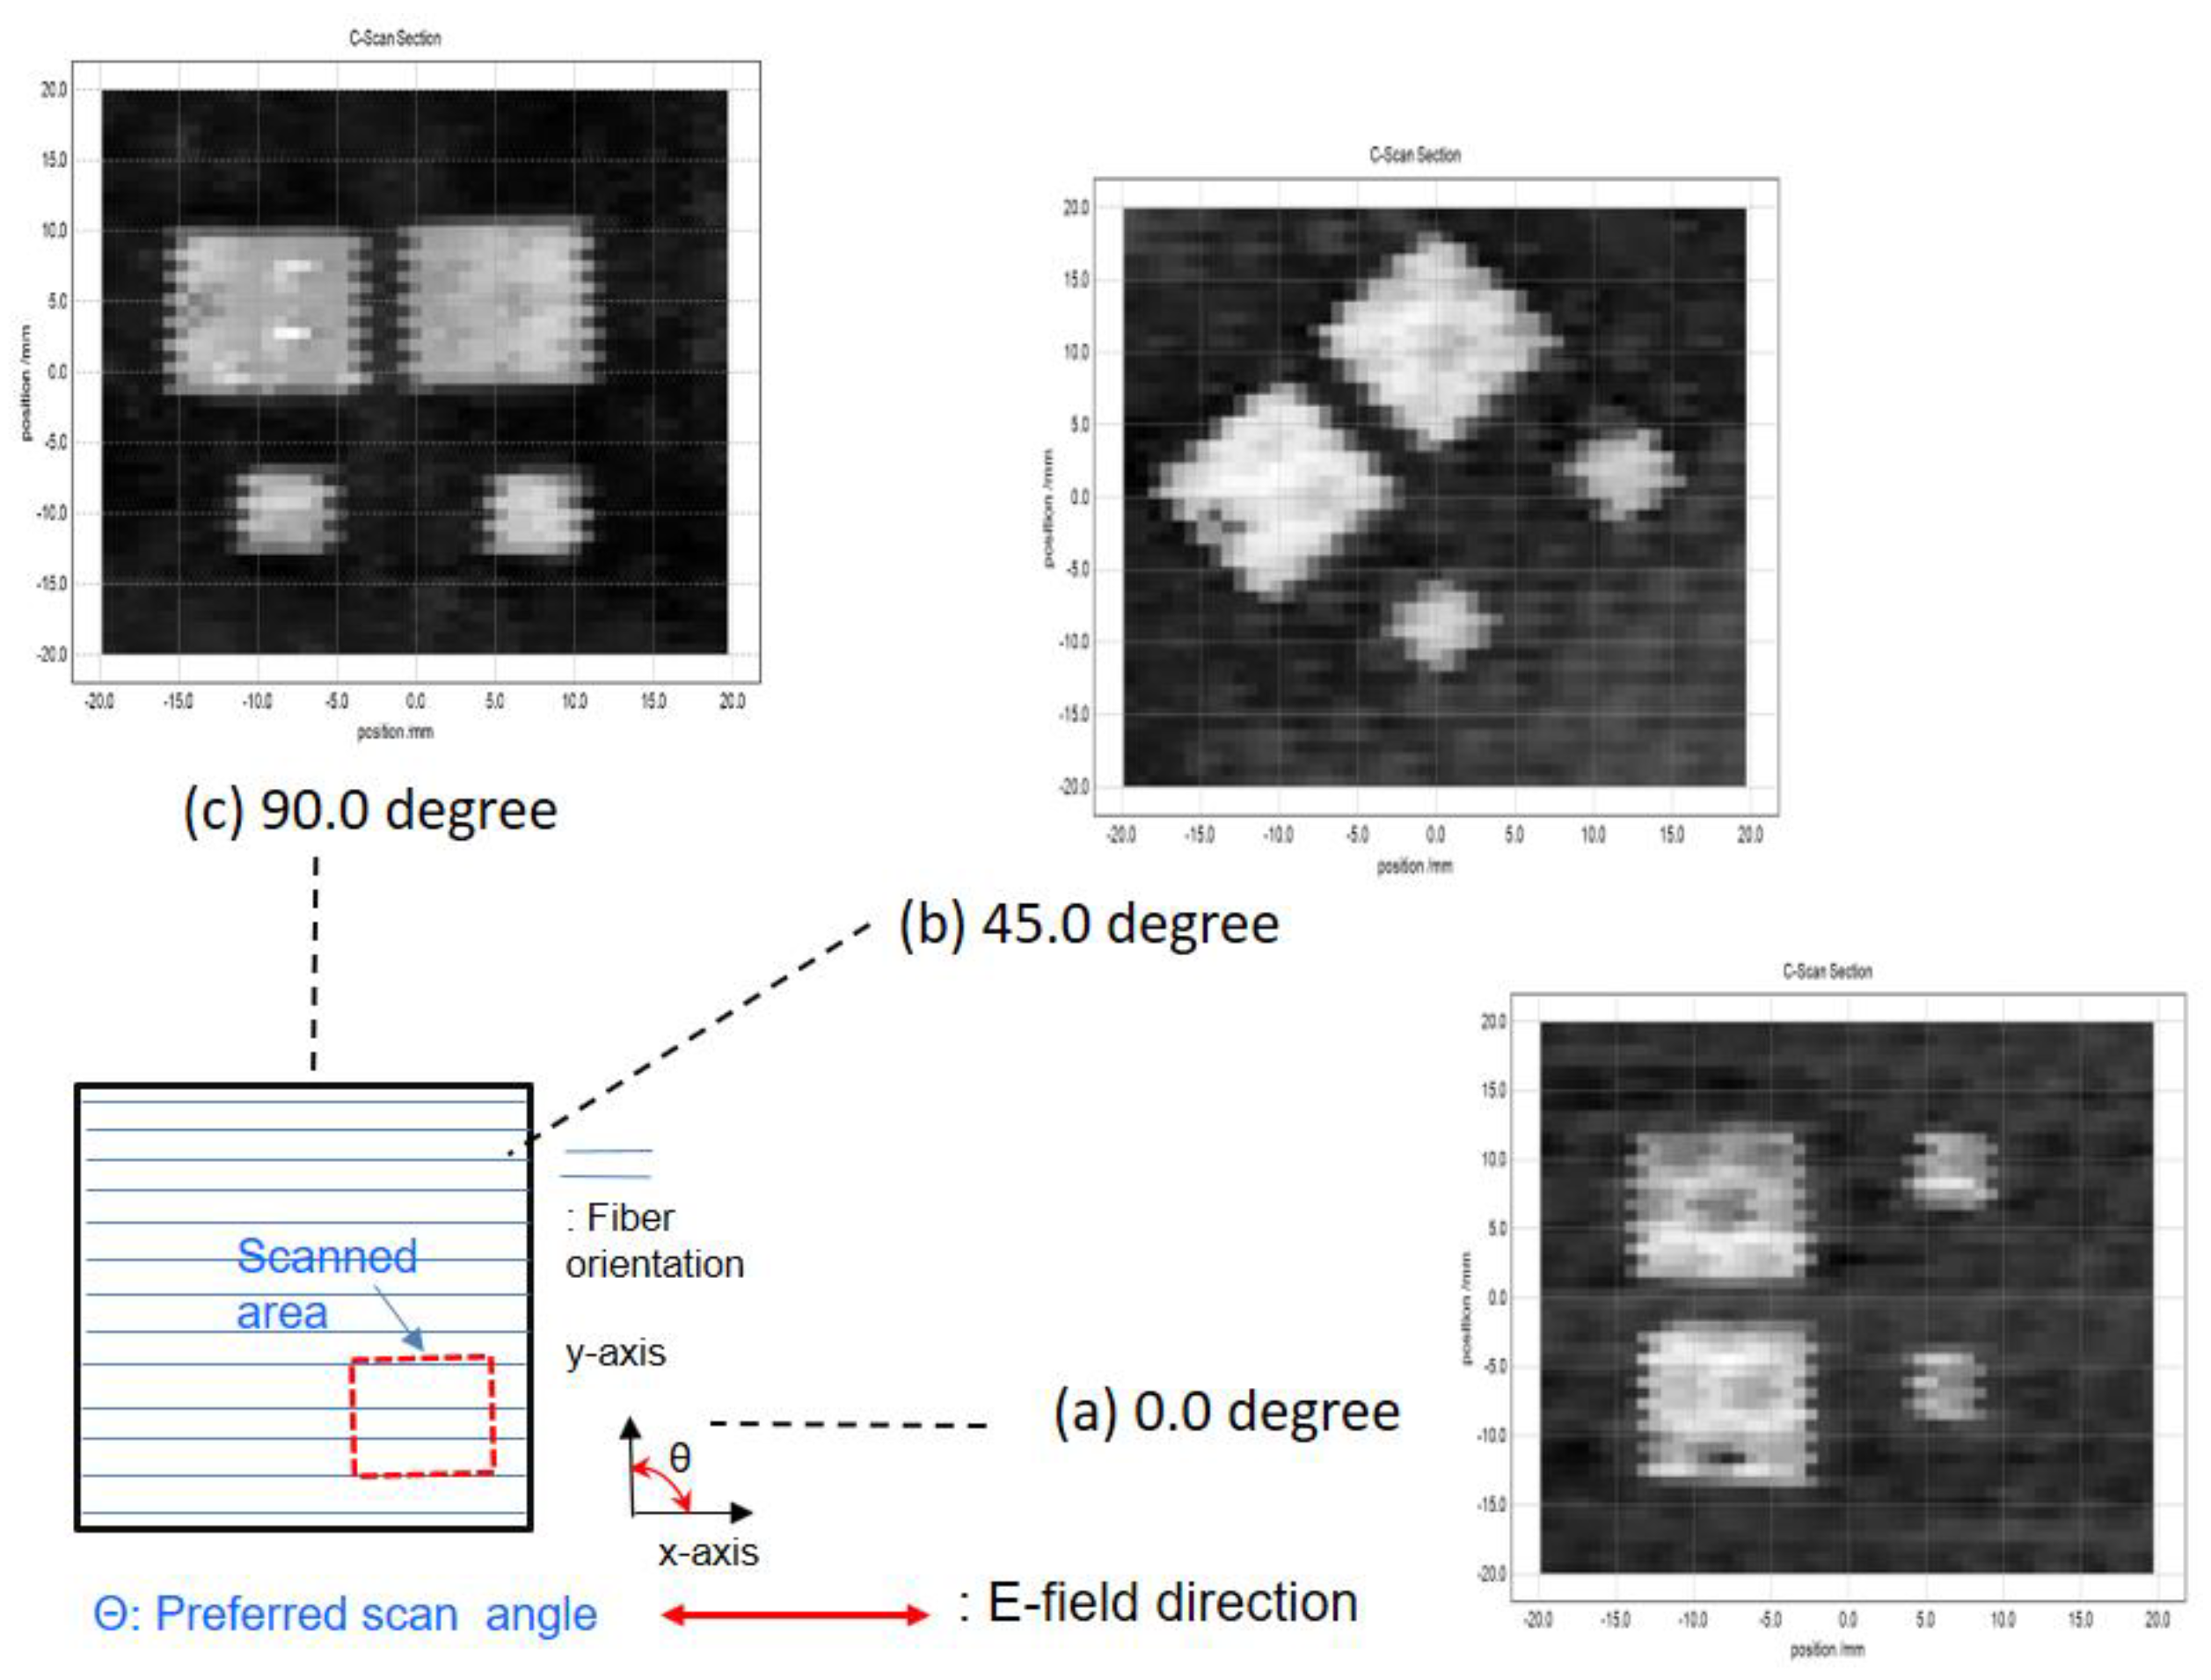
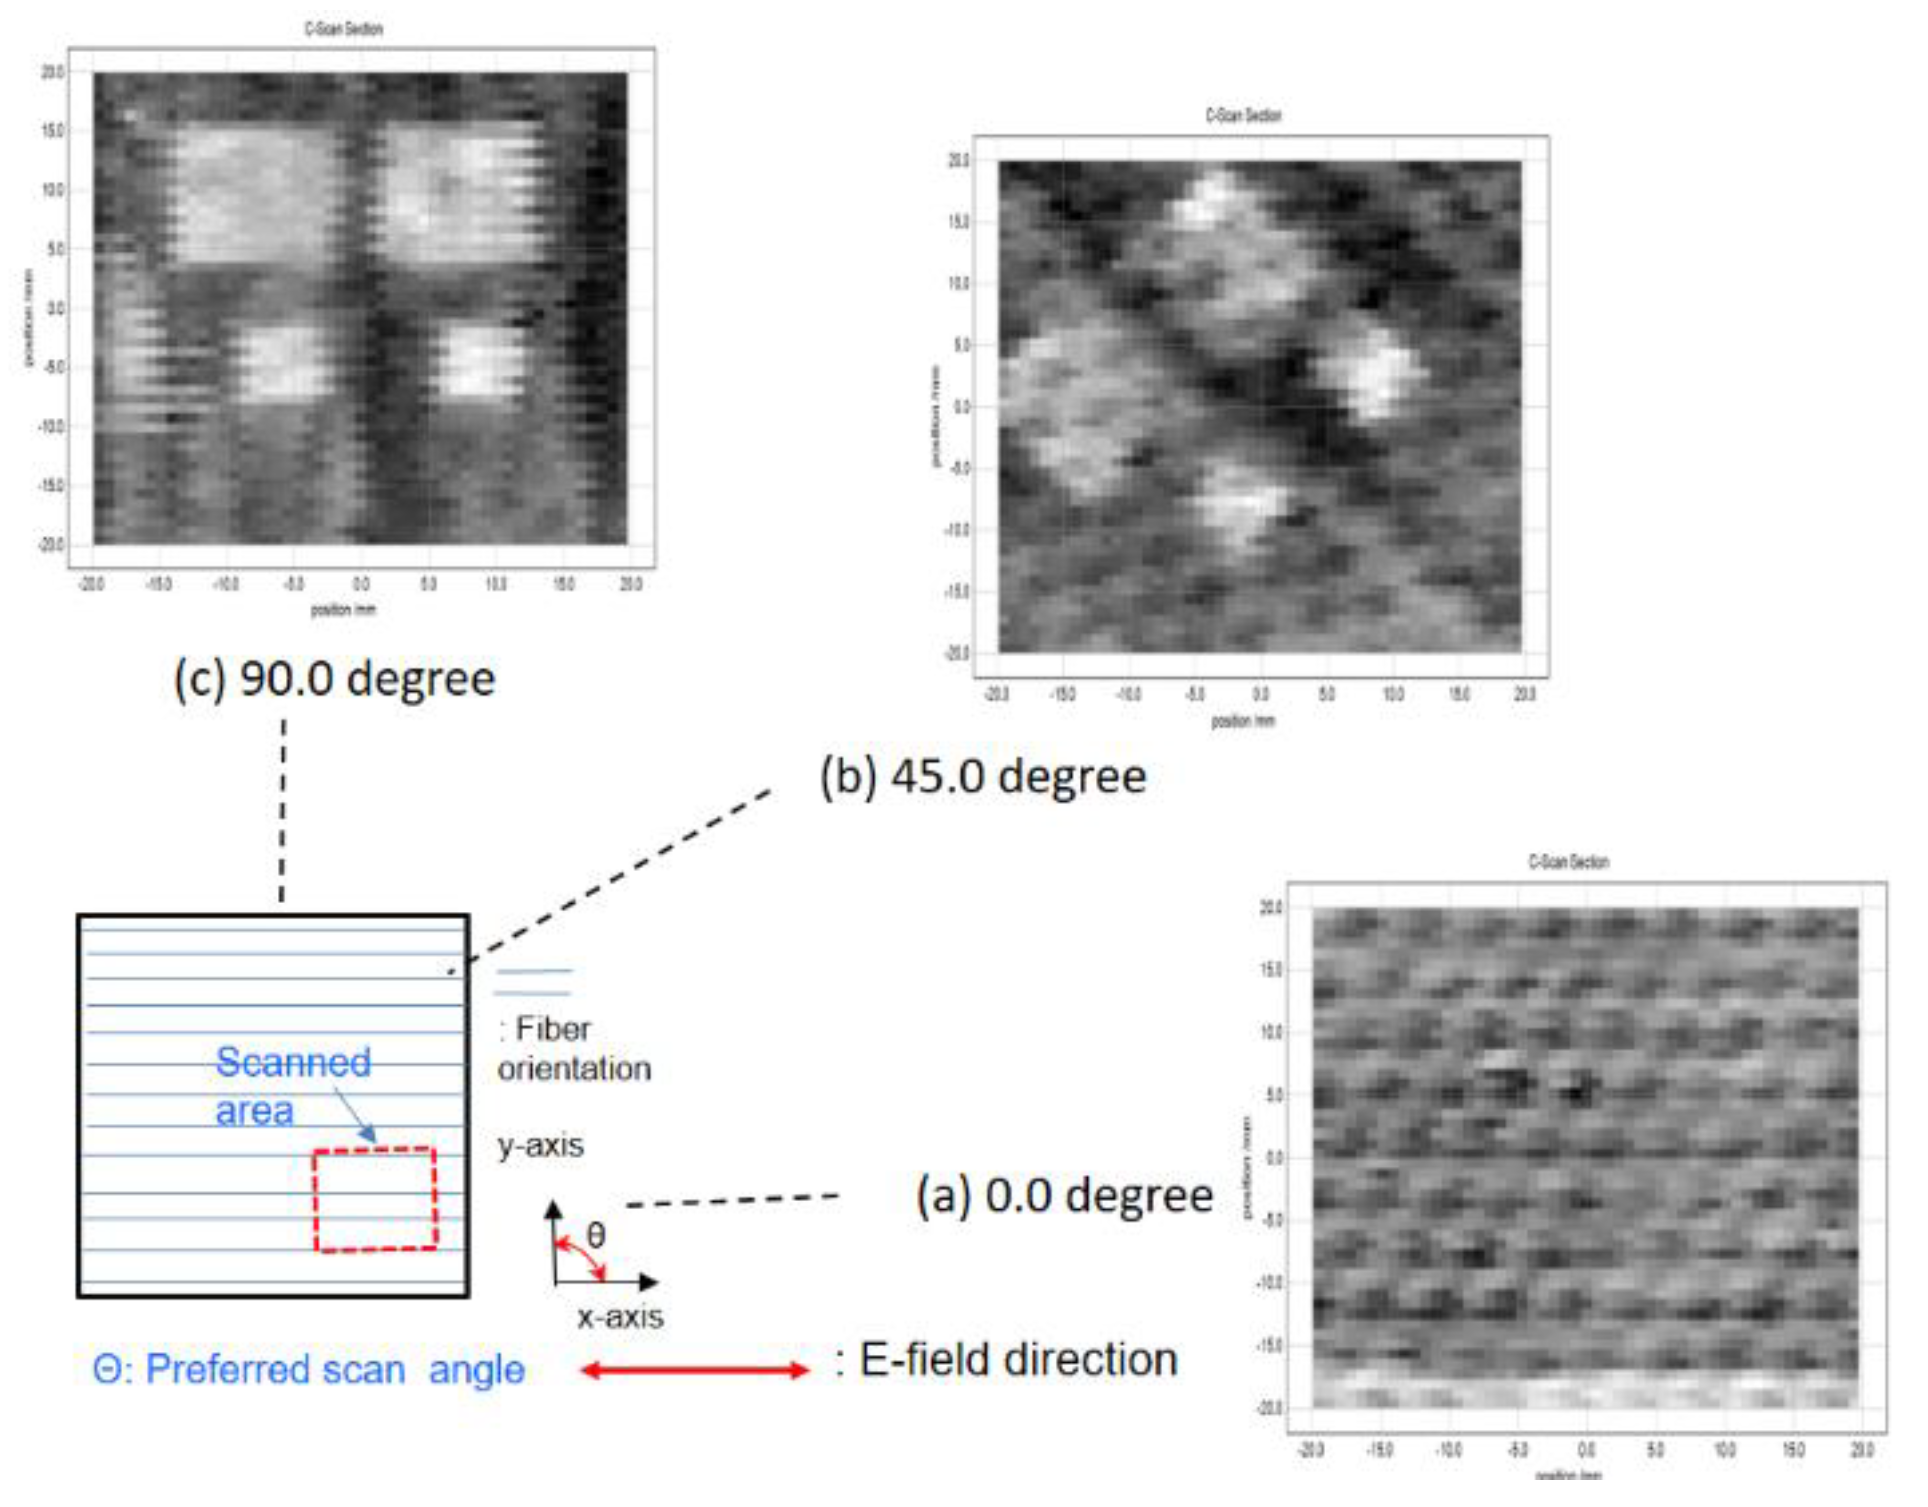
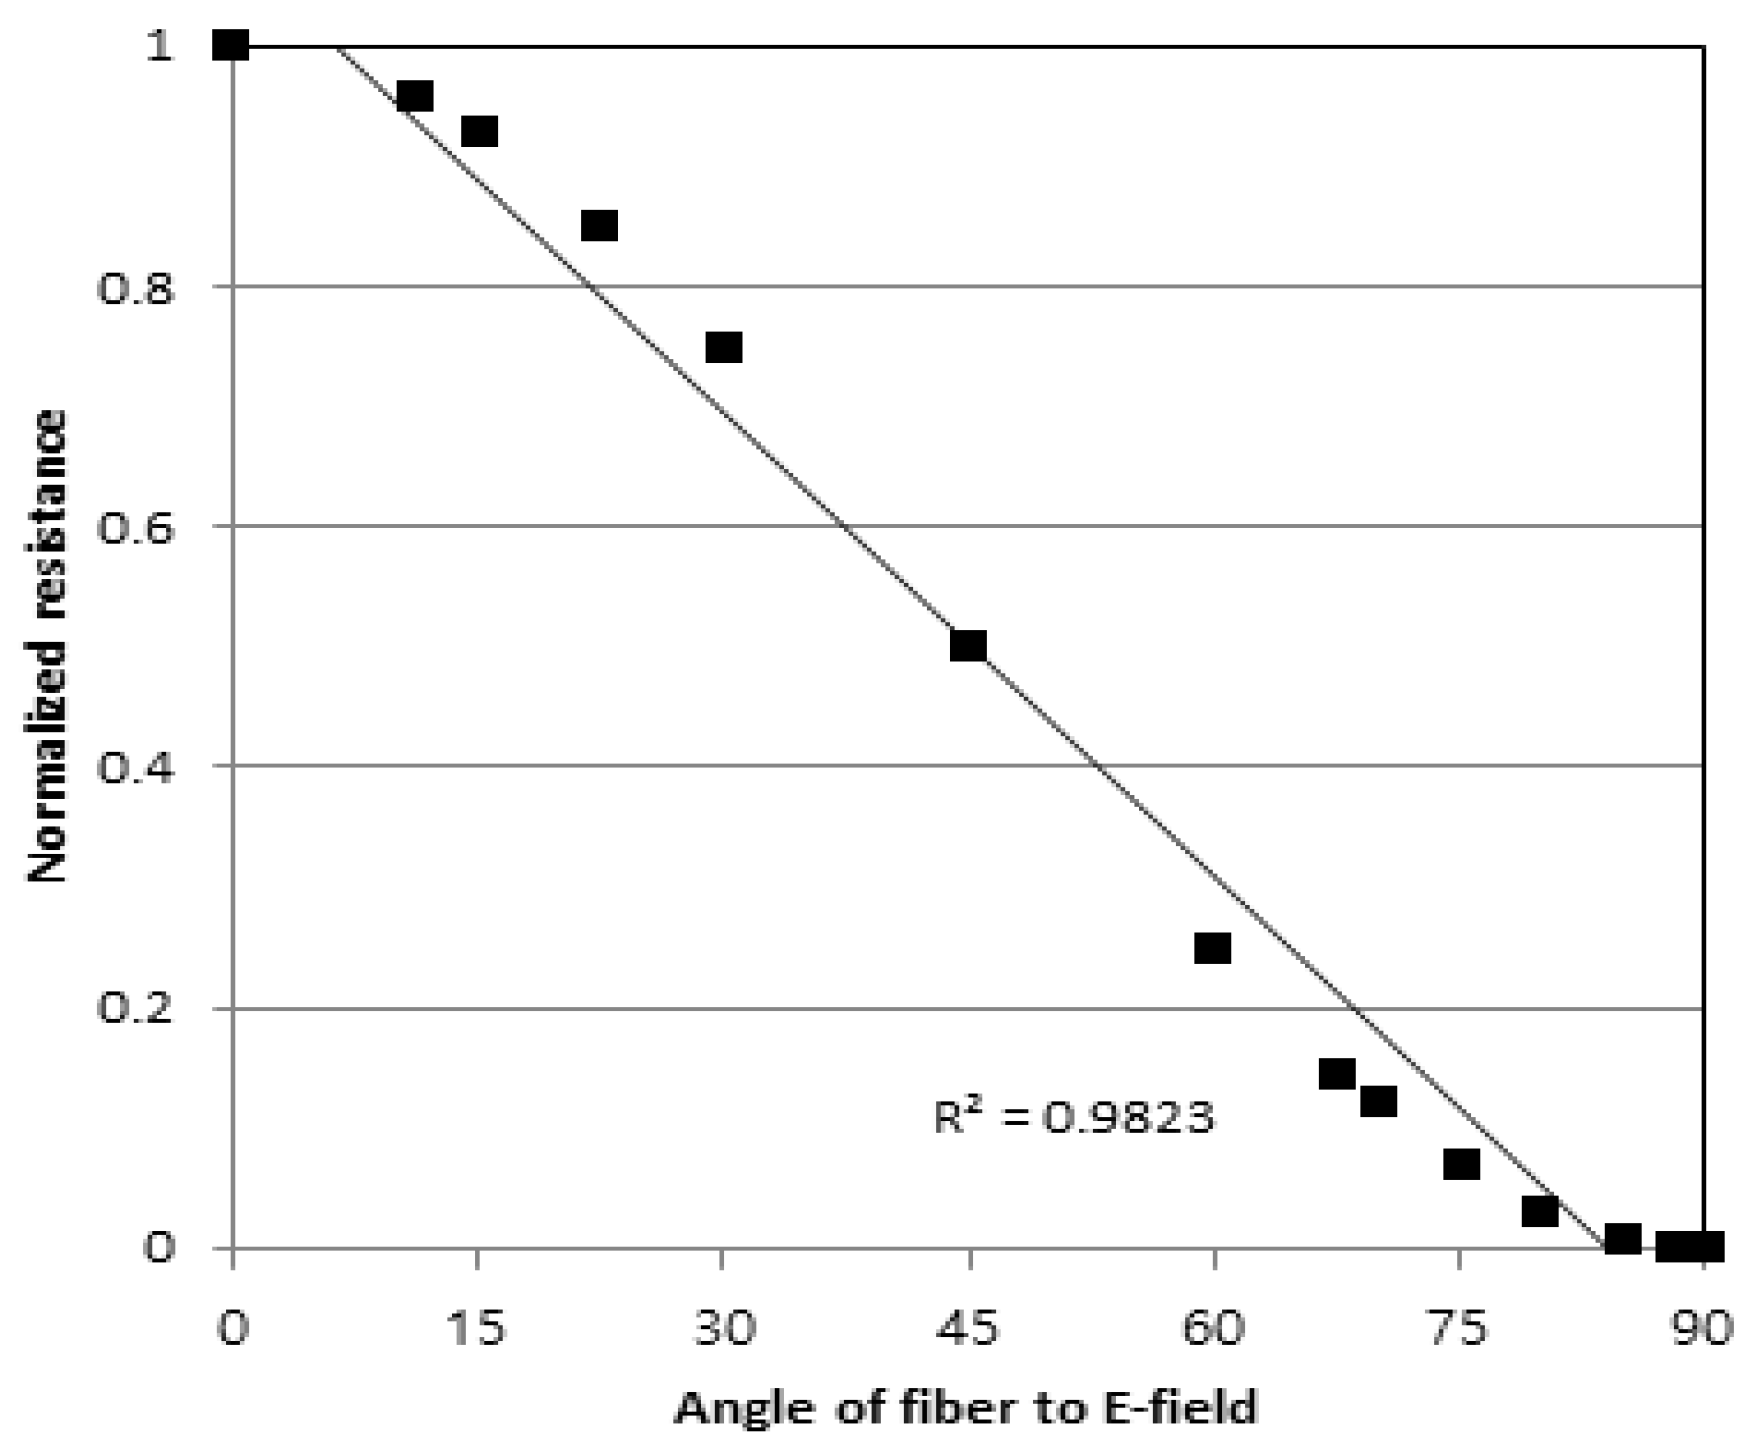
4.2. Evaluation on Electric Field(E-Fields) of Composite Materials

T-rays have limited transmitted power in conductive materials in contrast with nonconductive materials. Even if T-rays are applied and utilized in inspection of carbon fiber composites, in-depth studies are limited. In particular, carbon fiber-reinforced plastics (CFRP) consist of conductive carbon fibers and a nonconductive matrix. When the cross-section of CFRP composites is observed through a microscope, it can be seen to consist of various components, such as fibers and matrices, which significantly affect the conductivity. Because of this, a quantitative evaluation should be performed on characteristics of carbon fiber composites. According to previous study results, the electrical conductivity in the axial direction of a carbon fiber is approximately three orders of amount larger than in the radial direction of carbon fibers.
The CFRP composite is oriented in unidirectionally and the conductivity in a CFRP-laminated plate with various laminations is therefore affected. In particular, the mechanism that generates conductivity in the lateral direction (perpendicular to the fiber axis) depends on contact with fibers occurring between adjacent fibers. Few studies exist regarding the amount of electrical conductivity when using carbon fiber composites. Many studies [6,12,13,14,15] reported that the amount of conductivity ( σ l ) in the axial direction was between 1 × 10⁴ S/m and 6 × 10⁴ S/m and the amount of conductivity (σt) in the radial direction was much wider, in the range of 2 S/m up to 600 S/m [16,17,18], as evidenced by Equation (6).
σ = σ l c o s 2 θ + σ t s i n 2 θ
Since the T-rays are much larger than the conductivity in the radial fiber direction ( σ l σ t ), they can be significantly different according to the relative angle between the angle of carbon fibers and the angle of the electric field when transmitting through unidirectional CFRP composites [17,18]. When an electric T-ray field is parallel with the axial direction of the carbon fibers, conductivity becomes the largest value due to lower transmitted power to carbon fiber composites. However, when the direction of the electric field is perpendicular to the axis of carbon fibers, the conductivity decreases, whereas transmitted power becomes much greater. Using = 104 S/m, the skin depth of the unidirectional CFRP composite using T-rays could be 0.2 mm at 1 THz and 0.5 mm at 0.1 THz when the direction of the electric field is perpendicular to the axis of carbon fibers. The effect of transmitted power on angles of a 12-ply unidirectional CFRP composite-laminated plate was experimentally evaluated using a CW THz device. The T-ray transmitted power at the lower bandwidth (f—0.1 THz) of frequency was found to be greater than that of a noise level over 30 dB. Figure 6 shows the angular dependence of 0.1 THz reflection power. Figure 6a shows the angle between the carbon fiber orientation when the T-ray E-field was 0° and the peak-to-peak amplitude was approximately 2.25. Figure 6b shows the angle between the carbon fiber orientation when the T-ray E-field was 45.0° and the peak-to-peak amplitude was approximately 1.76. Figure 6c shows the angle between the carbon fiber orientation when the T-ray E-field was 90.0° and the peak-to-peak amplitude was approximately 1.70. The above results indicate that transmission power is easily achieved when the vector value in the T-ray E-field direction is 90.0°, thereby demonstrating lower peak-to-peak amplitude. On the other hand, when the vector value is 0°, the transmission power is difficult to generating, resulting in larger peak-to-peak amplitude of the reflection wave was larger and easier penetration.

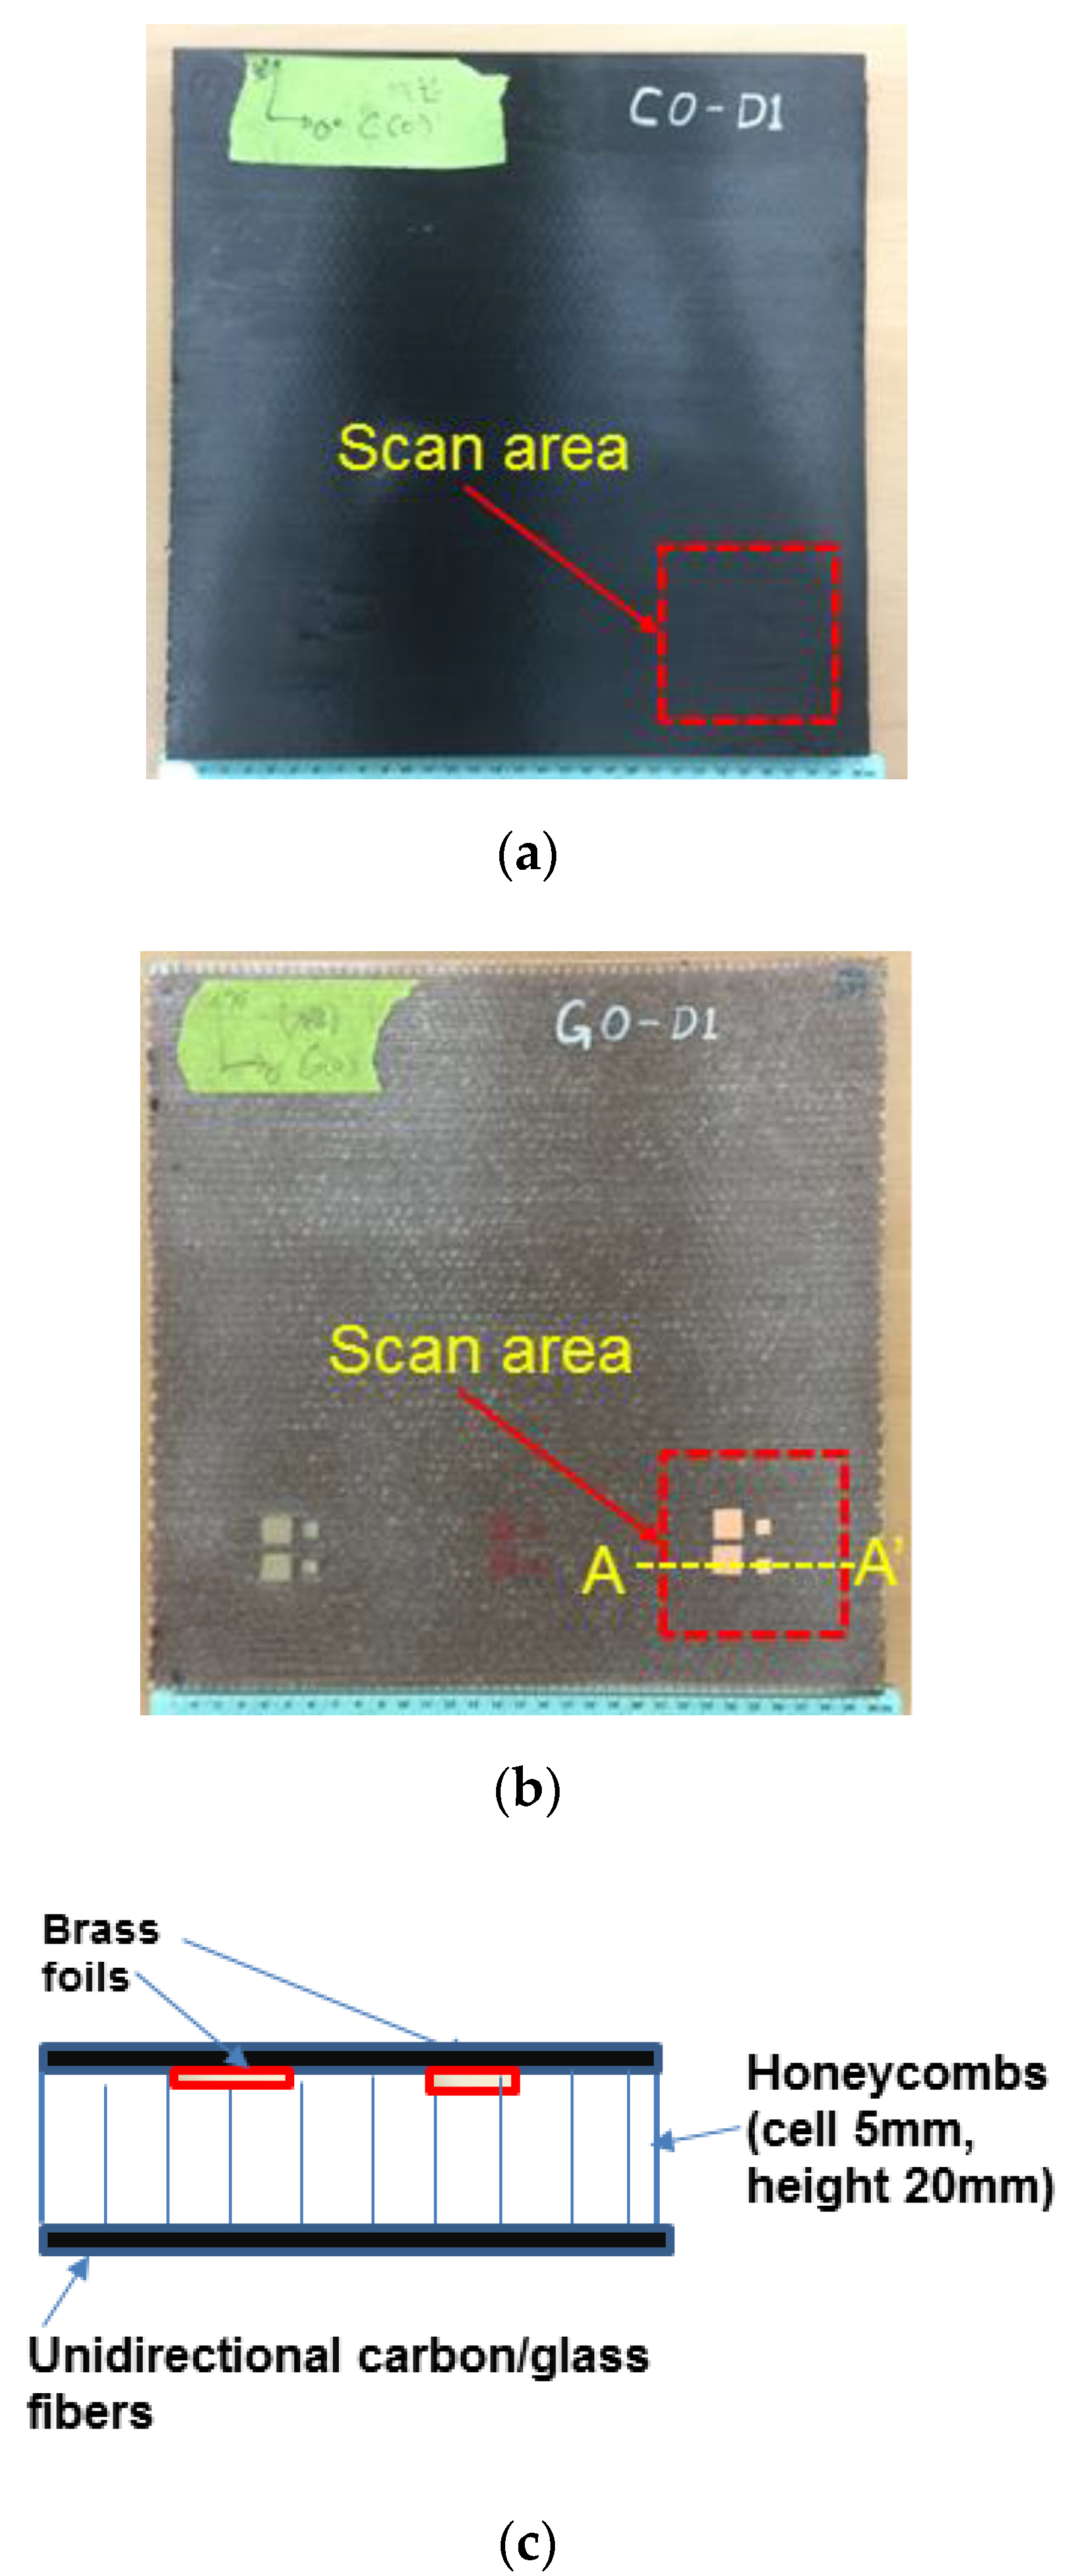
4.3. THz Imaging of Foreign Marerials in Honeycomb Sandwich Composite Panels

The brass foils attached to the bottom of the honeycomb sandwich composite panel using a carbon skin were detected to evaluate the characteristics of T-ray conductivity in the CFRP composite. The brass foils used here were 0.025 mm in thickness and two other dimensions of 12.5 mm × 12.5 mm and 6.3 mm × 6.3 mm. In particular, assuming that the direction of an electric field is perpendicular to the axial direction of carbon fibers and also parallel with the radial direction of carbon fibers, a different angle, θ, exists between the direction of the electric field and the direction of the carbon fibers. Defects were detected in this work under reflection mode using the TDS-THz system.
A correlation between the amount of conductivity and the S/N ratio of defective THz images can be expressed as σ l σ t , with Equation (6) expressed as σ σ l c o s 2 θ . The direction of the E-field and the direction of the carbon fibers were used to analyze the T-ray scan images, showing 1-ply carbon fiber defects in the prepreg sheet. The transmitted power of the T-rays penetrating the 1-ply sheet depends on an angle made between the fiber direction and E-field, allowing the T-ray to be transmitted and reflected from the surface of the sample according to the orientation of the fibers. When considering the simple resistance R equation, a single resistance body was made [6,17,18], allowing us to calculate the conductivity alongside the correlation of conductivity with the S/N ratio in defects from T-ray detection images.
The conductivity is at a minimum when the angle of an electric field is located at a 90° angle to the direction of carbon fibers in single-ply according to Equation σ σ l c o s 2 θ . A signal-to-noise (S/N) ratio of defect image is at its greatest when this sample is positioned in this 90° angle. The S/N ratio could be at its worst at 0 0 ( σ = 1.0 σ t ) angle, which exhibited the largest conductivity. This defect detection method was determined to be valid between the S/N ratio based on a simple model for conductivity according to qualitative matching with the experimental image results.
Therefore, the defect detection resolution of T-rays could be different, depending on the relationship between the direction of the electric field and the direction of the carbon fibers. Figure 7 shows the scanning methods under reflection mode according to various angles made between the T-ray E-field and the fiber direction. Figure 7a shows the top view containing foreign materials. This figure shows the position of the four brass foils attached to the cell in the honeycomb sandwich composite panel using the T-ray scan method. Figure 7b shows the side view of the honeycomb sandwich composite panel, in which the position of the foreign materials between the cell of the honeycomb sandwich panel and the fiber skin can be seen. The dimensions of the foreign materials were 12.5 mm × 12.5 mm × 0.025 mm and 6.3 mm × 6.3 mm × 0.025 mm.
Figure 8 shows the implemented scan image using T-ray reflection mode. The specimen was the honeycomb sandwich composite panel with a glass fiber skin containing foreign materials processed between the glass fiber skin and the cell panel. The glass fiber orientation was changed to 0.0°, 45.0°, and 90.0° depending on the direction of the E-field to check the defect detection performance during scanning conduction. Figure 8a shows the scan image with an angle of 0.0° between the E-field and the glass fiber orientation, where four foreign defects were detected. Figure 8b,c show the scan images at 45.0° and 90.0°, where four foreign defects were detected. Thus, T-rays were transmitted through the glass fiber regardless of the T-ray direction due to the fiber glass used as a skin in the honeycomb sandwich panel being a nonconductive material and therefore not affecting the T-ray.
Figure 9 shows the peak-to-peak amplitude-based scan image of a carbon-skin honeycomb sandwich composite panel by setting a time limit of the defection signals using T-ray reflection mode, as shown in Figure 7. The specimen was the honeycomb sandwich composite panel using a carbon fiber skin, in which the foreign matters were processed between the carbon fiber skin and the cell panel. The carbon fiber orientation was changed to 0.0°, 45.0° and 90.0° depending on the E-field direction, and scanning was conducted to check the defect detection performance, similar to that seen in Figure 8. Figure 9a shows the scan image at 0.0° between the E-field and glass fiber orientation, where four foreign defects could not be detected. The surface image only showed the honeycomb cell shape at a regular distance. Figure 9b shows the scan image at 45.0° between the E-field and the glass fiber orientation, where four foreign defects were detected, despite the S/N ratio being somewhat low. Figure 9c shows the scan image at 90.0° between the E-field and the carbon fiber orientation where four foreign defects were detected due to the presence of the highest S/N ratio.
The above results verify that foreign defect inspection of the honeycomb sandwich composite panel using a carbon fiber skin depends significantly on unidirectional carbon fiber locations according to the E-field direction. Figure 9 shows the TDS reflection mode scan image of defects which were observed in the carbon-skin honeycomb sandwich composite panel. Table 2 presents the conductivity levels of the carbon-skin honeycomb sandwich composite panel using the simplified model. Here, θ means the angle between the direction of an axial one-ply fiber and the direction of the electric field and ψ means the angle between the direction of an axial second-ply fiber and the direction of the electric field. These angles used were (a) θ = 0.0°, (b) θ = 45.0°, and (c) θ = 90.0°. As shown in Equation (6), the resistance became minimal when the angle between the E-field and the carbon fiber orientation was 90.0°. In particular, the resistance became maximal when the angle was 0°. Thus, the T-ray could not penetrate the carbon-skin honeycomb sandwich composite panel at all, so the defects could not be detected, as shown in Figure 9a.
Figure 10 shows the resistance size of the E-field reception according to the carbon fiber orientation of the carbon-skin honeycomb sandwich composite panel. In particular, since the resistance was smallest when the angle between the carbon fiber orientation of the carbon-skin honeycomb sandwich composite panel and the E-field was 90.0°, the defect signals could be optimized because the transmission rate of the T-ray was very high.
Therefore, when the CFRP skins were utilized as the top layers for the honeycomb sandwich composite panels, the foreign materials in the scanning images were most visible at 90.0°; however, the foreign materials could not be clearly observed at other angles, particularly 0.0°, because the T-rays were unable to penetrate the CFRP skin when the top surface fibers of the honeycomb sandwich composite panels were stacked.

5. Conclusions

This study aimed to investigate the application and utilization of a technique to measure the refractive index (n), which is one of the material properties in various materials using THz waves, and consider a correlation between the angle of an electric field and the fiber angles of CFRP and GFRP composite panels to analyze conductivity. T-ray investigations were successfully performed to monitor the soundness of honeycomb sandwiches composite panels, allowing us to obtain the following THz results of the honeycomb sandwich composite panels:
(1)
The refractive index can be measured under reflection mode using T-rays, particularly with glass-fiber composite materials.
(2)
T-rays have limited transmission power to some degree for carbon-skin honeycomb sandwich composite panels, but T-ray transmission power was found to be related to the vector angles between the direction of the E-field and the direction of carbon fibers, thereby affecting the electrical conductivity of the composite panels and the E-field direction.
(3)
For the glass-skin honeycomb sandwich composite panels, scan images can be obtained using T-rays regardless of the E-field direction due to nonconducting materials. When utilizing carbon skins, optimal experimental techniques based on peak-to-peak amplitude can be acquired approximately at 90° between the direction of the E-field and the direction of carbon fibers, because T-rays can easily penetrate carbon fiber skins in honeycomb sandwich composite panels.
(4)
If T-ray systems can be produced to be inexpensive and portable, they may be highly useful and potentially nondestructive inspection tools in future applications.

Author Contributions

K.-H.I. suggested and designed the experiments; S.-K.K., Y.-T.C. and Y.-D.W. performed the experiments; C.-P.C. and J.-A.J. helped in the accomplishment of ideas and the administration of the experiments. The data were discussed and analyzed and the manuscript was written and revised by all members. All authors have read and agreed to the published version of the manuscript.

Funding

This research was supported by Basic Science Research Program through the National Research Foundation of Korea (NRF) (No. 2018R1D1A1B07049775) and also experimentally helped by the CNDE at Iowa State University, USA.

Conflicts of Interest

The authors declare no conflict of interest.

References

  1. Chiou, C.P.; Blackshire, J.L.; Thompson, R.B.; Hu, B.B. Terahertz Ray System Calibration and Material Characterzations. Rev. QNDE 2009, 28, 410–417. [Google Scholar]
  2. Im, K.H.; Lee, K.S.; Yang, I.Y.; Yang, Y.J.; Seo, Y.H.; Hsu, D.K. Advanced T-ray Nondestructive Evaluation of Defects in FRP Solid Composites. Inter. J. Precis. Eng. Manuf. 2013, 14, 1093–1098. [Google Scholar] [CrossRef]
  3. Li, M.W.; Liang, C.P.; Zhang, Y.B.; Yi, Z.; Chen, X.F.; Zhou, Z.G.; Yang, H.; Tang, Y.J.; Yi, Y.G. Terahertz Wideband Perfect Absorber Based on Open Loop with Cross Nested Structure. Results Phys. 2019, 15, 102603. [Google Scholar] [CrossRef]
  4. Chunlian, C.; Zhang, Y.; Chen, X.; Yang, H.; Yi, Z.; Yao, W.; Tang, Y.; Yi, Y.; Wang, J.; Wu, P. A Dual-Band Metamaterial Absorber for Graphene Surface Plasmon Resonance at Terahertz Frequency. Phys. E Low-Dimens. Syst. Nanostruct. 2020, 117, 113840. [Google Scholar] [CrossRef]
  5. Zhang, Y.; Wu, P.; Zhou, Z.; Chen, X.; Yi, Z.; Zhu, J.; Zhang, T.; Jile, H. Study on Temperature Adjustable Terahertz Metamaterial Absorber Based on Vanadium Dioxide. IEEE Access 2020, 8, 85154–85161. [Google Scholar] [CrossRef]
  6. Im, K.-H.; Kim, S.-K.; Jung, J.-A.; Cho, Y.-T.; Woo, Y.-D.; Chiou, C.-P. NDE Detection Techniques and Characterization of Aluminum Wires Embedded in Honeycomb Sandwich Composite Panels Using Terahertz Waves. Materials 2019, 12, 1264. [Google Scholar] [CrossRef] [PubMed] [Green Version]
  7. Hsu, D.K.; Lee, K.S.; Park, J.W.; Woo, Y.D.; Im, K.H. NDE Inspection of Terahertz Waves in Wind Turbine Composites. Inter. J. Precis. Eng. Manuf. 2012, 13, 1183–1189. [Google Scholar] [CrossRef]
  8. Huber, R.; Brodschelm, A.; Tauser, A.; Leitenstorfer, A. Generation and Field-Resolved Detection of Femtosecond Electromagnetic Pulses Tunable up to 41 THz. Appl. Phys. Lett. 2000, 76, 3191–3199. [Google Scholar] [CrossRef]
  9. Rudd, J.V.; Mittleman, D.M. Influence of Substrate-Lens Design in Terahertz Time-Domain Spectroscopy. J. Opt. Soc. Am. B 2000, 19, 319–329. [Google Scholar] [CrossRef]
  10. Gregory, I.S.; Baker, C.; Tribe, W.; Bradley, I.V.; Evans, M.J.; Linfield, E.H. Optimization of Photomixers and Antennas for Continuous-Wave Terahertz Emission. IEEE J. Quantum Electron. 2000, 41, 717–728. [Google Scholar] [CrossRef] [Green Version]
  11. Brown, E.R.; Smith, F.W.; McIntosh, K.A. Coherent Millimeterwave Generation by Heterodyne Conversion in Low-Temperature-Grown GaAs Photoconductors. J. Appl. Phys. 1993, 73, 1480–1484. [Google Scholar] [CrossRef] [Green Version]
  12. Brown, E.R.; McIntosh, K.A.; Nichols, K.B.; Dennis, C.L. Photomixing up to 3.8 THz in Low-Temperature-Grown GaAs. Appl. Phys. Lett. 1995, 66, 285–287. [Google Scholar] [CrossRef]
  13. Zhang, J.; Li, W.; Cui, H.L.; Shi, C.; Han, X.; Ma, Y.; Chen, J.; Chang, T.; Wei, D.; Zhang, Y.; et al. Nondestructive Evaluation of Carbon Fiber Reinforced Polymer Composites Using Reflective Terahertz Images. Sensors 2016, 16, 875. [Google Scholar] [CrossRef] [Green Version]
  14. Li, L.; Yang, W.; Shui, T.; Wang, X. Ultrasensitive Sizing Sensor for a Single Nanoparticle in a Hybrid Nonlinear Microcavity. IEEE Photonics J. 2020, 12, 1–8. [Google Scholar] [CrossRef]
  15. Wu, P.; Chen, Z.; Jile, H.; Zhang, C.; Xu, D.; Lv, L. An Infrared Perfect Absorber Based on Metal-Dielectric-Metal Multi-Layer Films with Nanocircle Holes Arrays. Results Phys. 2020, 16, 102952. [Google Scholar] [CrossRef]
  16. Schueler, R.; Joshi, S.P.; Schulte, K. Damage Detection in CFRP by Electrical Conductivity Mapping. Compos. Sci. Technol. 2001, 61, 921–930. [Google Scholar] [CrossRef]
  17. Hsu, D.K. Characterization of a Graphite/Epoxy Laminate by Electrical Resistivity Measurements. Rev. QNDE 1985, 4, 1219–1228. [Google Scholar]
  18. Tse, K.W.; Moyer, C.A.; Arajs, S. Electrical Conductivity of Graphite Fiber epoxy Resin Composites. Mater. Sci. Eng. 1981, 49, 41–46. [Google Scholar] [CrossRef]
Figure 1. Schematic setup of the direction of a T-ray under reflection mode.
Electronics 09 01360 g001
Figure 2. A photo of a T-ray system for measuring and imaging material properties under reflection mode.
Electronics 09 01360 g002
Figure 3. A simplified overview of the terahertz (THz) measurement method.
Electronics 09 01360 g003
Figure 4. Samples of carbon-skin and glass-skin honeycomb sandwich composite panels with foreign materials. (a) Carbon-skin honeycomb composite panel with foreign materials. (b) Glass-skin honeycomb composite panel with foreign materials. (c) Stacking sequence of honeycomb composite panel at the A-A’ line.
Electronics 09 01360 g004
Figure 5. Terahertz time–domain spectroscopy (THz-TDS) pulses from a transmitted glass fiber-reinforced plastic (GFRP) sample (n = 1.95, ∆t = 80.8 ps, thickness = 5.79 mm).
Electronics 09 01360 g005
Figure 6. Angular dependence of reflection power of T-rays for carbon-skin honeycomb composite panels.
Electronics 09 01360 g006aElectronics 09 01360 g006b
Figure 7. Overview of T-ray reflection mode on honeycomb sandwich panels.
Electronics 09 01360 g007
Figure 8. Terahertz scan images of glass-skin honeycomb sandwich composite panels with boned and brass foils (12.5 × 12.5 mm and 6.3 × 6.3 mm) at the bottom under time—domain spectroscopy (TDS) reflection mode.
Electronics 09 01360 g008
Figure 9. Terahertz scan images of carbon-skin honeycomb sandwiches composite panels with boned and brass foils (12.5 × 12.5 mm and 6.3 × 6.3 mm) at the bottom under TDS reflection mode.
Electronics 09 01360 g009
Figure 10. Relationship between the angle of the fiber and the E-field and normalized resistance in a unidirectional carbon composite laminate.
Electronics 09 01360 g010
Table 1. Average T-ray refractive indices of the various materials.
MaterialsRefractive Index (n) *Refractive Index (n)
Reflection Mode
Poly methyl methacrylate (PMMA)1.60 ± 0.081.58 ± 0.07
Fused quartz1.95 ± 0.051.95 ± 0.05
GFRPs-2.17 ± 0.05
Note: * Data in Refs. [3,9,10].
Table 2. Predicted simple resistor model of one-ply conductivity.
ResistanceAngles
45.0°90.0°
θ45.0°90.0°
σ110.50
σ1.0 cos2θ0.5 cos2θ0 cos2θ
Req10.250

