Article

A Synchronized Multi-Unit Wireless Platform for Long-Term Activity Monitoring

by
Giuseppe Coviello
*,
Gianfranco Avitabile
and
Antonello Florio
Department of Electrical and Information Engineering, Polytechnic University of Bari, 70126 Bari, Italy
*
Author to whom correspondence should be addressed.
Electronics 2020, 9(7), 1118; https://doi.org/10.3390/electronics9071118
Submission received: 4 May 2020 / Revised: 2 July 2020 / Accepted: 8 July 2020 / Published: 10 July 2020
(This article belongs to the Special Issue Computational Intelligence in Healthcare)

Abstract

:
One of the objectives of the medicine is to modify patients’ ways of living. In this context, a key role is played by the diagnosis. When dealing with acquisition systems consisting of multiple wireless devices located in different parts of the body, it becomes fundamental to ensure synchronization between the individual units. This task is truly a challenge, so one aims to limit the complexity of the calculation and ensure long periods of operation. In fact, in the absence of synchronization, it is impossible to relate all the measurements coming from the different subsystems on a single time scale for the extraction of complex characteristics. In this paper, we first analyze in detail all the possible causes that lead to have a system that is not synchronous and therefore not usable. Then, we propose a firmware implementation strategy and a simple but effective protocol that guarantees perfect synchrony between the devices while keeping computational complexity low. The employed network has a star topology with a master/slave architecture. In this paper a new approach to the synchronization problem is introduced to guarantee a precise but not necessarily accurate synchronization between the units. In order to demonstrate the effectiveness of the proposed solution, a platform consisting of two different types of units has been designed and built. In particular, a nine Degrees of Freedom (DoF) Inertial Measurement Unit (IMU) is used in one unit while a nine-DoF IMU and all circuits for the analysis of the superficial Electromyography (sEMG) are present on the other unit. The system is completed by an Android app that acts as a user interface for starting and stopping the logging operations. The paper experimentally demonstrates that the proposed solution overcomes all the limits set out and it guarantees perfect synchronization of the single measurement, even during long-duration acquisitions. In fact, a less than 30 μ s time mismatch has been registered for a 24 h test, and the possibility to perform complex post-processing on the acquired data with a simple and effective system has been proven.

1. Introduction

In many areas of research, medicine, and sport it is important to collect data on particular parameters concerning a subject to obtain information on his/her health condition. Normally, detailed measurements are performed for short periods and in a controlled laboratory environment. With the advent of micro-electro-mechanical system (MEMS) technology and thanks to the non-invasiveness of the equipment available today, a great step forward has been made, allowing acquisitions for long time intervals, during individual procedures in normal daily life. An important task to perform in order to make the procedural steps effective is to check whether the patient is correctly following the doctor’s treatment instructions. Nowadays, Information and Communication Technologies’ (ICT) progress allows the doctors to remotely follow their patients. Furthermore, thanks to the availability of new ICT tools, it is possible to study the long-term evolution of particular symptoms related to specific diseases, without affecting patients’ everyday lives. They are real on-body laboratories that belong to the field of the Internet of Medical Things (IoMT). For example, considering specific units equipped with heartbeat sensors, it is possible to analyze a patient’s heart health in different time slots during the day, monitoring for the presence or insurgence of anomalies [1].
Complex systems are usually needed when monitoring the symptoms of a disease requires verification of several parameters and requires flow algorithms capable of taking into account the evolution of data for recognizing changes in them [2,3], or efficiency optimization algorithms [4] or systems that improve wireless communications [5]. A possible field of application of such a complex system, for instance, could be the study of patients with precocious diagnoses of Parkinson’s Disease (PD) [6,7]. Its main symptoms induce motor issues, such as tremor, rigidity, and instability. Thus, a gait analysis or posture monitoring could be helpful to identify those symptoms’ progression or regression. Gait analysis can be conducted in several ways [8]—for example, with video frame analysis. The case of kinematic gait analysis is brought out using multiple sensor units. Thanks to information coming from accelerometers and gyroscopes, it is possible to identify an object’s motion in the space; in our case those pieces of information are related to an arm or a leg movement.
Advanced forms of PD involve the possibility for the patient to alternate phases in which motor muscles are operative (ON) to phases in which they stop to work (OFF) [9]. This can be related to an ineffective or changed drug therapy and only platforms for long-term monitoring of the patient can be helpful for identifying these types of issues. Those platforms usually match the already mentioned set of gyroscopes and accelerometers for gait characterization with sensors for the sEMG.
Many implementations rely on multiple units with a single sensor as an alternative to a single unit equipped with the whole sensors set. Additionally, especially for sEMG, it is important to monitor points that may be distant in space, so two or more units may be needed. We introduce, in this way, the concept of the multi-unit acquisition system.
From the networking point of view, for a multi-board acquisition system, we talk about Body Area Networks (BANs) [10], which are networks usually with a star topology and connected by wireless protocols, whose coverage is of the order of 1–2 m [11] (that is, the necessary area to cover the entire body).
The length of the time interval used to perform the analysis should be carefully considered. In some cases, it is necessary to do real-time (online) monitoring while in other cases a posteriori (offline) monitoring is required. In the first case, the central node (BAN coordinator) is in charge of collecting, processing, and matching the data, before exposing them to the external network to the BAN—the Internet. It is important to have a persistent connection between the BAN coordinator and the Internet. According to [12], this may lead to a significant power consumption associated with the RF portion of the sensing device. Since we are considering wearable motes, it is unfeasible for the devices to use expensive batteries or overly heavy batteries. Additionally, it may be useless to expose very frequently data on the Internet during long-term monitoring.
A better solution seems to be represented by offline processing, in which every mote saves the results of its surveys on a persistent memory and after gathering the data from the whole set of units the data collection is processed. This final step calls for the BAN coordinator to be in charge of strict time synchronization between all motes. In this scenario, the timestamp of each measure is crucial, since the possibility of correctly analyzing the measures by referring them to the same instant depends on it. Some off-the-shelf solutions give the opportunity to store the measured data in a memory. They usually require some extra non-portable and complex hardware, and either their specified accuracy is too low [13] or no details are given regarding the accuracy itself [14].
The paper aims to present a time-synchronized multi-unit, multi-sensor, and multi-rate acquisition system for kinematic and static analysis. The data are collected from different sensors, even using different data rates, over a long time interval of observation during normal daily activities of the patient. The system can be employed for many specific applications, depending on the virtually unlimited number of boards used, the sensors they are equipped with, and their positioning on the body. Because of this, the experiments validating the proposed platform will aim to prove the effectiveness of the approach, generalizing and not specifying a precise operating scenario.
The organization of this paper is as follows: Section 2 reviews related works, while Section 3 formulates the operating problems. Section 4 describes the platform developed, and in Section 5 some experimental results, validating the system, are reported. Finally, conclusions are given in Section 6.

2. Related Work

2.1. Gait Analysis through sEMG

The EMG is the measurement of the electrical activity of a muscle. EMG actually gives only minor information about the contraction of individual muscles, but it provides a visible indication of the muscle activity. The information provided can be extremely interesting when considering the time instance in which a muscle activates [8].
Many methods are available for EMG. The least invasive one, but also one of the most subject to interference, is the surface EMG (sEMG). In fact, first of all, it is not always possible to distinguish one muscle’s activity from that of the adjacent ones (the so-called “cross-talk” phenomenon [8]). Moreover, since there is a thick layer of skin covering the muscle, the voltage signal arrives at the electrodes with a significant attenuation that must be compensated with specific preamplification techniques.
However, the sEMG is the preferable way of performing gait activity monitoring over a long time period as it only requires the patient to have some surface electrodes on specific parts of its body.
In the literature, it is possible to find some examples of gait characterization through sEMG-based systems. For example, in [15], the authors propose a gait cadence analysis performed through sEMG. The system is in charge of acquiring electrode signals and processes them according to a first-order statistic, in order to characterize the periodicity of gait in healthy patients.
In [16], a more complicated analysis involving deep learning is presented. In fact, still employing sEMG, the author provides a method to identify and classify two sub-phases of gait (proper stance and swing phases) based on an artificial neural network approach.
In [17], another gait sub-phase recognition system is proposed, with an inferential algorithm for studying and characterizing the sub-phases. The great advantage of this latter approach is its reduced cost, since it is based on Arduino Mega 2560 for signal processing, and it is wearable, thereby allowing one to perform non-invasive remote analysis of gait.

2.2. Multi-Board Acquisition Systems

This work presents a wearable multi-board acquisition system for offline activity monitoring. In the literature, other systems with the same purpose are present, with similar characteristics but with some issues that our design aims to mitigate.
In [9], a wearable system for long-term monitoring of gait is presented. The board has the advantage of being an “add-on” to the patient, unlike others described in the literature that require the patient to wear specific shoes or other specifically designed clothes. Salarian et al.’s work, instead, allows one to equip the patient with the system and remove it when the monitoring is over. The board employed for testing is equipped only by gyroscopes. Nevertheless, the authors claim to have reached interesting results. Note that the proposed system works for offline monitoring, thanks to the fact that the motes store their revelations on 8 MB memory cards.
Laerhoven et al. [18] focused their attention on how to reduce the power consumption for wearable devices of this type. Toward that purpose, they first check for the presence of motion using a set of tilt switches, and then activate an accelerometer to track the motion itself. This latter sensor, indeed, drains far more current than a tilt switch. Moreover, since tilt switches furnish a binary output, it is possible to reduce the computational power required to reveal the presence of motion. Actually, due to the nature of the tilt switches, this system does not guarantee a reduced number of false positive or false negative events of motion, thereby preventing the achievement of high levels of accuracy.
In 2011, Cancela et al. [19] presented a distributed wearable system for online gait analysis in PD made with five 3-axial accelerometers put on limbs and a gyroscope with accelerometer put on the belt. Zigbee protocol is used as the telecommunications standard between the motes and to communicate with a personal computer (PC) that receives and stores the data. The main issues of the approach arise from the fact that online monitoring can be power hungry, as already discussed. Nevertheless, it is useless to collect and process data immediately in long-term monitoring. Moreover, the proposed system requires a PC that must be specifically equipped with algorithms and telecommunication standards transceivers in order to work and collect data, and this may be an obstacle for doctors and patients.
Finally, Oniga et al. [20] developed a solution for studying motion activity/inactivity for a subject in the long term. Wearable motes equipped with only gyroscopes and 3-axis accelerometers are considered and coordinated by a smartphone, in charge of receiving and processing data, before storing them in a persistent online database. The proposed solution is an online monitoring system. It is still capable of reducing some sources of power consumption, thanks to intelligent (triggered) activation of the motes by the smartphone. Nevertheless, the patients must have a smartphone equipped with a specific application and a persistent internet connection to store data on the remote database, accessible to the doctor.
The system presented in this paper allows a more complete analysis of systems of the type previously described in terms of completeness of the measurements that can be made thanks to the variety of sensors used, and by the simplicity and versatility of use. The approach ensures a longer battery life as it minimizes the computational complexity of the synchronization process. Moreover, it allows an easy reconfiguration and expansion of the group of units without any change in the settings, as the synchronization protocol is quite simple and does not involve any bidirectional communication.

2.3. Time Synchronization Protocols

The main issue when analyzing multi-unit (i.e., distributed) systems consists of the physical clocks synchronization. The sub-elements themselves of a multi-board system are not synchronized. It is mandatory that each and every subsystem has the same vision of the time domain, as the units are meant to capture events that later must be cross-correlated. Even assuming the theoretical possibility that every device turns on at at the same time, it is well known that the natural clock drift due to environmental changes may lead to time mismatches in the run-time phase. As a consequence, the need for a time synchronization algorithm arises.
Time synchronization protocols belong either to the distributed protocols (DPs) (consensus-based) or to the centralized protocols (CPs) classes. In the DPs, the decision on the global system time is made by specific algorithms aiming to solve the problem of consensus. The latter, in distributed systems, calls to the single nodes to “agree” on a given property, decision, or quantity [21] (in our case, time). A consensus algorithm has the following properties:
  • Termination: after ending, every node makes a decision;
  • Agreement: every couple of nodes agrees on the same decision;
  • Validity: every decided value is a proposed one;
  • Integrity: every node makes a decision at least once.
Obviously, a time synchronization algorithm based on consensus guarantees a high level of accuracy, at the cost of long computation time needed to reach the consensus itself. As a consequence, a DP could be unacceptably heavy in time-critical systems and in fast-changing-events observing systems.
In CPs, the decision is made by a single node, called the leader, that we will identify as the BAN coordinator in our context. Note that backup-leaders can be considered to implement fault tolerance. Some algorithmic solutions are directly inheritable from classical distributed systems theory, while other techniques are specially designed for BANs and other kinds of ad-hoc networks.
The simplest example is constituted by the algorithm proposed by Cristian in [22]. This algorithm operates in two stages: first, the peer node N asks the coordinator C to be time-synchronized; then, after, the coordinator sends a message containing its local time (that will become the network global time) T C . Once the peer has received this message, it sets its local time to be:
T N = T C + τ ˜
with τ ˜ an estimation of the actual communication delay detailed in Section 3.2.2. The algorithm furnishes a good approximation when the random components of τ are negligible when compared to the deterministic ones.
Another solution is presented in [23], the so-called Berkeley algorithm, adopted in Unix 4.3 BSD. Here, the coordinator observes message exchange containing local clock values T N i still to estimate τ i for each node i, as in the previous case. Then, it averages the clock values. Instead of sending the decided time, the coordinator sends to each node how much it should increase or decrease its clock according to the global decided time.
The presented algorithms are more suitable than the consensus-based synchronization algorithms, but still, they face a time latency in which the event cannot be located in a precise global time instant, that is, until the whole network agrees on a specific timestamp. This issue suggests the need for a new class of algorithms, specifically designed for BANs, that is, more time bound. In fact, since BANs for event sensing must cope with physical quantity measurements which can vary very rapidly, or have to deal with strict energy constraints [24], it is necessary to introduce new strategies.
Let us consider the class of broadcast-based time synchronization algorithms. In this case, the BAN coordinator periodically sends the same message to all the BAN nodes (i.e., a broadcast message). Once each node has received the message, they adjust their internal time according to the specific algorithm procedures.
The reference broadcast synchronization (RBS) algorithm proposed in [24] offers a solution in which the leader sends a broadcast message to all the nodes. These latter register the time in which they received the message as a function of their local clock and inform the other nodes about their local time computation. A global time consensus is reached in a way similar to Berkeley algorithm—that is, once the relative time difference computation in each node is known. Unfortunately, a simpler approach with faster convergence would be needed in some applications.
A lightweight solution is represented by the Flooding Time Synchronization Protocol (FTSP) [25,26]. FTSP sends the MAC layer timestamp to all the nodes in the flooding mode. Each node that received the message computes the local drift as a function of the global time and aligns its local time to it. Linear regression is used for compensating clock skewing and drifting. The main con of the approach is the large amount of exchanged information [26].
In this scenario, our algorithm is a simplified version of the fusion of RBS and FTSP protocols. In fact, we eliminated the clock skewing and drifting compensations needed in FTSP. Furthermore, the message sent in the broadcast will contain the value of the real-time clock (RTC) as payload, instead of taking the time value from the MAC layer, as in the RBS protocol.

3. Problem Formulation

In this section the most important error sources for the time synchronization mismatch will be discussed. They can be divided into two main categories: errors related to the hardware implementation and errors related to other sources that we will call non-hardware implementation.

3.1. Hardware Implementation
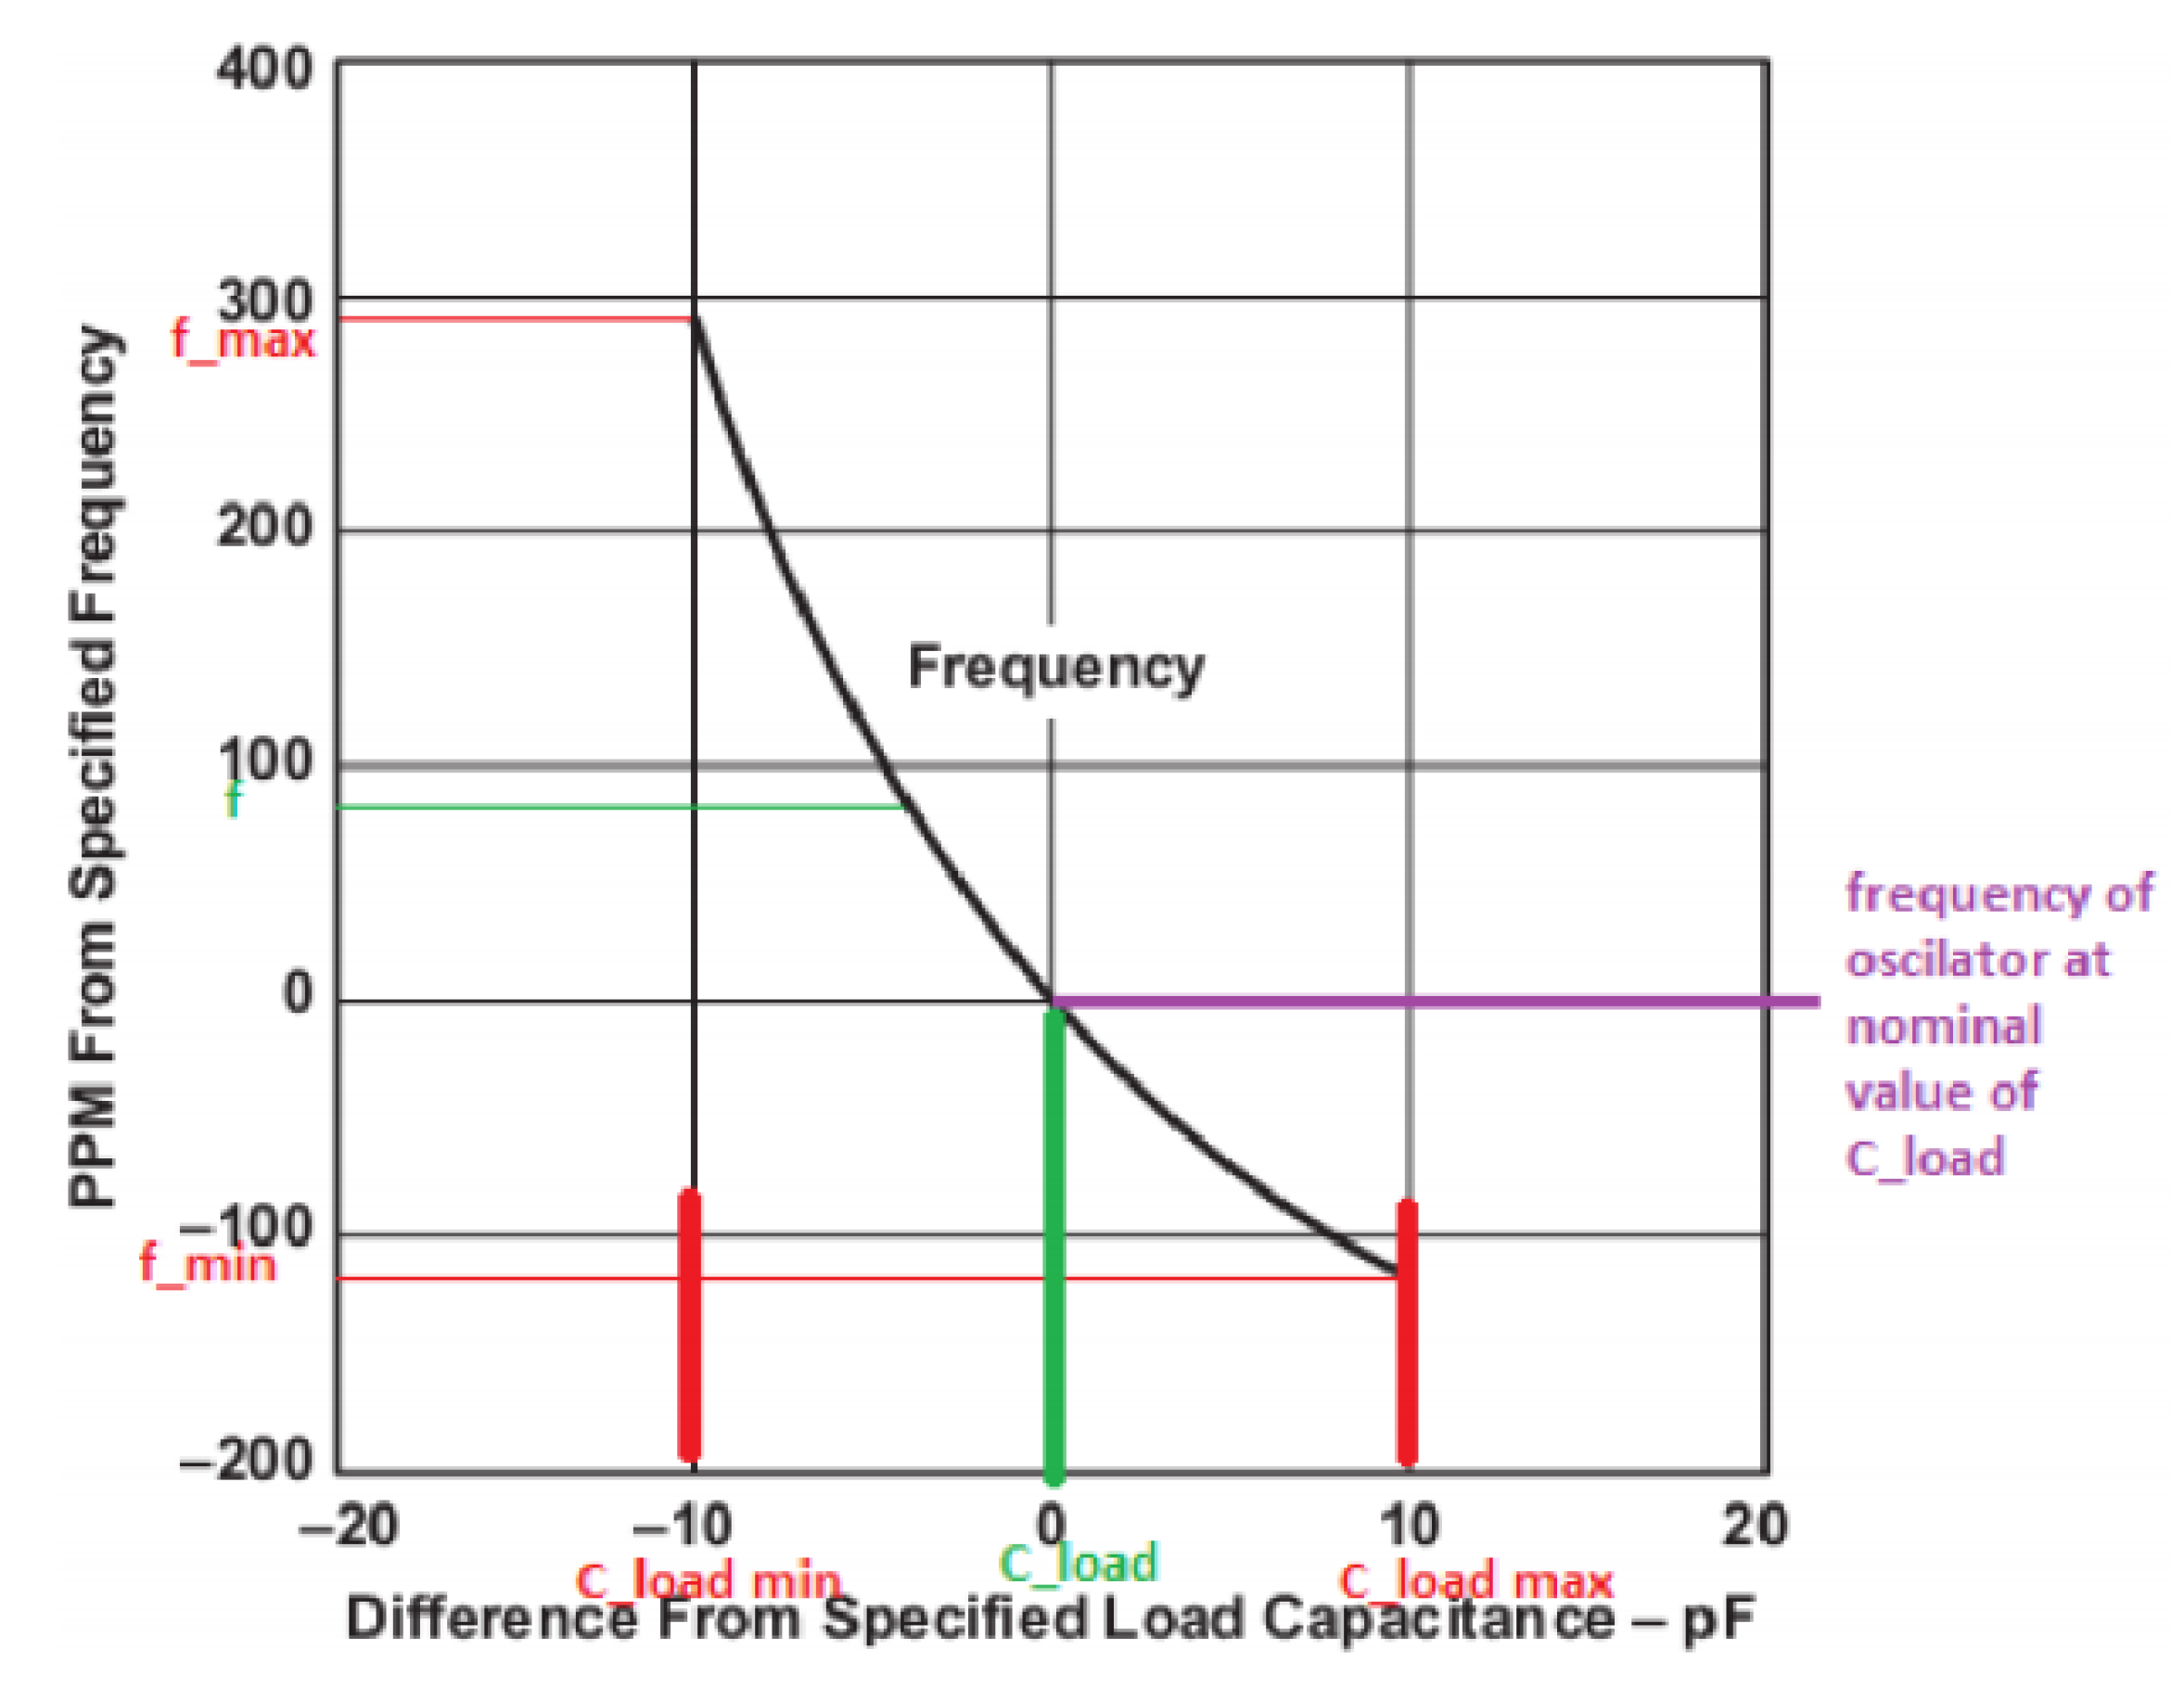
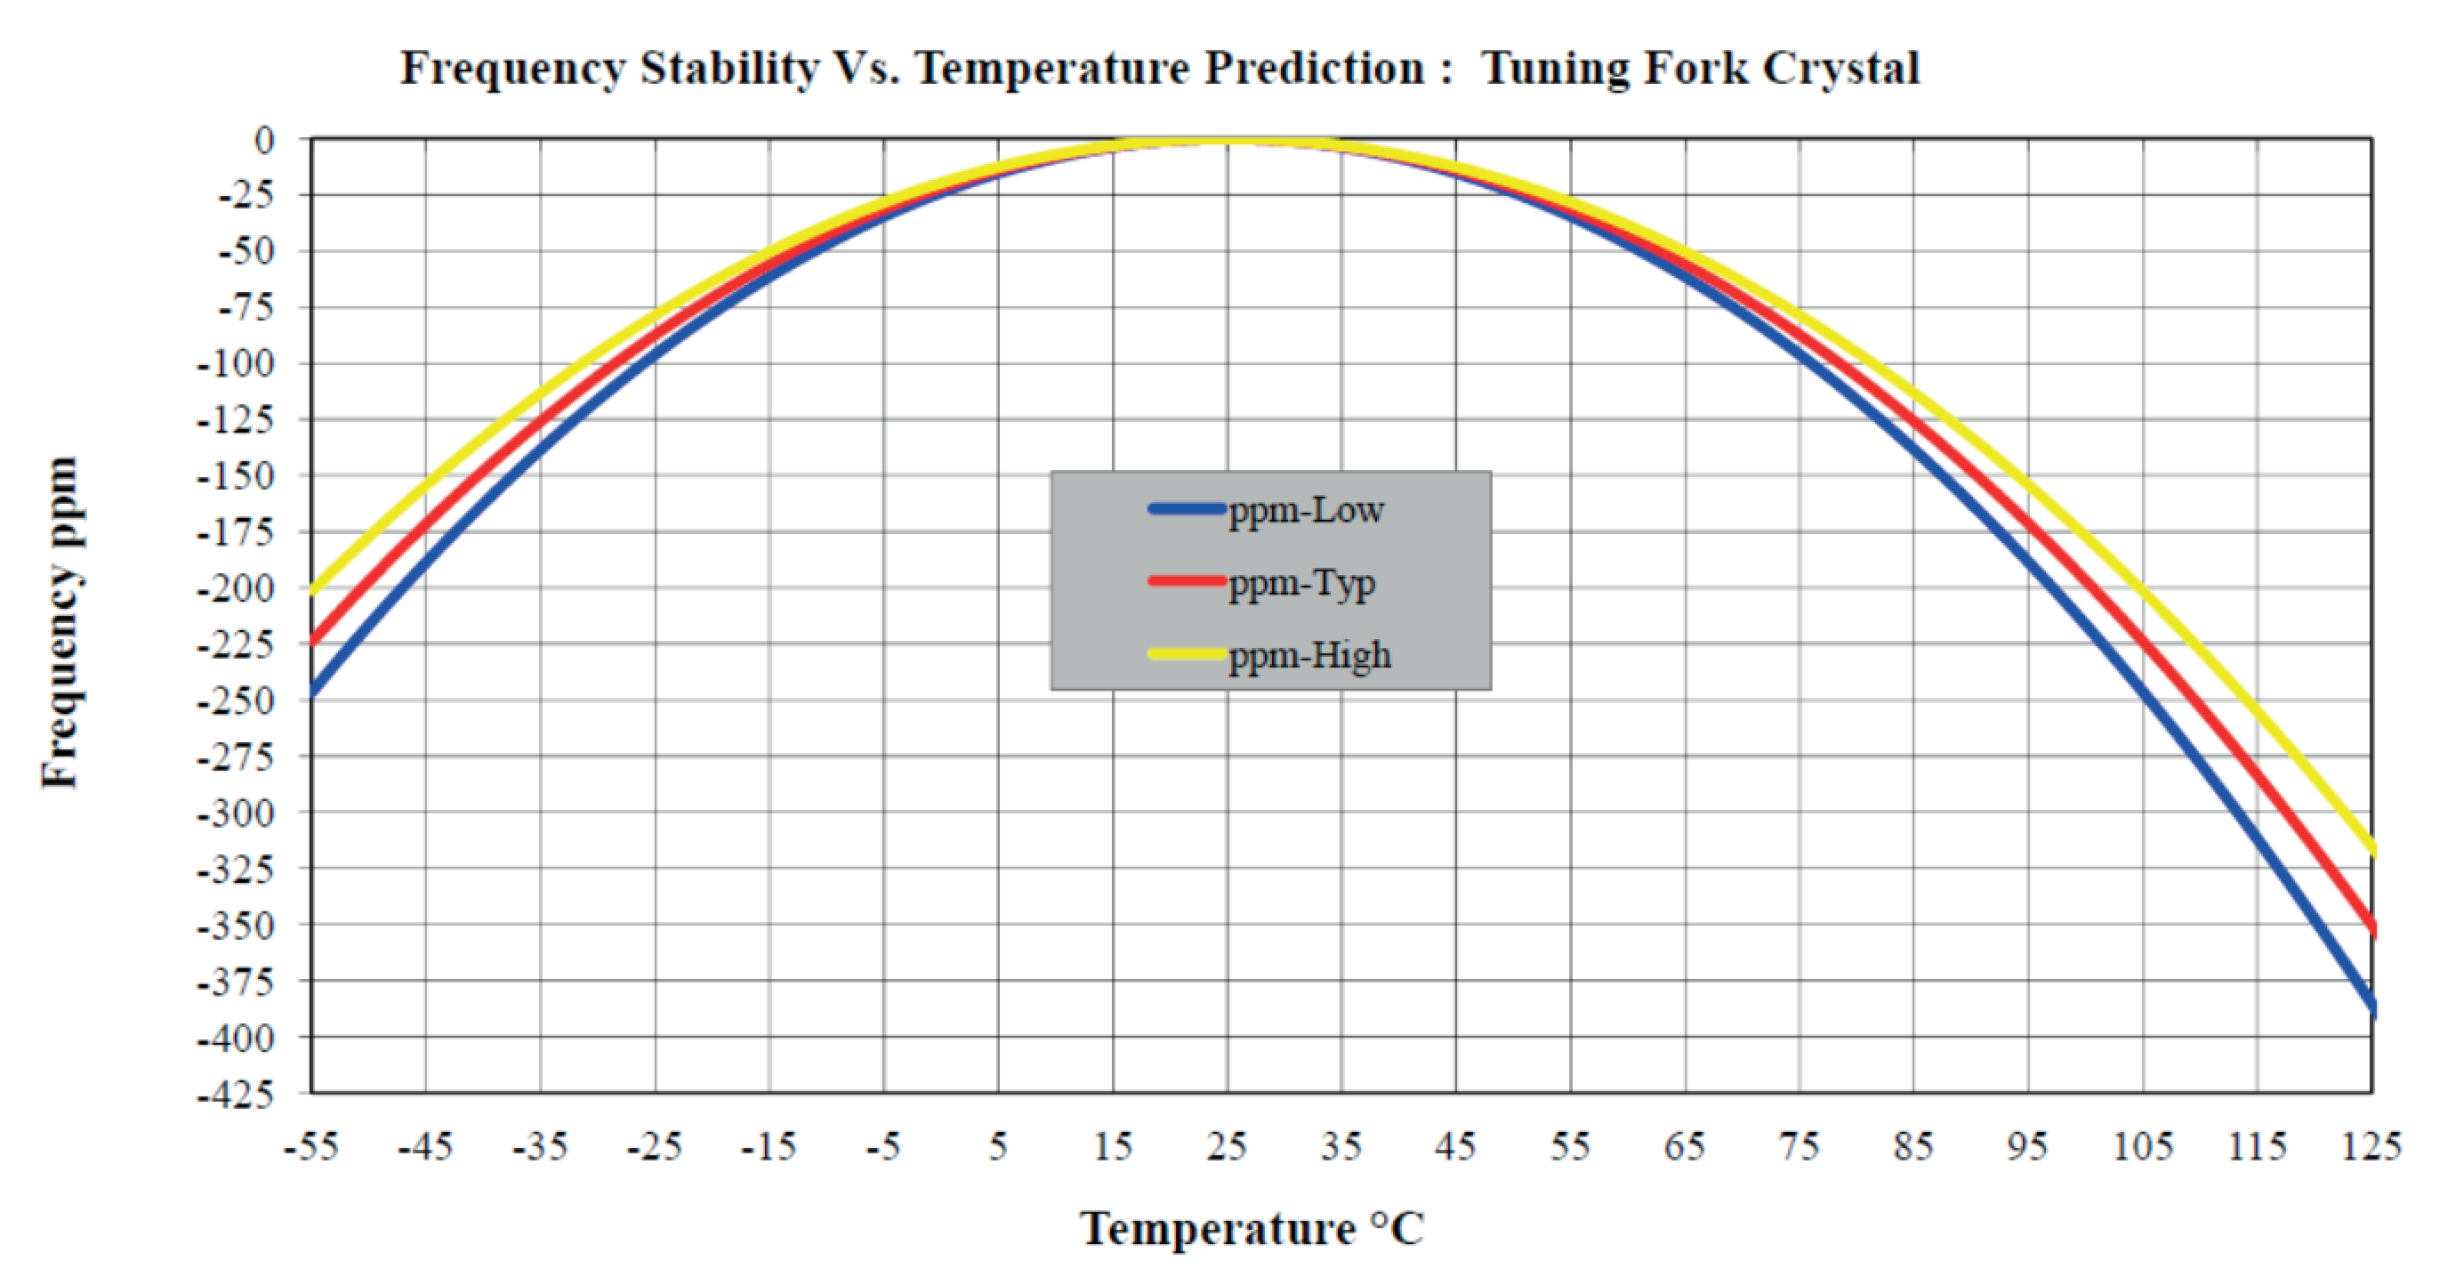
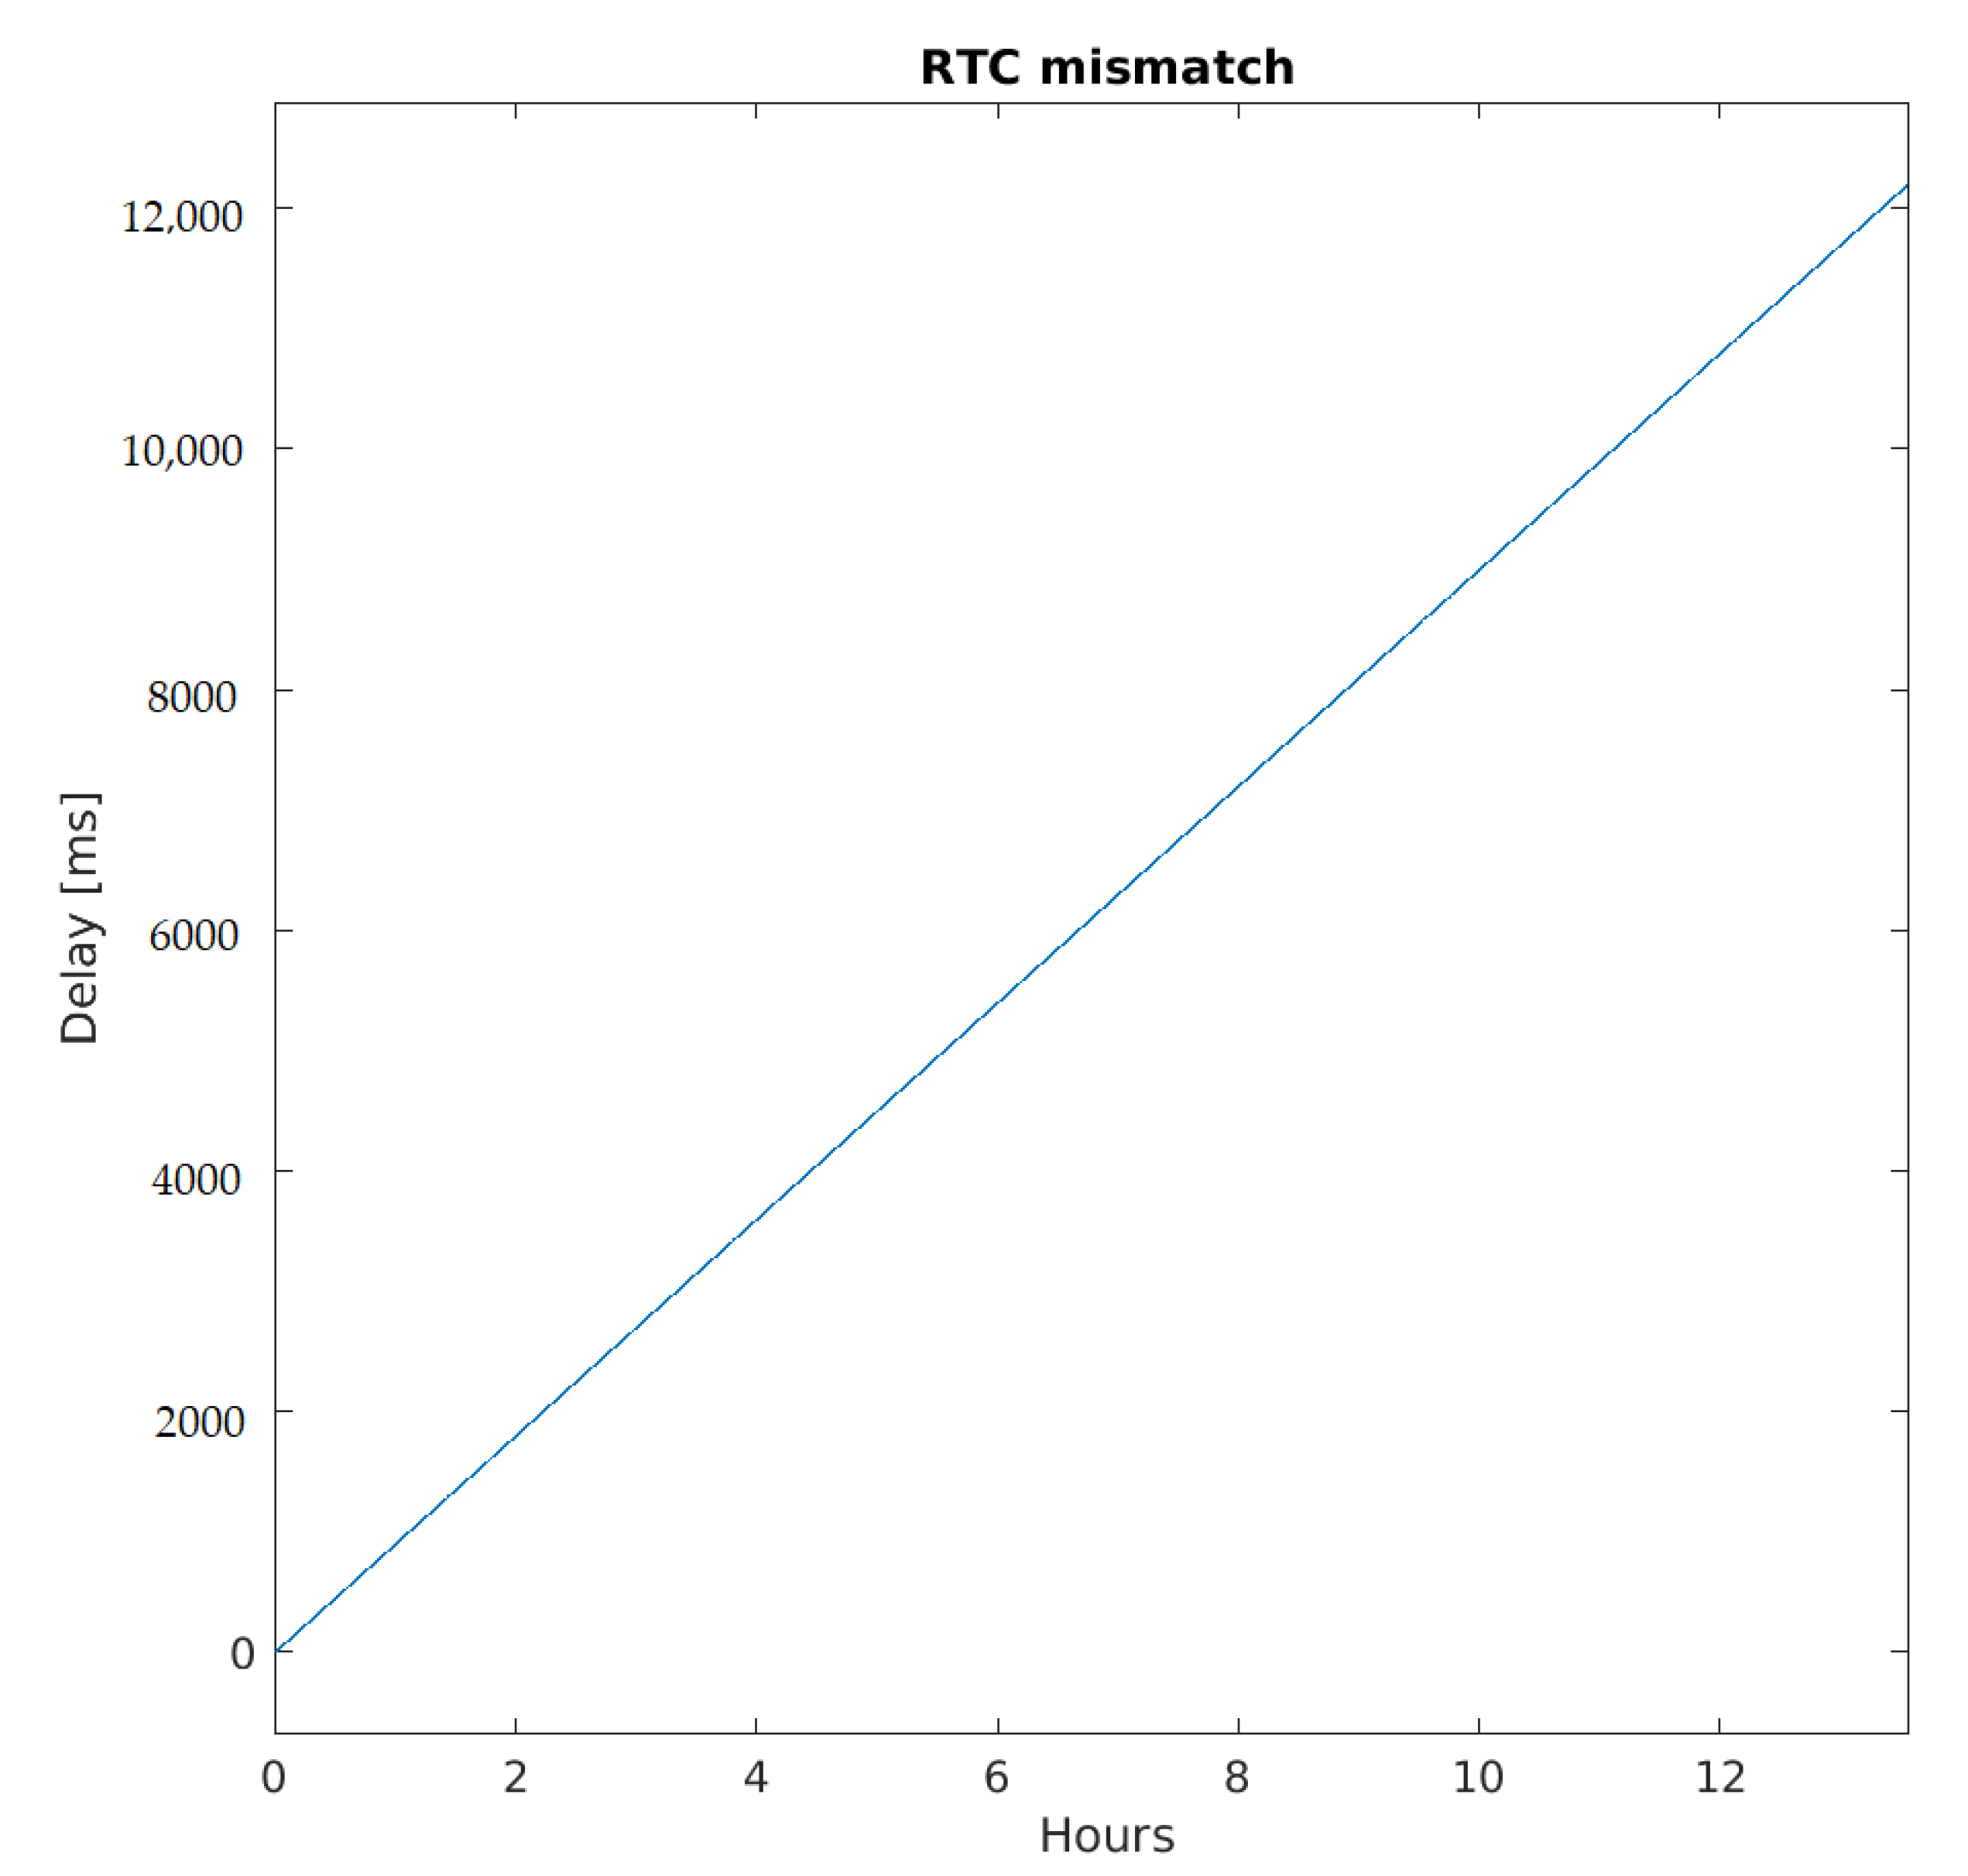
3.1.1. RTC Mismatch

In most of the low-cost/low-power systems, the RTC accuracy is guaranteed by using a 32.768 kHz crystal oscillator. Several aspects must be considered when choosing this component for the project; one of them is the frequency tolerance declared by the manufacturer. Low-cost 32.768 kHz crystals usually have a frequency tolerance of about ±20 parts per million (ppm) that introduces an intrinsic delay of ±10 min/year at its maximum.
Another source of frequency drift is the crystal capacitive loading mismatch. The effective load of a PCB mounted crystal depends on the external loading capacitance tolerance, the PCB parasitics, and the oscillator circuit parasitics. The difference from the load capacitance specified by the manufacturer can lead to an error up to ±200 ppm [27], which introduces a further delay of ±100 min/year at its maximum. Probably, this is the most important error source, so the design phase is very crucial; a typical characteristic is shown in Figure 1.
It is common for crystal manufacturers to specify the drift due to aging in the first year without specifying the trend for subsequent years because it is unpredictable. This value is around ±3 ppm which means about ±90 s/year at its maximum.
The last source of inaccuracy is represented by the temperature changes that, for quartz, have a trend represented by a parabola whose vertex is the so-called turnover temperature (TOT). Figure 2 shows the graph for crystal ABS07-32.768KHZ-9-T [28] from Abracon (Spicewood, TX, USA) used in the project. In this case, the turnover temperature is around 25 °C. The effect is that the oscillator slows down when the temperature changes around the TOT. It is important to underline that the drift could be significant. Let us consider a 55 °C temperature; the frequency drift is about ±26 ppm which means a delay of about ±13 min/year.
All these aspects lead to the consideration that a calibration or synchronization technique is mandatory. Many calibration techniques are present in literature [29] and producers’ data sheets [30,31]. Even though those techniques compensate the clock drift with very little battery power drain, they still require the presence of an external temperature sensor, and most of all, the final accuracy is around ±3.5 ppm which means a delay of about ±0.2 ms/min.
We compared the performances of the RTCs of two identical boards for a 14 h log at a constant temperature of 30 °C. As expected, the mismatch grows linearly and at the end of the observation interval it is around 12 k milliseconds, as shown in Figure 3. That means a total mismatch between the boards of about 238 ppm; that is a delay of about 119 min/year.

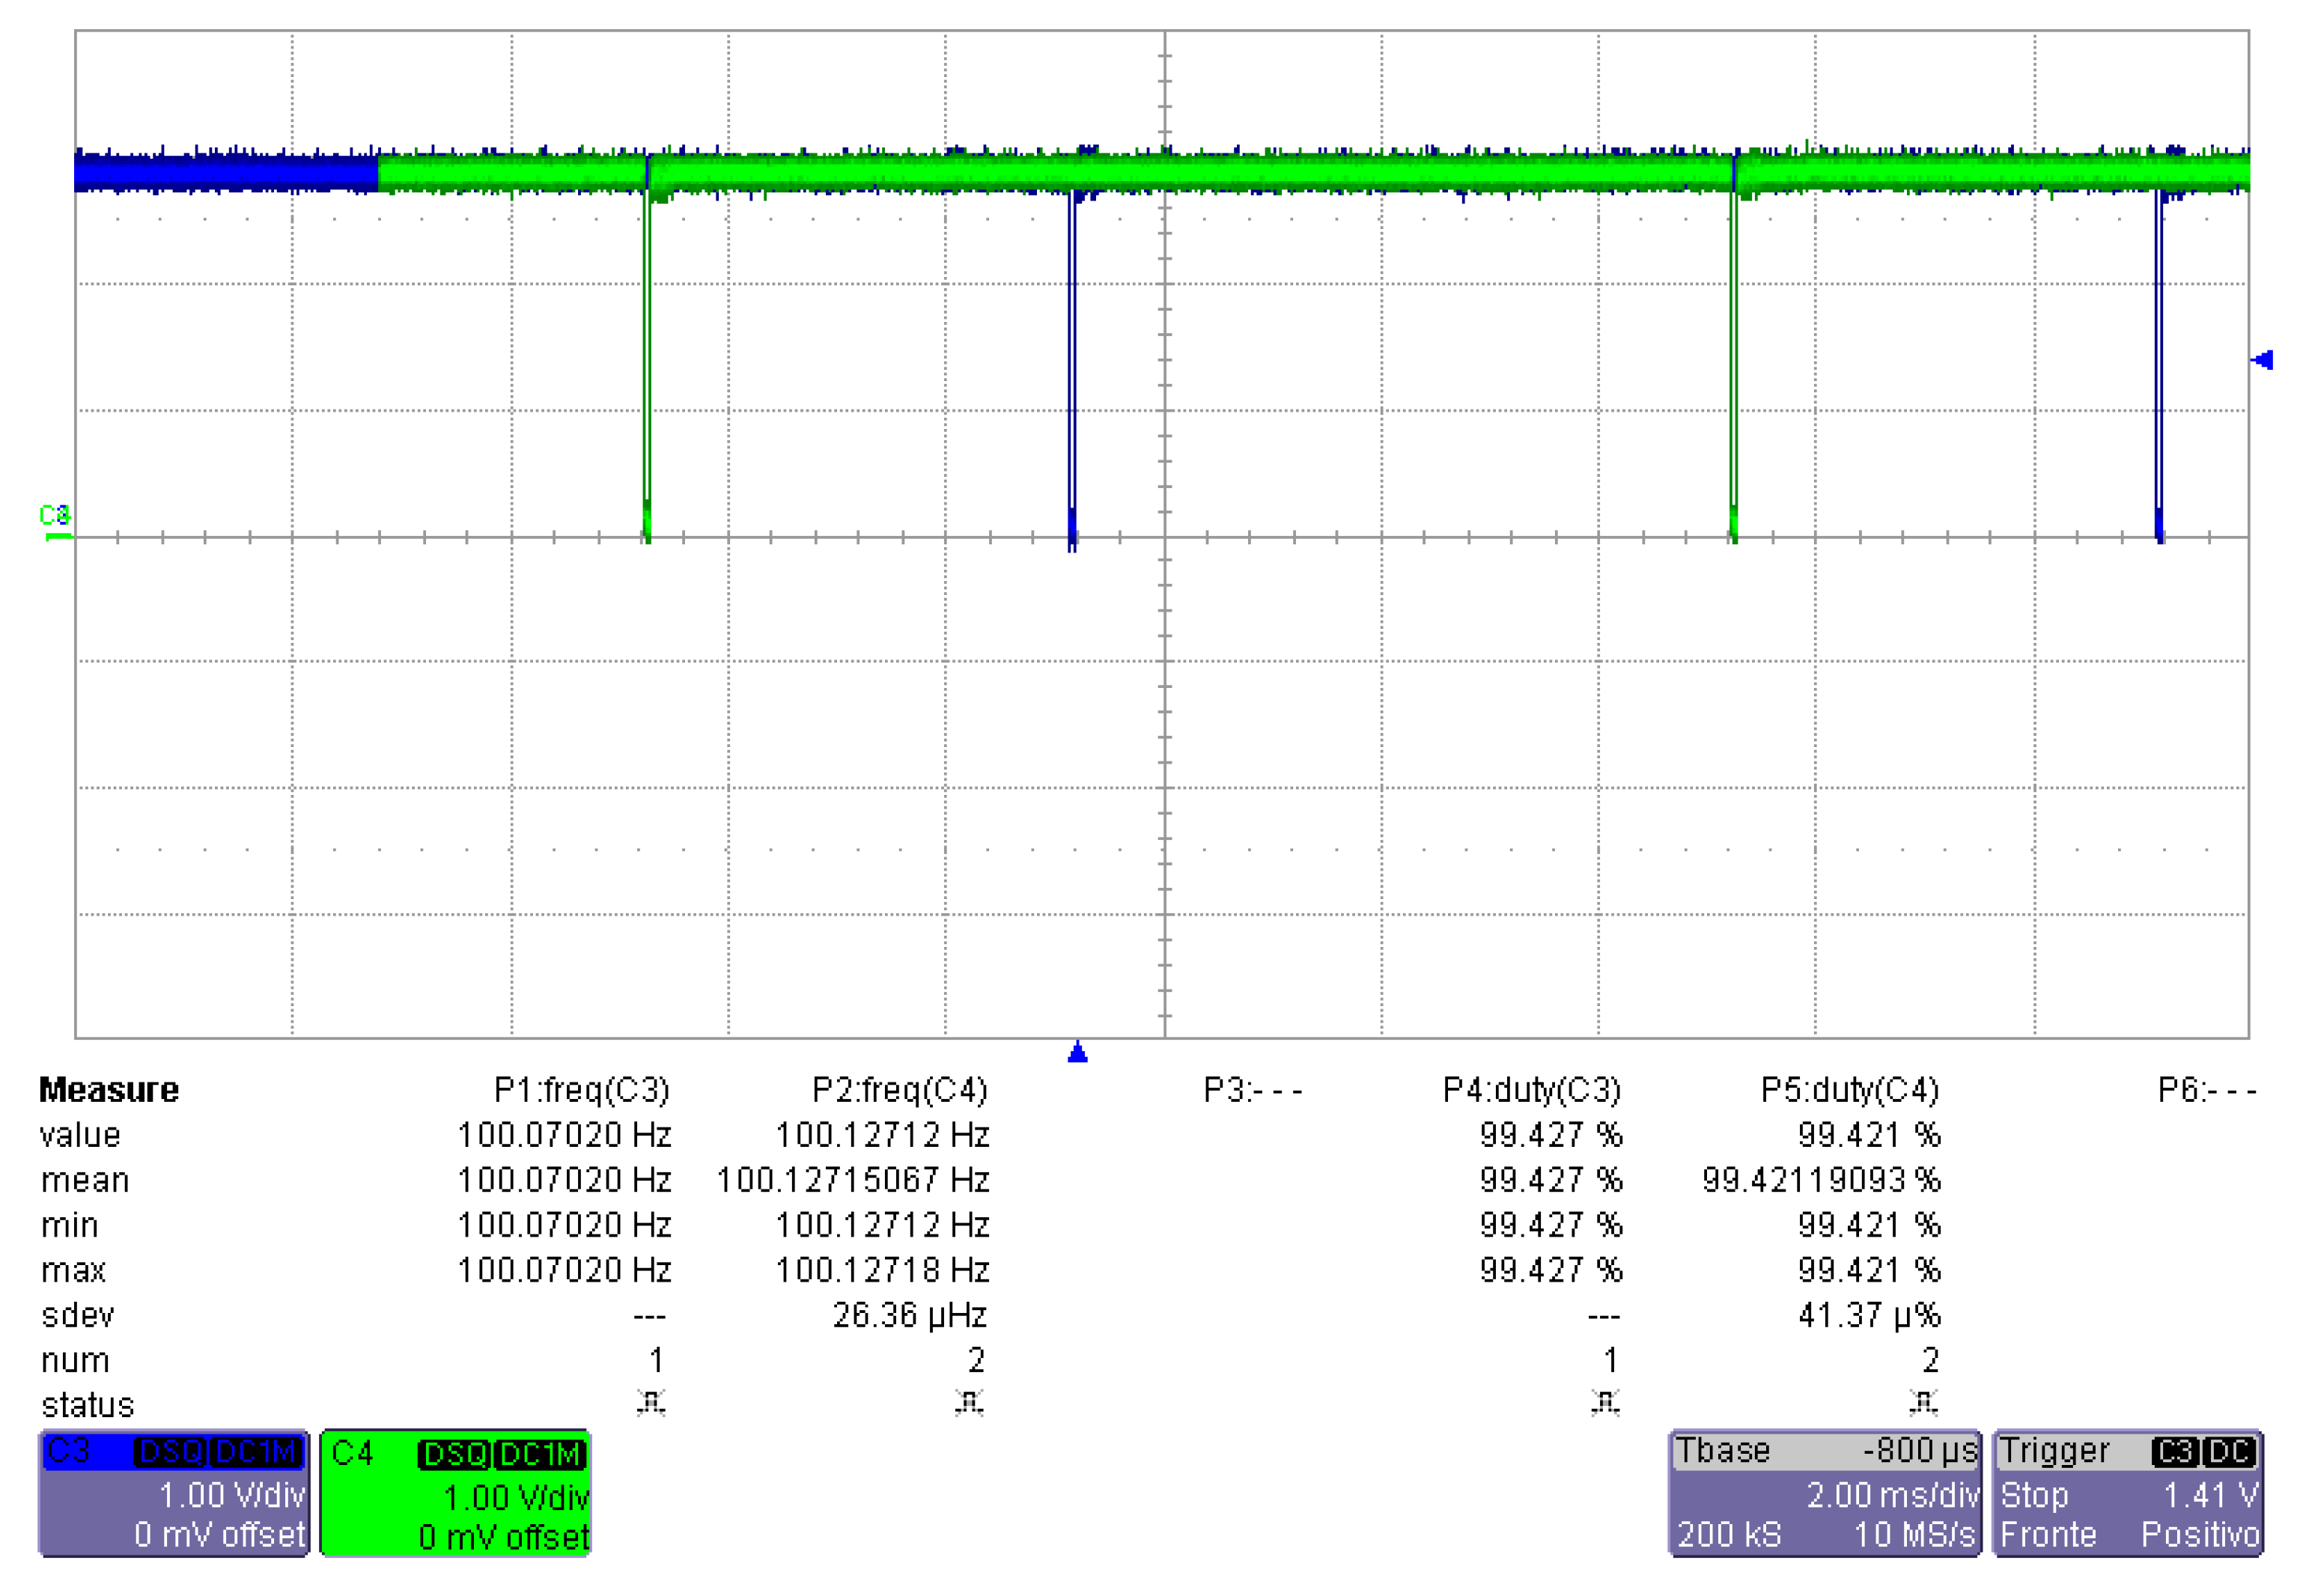
3.1.2. IMUs Sampling Frequency Differences

IMUs with analog-to-digital converters (ADCs) for digitizing the gyroscope, accelerometer, and magnetometer outputs, have several interesting features, such as the selection of the sampling rate, the interrupt feature to alert the processor that a value is exceeding a user-programmable threshold or that a new data are available to read. The sampling frequency of a typical low-cost unit is in the range of a few Hz up to a few kHz. The right sampling frequency could be chosen as a function of the application requirements [32]. Usually, for gait analysis, postural monitoring, or activity monitoring, the frequency of 100 Hz is the right choice [33]. Even in this case, the clock accuracy is important since timing errors directly affect the distance and angle calculations performed by the processor.
In order to show this clock diversity, we use two identical units with a sampling frequency of 100 Hz and the interrupt feature enabled. The output pin is active low and is triggered as soon as the processor reads the data. In Figure 4 it can be noticed that the mismatch is about 57 mHz, while the time needed for the processor to read the data is about 80 μ s. This means that the measured frequency differences should be attributed only to the frequency clock tolerance, which is about ±2% for the IMU used [34], and to the internal delays.
As a consequence, it cannot be used as a reference time generator, creating a serious problem. In fact, let us consider the measured IMU clock of 100.12712 Hz as in Figure 4 and an ideal system clock with a resolution of 10ms. In such a situation, every sample from the IMU is associated with a system timestamp. Nevertheless every 7.88 s there is ambiguity and two samples are associated with the same timestamp. The situation is shown in Figure 5. Instead, if the measured clock is smaller than the ideal system clock, we have sampling events without a sample.
This issue can be overcome simply by imposing an oversampling at the IMUs, as discussed in the next section.

3.2. Non-Hardware Implementation

This section will describe the problems that are not related to the hardware realization, but, rather, to the firmware implementation or the network topology choice and so on.

3.2.1. Micro SD Card Speed Classes

In applications of the type described in this paper, it is necessary to provide a local data storage system. The use of micro SD card memories represents the simplest and most economical solution, due to their reduced cost and dimensions. In order to simplify the data analysis on a PC, the FAT32 file system has been chosen. The drawback is that the writing process is slower than raw writing without a file system. For example, in our tests, closing a file and opening a new one may require several tens of seconds and it depends on the micro SD card speed class. The goal is not to miss any measurement coming from the IMU but at the same time to guarantee the right timestamp for each measurement. Two simple actions allow one to reach the goal: the first, to put the writing on micro SD card at a low priority, favoring the RTC and the communication with the IMU; the second, to prefer burst writing, correctly sizing the vectors to store in the RAM for the temporary storage of the values coming from the IMU or sensors in general while writing on the micro SD card.

3.2.2. Network Topology

The majority of time synchronization algorithms deal with message exchange. In particular, since we are coping with a wireless connected system, along with the non-determinism coming with clock drift, other sources of synchronization noise must be taken into account, directly depending on the random nature of the radio medium.
In general, the time interval required for the synchronization message to be received from the time instance in which it leaves its source (denoted as τ ) can be decomposed into five parts [25]:
  • Send time ( t S ): the time from the instant the message is composed to that in which it arrives to the network interface;
  • Access time ( t A ): waiting time for the shared communication channel to be free;
  • Transmission time ( t T X ): time needed for the sender to put the message on the communication channel;
  • Propagation time ( t P ): traveling time of the electromagnetic signal from the sender to the receiver.
  • Reception time ( t R ): the dual time of t S
The overall delay can be expressed as in (2):
τ = t S + t A + t T X + t P + t R
Recalling that in a BAN we are dealing with very short distances (in 1–2 m range), the propagation time difference between two nodes can be neglected. Hence:
τ t S + t A + t T X + t R
In this paper, we consider the class of broadcast-based time synchronization algorithms. For these algorithms, the BAN coordinator sends, under some conditions, a message for triggering the correct time setting. In this way, some terms of τ can be neglected. In fact, since we have only one access to the channel, i.e., the one for sending the broadcast message, t A can be neglected. Additionally, the message is equal for each node, so also t S can be neglected. Then, the expression (3) further reduces in:
τ t T X + t R
Under these hypotheses, the greatest non-deterministic synchronization artefact is represented by t R ; it should be reduced as much as possible.

4. Platform Presentation

In this section, the synchronized multi-board wireless platform for long-term activity monitoring is discussed. The general idea is to build a flexible and expandable system composed by a wireless network of sensor nodes simultaneously providing multiple measures of different physiological and environmental signals. The organization of the used units will be discussed at a block diagram level as these were designed using standard commercial components configured according to the producers’ recommendations. The core system is the synchronization mechanism which makes possible the correlation of the offline post-processed measurements made by different units that are fused for more complex analysis.
It is important to underline that this solution does not necessarily guarantee an absolute timestamp but guarantees an identical timestamp for all slaves. The accuracy of the entire system depends on the accuracy of the RTC implemented on the master. This is because in many cases it is not important to have an accurate absolute RTC system, but it is very important that for each sample of each unit there is a common synchronized timestamp that allows an a posteriori perfect alignment of the samples. For example, if we consider a 24 h long posture or step monitoring, an absolute delay of tens of seconds is absolutely not a problem if and only if this delay is present on all the units that compose the system. However, it is possible to change the precision of the system simply by acting on the master hardware implementation, keeping the complexity and cost of the slaves low.
In the next subsections a complete description of the system is presented, starting from the two different units used in this paper, through the architecture used for protocol implementation and the Android app used for managing the execution of the measurements.

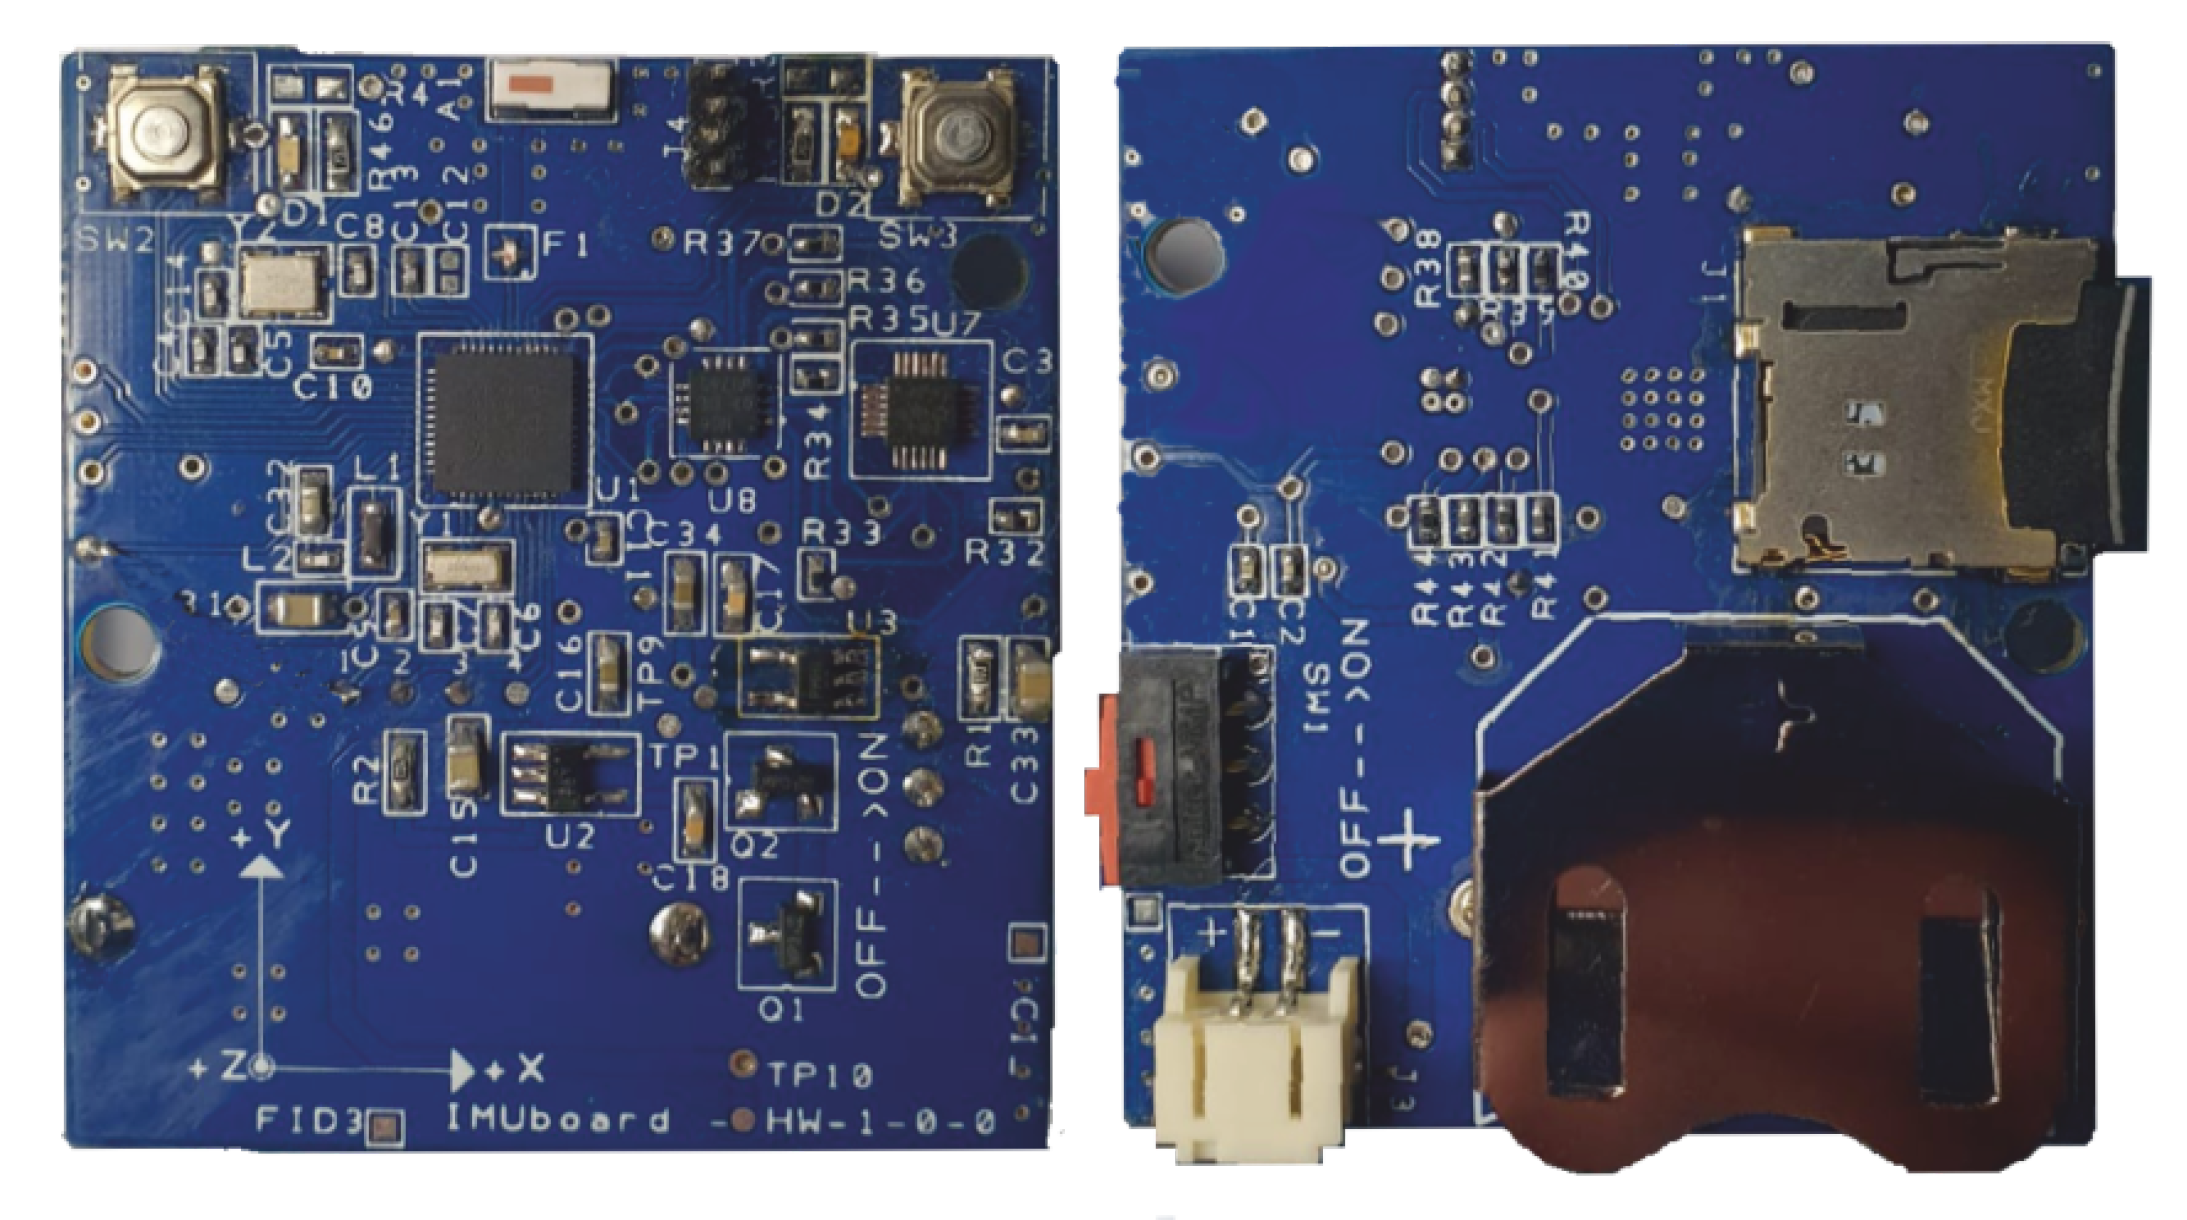
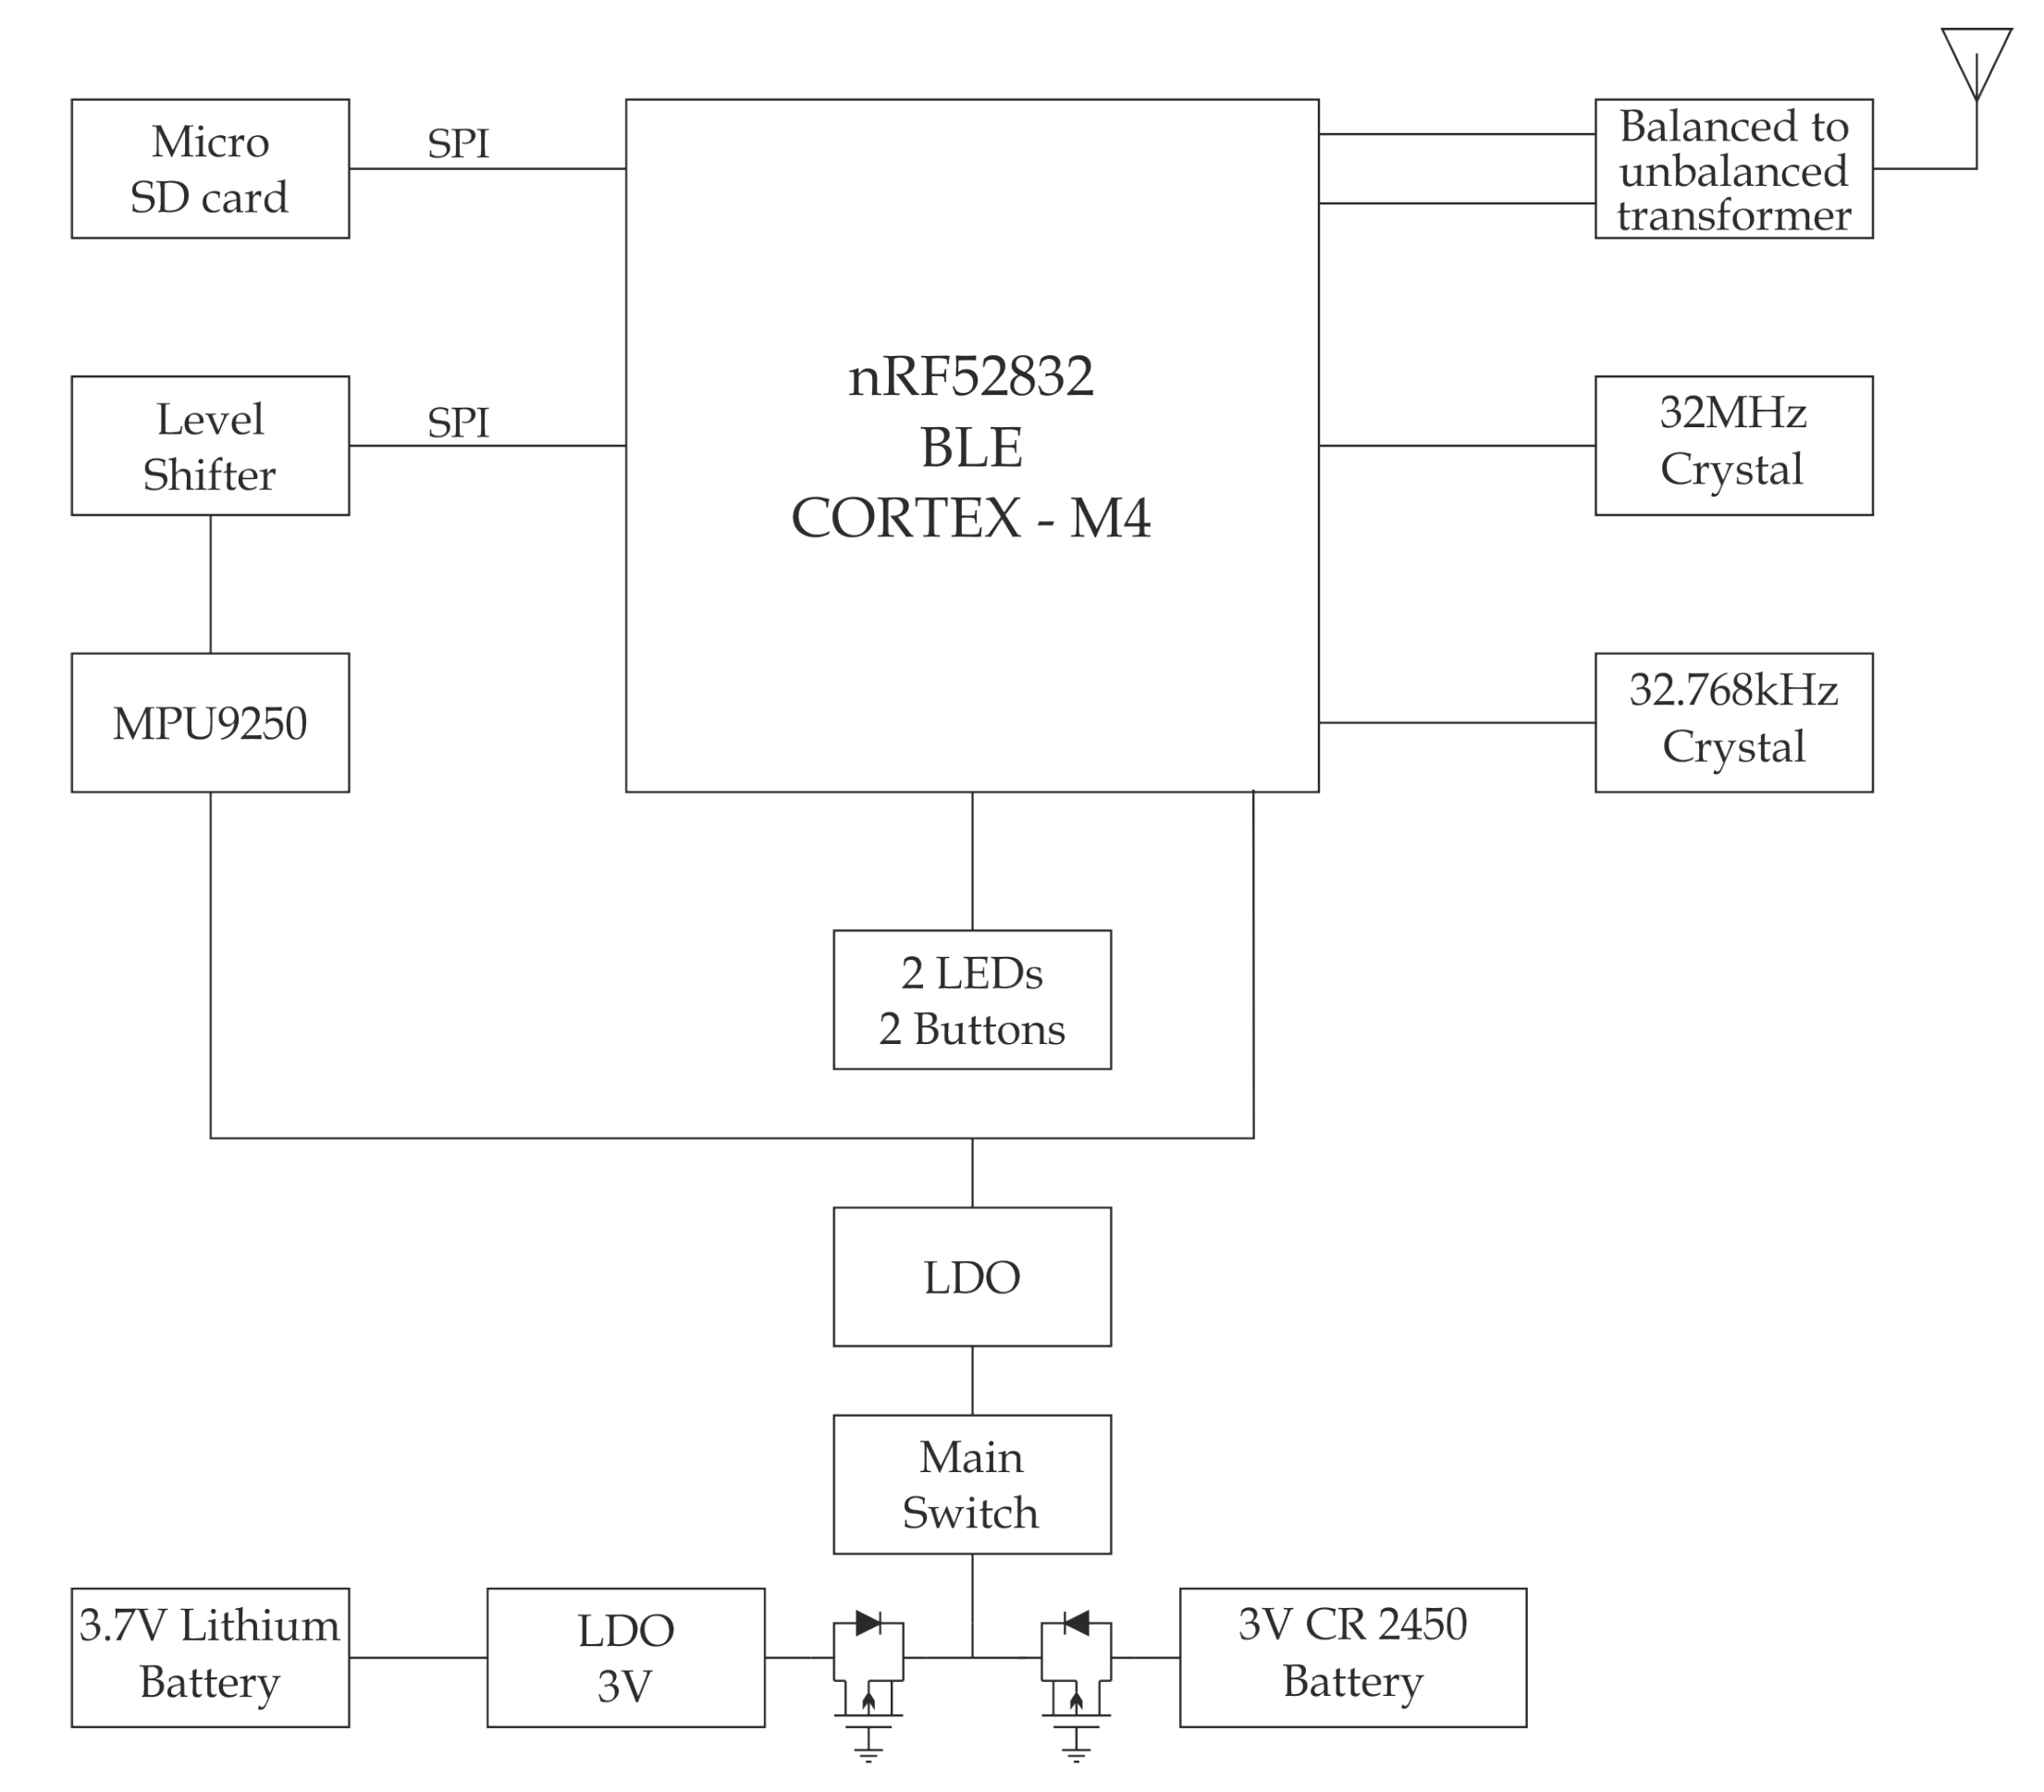
4.1. Hardware of IMU Board

The custom designed IMUboard-HW-1-0-0 allocates a nine degrees of freedom (DoF) MPU-9250 nine-axis MEMS MotionTrackingTM device from TDK-InveSense (San Jose, CA, USA). The MPU-9250 integrates on the same chip, the TDK-INV 6-axis IMU MPU-6500 and the AKM magnetometer AKM-8963 mutually connected using the AUX-I2C of the MPU-6500 [34]. The angular velocity ranges from ±250 (deg/s) to ±2000 (deg/s), while the measurement range of the acceleration is from ±2 (g) to ±16 (g). The measurement range of the magnetometer is about ±4800 (uT), the sampling rate is up to 8 kHz, and the communication clock frequency is up to 20 MHz for the Serial Peripheral Interface (SPI) reading protocol. The system core is the Nordic Semiconductor (Trondheim, Norway) SoC nRF52832 that integrates a 64 MHz ARM®CortexTM-M4 CPU with 512 kB Flash memory and 64 kB RAM. The SoC manages a multiprotocol Bluetooth 5, ANT/ANT+, and proprietary 2.4 GHz. The processor uses a micro SD card for data logging and it communicates with it in SPI bus mode using the FAT32 file system to allow direct download of the data onto a PC. The user interface uses a couple of LEDs (green and red), two push-button switches for user interaction, and one main power switch. Finally, the power is supplied to the entire system either with a CR2450 coin cell battery, using a proper battery holder on the board, or with an external battery, using the JST connector on the board. The IMUboard-HW-1-0-0 unit is depicted in Figure 6 and the block diagram shown in Figure 7 depicts its structure.

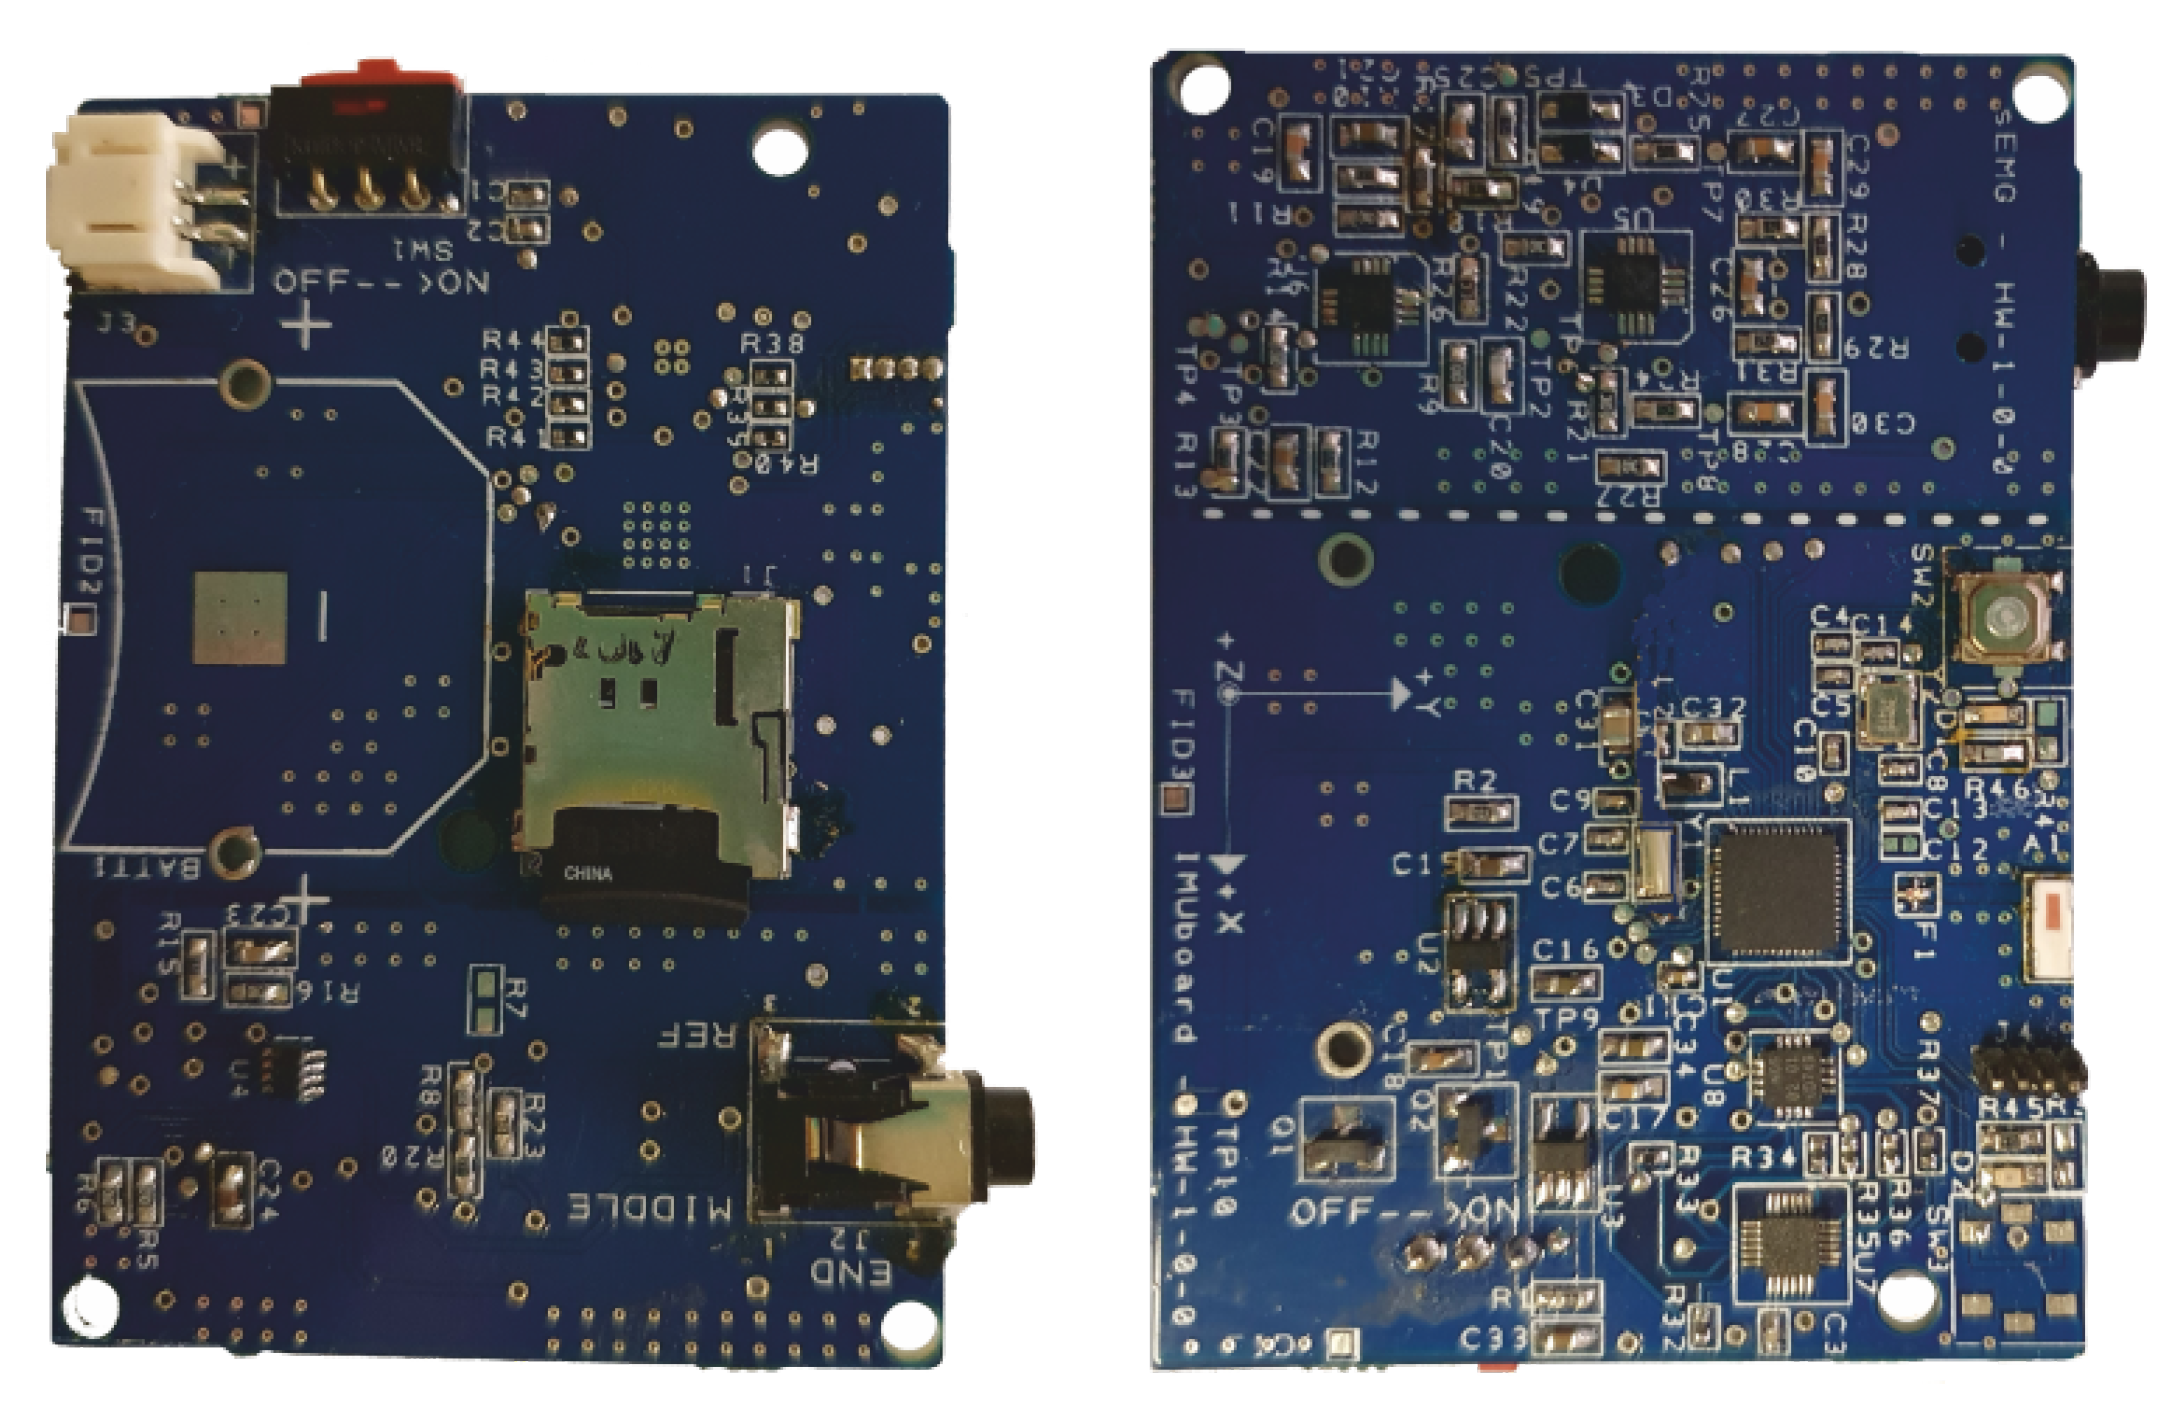
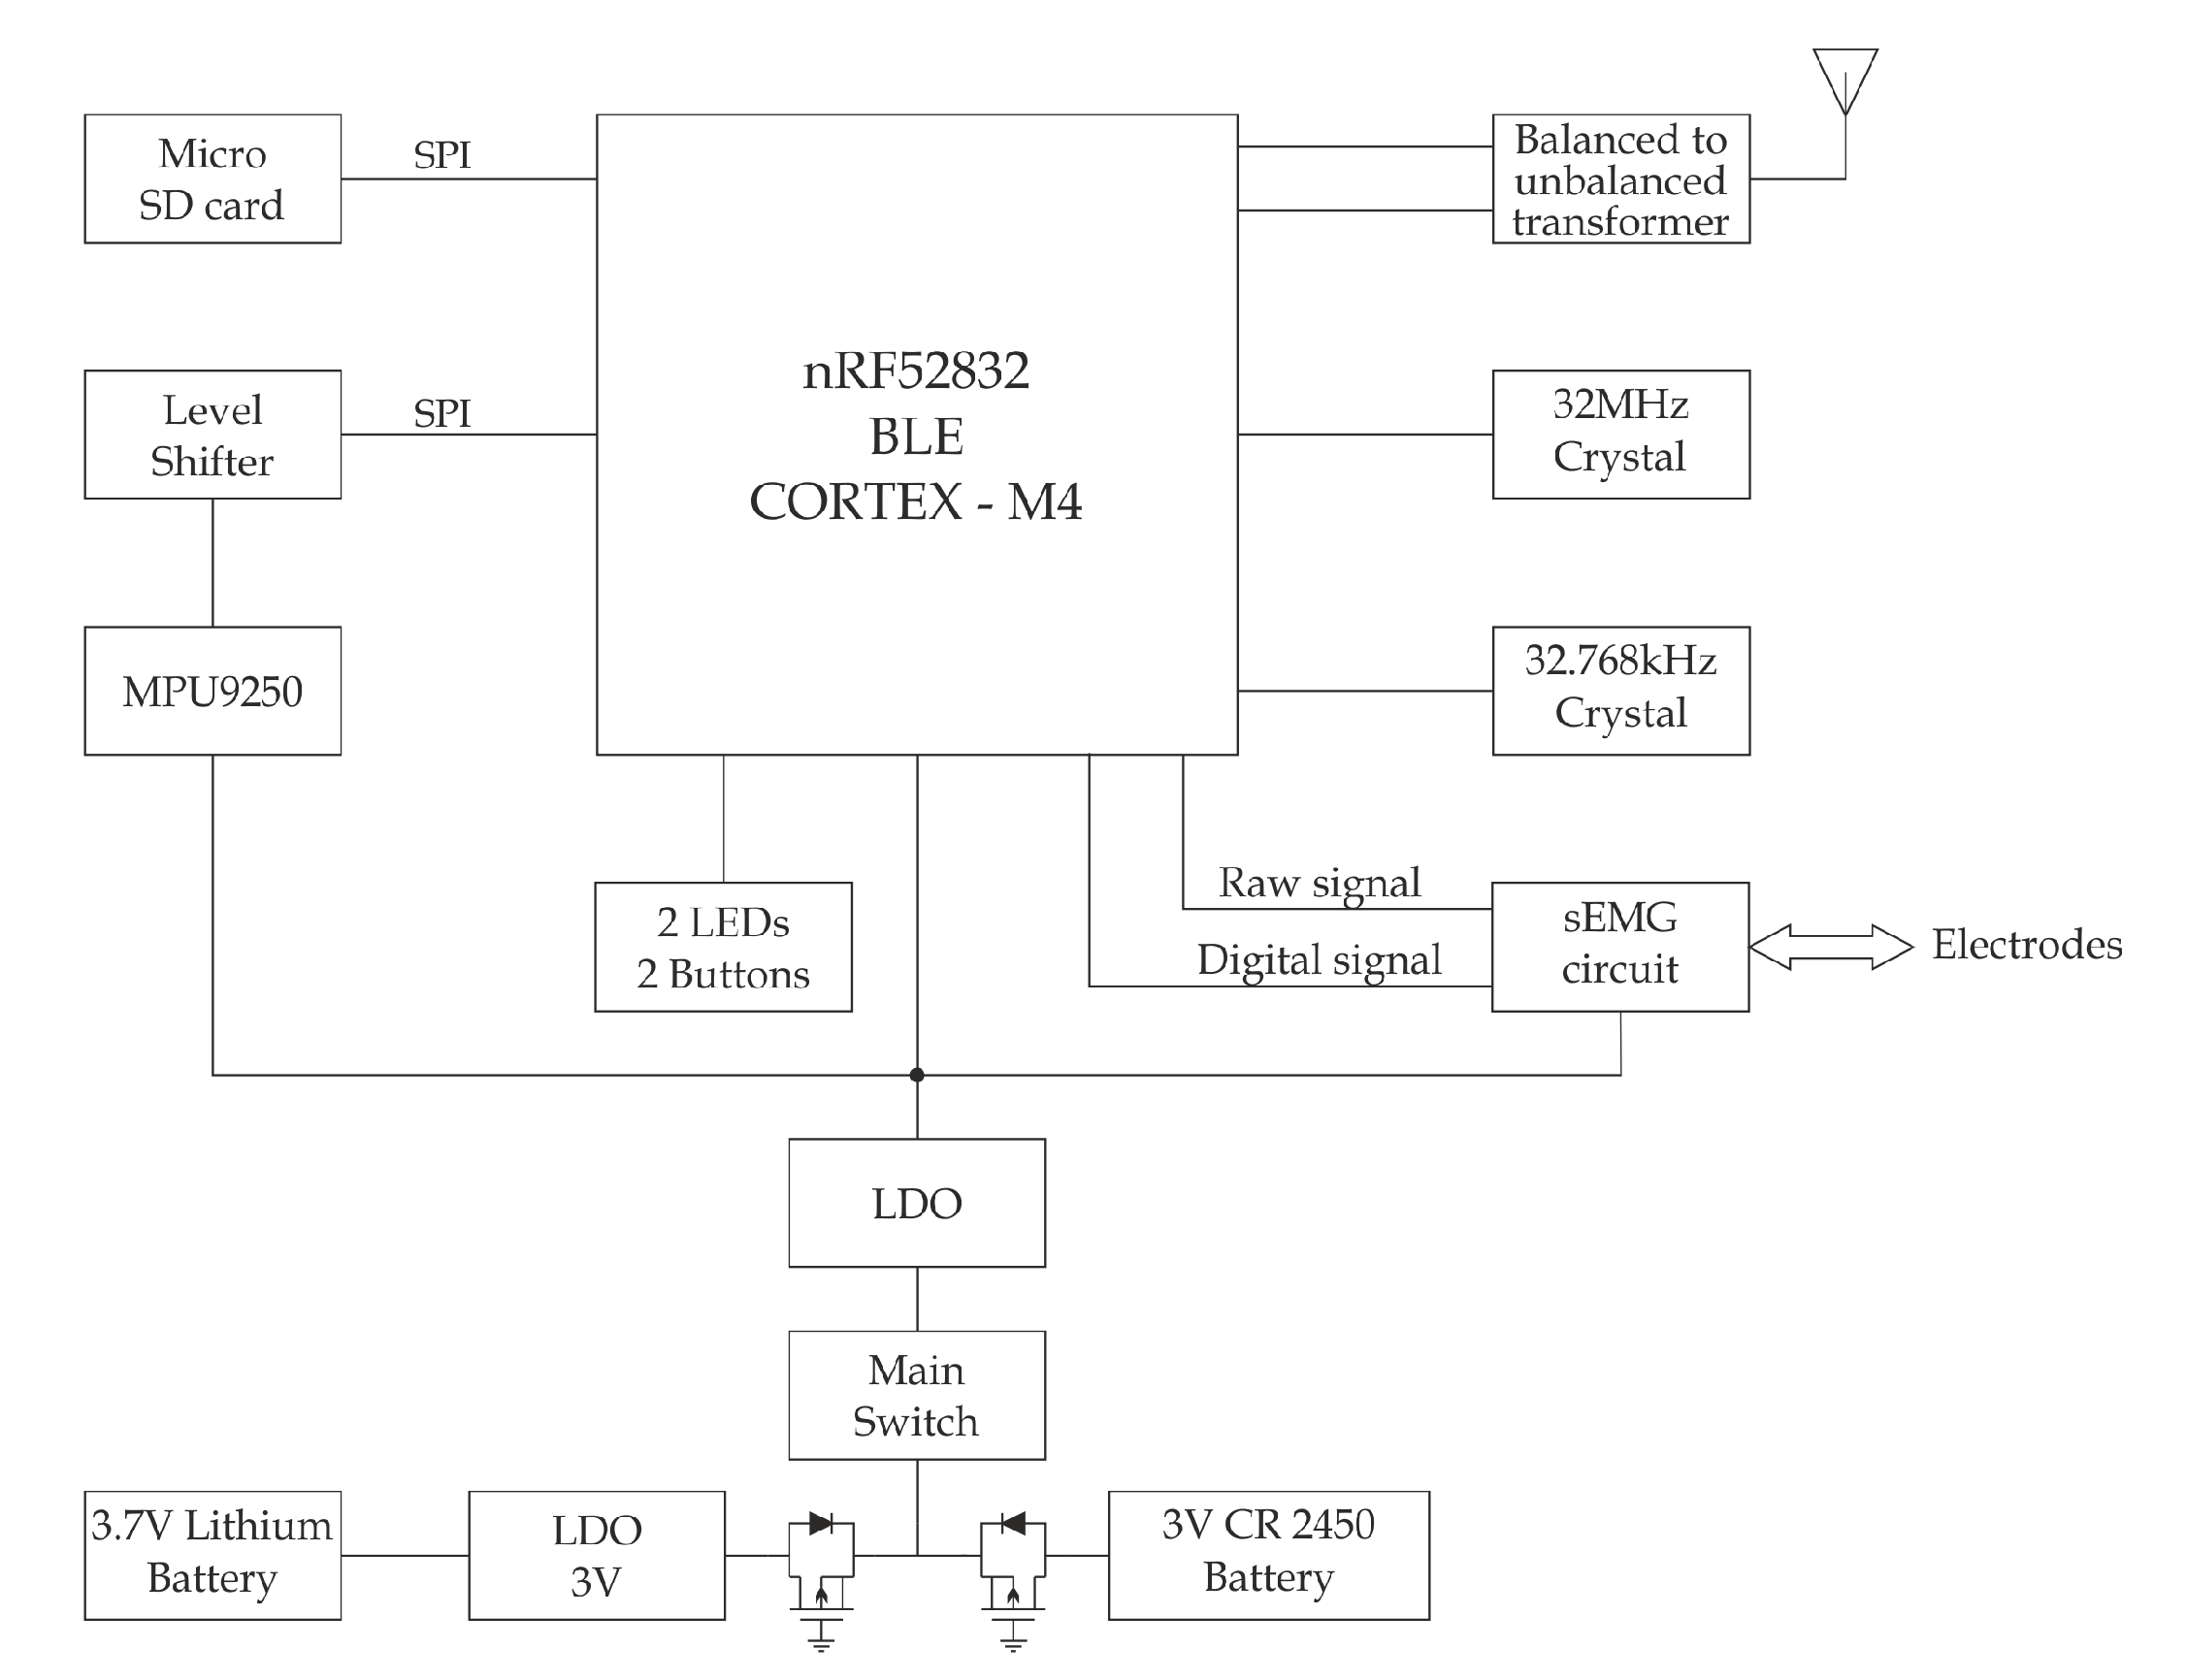
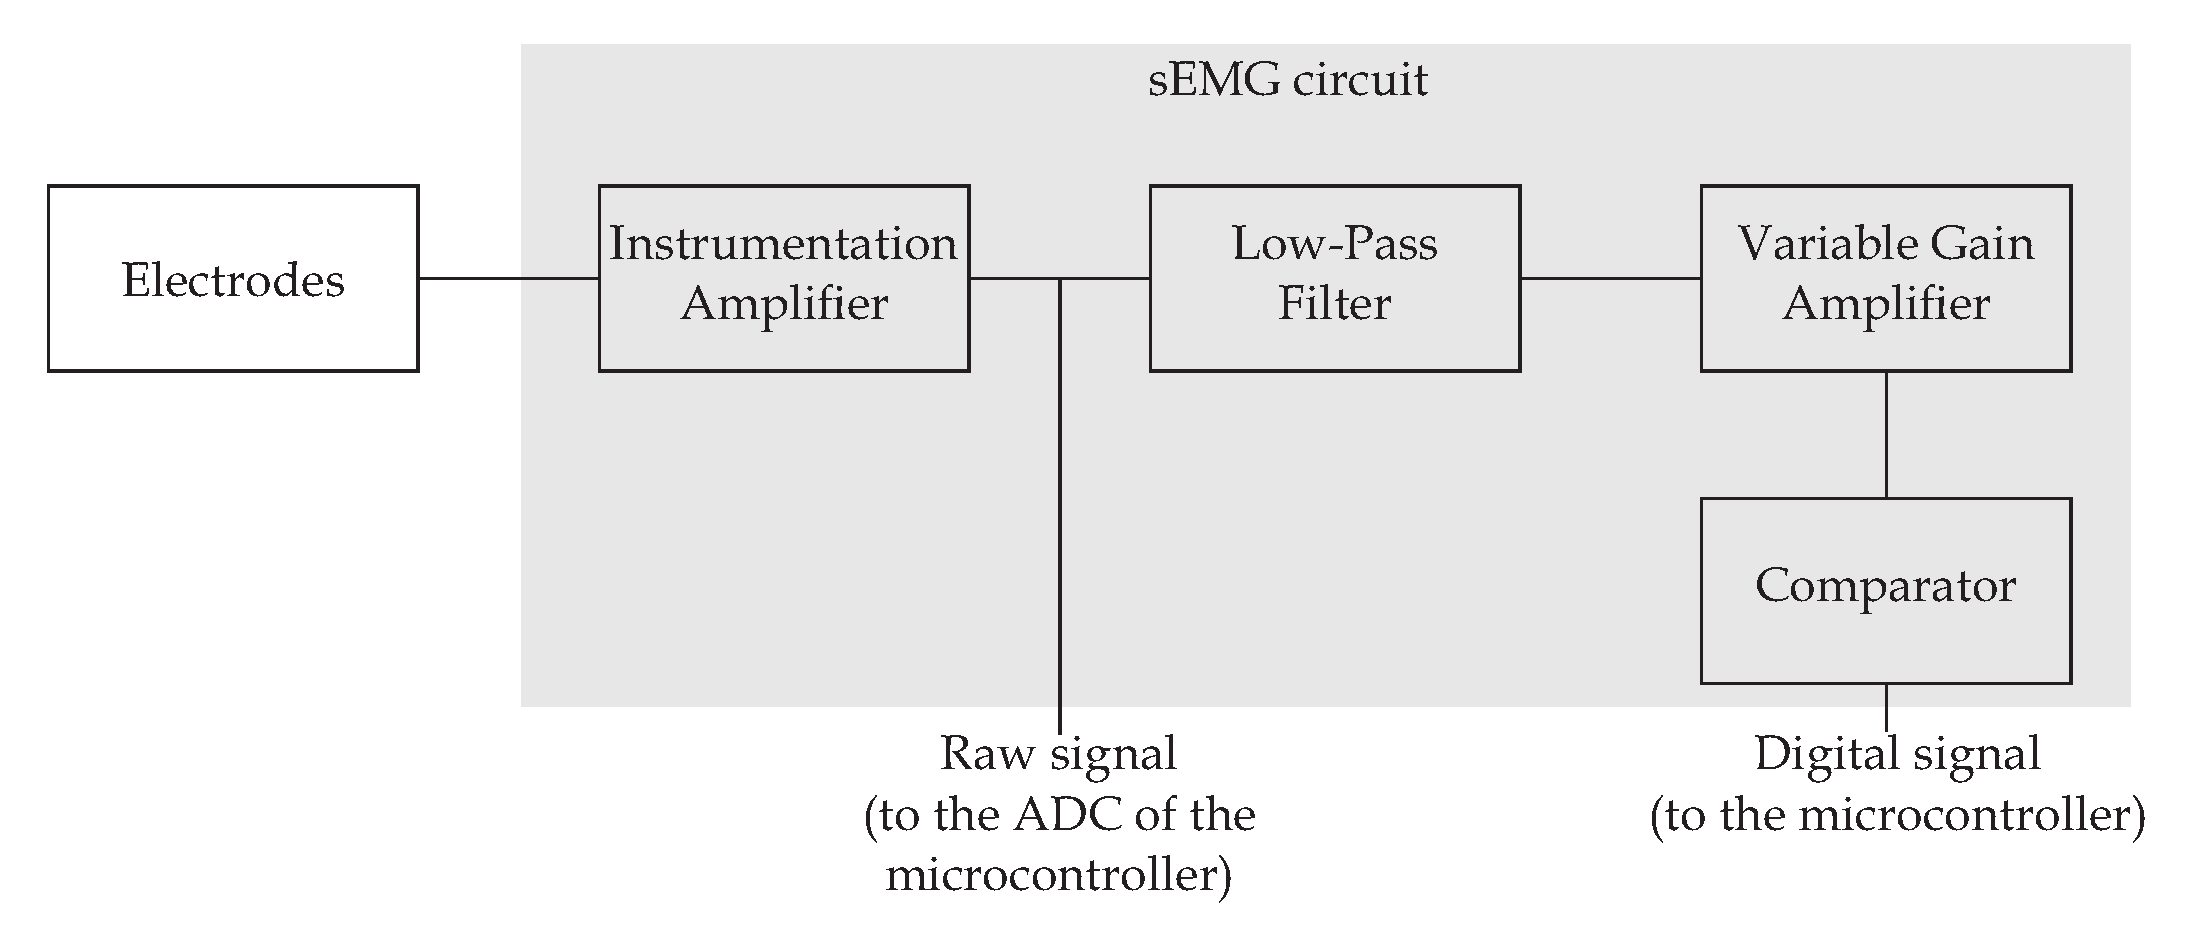
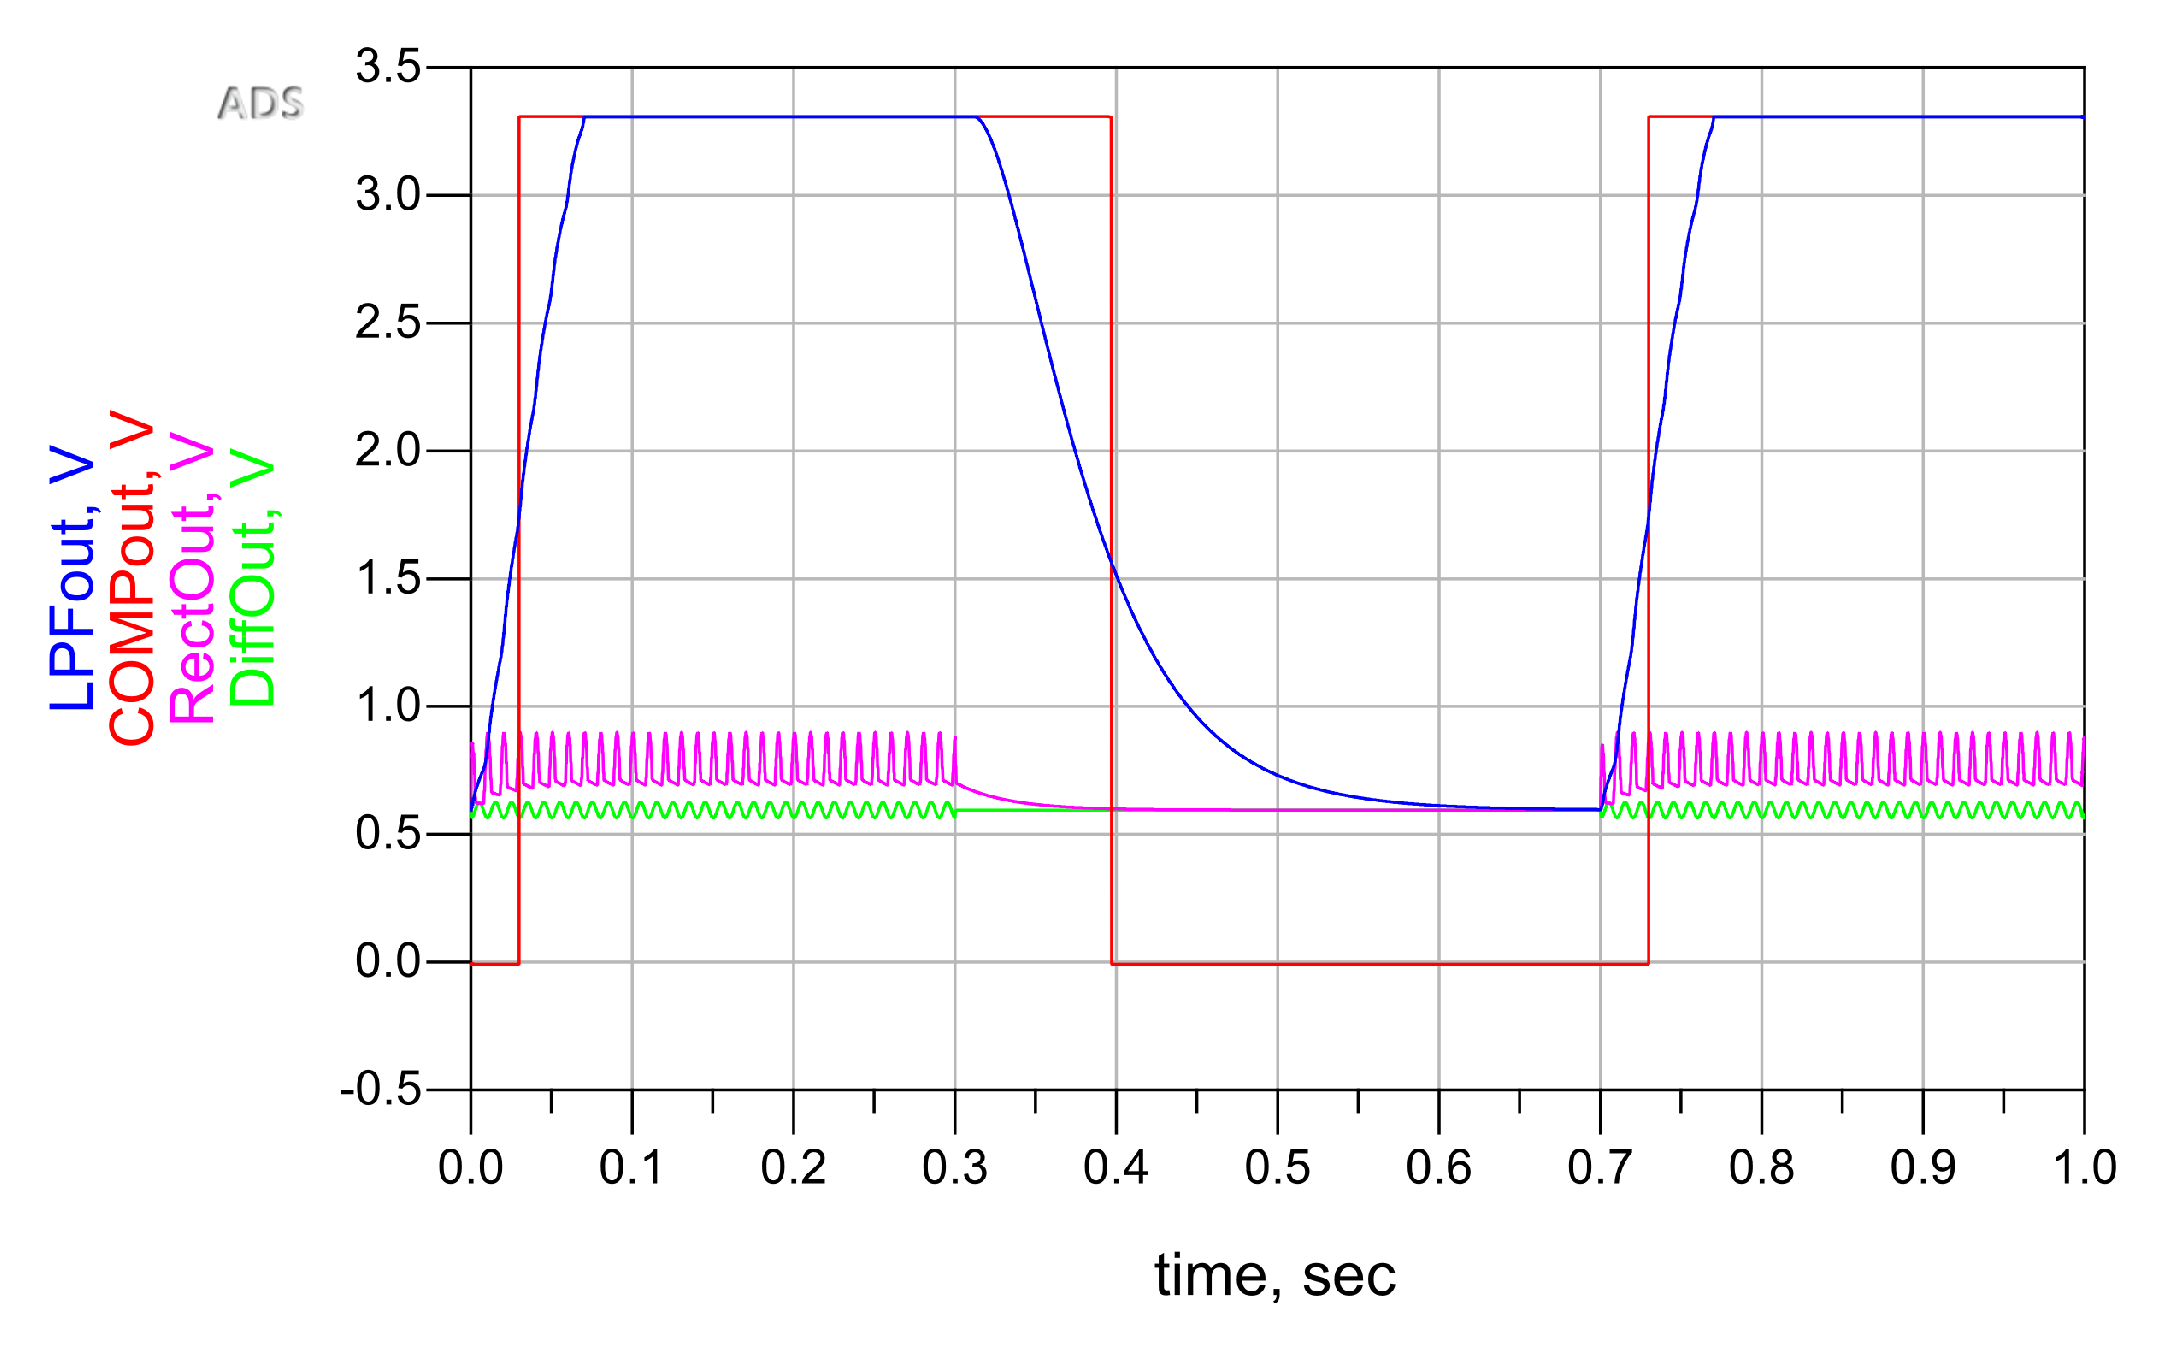
4.2. Hardware of sEMG Board

The custom designed sEMG-HW-1-0-0 is an extension of the IMUboard-HW-1-0-0 previously described. It has onboard the circuital part for detecting and conditioning the muscle activity signal. The sEMG-HW-1-0-0 unit is depicted in Figure 8 and the block diagram is shown in Figure 9.
Figure 10 shows the circuit block schematic of the sEMG. The first stage is a differential instrumentation amplifier with a gain of about 300 V/V. Its output can be routed to the ADC of a processor to analyze the raw data. The second stage is a rectifier block. The signal, then, is fed to a low-pass filter (LPF) with a cut-off frequency at 3 Hz to suppress the rapid muscle contraction. The fourth stage is an amplifier with a variable gain controlled by the processor to equalize the signal amplitude coming from different quality electrodes or different muscles. The final stage is a comparator whose digital output is sampled at 50 Hz by the microprocessor and indicates that there is muscle activity. The sampling frequency used for the sEMG is independent of the IMU sampling frequency. In fact, two different threads are used for acquisitions and writing takes place on two different files. It is important to underline that each measurement is referenced over time, thereby allowing the correct temporal location of the stored measurements.
The circuital simulation performed in Keysight Advanced Design System (ADS) is reported in Figure 11. This circuit allows one to monitor the muscle activity and trigger a specific action without using the microprocessor resources.

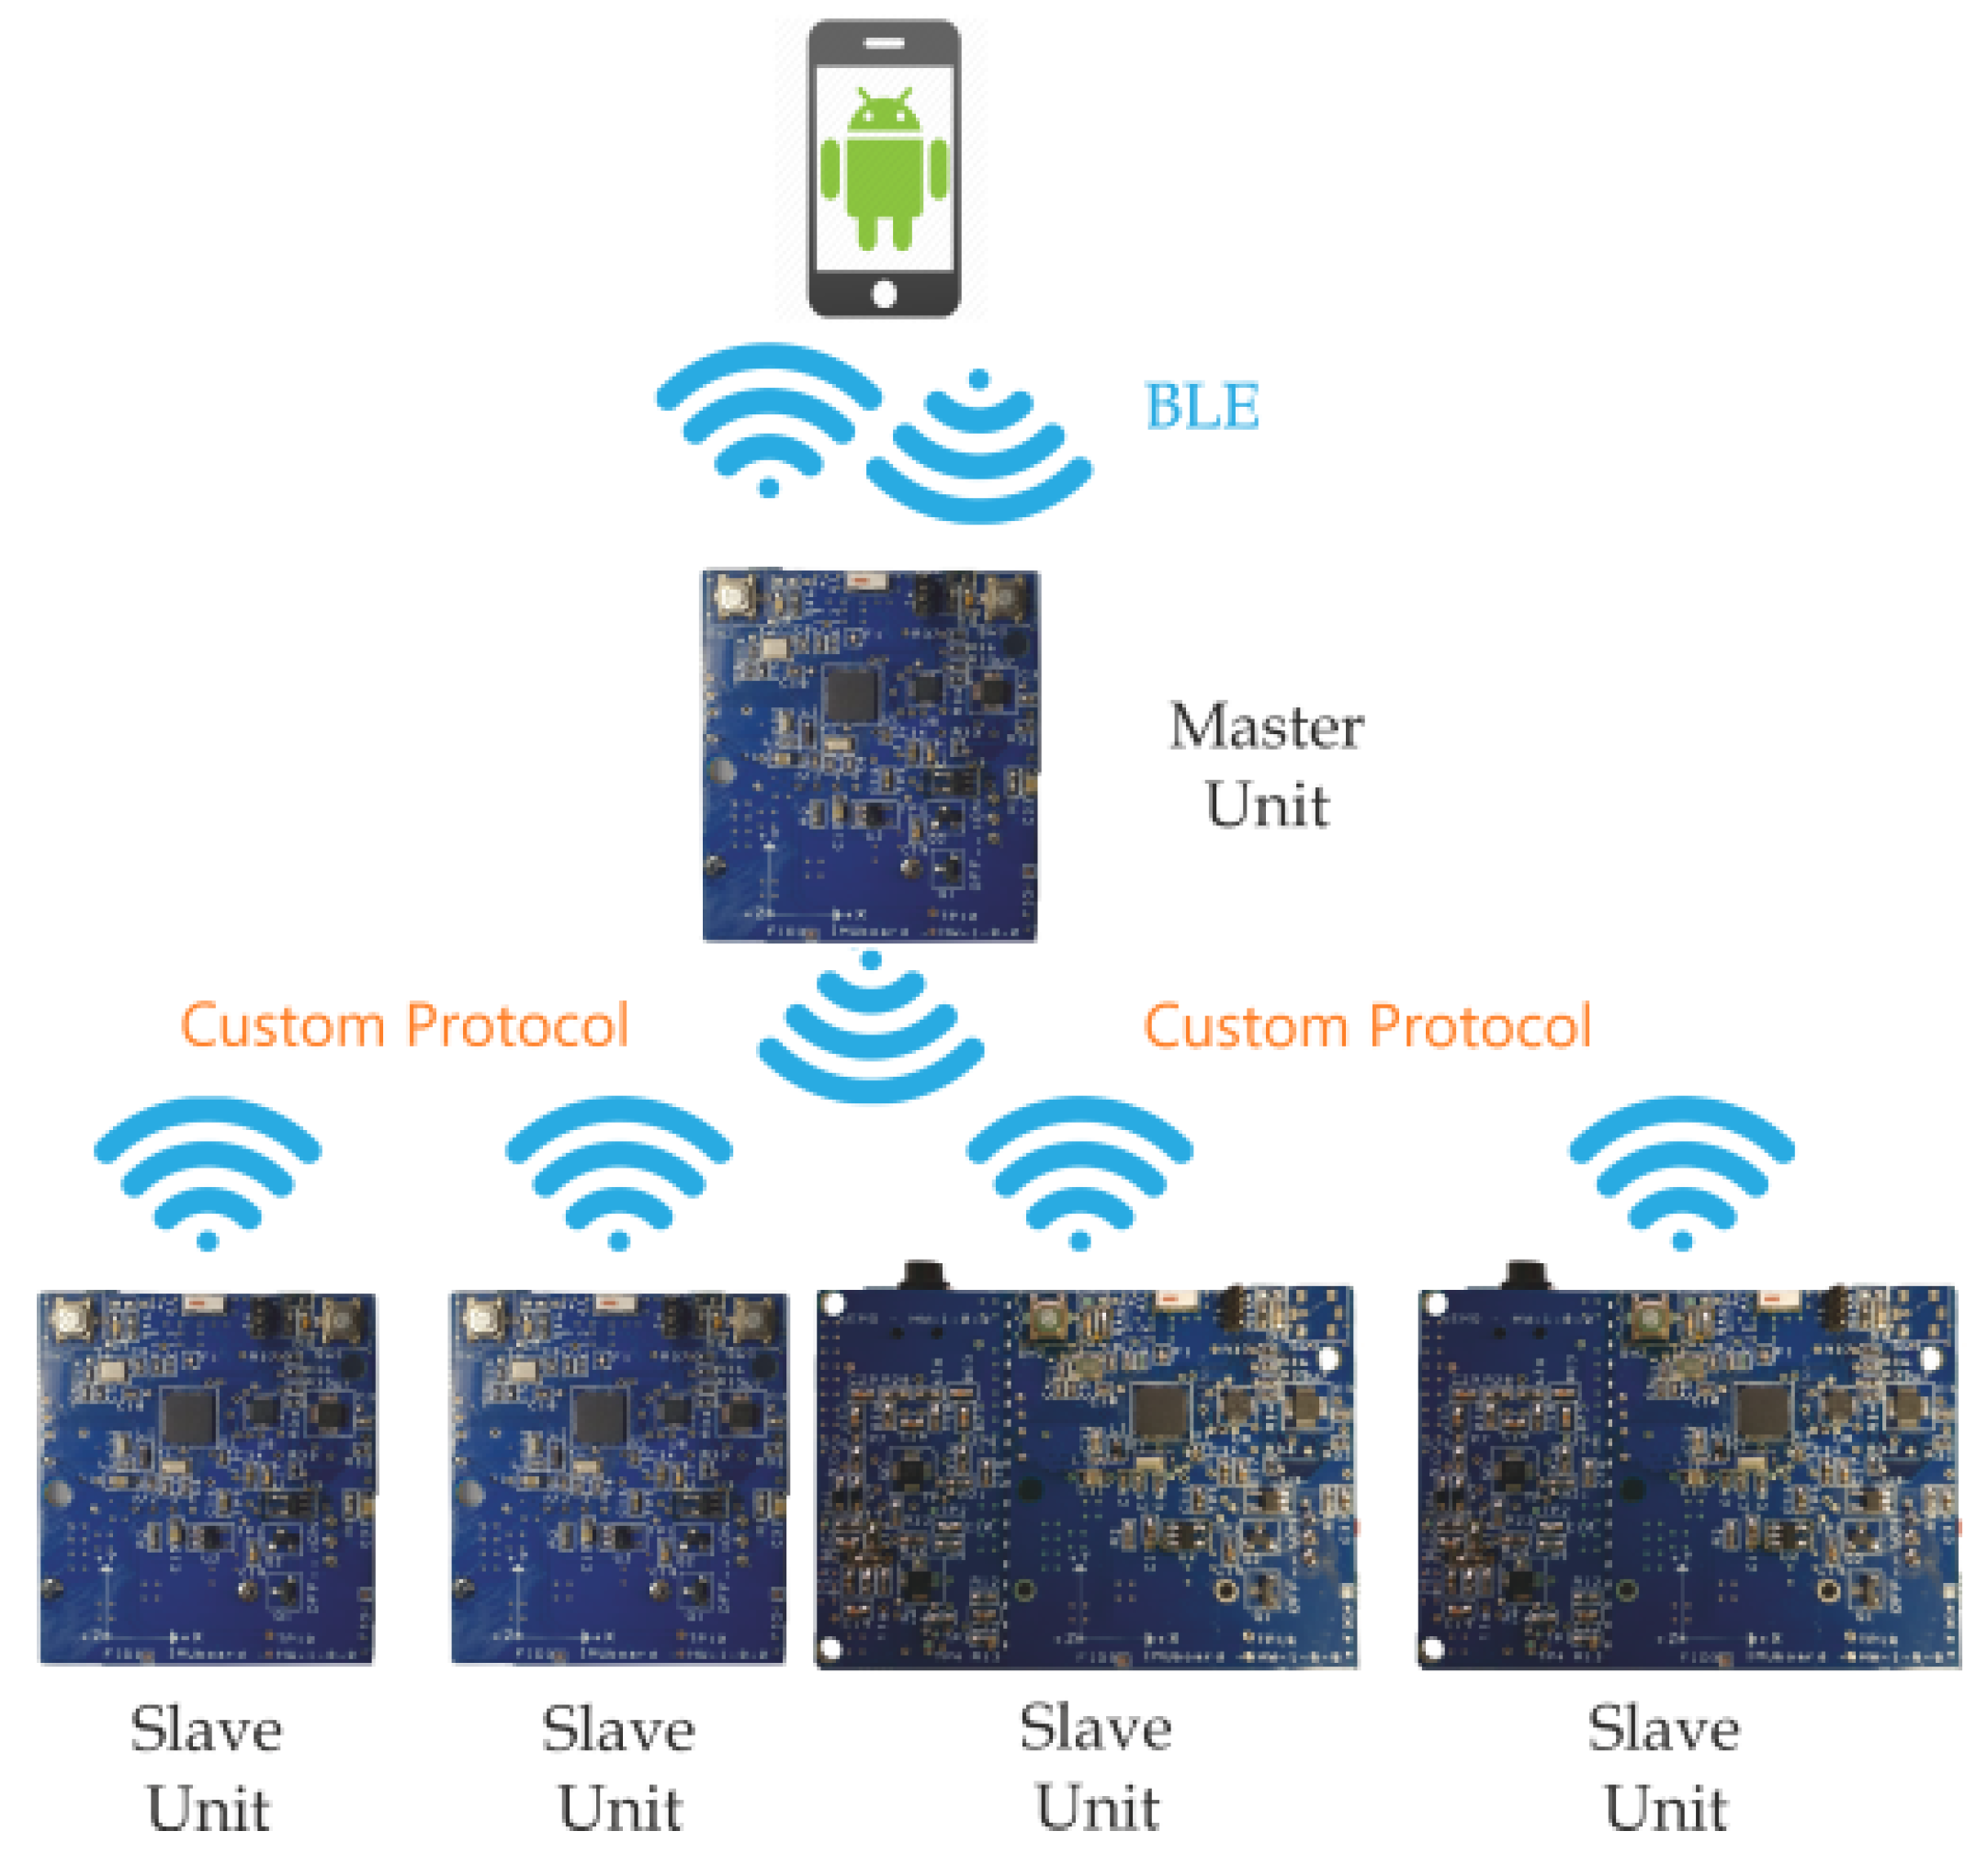
4.3. Master–Slave Architecture

The protocol proposed in this work can be described as a simplified version of the fusion of RBS and FTSP protocols described in Section 2.3. The architecture used is a master–slave architecture, sketched in Figure 12, where the single master node acts as the BAN coordinator. Each BAN has a unique two-byte network ID included in the packets and used for packet filtering. Two types of messages are possible: broadcast messages with no acknowledgment feature which are used when the master needs to communicate with all the slaves in its sub-network and slaveID-oriented messages with an acknowledgment feature for any other communication. The master uses a broadcast message to send its own RTC value at predefined intervals depending on the actual hardware implementation, as it will be discussed in the preceding sections. The slaves refresh their own RTC values according to the values received by the master.
The advantage shared with the RBS protocol is that it eliminates any non-deterministic behavior introduced by the transmitter t T X . The only critical issue is represented by the reception time t R , defined in [25] as the time interval from the message reception up to the end of its processing. Differently from FTSP protocol, a simple update of the RTC register is the only task to perform during the receiving interval. Therefore, the firmware organization is quite critical because it must guarantee that computational delays are reduced to the minimum possible value.

4.4. Android App

The Android app communicates with the master through Bluetooth Low Energy (BLE) protocol. It represents the user interface for starting, pausing, and stopping the local data logging for the entire system. Finally, it gives the actual RTC value at the start-up, as the units have no backup battery for keeping track of the time when switched off.

4.5. Firmware Considerations

As stated in previous sections, the greatest non-deterministic synchronization artifact is represented by t R . The firmware should be organized while striving to reduce the elaboration time of the synchronization packet received by the slaves. The flowchart of the packet reception routine is illustrated in Figure 13 where it can be noticed that the synchronization packet is immediately processed.
Further, the micro SD card R/W interrupt level is lower than the one of the RTC module.
Finally, in order to overcome the issue explained in the Section 3.1.2, the sampling frequency imposed at the IMU is about 200 Hz.

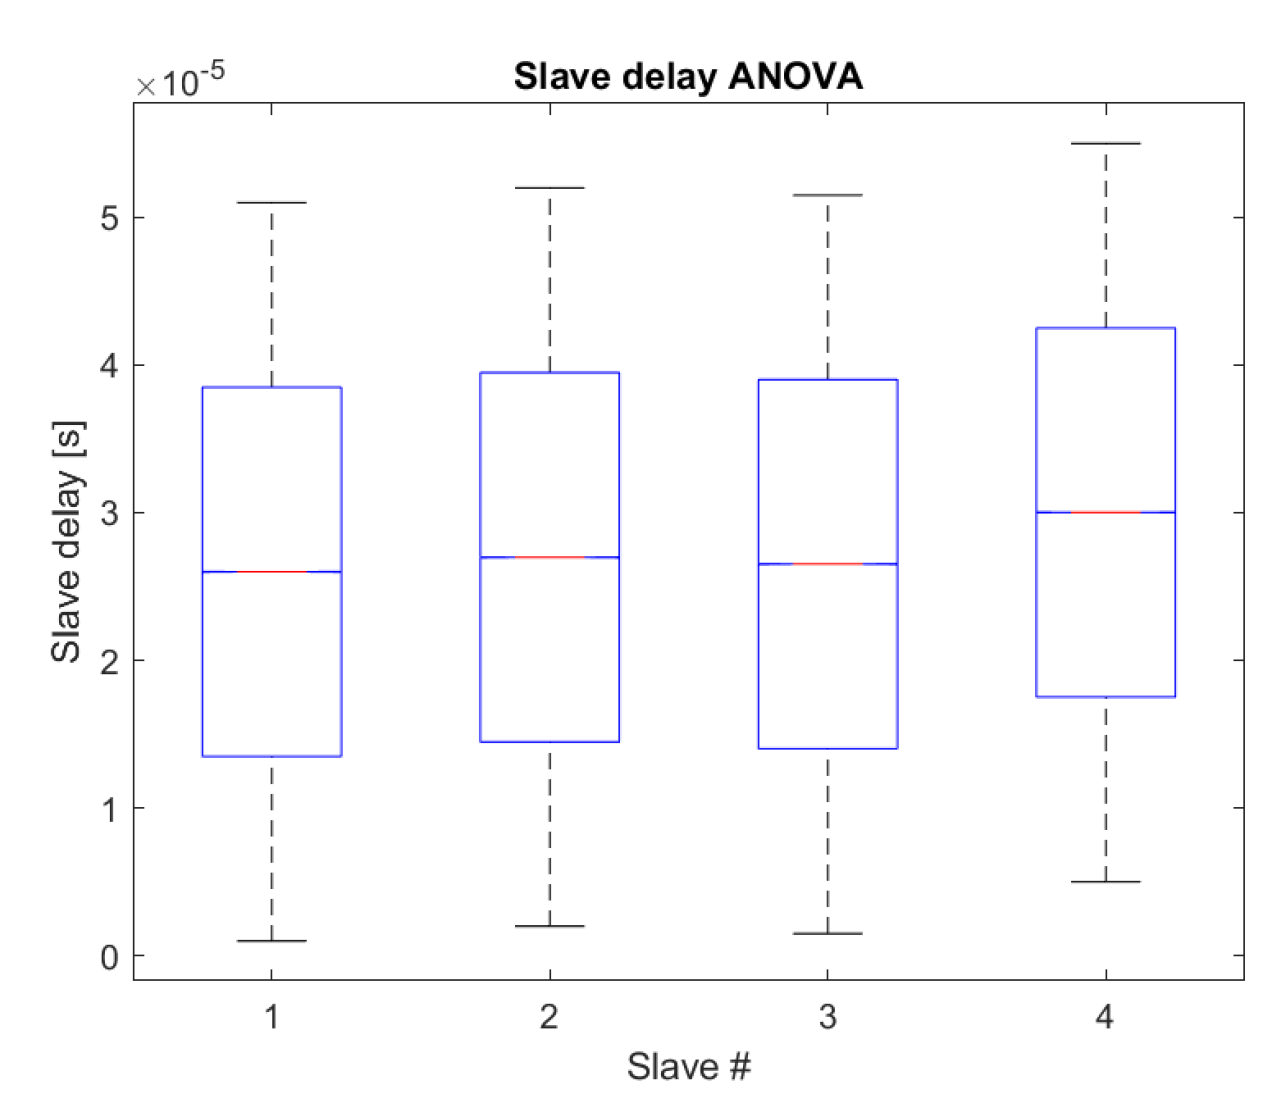
5. Experimental Results

In order to validate the platform performance, different tests were carried out in several application contexts. The hardware settings were: 200 Hz IMU sampling frequency; ≈5 ms RTC resolution; 10 ms IMU sample interval storage in the micro SD card (100 Hz equivalent sampling frequency); 20 s synchronization packet rate; ± 250 dps gyroscope sensitivity; ± 2 g accelerometer sensitivity.

5.1. Rotating Platform

The first setup is shown in Figure 14 where a total of four slaves, two IMUs, and two sEMGs, were mounted on a rotating platform. A microcontroller drives a stepper motor that rotates the disc according to very specific routines quasi-randomly alternating movements and pauses.
Figure 15 reports the analysis of the variance (ANOVA) of the delays for each slave. To that end, the firmware has been modified, lowering the RTC resolution to 10 μ s and introducing a routine for memorizing the time difference between the local and the received timestamp. The test lasted 24 h. The figure evidences that the error distribution is comparable for the four slaves used, its mean value being around 25–30 μ s, and the 25th and 75th percentiles are about 15 μ s and 40 μ s, respectively. The reported results demonstrate that the proposed system can be used in applications with much more stringent synchronization requirements.
Figure 16 shows the raw values along the z-axis for each unit after about 2.5 h. Each waveform is shifted along the y-axis to improve visibility. Perfect synchronization was noticed along the x-axis, as expected. Even in this case the synchronization was perfect, and duplicate samples were not generated, nor was any missing sample reported, demonstrating the effectiveness of the proposed strategy.

5.2. Walking

As stated in the introduction, the proposed system gives the main advantage of cross-relating not only the signals coming from different similar units but even signals coming from units equipped with different sensors, allowing one, thus, to correlate heterogeneous signals and perform more complex processing.
In this configuration, one sEMG unit (slave 1) was placed on the tibia of the right leg and one IMU unit (slave 2) on the tibia of the left leg; the IMU orientation for both legs is shown in Figure 17. The electrodes were positioned, as an exercise, as in Figure 17 to analyze the relationship between muscle activity in the area of the Achilles tendon rather than that of a single muscle. Finally, the master is worn by the user in his pocket. For sake of clarity, an extract of the elaborations made on the data of a walk of a healthy individual during a 24 h logging of his daily activities will be reported and discussed below.
Figure 18 reports the data coming from the gyroscopes, filtered with a bandpass filter with the upper and lower cut-off frequencies of 100 Hz and 2 Hz respectively, along with the electromyography. The figure evidences both the symmetry in the movements of the two lower limbs and the presence of a periodicity in the muscles’ activity in the examined region. In particular, the symmetry can be noticed in the regular zero-crossing moment distribution and in the maximum/minimum values of the measured angular speed. The sEMG ON curve has been normalized to the maximum absolute value of the other waveforms reported in the figure to better visualize it.
The analysis of the angles formed by the tibia in relation to electromyographic data is more relevant. In Figure 19 it is evident that in the analyzed area there is brief muscle activity both in the heel strike and midstance. In this representation the almost-perfect symmetry of the movements of the two limbs is more evident; meanwhile, the measured muscular activity is slightly variable, as it is associated with the walk of a healthy individual during his/her normal day-life, and thus not necessarily following a straight path. This implies that several distinct muscles are involved in the movements. The figure reports the overall activity in the Achille’s tendon area.
Finally, as a last example, Figure 20 shows the raw data of the z-axes of the accelerometers with muscle activity. As in the previous case, the figure evidences the symmetry in the two limbs’ movements. Much more interesting is the difference in the waveform reporting the accelerations along the z-axis that implies a different intensity of the two foot rests.

6. Conclusions

The paper described a platform composed by different units and sensors to be used for long duration monitoring of daily activities. The currently installed and tested sensors are an IMU with nine DoF and a unit for sEMG capable of storing raw data or ON/OFF muscle activation information. The system uses an extremely simple synchronization protocol based on a master–slave architecture, in which the master regularly transmits the reference timestamp. Each slave of the same subnet uses the reference timestamp to avoid time-mismatches.
The reported results aim to demonstrate that all the error sources due to the time synchronization mismatch presented in Section 3 are resolved and overcome. In fact, the synchrony error is below 30 μ s, a value that is far beyond the real needs in this type of application related to human activities.
It is important to underline that the measured time mismatch quantifies the slaves’ ability to align with the master timestamp. We reiterate once again that it is not necessary that the master timestamp has absolute accuracy, but as demonstrated by the reported experiments, it can itself be affected by all the errors exposed in the Section 3.
The reported results demonstrated the effectiveness of the proposed approach, and most of all, its enormous potential, as it allows one to obtain even more complex processing by correlating apparently unrelated measurements by inserting different sensor types.
As a matter of fact, different in-depth analyses are possible by varying the unit number, the sensor types, the positions, and the post-processing of the measurements, allowing one to correlate apparently uncorrelated parameters. The proposed approach allows the use of non-invasive wearable units for long time periods that could evidence any possible anomaly. Usually, it is quite difficult to observe them in a regular laboratory visit where such anomalies are not detected both due to their their sporadic insurgency and the unconscious attitude to correct them while the patient focuses his/her attention on them.
An important evolution of the platform currently under analysis elects the master unit to decision hub rank, appointing him a real-time analysis of a subset of data arriving from the sensor nodes. In this scenario, the master acts as a time coordinator and decision hub. The evolution does not greatly affect the slave units moving the computational complexity to the master.

Author Contributions

Conceptualization, G.C.; Investigation, G.C.; Resources: A.F.; Validation, G.C.; Writing—original draft: G.C. and A.F.; Writing—review & editing: G.C., G.A. and A.F.; Supervision, G.A. All authors have read and agreed to the published version of the manuscript.

Funding

This research received no external funding.

Conflicts of Interest

The authors declare no conflict of interest.

References

  1. Giorgio, A.; Guaragnella, C. ECG Signal Denoising using Wavelet for the VLP effective detection on FPGA. In Proceedings of the 2018 AEIT International Annual Conference, Bari, Italy, 3–5 October 2018; pp. 1–5. [Google Scholar]
  2. Casalino, G.; Castellano, G.; Mencar, C. Data Stream Classification by Dynamic Incremental Semi-Supervised Fuzzy Clustering. Int. J. Artif. Intell. Tools 2019, 28, 1960009. [Google Scholar] [CrossRef]
  3. Ahmed, M.U.; Brickman, S.; Dengg, A.; Fasth, N.; Mihajlovic, M.; Norman, J. A machine learning approach to classify pedestrians’ events based on IMU and GPS. Int. J. Artif. Intell. 2019, 17, 154–167. [Google Scholar]
  4. Carli, R.; Dotoli, M.; Pellegrino, R.; Ranieri, L. Using multi-objective optimization for the integrated energy efficiency improvement of a smart city public buildings’ portfolio. In Proceedings of the 2015 IEEE International Conference on Automation Science and Engineering (CASE), Gothenburg, Sweden, 24–28 August 2015; pp. 21–26. [Google Scholar]
  5. Bianchi, A.; Pizzutilo, S.; Vessio, G. CoreASM-based evaluation of the N-AODV protocol for mobile ad-hoc networks. J. Mob. Multimed. 2016, 12, 31–51. [Google Scholar]
  6. Parkinson, J. An essay on the shaking palsy. J. Neuropsychiatry Clin. Neurosci. 2002, 14, 223–236. [Google Scholar] [CrossRef]
  7. Margiotta, N.; Avitabile, G.; Coviello, G. A wearable wireless system for gait analysis for early diagnosis of Alzheimer and Parkinson disease. In Proceedings of the 2016 5th International Conference on Electronic Devices, Systems and Applications (ICEDSA), Ras Al Khaimah, UAE, 6–8 December 2016; pp. 1–4. [Google Scholar]
  8. Whittle, M.W. Chapter 4—Methods of gait analysis. In Gait Analysis, 4th ed.; Butterworth-Heinemann: Oxford, UK, 2007; pp. 137–175. [Google Scholar]
  9. Salarian, A.; Russmann, H.; Vingerhoets, F.J.; Dehollain, C.; Blanc, Y.; Burkhard, P.R.; Aminian, K. Gait assessment in Parkinson’s disease: Toward an ambulatory system for long-term monitoring. IEEE Trans. Biomed. Eng. 2004, 51, 1434–1443. [Google Scholar] [CrossRef]
  10. Coviello, G.; Avitabile, G. Multiple Synchronized Inertial Measurement Unit Sensor Boards Platform for Activity Monitoring. IEEE Sens. J. 2020, 20, 8771–8777. [Google Scholar] [CrossRef]
  11. Chen, M.; Gonzalez, S.; Vasilakos, A.; Cao, H.; Leung, V.C. Body area networks: A survey. Mob. Netw. Appl. 2011, 16, 171–193. [Google Scholar] [CrossRef]
  12. Martinez, B.; Monton, M.; Vilajosana, I.; Prades, J.D. The power of models: Modeling power consumption for IoT devices. IEEE Sens. J. 2015, 15, 5777–5789. [Google Scholar] [CrossRef] [Green Version]
  13. Wearable IMU Sensor |Motion Sensor| 9DOF-Shimmer3 IMU Unit. Available online: http://www.shimmersensing.com/products/shimmer3-imu-sensor (accessed on 28 May 2020).
  14. NGIMU x-io Technologies. Available online: https://x-io.co.uk/ngimu/ (accessed on 28 May 2020).
  15. Sun, Q.; Zhou, Z.; Jiang, J.; Hu, D. Gait cadence detection based on surface electromyography (sEMG) of lower limb muscles. In Proceedings of the 2014 International Conference on Multisensor Fusion and Information Integration for Intelligent Systems (MFI), Beijing, China, 28–29 September 2014; pp. 1–4. [Google Scholar]
  16. Morbidoni, C.; Cucchiarelli, A.; Fioretti, S.; Di Nardo, F. A Deep Learning Approach to EMG-Based Classification of Gait Phases during Level Ground Walking. Electronics 2019, 8, 894. [Google Scholar] [CrossRef] [Green Version]
  17. Luo, R.; Sun, S.; Zhang, X.; Tang, Z.; Wang, W. A Low-Cost End-to-End sEMG-Based Gait Sub-Phase Recognition System. IEEE Trans. Neural Syst. Rehabil. Eng. 2020, 28, 267–276. [Google Scholar] [CrossRef] [PubMed]
  18. Laerhoven, K.V.; Gellersen, H.W.; Malliaris, Y.G. Long term activity monitoring with a wearable sensor node. In Proceedings of the International Workshop on Wearable and Implantable Body Sensor Networks (BSN’06), Cambridge, MA, USA, 3–5 April 2006; pp. 4–174. [Google Scholar]
  19. Cancela, J.; Pastorino, M.; Arredondo, M.T.; Pansera, M.; Pastor-Sanz, L.; Villagra, F.; Pastor, M.A.; Gonzalez, A.P. Gait assessment in Parkinson’s disease patients through a network of wearable accelerometers in unsupervised environments. In Proceedings of the 2011 Annual International Conference of the IEEE Engineering in Medicine and Biology Society, Boston, MA, USA, 30 August–3 September 2011; pp. 2233–2236. [Google Scholar]
  20. Oniga, S.; Tisan, A.; Bólyi, R. Activity and health status monitoring system. In Proceedings of the 2017 IEEE 26th International Symposium on Industrial Electronics (ISIE), Edinburgh, UK, 8 August 2017; pp. 2027–2031. [Google Scholar]
  21. Fischer, M.J. The consensus problem in unreliable distributed systems (a brief survey). In Foundations of Computation Theory; Karpinski, M., Ed.; Springer: Berlin/Heidelberg, Germany, 1983; pp. 127–140. [Google Scholar]
  22. Cristian, F. Probabilistic clock synchronization. Distrib. comput. 1989, 3, 146–158. [Google Scholar] [CrossRef]
  23. Gusella, R.; Zatti, S. The accuracy of the clock synchronization achieved by TEMPO in Berkeley UNIX 4.3BSD. IEEE Trans. Softw. Eng. 1989, 15, 847–853. [Google Scholar] [CrossRef] [Green Version]
  24. Elson, J.; Girod, L.; Estrin, D. Fine-grained network time synchronization using reference broadcasts. ACM SIGOPS Oper. Syst. Rev. 2002, 36, 147–163. [Google Scholar] [CrossRef]
  25. Maróti, M.; Kusy, B.; Simon, G.; Ledeczi, A. The Flooding Time Synchronization Protocol. 2004, pp. 39–49. Available online: https://dl.acm.org/doi/abs/10.1145/1031495.1031501 (accessed on 28 May 2020).
  26. Wang, S.; Shi, M.; Li, D.; Du, T. A Survey of Time Synchronization Algorithms for Wireless Sensor Networks. In Proceedings of the 2019 Chinese Control Conference (CCC), Guangzhou, China, 27–30 July 2019; pp. 6392–6397. [Google Scholar]
  27. AT03155: Real-Time-Clock Calibration and Compensation. Available online: http://ww1.microchip.com/downloads/en/appnotes/atmel-42251-rtc-calibration-and-compensation_ap-note_at03155.pdf (accessed on 23 March 2020).
  28. Abracon 32.768 kHz Low Profile Crystal. Available online: http://abracon.com/Resonators/ABS07.pdf (accessed on 28 November 2019).
  29. Blazinsek, I.; Chowdhury, A. Enhancing the accuracy of standard embedded RTC module with random synchronization events and dynamic calibration. Przeglad Elektrotechniczny 2016, 92, 248–251. [Google Scholar] [CrossRef]
  30. ISL12022 RTC Accuracy Optimization Calibration Procedure—Application Note. Available online: https://www.renesas.com/us/en/www/doc/application-note/an1400.pdf (accessed on 28 November 2019).
  31. Underwood, S. Implementing a Temperature Compensated RTC—Application Note. Available online: http://www.ti.com/lit/ml/slap107/slap107.pdf (accessed on 28 November 2019).
  32. Munoz Diaz, E.; Heirich, O.; Khider, M.; Robertson, P. Optimal sampling frequency and bias error modeling for foot-mounted IMUs. In Proceedings of the International Conference on Indoor Positioning and Indoor Navigation, Montbeliard-Belfort, France, 28–31 October 2013; pp. 1–9. [Google Scholar]
  33. Provot, T.; Chiementin, X.; Oudin, E.; Bolaers, F.; Murer, S. Validation of a High Sampling Rate Inertial Measurement Unit for Acceleration During Running. Sensors 2017, 17, 1958. [Google Scholar] [CrossRef] [PubMed] [Green Version]
  34. TDK MPU-9250 Datasheet. Available online: https://invensense.tdk.com/wp-content/uploads/2015/02/PS-MPU-9250A-01-v1.1.pdf (accessed on 28 November 2019).
Figure 1. Crystal frequency drift with load capacitance.
Electronics 09 01118 g001
Figure 2. Crystal frequency drift with temperature.
Electronics 09 01118 g002
Figure 3. Real-time clock (RTC) difference between two identical boards.
Electronics 09 01118 g003
Figure 4. Inertial measurement unit (IMU) clock misalignment for two different boards.
Electronics 09 01118 g004
Figure 5. IMU timestamp error: (a) global view and (b) zoom.
Electronics 09 01118 g005
Figure 6. Top and bottom view of IMUboard-HW-1-0-0 unit.
Electronics 09 01118 g006
Figure 7. IMUboard-HW-1-0-0 unit block diagram.
Electronics 09 01118 g007
Figure 8. Top and bottom view of sEMG-HW-1-0-0 unit.
Electronics 09 01118 g008
Figure 9. sEMG-HW-1-0-0 unit block diagram.
Electronics 09 01118 g009
Figure 10. Superficial electromyography (sEMG) circuit block diagram.
Electronics 09 01118 g010
Figure 11. sEMG Advanced Design System (ADS) simulation.
Electronics 09 01118 g011
Figure 12. Master–slave architecture.
Electronics 09 01118 g012
Figure 13. Flowchart of the packet reception routine.
Electronics 09 01118 g013
Figure 14. Experimental arrangement on a rotating platform.
Electronics 09 01118 g014
Figure 15. Analysis of the variance (ANOVA) test.
Electronics 09 01118 g015
Figure 16. Gyroscope raw data.
Electronics 09 01118 g016
Figure 17. Units placement, achilles tendon area detail, electrode placement, and IMU orientation.
Electronics 09 01118 g017
Figure 18. Gyroscope x-axis filtered data for slaves 1 and 2.
Electronics 09 01118 g018
Figure 19. Roll angles for slaves 1 and 2.
Electronics 09 01118 g019
Figure 20. Accelerometer z-axis raw data for slaves 1 and 2.
Electronics 09 01118 g020

