Abstract
Terahertz (THz) communication is a key candidate for the upcoming age of beyond-fifth-generation mobile networks (B5G) or sixth-generation mobile networks (6G) in the next decade and can achieve ultra-high data rates of dozens of gigabits or even terabits per second. As the carrier frequency increases from radio frequency (RF) to the THz band, the impact of meteorological factors on the wireless link is expected to become more pronounced. In this work, we first provide an overview of the attenuation caused by atmospheric gases, fog, and rain on terrestrial THz wireless communications using the recommendations of the International Telecommunication Union-Radiocommunication (ITU-R). Measured data from the literature are used to predict the attenuation caused by snow. Because unfavorable weather conditions may harm sensitive measurement equipment, ray-tracing (RT) simulations are sometimes used as an alternative to extend sparse empirical data. In this study, the terrestrial channel in an urban scenario at 300 GHz, with a bandwidth of 8 GHz, is characterized using RT simulations under different meteorological factors. The key performance parameters are explored, including path loss (PL), Rician K-factor (KF), root-mean-square (RMS) delay spread (DS), and four angular spreads. The channel characteristics under different meteorological conditions studied in this work are expected to aid the design of future outdoor terrestrial THz communications.
1. Introduction
In recent years, data traffic has exploded with the accelerated development of multimedia services. Future communication systems need to meet the demands of ultra-high-speed access in various complex environments. As terahertz (THz) communications can achieve high data rates of dozens of gigabits or even terabits per second without any efficiency enhancement techniques, it is considered one of the leading candidates for the upcoming age of beyond-fifth-generation mobile networks (B5G) or sixth-generation mobile networks (6G) in the next decade. The deployment scenarios for THz communications are considerably diverse, including wireless personal area networks (WPANs) [1], wireless local area networks (WLANs), kiosk downloading [2], chip-to-chip communications [3], wireless fronthaul/backhaul, and vehicular communications [4].
From a technological point of view, the implementation of THz communication systems still poses a series of challenges, such as transceiver systems and ultra-high-gain antennas. Emerging hardware technologies have been formulated to address the challenges of THz communications; in particular, very dense ultra-massive multiple-input multiple-output (UM-MIMO) antenna arrays [5] have been proposed to provide extremely high directive gain to solve the high path loss (PL) problem. The reconfigurable intelligent surfaces (RISs) proposed in [6] deploy reflector units to achieve non-line-of-sight (NLOS) connections with relatively low losses. Moreover, in [7,8], the authors conducted surveys on the extensive hardware problems. Aside from these hardware issues, as the carrier frequency increases from the radio frequency (RF) range to millimeter waves (mmWave) to the THz band, the impacts of meteorological factors on the wireless links are expected to become more pronounced. Typically, atmospheric gases, fog, rain, and snow are the main factors of interest.
When electromagnetic (EM) waves pass through the atmosphere, the absorption of wave energy by atmospheric molecules causes attenuation. Water vapor and oxygen molecules are notably the main contributors to atmospheric attenuation by gases. The authors of [9] used a Fourier transform infrared (FTIR) spectrometer to measure the atmospheric amplitude transmission spectrum for horizontal beam propagation in the range of 150–510 GHz. In response to the need of the communications field to model the attenuation due to atmospheric gases, the International Telecommunication Union-Radiocommunication (ITU-R) provided an accurate methodology to calculate the atmospheric attenuation in the frequency range from 1 GHz to 1000 GHz in the standard ITU-R P.676-11 [10].
The attenuation caused by fog largely depends on the density of the liquid water within the fog through which the EM wave propagates. In contrast to the large optical power loss in infrared (IR) communication, the attenuation levels due to fog for THz waves are typically much lower. As recommended by the ITU-R P.840-7 [11], the Rayleigh approximation is a valid method to describe the specific attenuation due to fog.
Although the specific attenuation caused by rain can be ignored at the sub-6-GHz frequency band, it must be considered at higher frequencies, where its importance increases rapidly. Mie scattering occurs when the scatterer’s size is nearly equal to that of the wavelength of the incident rays. As raindrop particle sizes and THz wavelengths are of similar scales, studying the effects of rainfall on THz band communications is considered significant. The impacts of rainfall on EM wave propagation have been widely studied for the infrared, microwave, and mmWave bands [12]. Studies have concluded that rainfall can cause attenuation of the received power and even interrupt the wireless connection in serious cases. In [13], the authors concluded that attenuation due to rain increases with increasing rainfall intensity, whereas the temperature had little effect on such attenuation. In the THz range, Ishii [14] calculated the attenuations due to rain at 313 GHz and 355 GHz using four raindrop size distributions. They are the Marshall–Palmer, Best, Polyakova–Shifrin, Weibull raindrop-size distributions, and with a specific attenuation model using the prediction method recommended by the ITU-R P.838-3 [15]; it was shown that these propagation experiment results were in line with the specific attenuation prediction model of the ITU-R.
Snowflakes are known to have various shapes and surface configurations, and the typical structures are columnar, needle-like, and dendritic crystals. Snowflakes are mainly composed of air, liquid water, and ice. Since the size of a snowflake is comparable to wavelengths in the THz band, such as 100 GHz with a wavelength of 3 mm, the influence of snow on attenuation is expected to be more significant. In [16], the measurement results implied that wet snow might cause three times greater attenuation compared to rainfall at the same rate. In [17], the authors divided snow into wet and dry snowfall; their measured data indicated that wet snowfall might cause greater attenuation compared to dry snowfall. However, until now, there are too few reported experimental works on the influence of snow on attenuation to model these effects at THz frequencies.
However, a few experimental studies have been reported in the THz frequency range, particularly for terrestrial measurements under different unfavorable weather conditions that may harm the sensitive measurement equipment. Therefore, in order to extend the channel measurements to more general cases, the ray-tracing (RT) simulator is employed as an alternative to extend the sparse empirical data. With the help of the measurement-calibrated RT simulator, the wireless channel can be characterized and analyzed for different meteorological conditions. As the impact of such meteorological criteria on wave propagation is undoubtedly a factor limiting the availability of wireless links, we intend to systematically and quantitatively discuss the influence of different meteorological factors on outdoor terrestrial wireless channel communications.
In this work, we investigated the fundamental impacts of several meteorological factors on THz propagation, and the following contributions are made:
- We provide an overview of the prediction methods for attenuations caused by different meteorological factors on THz communications, including atmospheric gases, fog, rain, and snow.
- We reconstruct a typical urban scenario and conduct simulations using the measurement-validated RT simulator at 300 GHz for a bandwidth of 8 GHz. The transmitter (Tx) is fixed to a traffic light at a height of 5 m. The receiver (Rx) is placed on a moving bus. Since the above-mentioned meteorological factors have considerable influence on the THz wireless channel, we add attenuations caused by atmospheric gases, fog, rain, and snow to each ray simulated in the urban scenario.
- Based on extensive simulation results, the terrestrial channel in the urban scenario is characterized in terms of PL, shadow fading (SF), Rician K-factor (KF), root-mean-square (RMS) delay spread, and four angular spreads (azimuth angular spread of arrival (ASA), azimuth angular spread of departure (ASD), elevation angular spread of arrival (ESA), and elevation angular spread of departure (ESD)). These parameters are expected to provide the fundamental data for designing THz communication systems in similar scenarios under different meteorological situations.
The remainder of this paper is organized as follows. In Section 2, we provide a brief summary of the prediction methods for meteorological attenuations, including those by atmospheric gases, rain, fog, and snow. In addition, the processing steps to add the corresponding attenuations to a wideband channel with multi-frequency points are furnished. Section 3 introduces the simulation scenarios and simulation configurations. In Section 4, all the channel parameters are characterized for the various meteorological factors. Finally, the conclusions and future work are presented in Section 5.
2. Attenuation Due to Different Meteorological Factors
In this section, we present the prediction methods suggested by ITU-R and the representative measurements for attenuations caused by atmospheric gases, fog, rain, and snow. Thereafter, since the RT simulator calculates the propagation loss from the classic propagation mechanisms, including line-of-sight (LOS), reflection, diffraction, penetration, and scattering, we provide the processing steps to add the attenuations caused by these meteorological factors for the RT simulation results.
2.1. Attenuation Due to Atmospheric Gases
The oxygen molecule has a magnetic dipole moment, and the water molecule has a residual electric dipole moment. Under the action of an electromagnetic field, when the frequency of the incident electromagnetic wave is similar to that of the molecular rotational energy level, the molecule absorbs the energy of the electromagnetic wave, and its rotational energy level transits from low to high via resonance absorption. As the reflected or scattered rays travel farther than the direct ray, they will suffer more attenuation. Thus, the specific attenuation due to atmospheric gases for a travel distance of d (km) for each ray can be calculated as follows:
The specific attenuation (dB/km) can be obtained from the ITU-R P.676-11 recommendation [10]. Figure 1 shows the specific atmospheric attenuation using the prediction method, which can be used in the range of 0–1000 GHz at intervals of 1 GHz, for a pressure of 1013.25 hPa, temperature of 15 C, water vapor density of 7.5 g/m (standard atmosphere, red curve), and dry atmosphere (cyan curve).
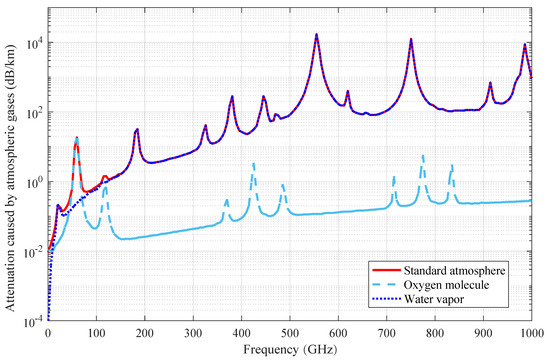
Figure 1.
Attenuation caused by the typical standard atmosphere, comprising the individual influences of oxygen molecules (cyan curve) and water vapor (blue curve).
2.2. Attenuation Due to Fog
With their similar microphysical structures, cloud and fog are characterized by their liquid water densities, optical visibilities, and droplet size distributions. The typical values of liquid water density are 0.05 g/m for medium fog (visibility of the order of 300 m) and 0.5 g/m for thick fog (visibility of the order of 50 m). For terrestrial links, it can be assumed that a wireless link is operated below cloud height. However, the attenuation due to fog may be of interest for urban scenarios. As recommended by the ITU-R P.840-7 [11], the Rayleigh approximation is a valid method to describe the specific attenuation caused by fog as follows:
where (dB/km) is the specific attenuation from fog, is the liquid water specific attenuation coefficient, M is liquid water density (g/m), f is the operating frequency in GHz, and T is the liquid water temperature in (K); is given as follows:
where
where and are the complex dielectric permittivities of water which can be calculated as follows:
Here, is the principal relaxation frequency and is the secondary relaxation frequency, which are equal to
The other related coefficients are as follows:
Finally, the attenuation due to fog based on the travel distance d (km) of each ray can be calculated as follows:
2.3. Attenuation Due to Rain
In the ITU-R P.838-3 standard [15], the specific rain attenuation (dB/km) is predicted for a given rainfall rate R in mm/h, which increases exponentially up to the critical frequency, both for light and heavy rain. This attenuation can be calculated according to the following relationship:
where k and are the functions of the operating frequency f in the range from 1 GHz to 1 THz as well as other parameters, such as temperature, polarization direction (horizontal and vertical), altitude, and other factors. For linear and circular polarizations and all path geometries, k and can be calculated as follows:
where is the path elevation angle and is the polarization angle relative to the horizontal. The frequency-dependent values , , , and can be obtained from [15].
In addition, the rainfall rate in the ITU-R P.837-7 [18] represents the annual rainfall rate that is exceeded for only 0.01% of the time in the target region. The value of the rainfall rate is provided by a digital map and the corresponding latitude and longitude information. If the geographical position of the desired region is not on the grid point provided by the digital map, the value of the nearest grid point position is considered. Then, an estimation of a given path attenuation that is exceeded for 0.01% of the time is given by the ITU-R P.530-17 [19] as follows:
where is the effective path length obtained by multiplying the actual travel length d (km) and a distance factor r, which is estimated as follows:
where f (GHz) is the carrier frequency and is the exponent in the specific attenuation modeled using Equation (16). Specifically, the maximum recommended r is 2.5. Thus, if the calculated value is greater than 2.5, r is directly equated to 2.5.
2.4. Attenuation Due to Snow
Because of the existence of a few studies on the attenuation caused by snow, the ITU-R does not provide a computational method for prediction of such attenuation. In our work, we use the measurement data from [20]. As shown in Figure 2a, the 8-m LOS path was measured under a significant snowstorm condition. The Tx was located under an overhanging roof, and the wave directly propagated through the snow to the Rx. The attenuation magnitude was measured in the frequency range of 50–300 GHz, as shown in Figure 2b. The measurement data shown in Figure 2b can be converted in terms of the unit (dB/km). For instance, the attenuation caused by snow at 300 GHz is 2.8 dB/8 m or 350 dB/km. Thus, the for each ray and each frequency point can be calculated with the corresponding travel distance d of each ray as follows:
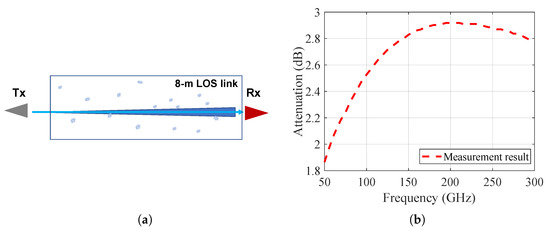
Figure 2.
Attenuation caused by snow. (a) schematic of measurement campaign; (b) measured attenuation caused by snow from [20].
2.5. Processing Steps to Add the Attenuations Caused by the Different Meteorological Factors
Because the attenuations caused by the meteorological factors are frequency dependent, the calculation of each attenuation at different sub-bands is necessary in THz systems with ultra-wide bandwidth. Moreover, the above-mentioned attenuations mostly apply to the attenuation of the signal power. In our study, we assume a Gaussian random phase of the electric field in (,) for each ray after transmitting through atmospheric gases, rain, fog, and snow.
The focused total attenuation due to these meteorological factors for the mth ray at the nth frequency point is as follows:
The power of the mth ray at the nth frequency point from RT simulation results without attenuation caused by the meteorological factors can be calculated as:
where and denote the corresponding electric field amplitude and phase, respectively.
Then, the power of the mth ray at the nh frequency point after attenuation due to the different meteorological factors can be obtained as follows:
Lastly, the electric field vector after attenuation due to different meteorological factors can be processed as follows:
where a random phase follows the Gaussian distribution in (,) for the mth ray.
Then, the channel transfer function (CTF) for a certain snapshot is calculated as
where and are the numbers of frequency points and rays, respectively, and is the nth frequency point. The average channel impulse response (CIR) for the wideband channel in a given snapshot is obtained as:
where is the phase at the central frequency point of the mth ray, and is the time of arrival of the mth ray. Thus, the power delay profile () after attenuation can be calculated as follows:
Here, is independent of the phase of the central frequency but is related only to the average amplitude of the electric field of each ray after attenuation.
2.6. Validation of RT with the Attenuations Caused by the Meteorological Factors
In order to validate the RT engine and the processing steps to add the attenuation to the RT results, we reproduce the measurement data for the attenuation by snow. First, we simulate an 8-m LOS path in the frequency range between 50 GHz and 300 GHz and add the attenuation caused by snow. As shown in Figure 3a, the red curve is the RT simulation result without considering the attenuation by any meteorological factor. The blue curve is the post-processed RT result with attenuation due to snow. The difference between these two curves is the attenuation caused by snow. As shown in Figure 3b, it is seen that the post-processing steps can accurately reproduce the measurement results.
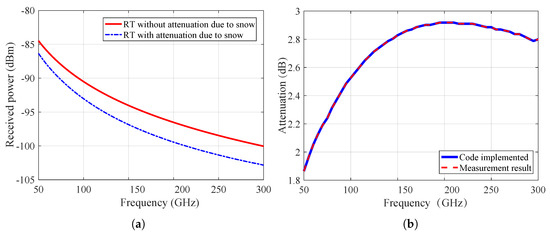
Figure 3.
Validation of ray-tracing (RT) with attenuation caused by snow. (a) RT result vs. RT result with the attenuation caused by snow; (b) comparison between the measured attenuation magnitude (red dot curve) and post-processed RT results (blue curve).
Then, we simulate a 1-m LOS path in the frequency range between 300 GHz and 1500 GHz with a sub-frequency wideband of 5 GHz (totally 241 frequency points), and add the attenuation caused by water vapor with 70.84% relative humidity. The water vapor absorption is calculated using parameters from HITRAN. We refer to the prediction method from [21] to post-process the RT result. As can be seen from Figure 4a, the red curve is directly calculated with free space path loss by RT simulator and the blue curve is the post-processed RT result with the attenuation caused by water vapor with 70.84% relative humidity. In order to observe the change of attenuation value due to water vapor itself with frequency, we removed the free space path loss in the simulation results, as shown in Figure 4b. Moreover, in order to compare with the measured data more clearly, we change the natural coordinate into the semilog coordinate. The mean absolute error between measurement data and simulation data of 241 frequency points is 0.403 dB. This means that the predicted method of the attenuation caused by water vapor can adequately reproduce the measured results. Therefore, the RT engine, as well as the processing steps to add the attenuations, can adequately reproduce the channel measurements under the specified meteorological conditions.
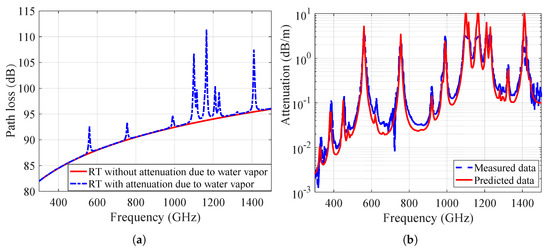
Figure 4.
Validation of RT with attenuation for 70.84% relative humidity. (a) RT result vs. RT result with the attenuation for 70.84% relative humidity; (b) comparison between the measured (red) and predicted (blue) attenuation for 70.84% relative humidity.
3. RT Simulation in an Urban Scenario at 300 GHz
The cloud-based RT simulator (CloudRT) used in this work was developed at Beijing Jiaotong University. The hardware for our RT simulator comprises a high-performance computing (HPC) cluster, which contains 1600 CPUs and 10 GPUs. Parallel processing can be realized by the computing nodes and supervised by the managing nodes. The first prerequisite for accurate RT simulation is a detailed and accurate description of the environment. The finer the modeled environment, the higher is the corresponding prediction accuracy and the longer is the calculation time. The binary space partitioning (BSP) algorithm [22] was applied to accelerate the “image method” based RT simulation. Thus, owing to the parallel processing and the acceleration technique, the running time of the RT simulation tasks were greatly shortened.
Based on image theory, CloudRT can output more than 10 properties of each ray, including the type of ray, reflection order, time of arrival, complex amplitude, azimuth angle of arrival (AoA), azimuth angle of departure (AoD), elevation angle of arrival (EoA), and elevation angle of departure (EoD), among others. More information about CloudRT can be found in the tutorial [23] as well as http://www.raytracer.cloud.
Simulation Scenario and Configurations
In this study, the RT simulation is based on the reconstructed three-dimensional (3D) scenario model with calibrated EM parameters at 300 GHz. The EM parameters of the relevant materials were calibrated in our previous work [24,25] and are summarized in Table 1. In the table, and are the real and imaginary parts of the relative permittivity, respectively; S and are the scattering coefficient and exponent for the directive scattering model. As shown in Figure 5, the 3D urban scenario was reconstructed using SketchUp and based on OpenStreetMap (OSM). The Tx is located at the end of the target urban street at a height of 5 m, whereas the Rx antenna is placed on a moving bus at a height of 3 m, as shown in Figure 6. In this study, the Tx and Rx were both omnidirectional vertically polarized antennas with antenna gain of 0 dBi and transmitted power of 0 dBm. The configuration of the antenna was aimed at simulating a pure propagation channel and ignoring the influence of the antenna patterns. Based on the pure propagation channel, various antenna patterns and beamforming approaches can be coupled with similar scenarios. The simulated city was Seoul, with a longitude of 127.05 E and latitude of 37.583 N. The rainfall rate exceeded 0.01% of a year on average () and was determined as 60.72 mm/h.

Table 1.
EM (electromagnetic) parameters in RT (ray-tracing) simulations.
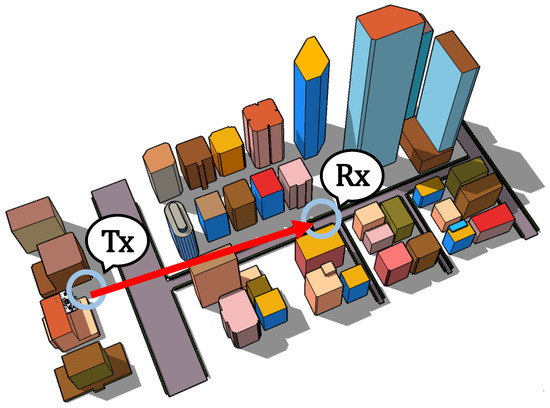
Figure 5.
3D model of the simulation scenario.
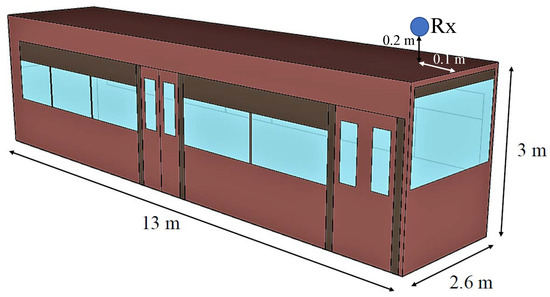
Figure 6.
Reconstructed bus and receiver (Rx) location.
In addition, the order of reflection determines the accuracy and computational complexity of the RT simulation. Consequently, appropriate reflection orders should be selected for different scenarios to balance the computational time and accuracy. An exploratory simulation was conducted to decide the highest valid reflection order in this urban scenario. As shown in Figure 7, the LOS ray and reflection rays up to the 2nd order contribute almost all of the total channel gain. The running time for each snapshot is 10.9 s. Compared with the channel gain of the LOS ray and up to 3rd order reflection rays, the difference is very slight. However, the running time for each snapshot is much longer (918.2 s). Therefore, reflection rays up to the 2nd order alone are adequate to study the propagation channel in this urban scenario. The simulation configurations are summarized in Table 2. More details can be found in [26].
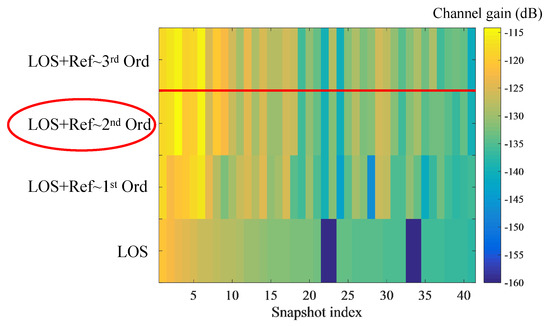
Figure 7.
Channel gain of different combinations of ray.
Table 2.
Simulation configuration.
4. Channel Characterization in an Urban Scenario under Different Meteorological Factors
Based on extensive RT simulation results and processing steps to add the attenuations caused by the different meteorological factors noted herein, we first characterized the terrestrial channel under the different conditions. The attenuations caused by atmospheric gases, fog, rain, and snow are approximately 5.2 dB/km, 7.26 dB/km, 21.42 dB/km, and 350 dB/km, respectively. The key channel parameters include path loss, shadow fading, Rician K-factor, RMS delay spread, and four angular spreads (i.e., ASA, ASD, ESA, and ESD). All these channel parameters are then fitted with normal distributions with mean and standard deviation . Most of the previous studies have only considered the received power under different meteorological factors. However, in our study, we highlight the impacts of different meteorological factors on each channel parameter. The RT simulation results with attenuations due to atmospheric gases, fog, rain, and snow are analyzed, and all the extracted parameters are summarized in Table 3. The simulations presented here provide one of the first investigations into how different weather conditions impact the performance of the terrestrial THz channels. The details of the channel characterizations and analyses are as follows.
Table 3.
Channel parameters by different meteorological attenuation.
4.1. Path Loss
In this work, the path loss is fitted by the “A-B” model as follows:
where d is the distance between the transceivers; A and B are the slope and intercept, respectively. denotes the shadow fading, which follows a Gaussian variable with N (0,). As shown in Figure 8, there is a clear trend of increasing path loss with increasing distance between the Tx and Rx for the different meteorological factors. As expected, the attenuation due to snow amounts to the greatest path loss. It is noted that, under snowy conditions, the fitted value of A is very large, while B is a negative number; this indicates that, in the case of snowy conditions, the propagation distance is indeed very limited. Thus, to ensure connection of the wireless link in the urban scenario, ultra-high-gain directional antennas are highly suggested in THz communications.
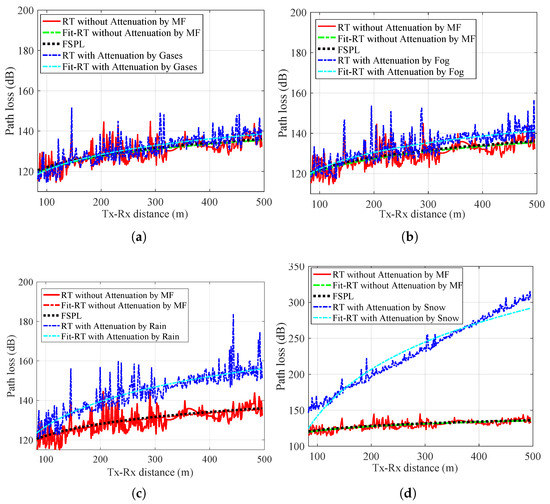
Figure 8.
Path loss, (a) by Gases; (b) by Fog; (c) by Rain; (d) by Snow.
4.2. Rician K-Factor
Because the RT simulator is not bandwidth limited, the Rician K-factor can be directly obtained using its definition: the ratio of the power of the strongest ray to the sum of power values of the remaining rays. Thus, it can be calculated as follows:
where KF represents the Rician K-factor, and and represent the electric field amplitude and phase of the mth ray, respectively; denotes the number of rays, and is the electric field vector of the strongest ray. Figure 9 shows the K-factors and fitting results of all the attenuation factors. The mean value of the K-factor for the RT results without considering the meteorological factors is 5.25 dB, which indicates effective multipath components (MPCs) reflected and scattered from the surrounding infrastructures, buildings, and ground. Compared with the realistic scenario in Seoul, in most cases, office buildings in a city have smooth glass facades. Therefore, strong reflections will occur at these glass surfaces, and the RT simulation results substantiate this point well. When considering the different meteorological factors in the order of atmospheric gases, fog, rain, and snow, the mean values of the Rician K-factors increase correspondingly. These results are consistent with the findings that the reflected or scattered rays travel farther than the direct rays under LOS condition and suffer more attenuation as well. Therefore, the values of the K-factor become larger.
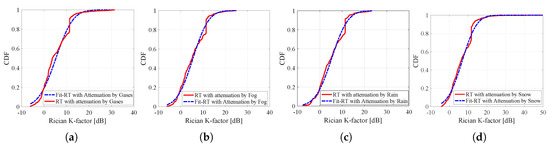
Figure 9.
Rician K-factor, (a) by Gases; (b) by Fog; (c) by Rain; (d) by Snow.
4.3. RMS Delay Spread
The RMS delay spread is computed as the square root of the second central moment of the , as given by the following equation:
where is the RMS delay spread, and and are the power and time delay of the mth ray, respectively. Under the consideration of different meteorological situations, the mean values of the RMS delay spreads are 9.57 ns, 9.44 ns, 9.08 ns, and 5.96 ns for atmospheric gases, fog, rain, and snow, respectively. The snowy condition has the smallest mean value (5.96 ns), which is in line with the highest attenuation caused by snowflakes. As shown in Figure 10, the influences of attenuations caused by atmospheric gases, fog, and rain can almost be neglected.
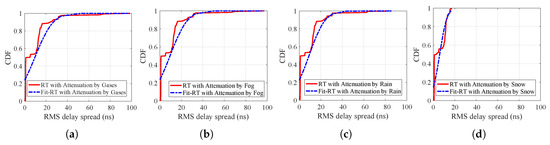
Figure 10.
RMS (root-mean-square) delay spread, (a) by Gases; (b) by Fog; (c) by Rain; (d) by Snow.
4.4. Angular Spreads
The angular spread indicates the distribution of the arrival and departure angles of each ray in the 3D scenario for the transceivers. Each ray will be characterized by an azimuth angle in the horizontal plane and an elevation angle in the vertical plane. Thus, four values of angular spreads, namely ASA, ASD, ESA, and ESD, can be obtained as follows:
where is the angular spread (AS), and is the power of the mth multipath; is given as:
where is the AoA/AoD/EoA/EoD of the m-th ray. is:
Generally speaking, the elevation angular spreads for both the arrival and departure (Figure 11 and Figure 12) are much smaller than the azimuth angular spreads for both the arrival and departure (Figure 13 and Figure 14); this indicates that the effective multipaths are reflected or scattered from the horizontal direction, such as the surrounding buildings located on both sides of roads. With respect to the different meteorological factors, Figure 11 and Figure 12 show that the elevation angular spreads constitute no significant differences owing to the different meteorological situations. For example, the mean values of the ESA under the atmospheric, foggy, rainy, and snowy conditions are 0.56, 0.56, 0.56, and 0.56, respectively. Because the reflected or scattered rays from the horizontal plane travel greater distances and suffer more attenuations, the azimuth angular spreads become smaller in order of atmospheric gases, fog, rain, and snow. The mean values of the ASA under the conditions of atmospheric gases, fog, rain, and snow are 56.39, 55.89, 54.41, and 46.42, respectively.
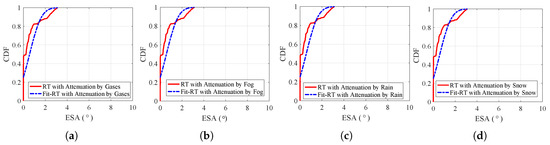
Figure 11.
ESA (elevation angular spread of arrival), (a) by Gases; (b) by Fog; (c) by Rain; (d) by Snow.
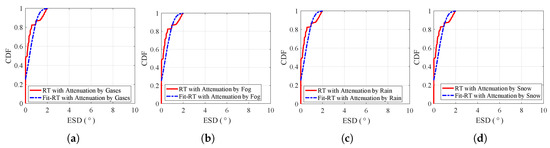
Figure 12.
ESD (elevation angular spread of departure), (a) by Gases; (b) by Fog; (c) by Rain; (d) by Snow.
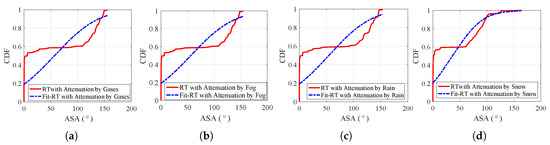
Figure 13.
ASA (azimuth angular spread of arrival), (a) by Gases; (b) by Fog; (c) by Rain; (d) by Snow.
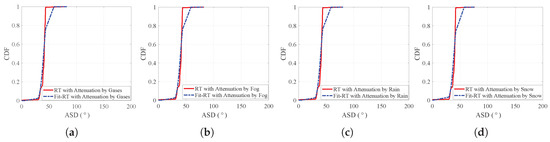
Figure 14.
ASD (azimuth angular spread of departure), (a) by Gases; (b) by Fog; (c) by Rain; (d) by Snow.
5. Conclusions and Future Work
In view of the impacts of meteorological factors on terrestrial THz wireless communications, this study considers the ITU-R prediction methods and representative measurement results for different meteorological factors. We systematically discuss and quantitatively calculate the attenuations caused by various types of meteorological factors, namely atmospheric gases, fog, rain, and snow. Based on the RT simulation results, we analyze how these different meteorological factors influence the key channel parameters in a typical urban scenario in the 300 GHz frequency band.
The attenuation caused by atmospheric gases in the 300 GHz frequency band is approximately 5.2 dB/km with the ITU-R 676-11 [10] prediction method. For the typical urban scenario in Seoul, the rainfall rate (which is exceeded for 0.01% of the time in an average year) is 60.724 mm/h, as predicted according to the ITU-R 837-7 [18] standard. The corresponding attenuation caused by rain is approximately 21.4 dB/km according to the ITU-R 838-3 [15]. For thick fog with a liquid water density of 0.5 g/m and visibility of 50 m, the attenuation caused is about 7.26 dB/km, as calculated according to the ITU-R P.840-7 [11]. The attenuation due to snow is about 350 dB/km, as calculated according to the measurement method in a representative article [20].
With the help of a self-developed RT simulator, extensive simulations were conducted for terrestrial wireless links in a typical urban environment. Then, the attenuations caused by atmospheric gases, fog, rain, and snow were added to the simulation results. Hence, the attenuations by different meteorological factors have the greatest impact on path loss. The influences of such factors on other channel parameters are relatively small owing to the sparsity of the THz channel. However, the trend for each parameter is as expected. With higher attenuation, the Rician K-factor becomes larger, while the RMS delay spreads and angular spreads become smaller. This is because the reflected or scattered rays travel farther than the direct rays and suffer more attenuation.
Future efforts will be made to include the influences of other factors, such as humidity, on the channel parameters. Then, using actual measurement results, the ray-tracing results can be validated and channel characteristics can be further analyzed.
Author Contributions
Data curation, Z.L.; Formal analysis, Z.L.; Funding acquisition, Y.Z.; Project administration, J.D. and Z.Z.; Supervision, K.G. and B.A.; Validation, Z.L. and W.Z.; Visualization, H.Y.; Writing—original draft, Z.L.; Writing—review & editing, H.Y. All authors have read and agreed to the published version of the manuscript.
Funding
This work is supported by the National Key Research and Development Program under Grant No. 2019B010157001, Fundamental Research Funds for the Central Universities No. 2019JBM074, the State Key Laboratory of Rail Traffic Control and Safety (Contract No. RCS2020ZZ005), NSFC under Grant Nos. 61771036 and 61725101, and the ZTE Corporation.
Conflicts of Interest
The authors declare no conflict of interest.
References
- IEEE 802.15 Working Group for WPAN. Available online: http://www.ieee802.org/15/ (accessed on 1 October 2018).
- He, D.; Guan, K.; Fricke, A.; Ai, B.; He, R.; Zhong, Z.; Kasamatsu, A.; Hosako, I.; Kürner, T. Stochastic Channel Modeling for Kiosk Applications in the Terahertz Band. IEEE Trans. Terahertz Sci. Technol. 2017, 7, 502–513. [Google Scholar] [CrossRef]
- Fu, J.; Juyal, P.; Zajić, A. THz channel characterization of chip-to-chip communication in desktop size metal enclosure. IEEE Trans. Antennas Propag. 2019, 67, 7550–7560. [Google Scholar] [CrossRef]
- Mumtaz, S.; Jornet, J.M.; Aulin, J.; Gerstacker, W.H.; Dong, X.; Ai, B. Terahertz communication for vehicular networks. IEEE Trans. Veh. Technol. 2017, 66, 5617–5625. [Google Scholar] [CrossRef]
- Faisal, A.; Sarieddeen, H.; Dahrouj, H.; Al-Naffouri, T.Y.; Alouini, M.S. Ultra-massive MIMO systems at terahertz bands: Prospects and challenges. arXiv 2019, arXiv:1902.11090. [Google Scholar]
- Huang, C.; Zappone, A.; Alexandropoulos, G.C.; Debbah, M.; Yuen, C. Reconfigurable intelligent surfaces for energy efficiency in wireless communication. IEEE Trans. Wirel. Commun. 2019, 18, 4157–4170. [Google Scholar] [CrossRef]
- Chen, Z.; Ma, X.; Zhang, B.; Zhang, Y.; Niu, Z.; Kuang, N.; Chen, W.; Li, L.; Li, S. A survey on terahertz communications. China Commun. 2019, 16, 1–35. [Google Scholar]
- Rappaport, T.S.; Xing, Y.; Kanhere, O.; Ju, S.; Madanayake, A.; Mandal, S.; Alkhateeb, A.; Trichopoulos, G.C. Wireless communications and applications above 100 GHz: Opportunities and challenges for 6G and beyond. IEEE Access 2019, 7, 78729–78757. [Google Scholar] [CrossRef]
- Paine, S.; Blundell, R.; Papa, D.C.; Barrett, J.W.; Radford, S.J. A Fourier transform spectrometer for measurement of atmospheric transmission at sub-millimeter wavelengths. Publ. Astron. Soc. Pac. 2000, 112, 108. [Google Scholar] [CrossRef]
- ITU-R. P. 676-11: Attenuation by Atmospheric Gases; Technical Report, ITU Recommendations; 2016; Available online: https://www.itu.int/rec/R-REC-P.676/en (accessed on 1 September 2016).
- ITU-R. P 840-7: Attenuation Due to Clouds and Fog; Technical Report, ITU Recommendations; 2017; Available online: https://www.itu.int/rec/R-REC-P.840/en (accessed on 1 December 2017).
- Miller, S.; Arkin, P.; Joyce, R. A combined microwave/infrared rain rate algorithm. Int. J. Remote Sens. 2001, 22, 3285–3307. [Google Scholar] [CrossRef]
- Luo, Y.; Huang, W.X.; Luo, Z.Y. Attenuation of terahertz transmission through rain. Optoelectron. Lett. 2012, 8, 310–313. [Google Scholar] [CrossRef]
- Ishii, S.; Kinugawa, M.; Wakiyama, S.; Sayama, S.; Kamei, T. Rain attenuation in the microwave-to-terahertz waveband. Wirel. Eng. Technol. 2016, 7, 59. [Google Scholar] [CrossRef]
- ITU-R. P.838-3: Specific Attenuation Model for Rain for Use in Prediction Methods; Technical Report, ITU Recommendations; 2005; Available online: https://www.itu.int/rec/R-REC-P.838/en (accessed on 1 March 2005).
- Richard, V.W.; Kammerer, J.E.; Reitz, R.G. 140-GHz Attenuation and Optical Visibility Measurements of Fog, Rain and Snow; Technical Report; Army Ballistic Research Lab Aberdeen Proving Ground MD; 1977; Available online: https://apps.dtic.mil/sti/pdfs/ADA051055.pdf (accessed on 1 March 2019).
- Norouziari, F.; Marchetti, E.; Hoare, E.; Gashinova, M.; Constantinou, C.; Gardner, P.; Cherniakov, M. Low-THz wave snow attenuation. In Proceedings of the 2018 International Conference on Radar (RADAR), Brisbane, QLD, Australia, 27–30 August 2018; IEEE: Piscataway, NJ, USA, 2018; pp. 1–4. [Google Scholar]
- ITU-R. P.837-7: Characteristics of Precipitation for Propagation Modelling; Technical Report, ITU Recommendations; 2017; Available online: https://www.itu.int/rec/R-REC-P.837/en (accessed on 1 June 2017).
- ITU-R. P.530-17: Propagation Data and Prediction Methods Required for the Design of Terrestrial Line-of-Sight Systems; Technical Report, ITU Recommendations; 2017; Available online: https://www.itu.int/rec/R-REC-P.530/en (accessed on 1 December 2017).
- Ma, J.; Adelberg, J.; Shrestha, R.; Moeller, L.; Mittleman, D.M. The effect of snow on a terahertz wireless data link. J. Infrared Millim. Terahertz Waves 2018, 39, 505–508. [Google Scholar] [CrossRef]
- Slocum, D.M.; Slingerland, E.J.; Giles, R.H.; Goyette, T.M. Atmospheric absorption of terahertz radiation and water vapor continuum effects. J. Quant. Spectrosc. Radiat. Transf. 2013, 127, 49–63. [Google Scholar] [CrossRef]
- Deng, Y.; Ni, Y.; Li, Z.; Mu, S.; Zhang, W. Toward real-time ray tracing: A survey on hardware acceleration and microarchitecture techniques. ACM Comput. Surv. (CSUR) 2017, 50, 1–41. [Google Scholar] [CrossRef]
- He, D.; Ai, B.; Guan, K.; Wang, L.; Zhong, Z.; Kürner, T. The Design and Applications of High-Performance Ray-Tracing Simulation Platform for 5G and Beyond Wireless Communications: A Tutorial. IEEE Commun. Surv. Tutorials 2019, 21, 10–27. [Google Scholar] [CrossRef]
- Guan, K.; Peng, B.; He, D.; Eckhardt, J.M.; Rey, S.; Ai, B.; Zhong, Z.; Kuerner, T. Channel Characterization for Intra-Wagon Communication at 60 GHz and 300 GHz Bands. IEEE Trans. Veh. Technol. 2019, 68, 5193–5207. [Google Scholar] [CrossRef]
- Guan, K.; Peng, B.; He, D.; Eckhardt, J.M.; Rey, S.; Ai, B.; Zhong, Z.; Kürner, T. Measurement, Simulation, and Characterization of Train-to-Infrastructure Inside-Station Channel at the Terahertz Band. IEEE Trans. Terahertz Sci. Technol. 2019, 9, 291–306. [Google Scholar] [CrossRef]
- Yi, H.; Guan, K.; He, D.; Ai, B.; Dou, J.; Kim, J. Characterization for the Vehicle-to-Infrastructure Channel in Urban and Highway Scenarios at the Terahertz Band. IEEE Access 2019, 7, 166984–166996. [Google Scholar] [CrossRef]
© 2020 by the authors. Licensee MDPI, Basel, Switzerland. This article is an open access article distributed under the terms and conditions of the Creative Commons Attribution (CC BY) license (http://creativecommons.org/licenses/by/4.0/).