Article

Experimental Study of Fog and Suspended Water Effects on the 5G Millimeter Wave Communication Channel

1
Faculty of Engineering, Ariel University, Ariel 40700, Israel
2
Israel Institute for Biological Research (IIBR), Ness-Ziona 7410001, Israel
*
Author to whom correspondence should be addressed.
Electronics 2020, 9(5), 720; https://doi.org/10.3390/electronics9050720
Submission received: 23 March 2020 / Revised: 20 April 2020 / Accepted: 25 April 2020 / Published: 27 April 2020
(This article belongs to the Collection Millimeter and Terahertz Wireless Communications)

Abstract

:
Controlled experiments were conducted to examine the effect of fog on signal propagation in wireless communication and radar links operating in millimeter wavelengths. The experiments were carried out in a fog laboratory to verify theoretical results obtained from Liebe’s model. Attenuation and phase shifts of millimeter wave (mmW) radiation were measured, at different fog density characterized by the visibility distance and its water vapor content. Utilizing a vector network analyzer (VNA) enabled us to examine the actual atmospheric attenuation and the phase shift caused by the fog retardation. The experimental results demonstrate good agreement with the simulations even for very low visibility in highly dense fog. The study can be used to estimate link budget of mmW wireless links, including those allocated for the fifth generation (5G) of cellular networks.

1. Introduction

The use of mobile networks has been steadily increasing in recent decades. A service that began only for the benefit of conversations and audio content has been extended to include a variety of text message, web browsing, photos, and video files. Such applications require larger bandwidths serving more users, and higher channel capacities. The demand for more spectrum continues to rise also due to the requirements of available and reliable links and for serving developing applications such as internet of things, smart homes, and even smart cities [1].
Due to the vast amount of bandwidth available in the extremely high frequencies [1], millimeter waves are being considered for the fifth generation of cellular communications [2,3]. Bands within the mmW regime are allocated for this purpose.
Recently, national and international committees have begun to write regulations regarding the utilization of new bands in the electromagnetic spectrum. The Federal Communications Commission (FCC) in the United States have made spectrum available for licensed use in the 28 GHz and 37–39 GHz bands. They have also recently designated the 64–71 GHz band for unlicensed use, which increases the total amount of unlicensed spectrum to 14 GHz. Table 1 summarizes the features of the different mmW bands allocated for the 5th generation of cellular communications [4].
In fact, there are already works studying the possibility to utilize spectrum even in the THz frequencies [5]. Designation of wireless links in millimeter waves requires consideration of the weather conditions, including fog and rain, which have an impact on its propagation in the atmosphere [6]. The effects expected to play a role on the mmW propagation are different than that influencing optical transmissions in infrared [7,8].
Due to increased propagation losses of millimeter waves over longer distances and in order to maintain cost-effective deployment of a 5G network, the mmW links will serve “small cells” [8,9], covering limited distances. Besides the obvious general importance that this new implementation scheme has with regard to future practical deployment of a 5G network, this development is of special importance to our research, as it restricts and defines the expected distances over which our study is focused on.
As a comparison, current systems use a “macro-cell” implementation in rural environments, with a base station radius of 1–20 km [10]. Urban environments favor a “micro-cell” implementation, with a base station covering between 100 m and a few kilometers [11].
Our research focuses on absorptive as well as dispersive effects caused by propagation in foggy conditions. The experiments were carried out in a fog chamber, specially constructed to study electromagnetic transmission in controlled foggy environment, enabling generation of extremely dense fog with low visibility (less than 1 m). It is aimed at studying mmW propagation in the Ka-Band frequencies allocated for 5G spectrum. Table 2 summarizes some of the previous studies carried out in different bands in the millimeter wavelength regime.
Preliminary experimental study was conducted in sub-millimeter waves with an artificial fog seeded by high volume ‘smoke machines’. It was found that the fog generates attenuation, and group delay may affect radar accuracy [16,17]. These findings led to further experimental study of the radiation dispersive effects emerging in the presence of fog, on wireless communication links operating in mmW frequencies designated for the 5G cellular communication, which is described in this paper.

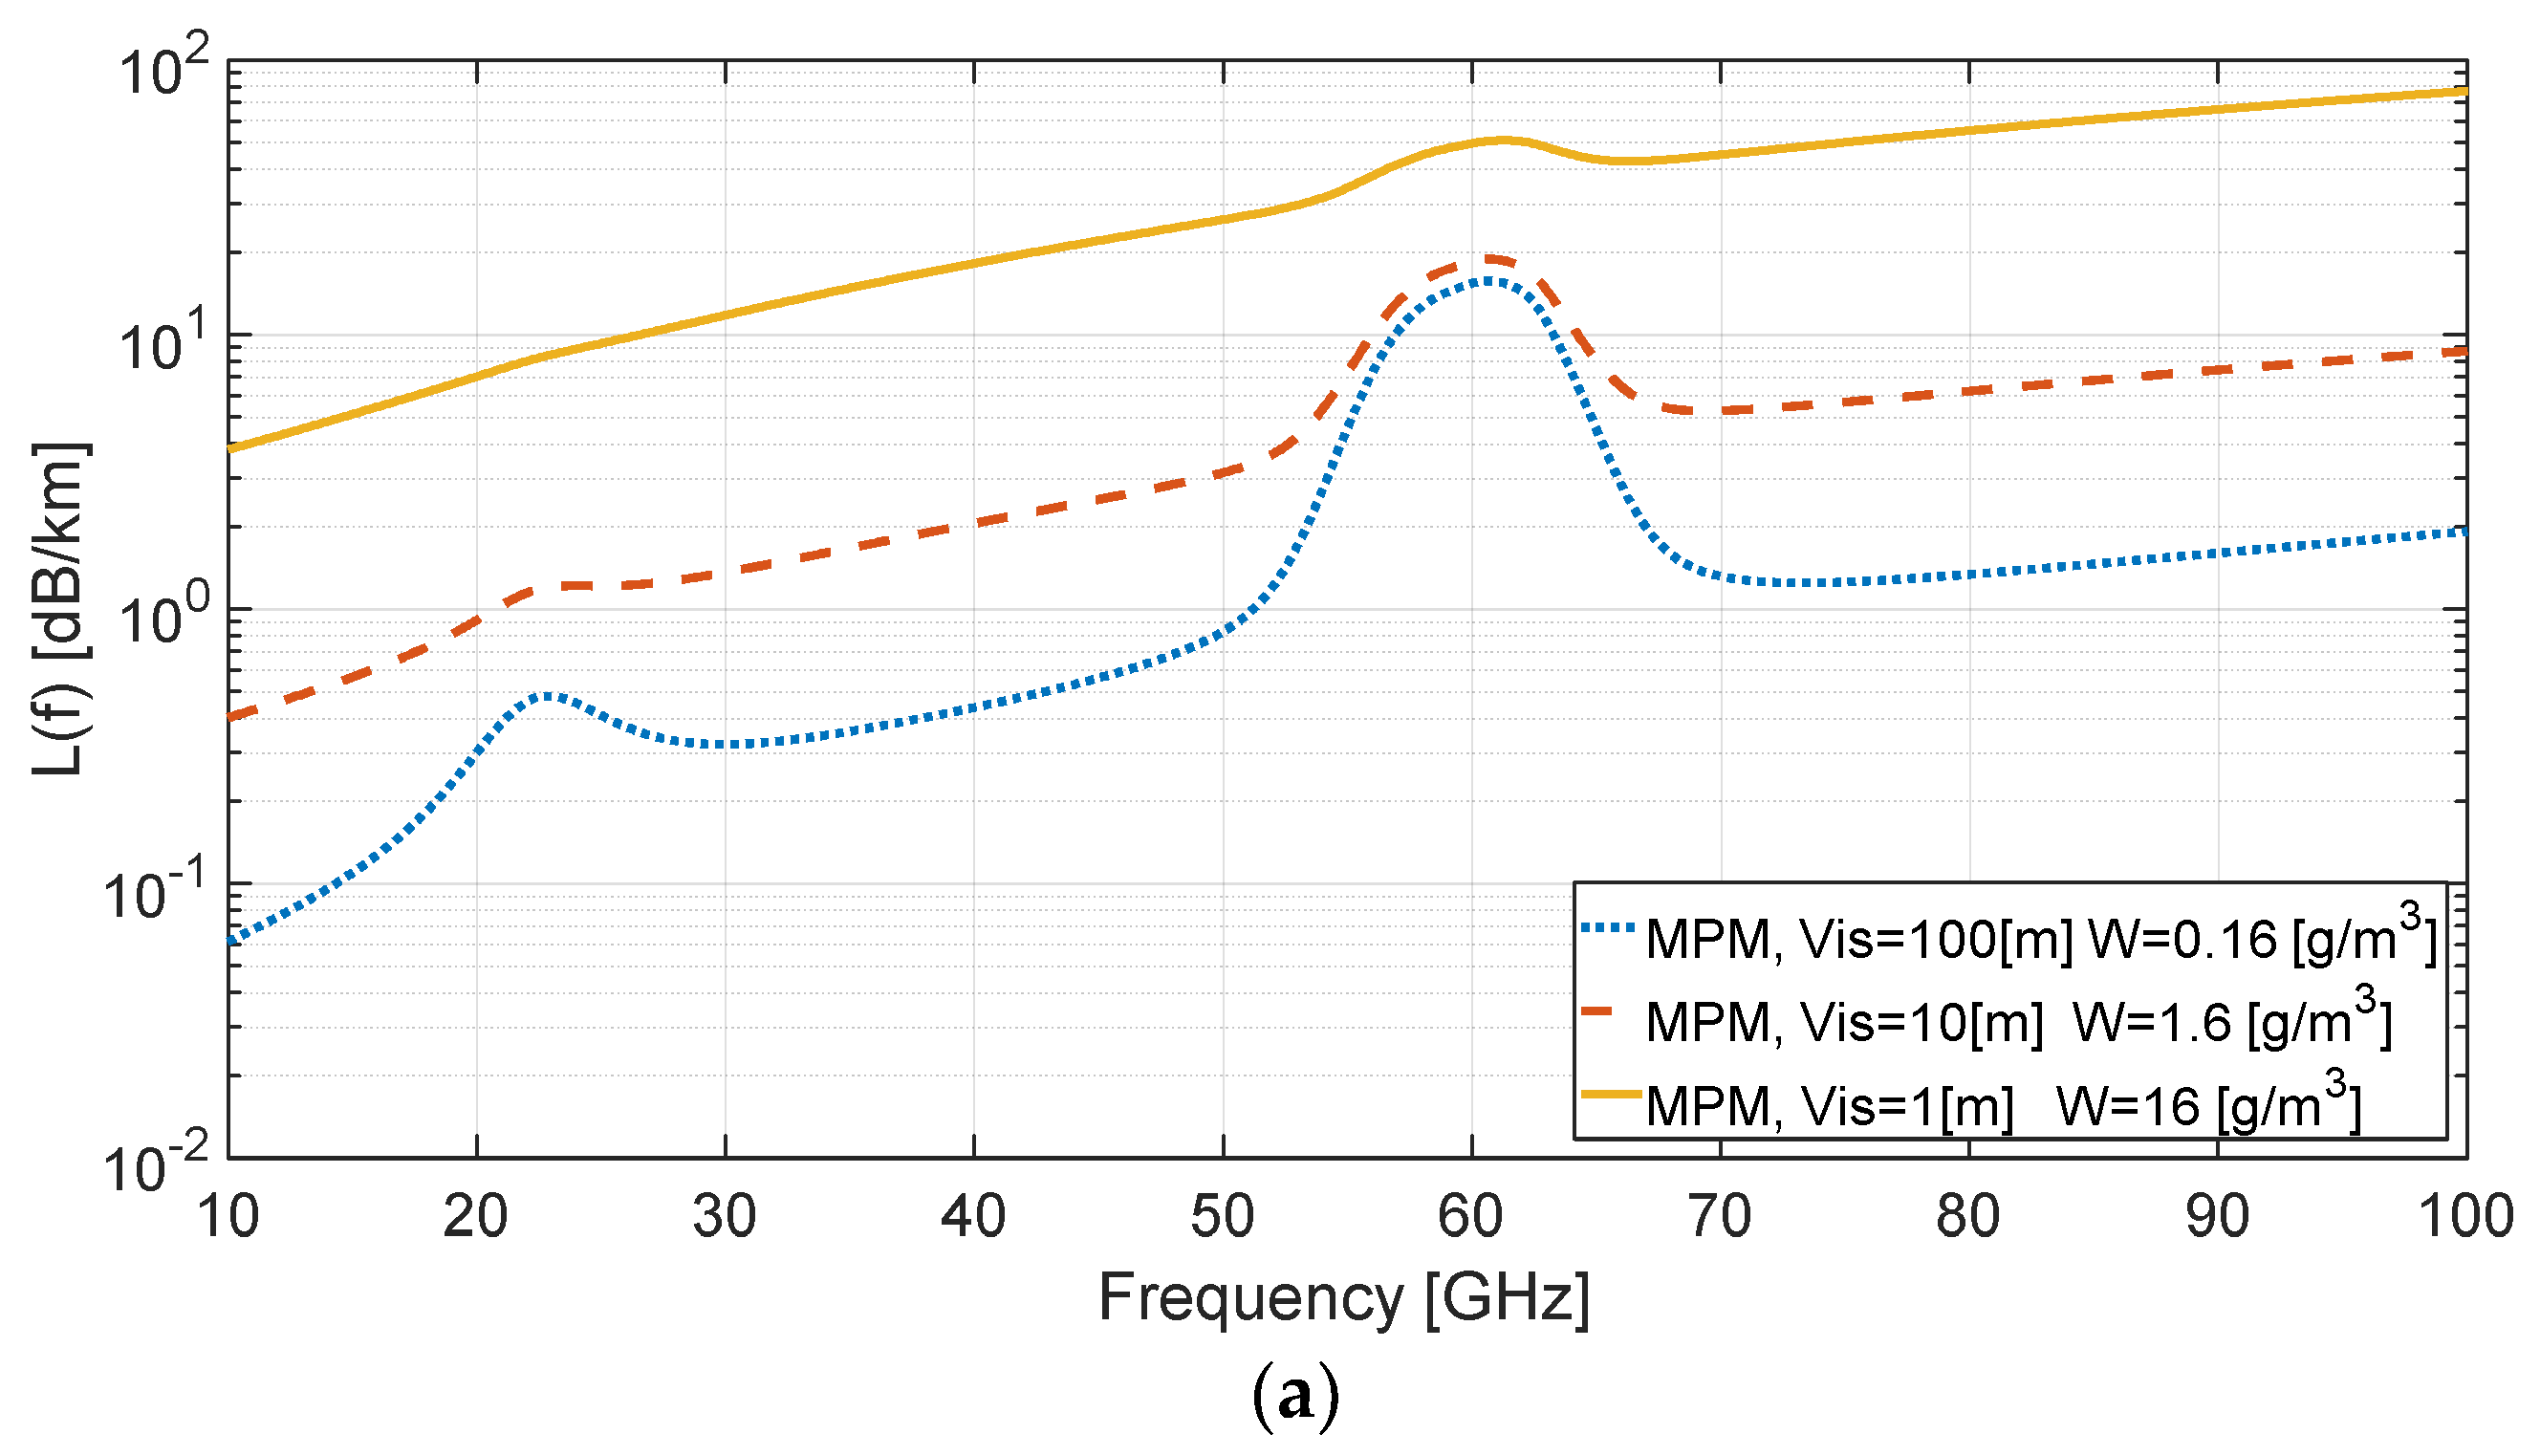
2. Atmospheric mmW Propagation in the Presence of Water Suspension

An electromagnetic radiation that transmitted in atmospheric medium is affected by the macroscopic dielectric properties of the air as customary in homogeneous medium. The effect is expressed in various factors, refraction, absorption and dispersion. In RF links, these effects are expressed mainly in millimeter and sub-millimeter (terahertz) waves, for which the wavelength is still higher than the size of the water particles suspended in the air [16]. Signal attenuation during rainy conditions is well recognized by commercially available millimeter wave cloud radars (MMCR) and by Bistatic Radar System for Atmospheric Studies (BASTA) [18,19,20,21].
When the wavelength is becoming comparable to or smaller than the water particles in the air, as in the visible and the Infrared radiation, the discontinuity of dielectric constant at a water/air interface leads to interferences within a single droplet and therefore breaks the assumption of homogeneous dielectric medium [22]. The Maxwell equations with this discontinuity boundary condition are analytically solvable by assuming that the water droplet is spherical and homogeneous and is well described in the framework of Mie scattering theory [23]. While full description of Mie theory is beyond the scope of this paper, we note here a relevant property for consideration later that is the size parameter x     π D / λ , where D is the droplet diameter and λ is the radiation wavelength under taken. This non-dimensional property is used to decide the scattering regime, whether it is a Rayleigh scattering in the case of mmW ( x 1 ) or Mie scattering when visible light is used ( x < 1 ). For the latter, we applied in our Mie model a water refractive index of n ( 635   n m ) = 1.331 + j 1.5 · 10 8 , whose imaginary part could actually be neglected.
In the following, for reader’s convenience, we review the propagation model employed along the study for analyzing the effects of the medium on the amplitude and phase of the millimeter wave signal. The notations and abbreviations used here are summarized in Appendix A. It is based on the characterization of the refractive index n ( f ) of the atmospheric medium in mmW frequencies. We follow Liebe’s Millimeter-wave Propagation Model (MPM), in which the refractive index is expressed as [24,25]:
n ( f ) = 1 + [ N 0 + N ( f ) j N ( f ) ] · 10 6
N 0 is a real constant, nondispersive term, while N ( f ) and N ( f ) are the frequency dependent, real and imaginary terms, respectively. The propagation factors, namely the attenuation α(f) and the wavenumber β(f), can be expressed in terms of the complex refractive index as follows:
α ( f ) = 2 π f c N ( f ) · 10 6 β ( f ) = 2 π f c { 1 + [ N 0 + N ( f ) ] · 10 6 }
The total attenuation along a propagation distance d is calculated via α(f):
L ( f ) = e 2 α d = exp [ 4 π f c d · N ( f ) · 10 6 ]
and the corresponsive phase shift of the field is determined by the wave number β(f):
ϕ ( f ) = β ( f ) · d = 2 π f c d ϕ 0 ( f ) 2 π f c d · [ N 0 + N ( f ) ] · 10 6 Δ ϕ ( f )
Defining the phase shift in vacuum as:
ϕ 0 ( f ) = 2 π f · d c
the incremental phase shift caused by the atmosphere due to its incremental refractivity is then:
Δ ϕ ( f ) = ϕ ( f ) ϕ 0 ( f ) = ϕ 0 ( f ) · [ N 0 + N ( f ) ] · 10 6
In the current work, emphasis is given to the study of foggy atmospheric conditions, where droplets of water are suspended in the air. The corresponding refractivity in the mmW’s is derived from the total moisture concentration in the cloud, which independently analyzed by atmospheric transmission measurements in the visible light (635 nm), taking into account the Mie scattering theory. The typical droplet diameter in natural fog is about Rp~10 µm.
The attenuation L calculated in [dB/km] as a function of frequency for the millimeter and sub-millimeter regime is shown in Figure 1a. Fog visibility is defined as the distance for which visible light is attenuated to 2% of its maximum intensity in clear sky. According to the International Commission of Illumination, this definition presents the visual range where the contrast ratio for a black target (of a “reasonable” size) against the horizon falls to 2% of the range obtained in the clear sky [26]. Graphs are drawn for various visibility conditions. When visibility is relatively high ≥10 m, pure rotational transitions of water vapor and molecular oxygen can be clearly seen in the region of 22 GHz and 60 GHz, respectively. The additional phase shift Δ ϕ ( f ) / ϕ 0 as a function of frequency is shown in Figure 1b. As expected, the change in attenuation due to oxygen absorption at 60 Hz is also accompanied by a change in the calculated phase shift; this in accordance with the Kramer–Kronig relations between the imaginary and the real part of the refractive index [20].
A comparative study between the results obtained from the comprehensive MPM [15] with those calculated using the International Telecommunication Union (ITU) [27] reveals that, although the absorption peaks of water vapor and molecular oxygen are not taken into account in the ITU model, there is a good fit between the two models [28]. The corresponding graphs for the incremental group delay Δ τ d ( f ) (in [ps/km]) are shown in Figure 1c. The ITU model does not refer to the time delay.
The phase dispersion leads to a frequency dependent group delay given via the derivative:
τ d ( f ) = 1 2 π d ϕ ( f ) d f = 1 2 π d ϕ 0 ( f ) d f τ 0 1 2 π d d f Δ ϕ ( f ) Δ τ d ( f )        = d c τ 0 + d c · [ N 0 + N ( f ) + f d N ( f ) d f ] · 10 6 Δ τ d ( f )
We define τ 0 = d / c as the time delay in vacuum and identify the incremental group delay as:
Δ τ d ( f ) = 1 2 π d d f Δ ϕ ( f ) = τ 0 [ N 0 + N ( f ) + f d N ( f ) d f ] · 10 6
In Figure 1, graphs are drawn for the expected attenuation L ( f ) , phase shift Δ ϕ ( f ) , and incremental group delay Δ τ d ( f ) for different water vapor concentrations W (and resulted visibilities Vis). Note that the absorption peaks appearing in 22 GHz and in 60 GHz are due to resonant absorptions in water (H2O) and oxygen (O2) molecules.

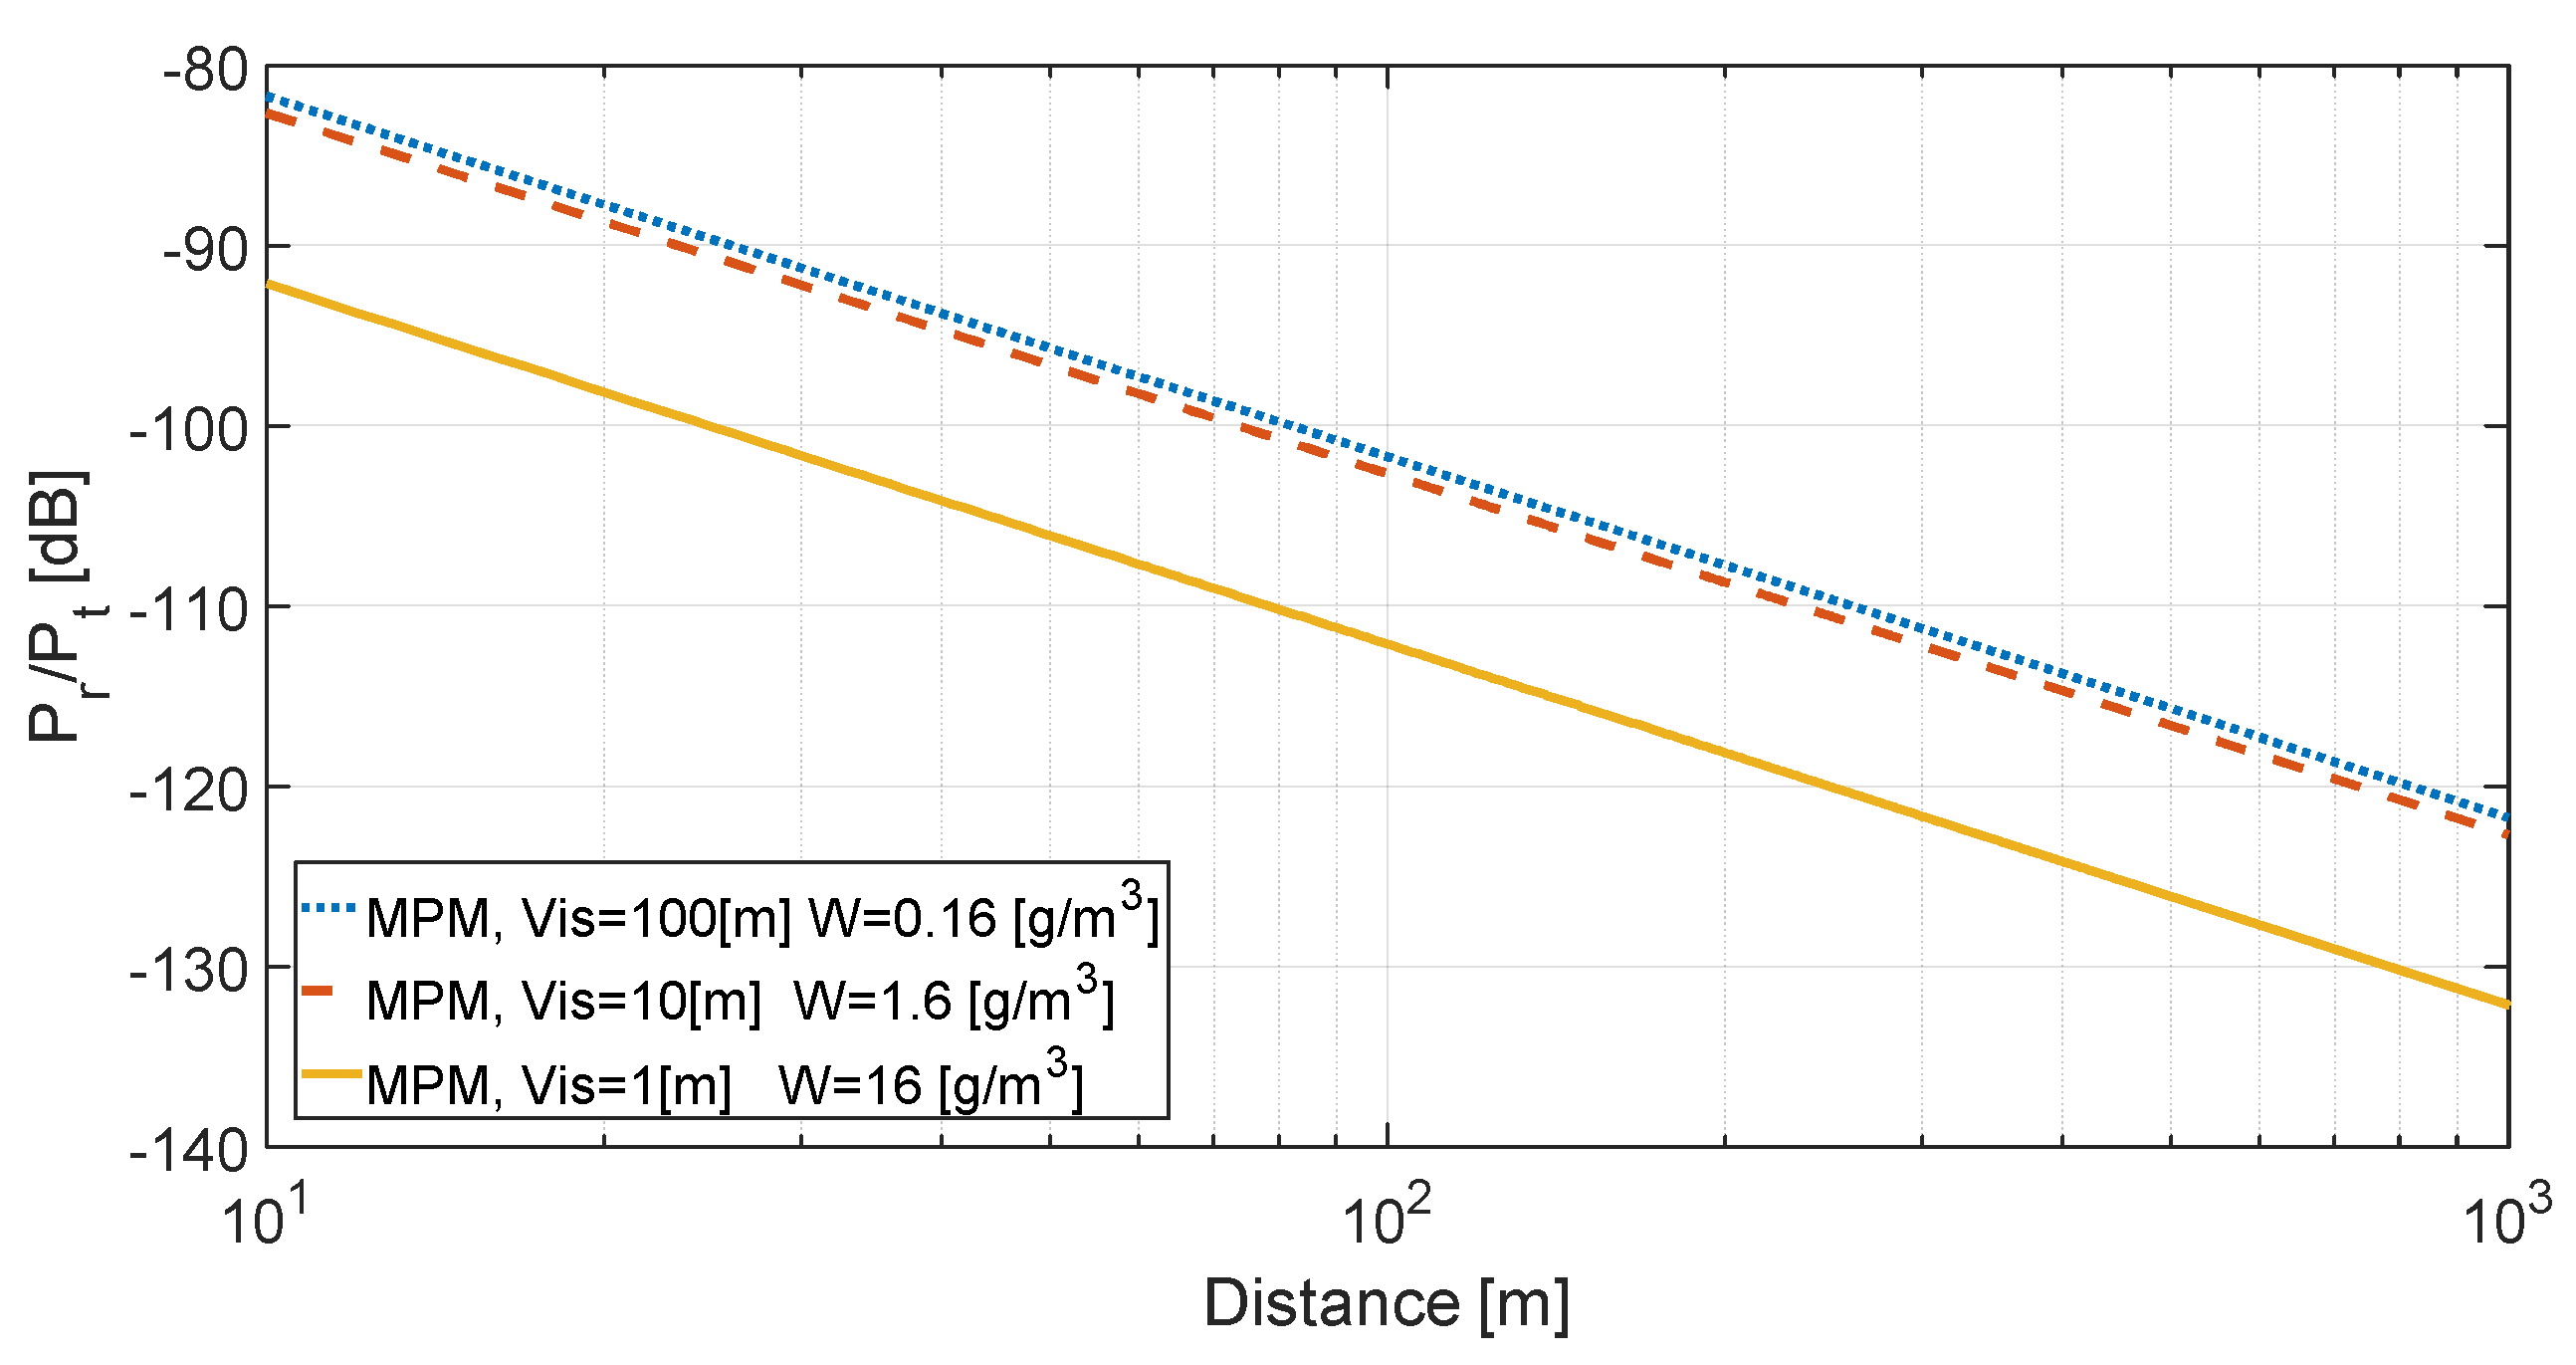
3. Millimeter Wave Link Budget

Following the Friis line of sight transmission formula [3], incorporating atmospheric losses, the overall link budget can be expressed by:
P r P t = | S 2 , 1 | 2 = G r · ( c 4 π d · f ) 2 · G t · 1 L ( f )
where Pr and Pt are the received and transmitted power, respectively, Gr and Gt are the gains of the transmitting and receiving antennas, c is the light speed, and d is the propagation distance. The graph in Figure 2 presents the power ratio Pr/Pt as a function of frequency for distance of 1 km. Here, Omni directional antennas are assumed (Gr = Gt = 0 dBi), and multiple levels of visibilities are considered. The graph in Figure 3 presents the power ratio Pr/Pt as a function of distance d for a link operating at a frequency of 28 GHz, in several visibility scenarios.

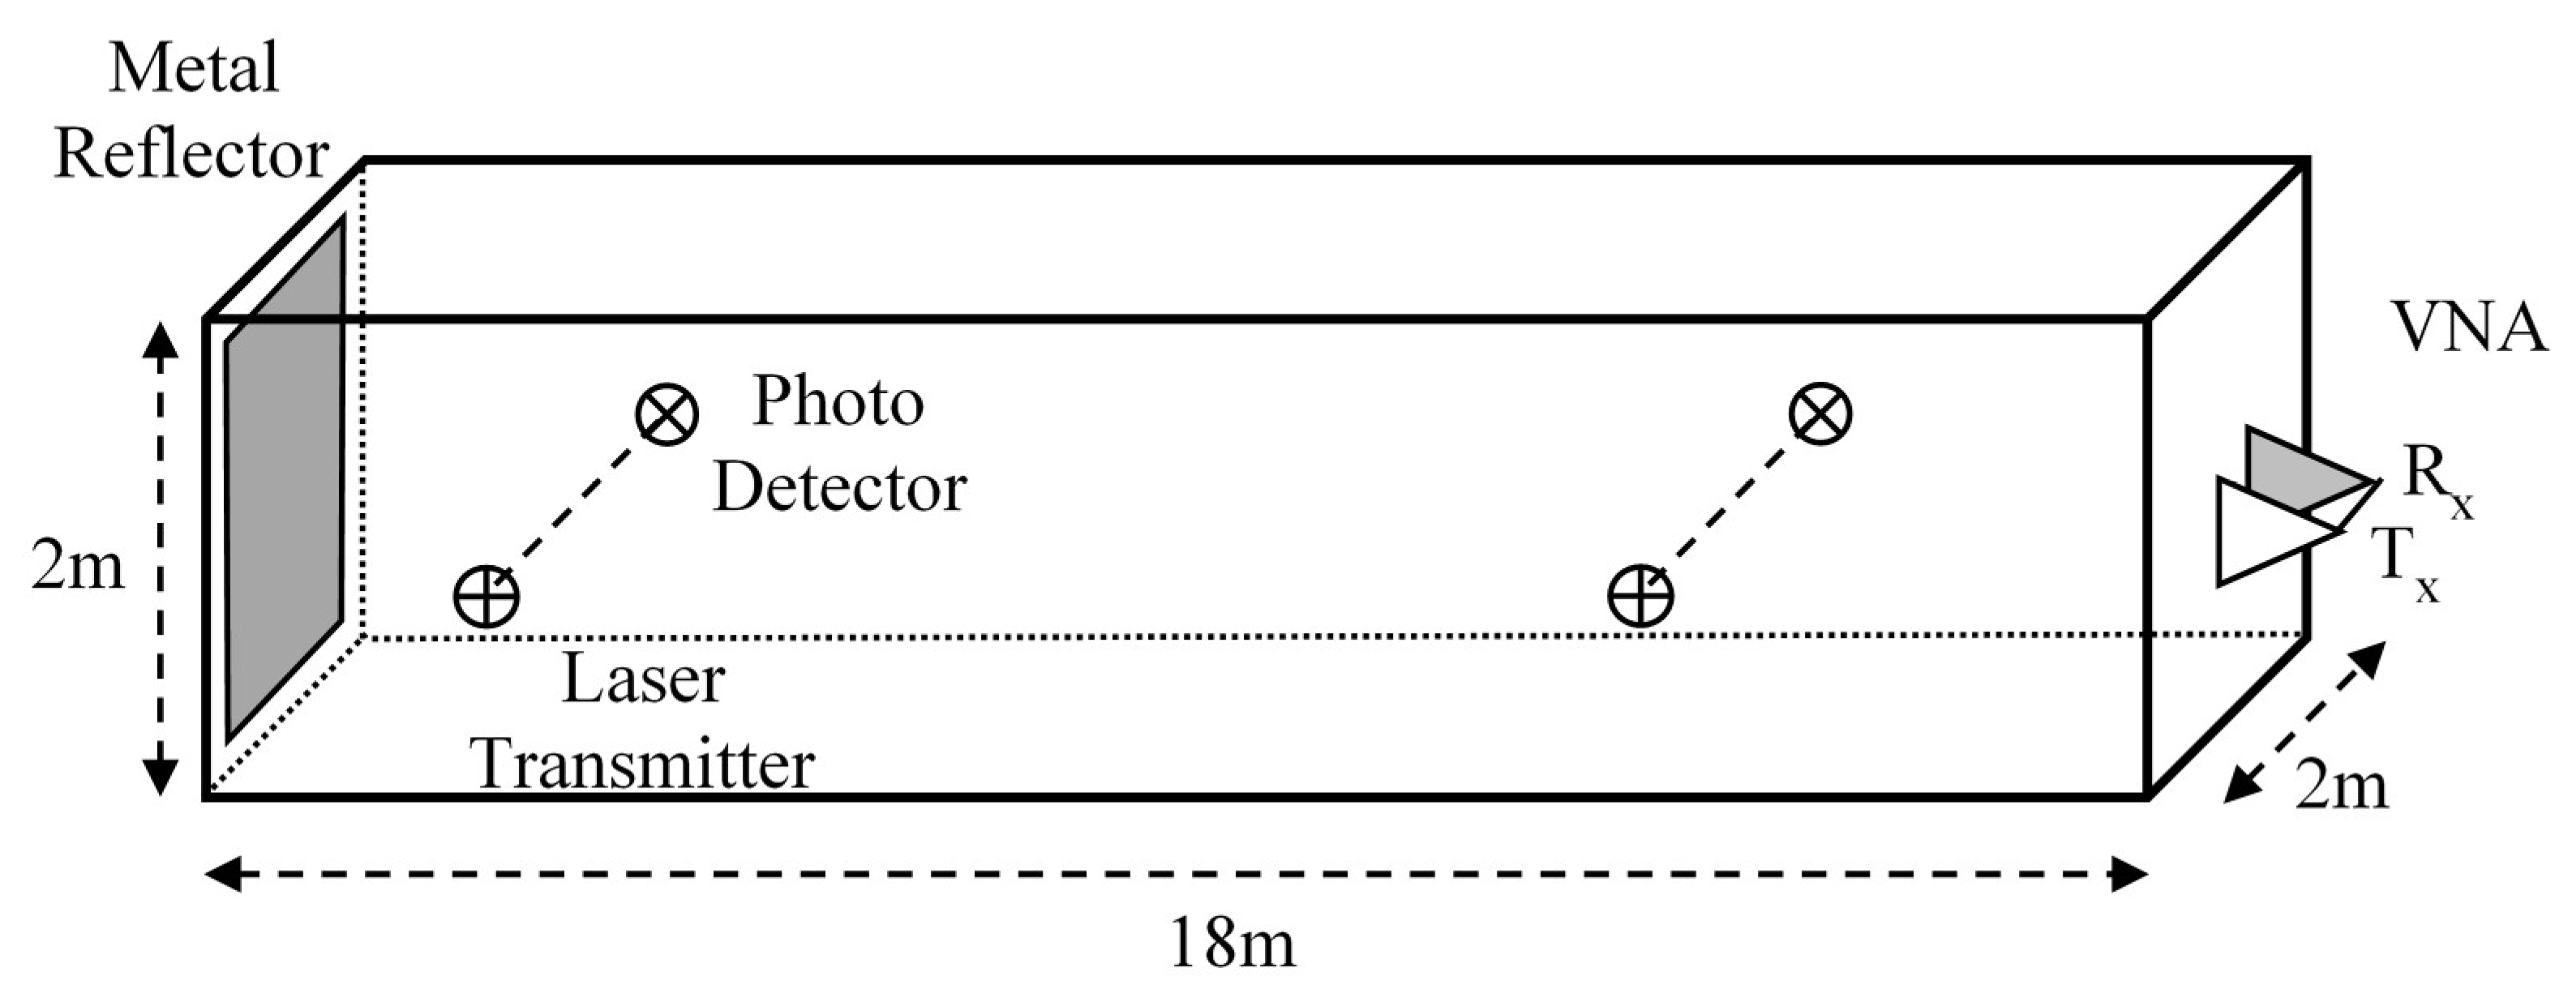
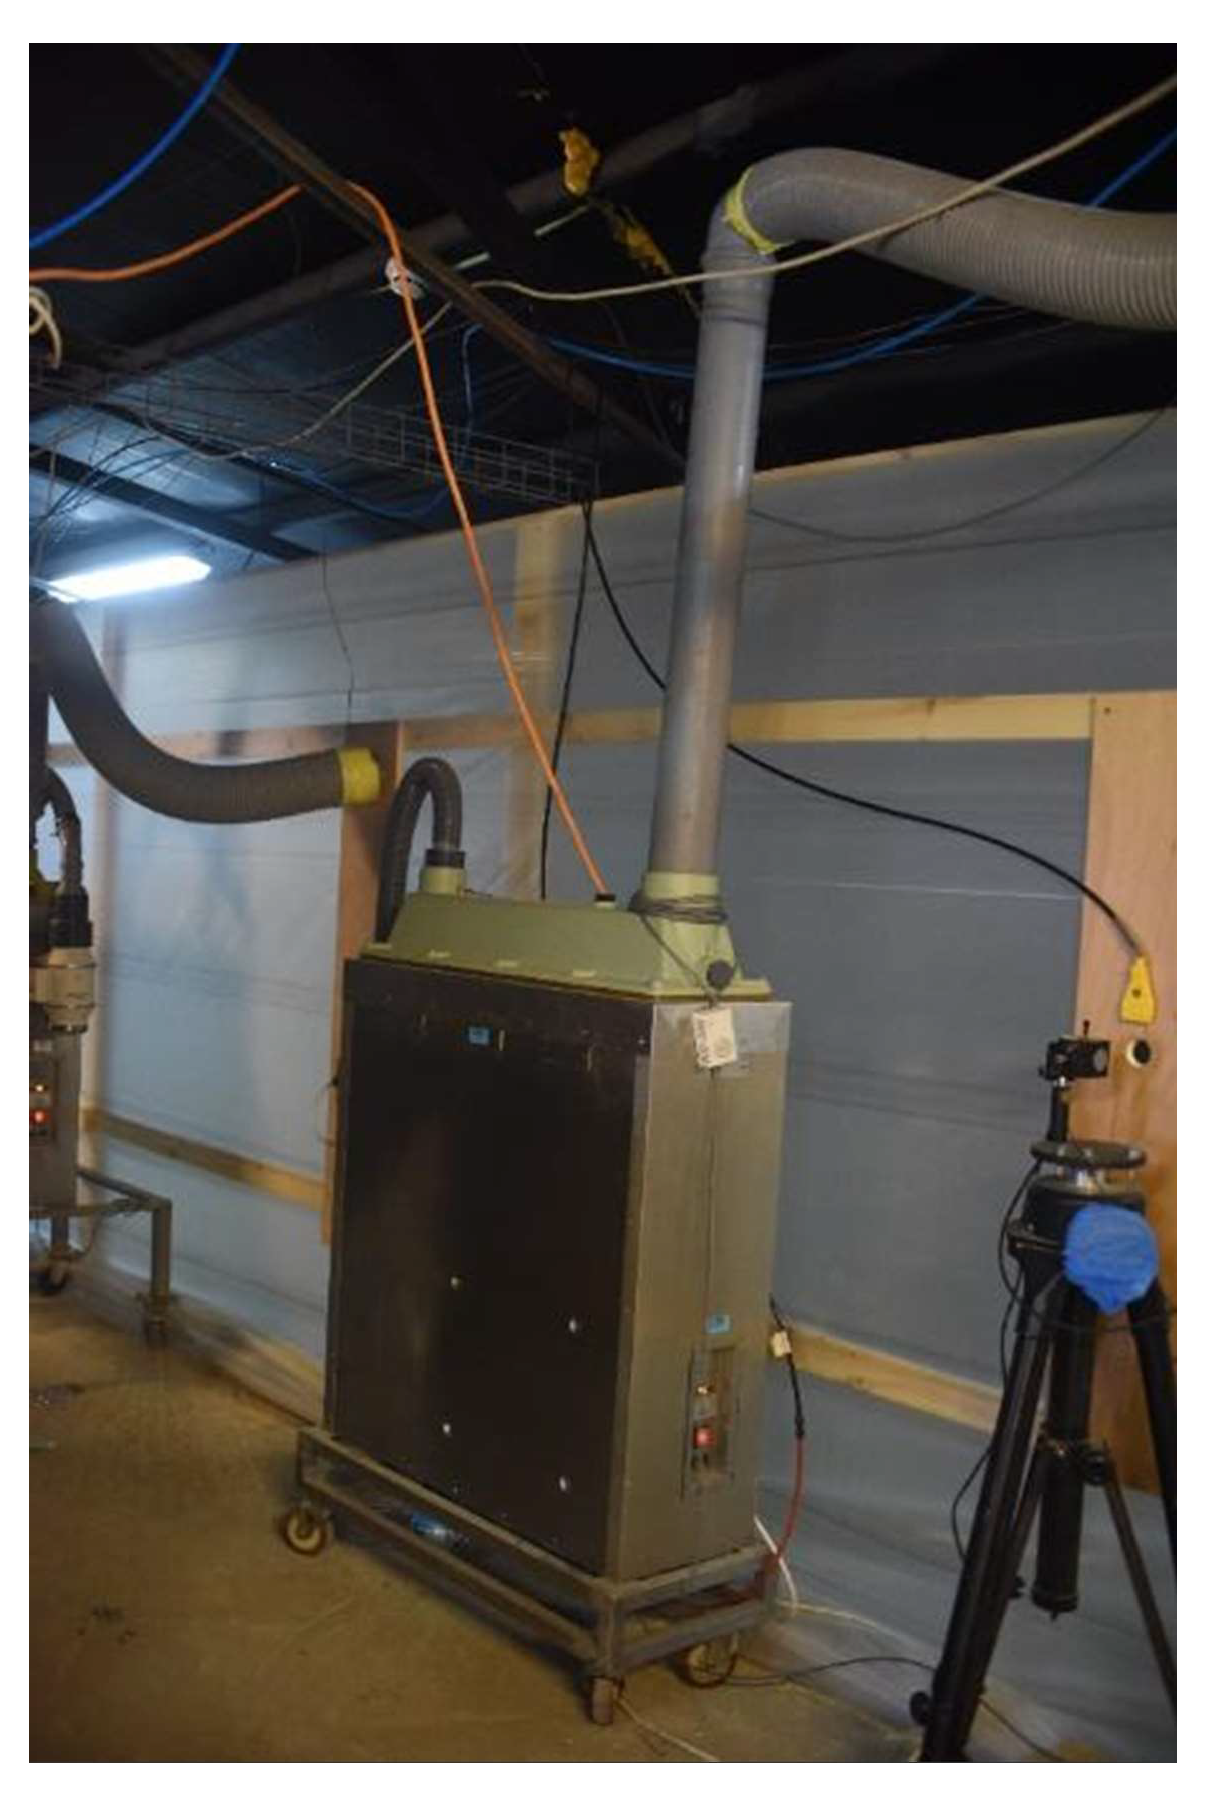
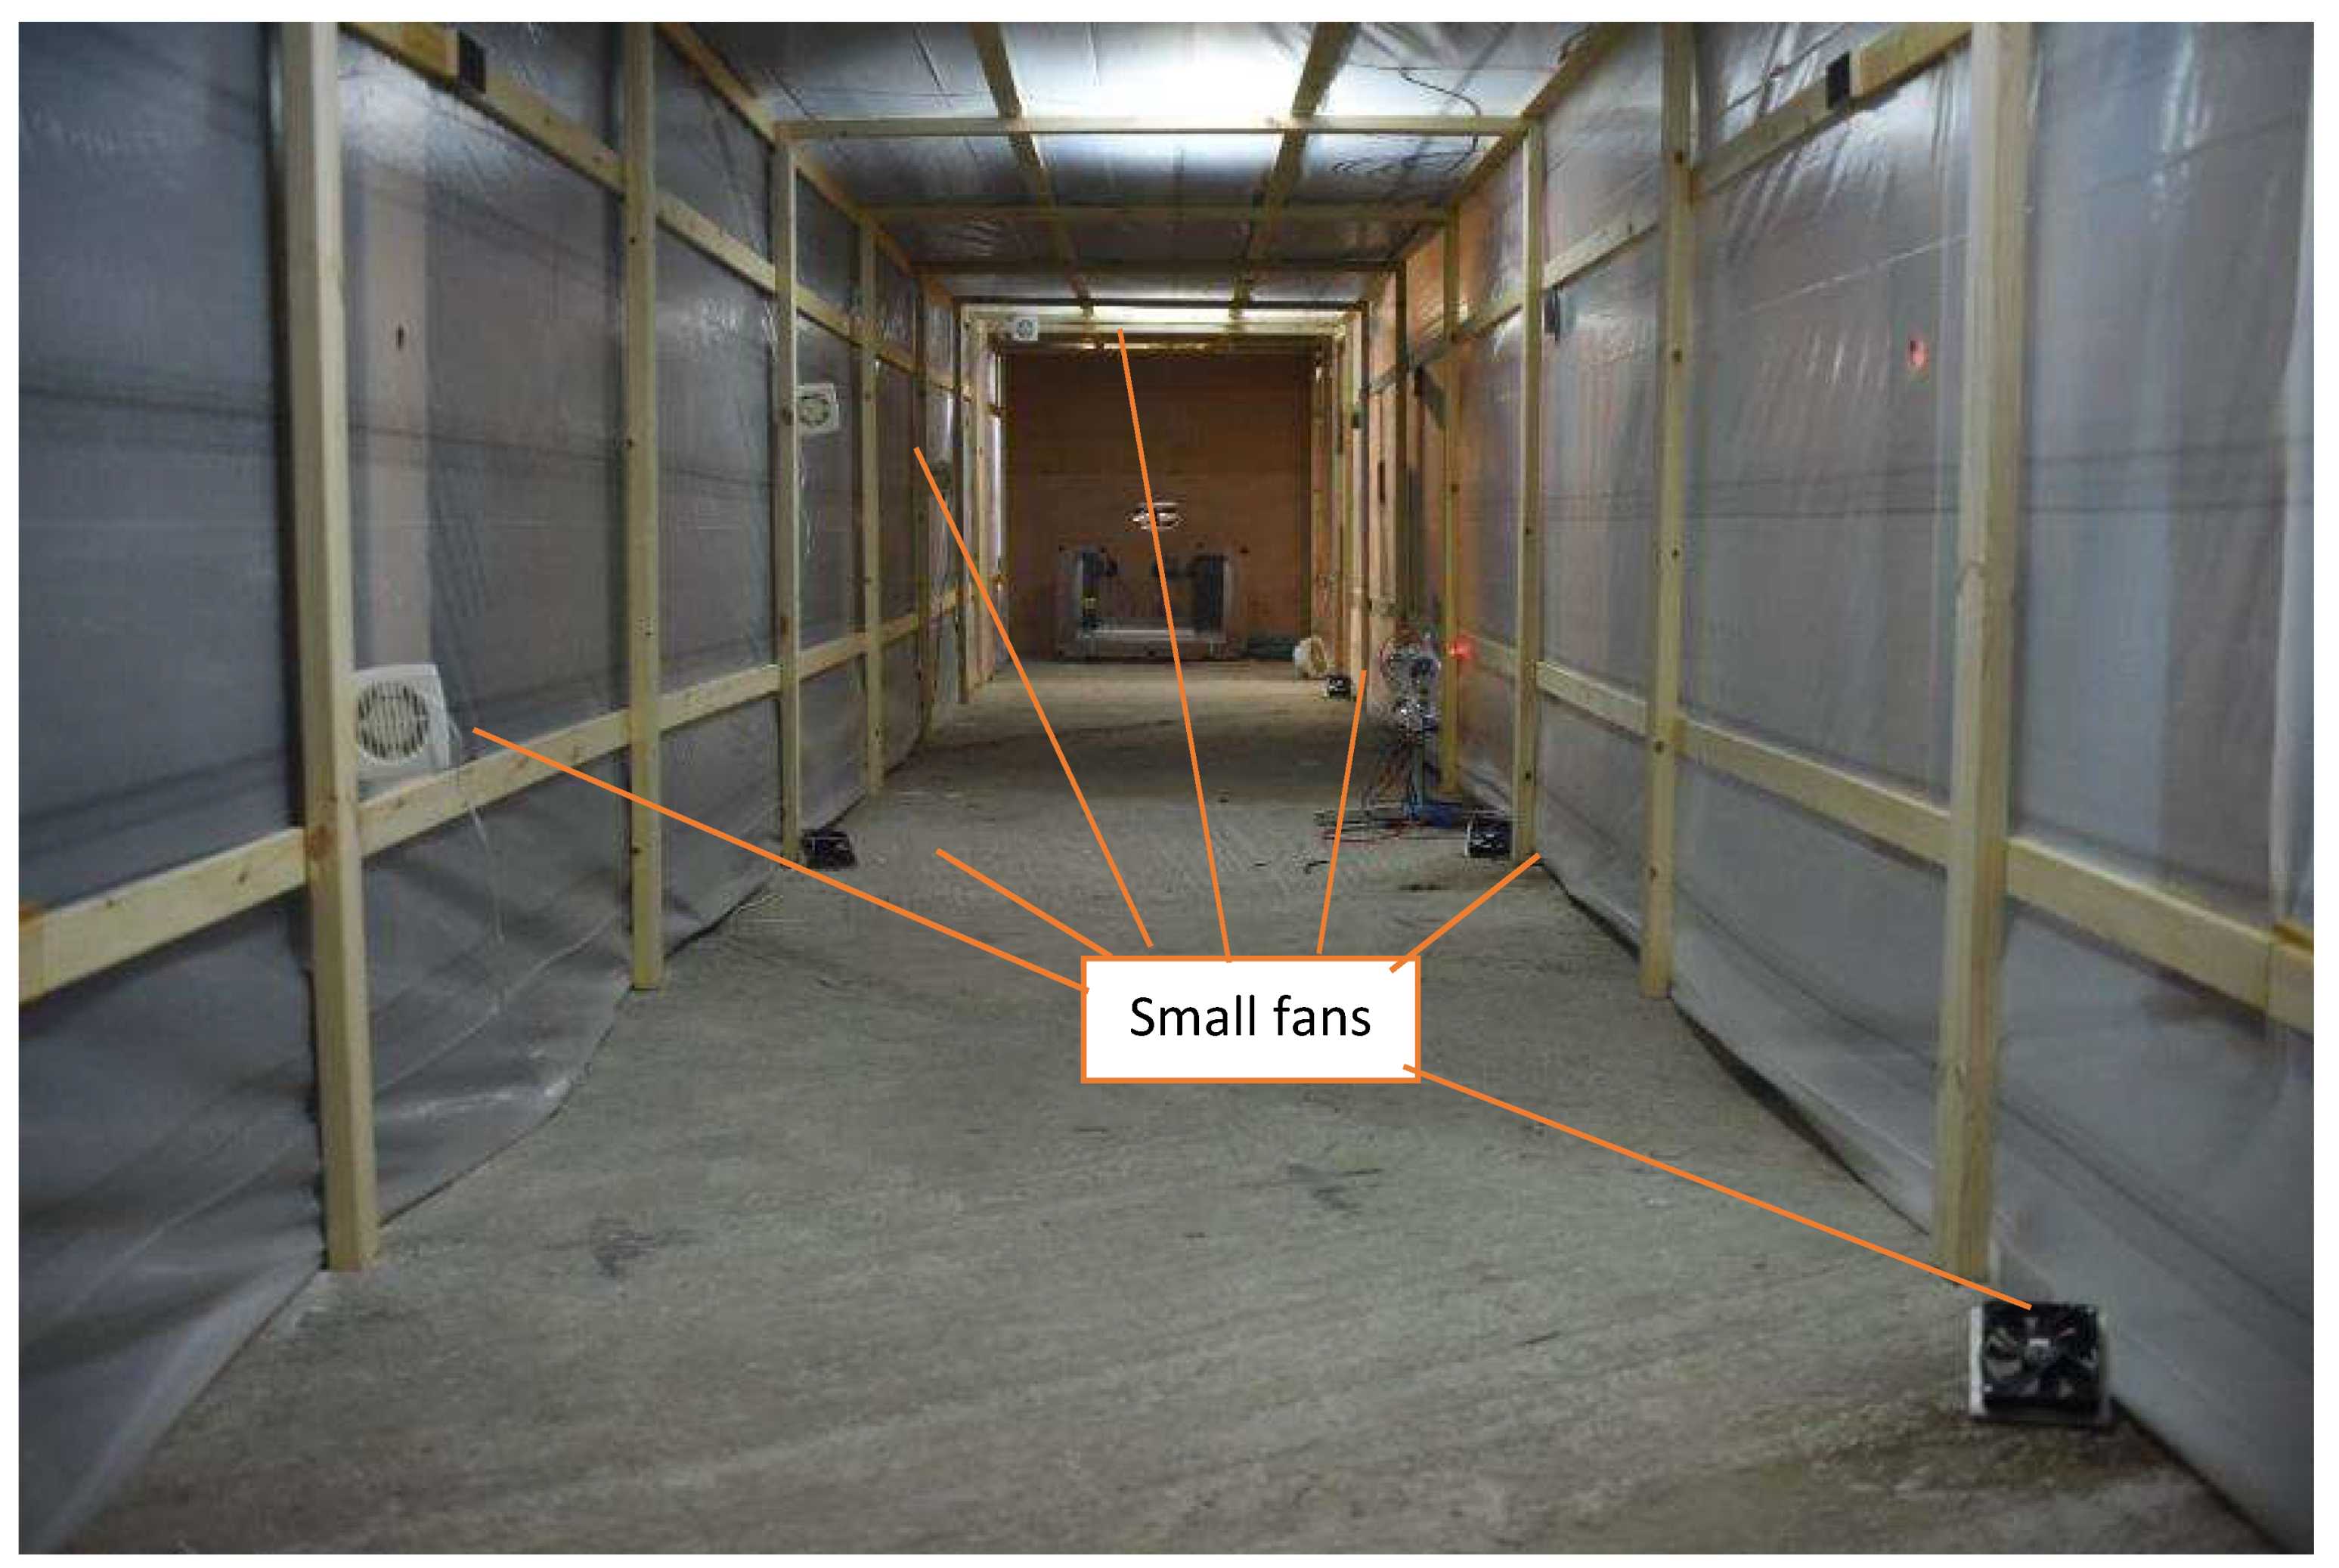
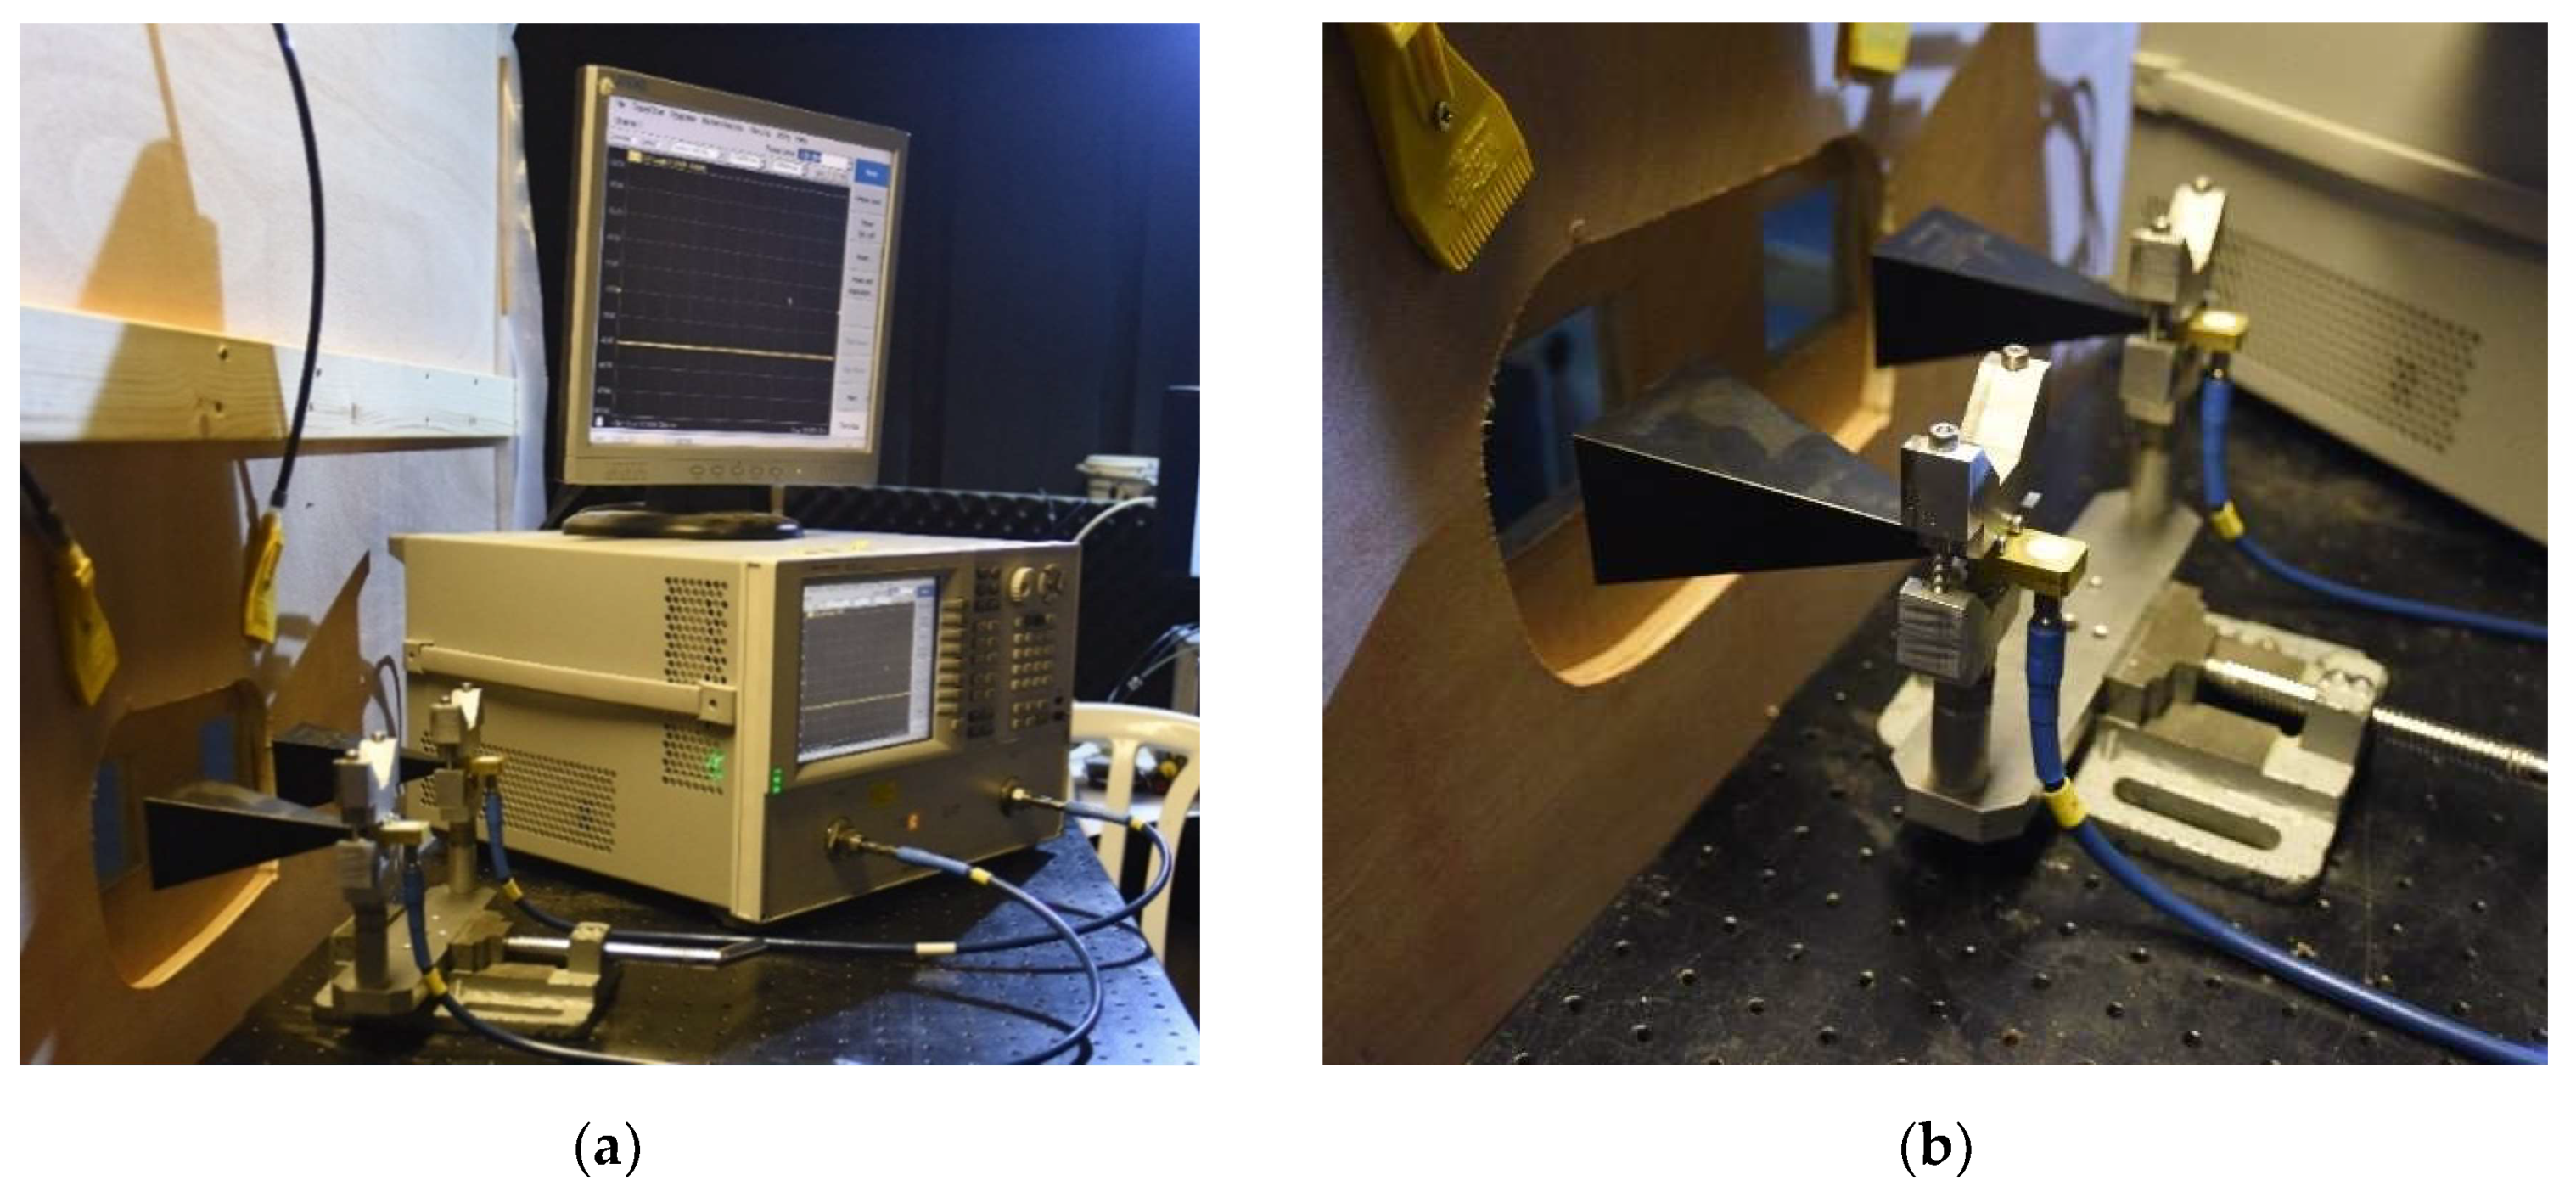
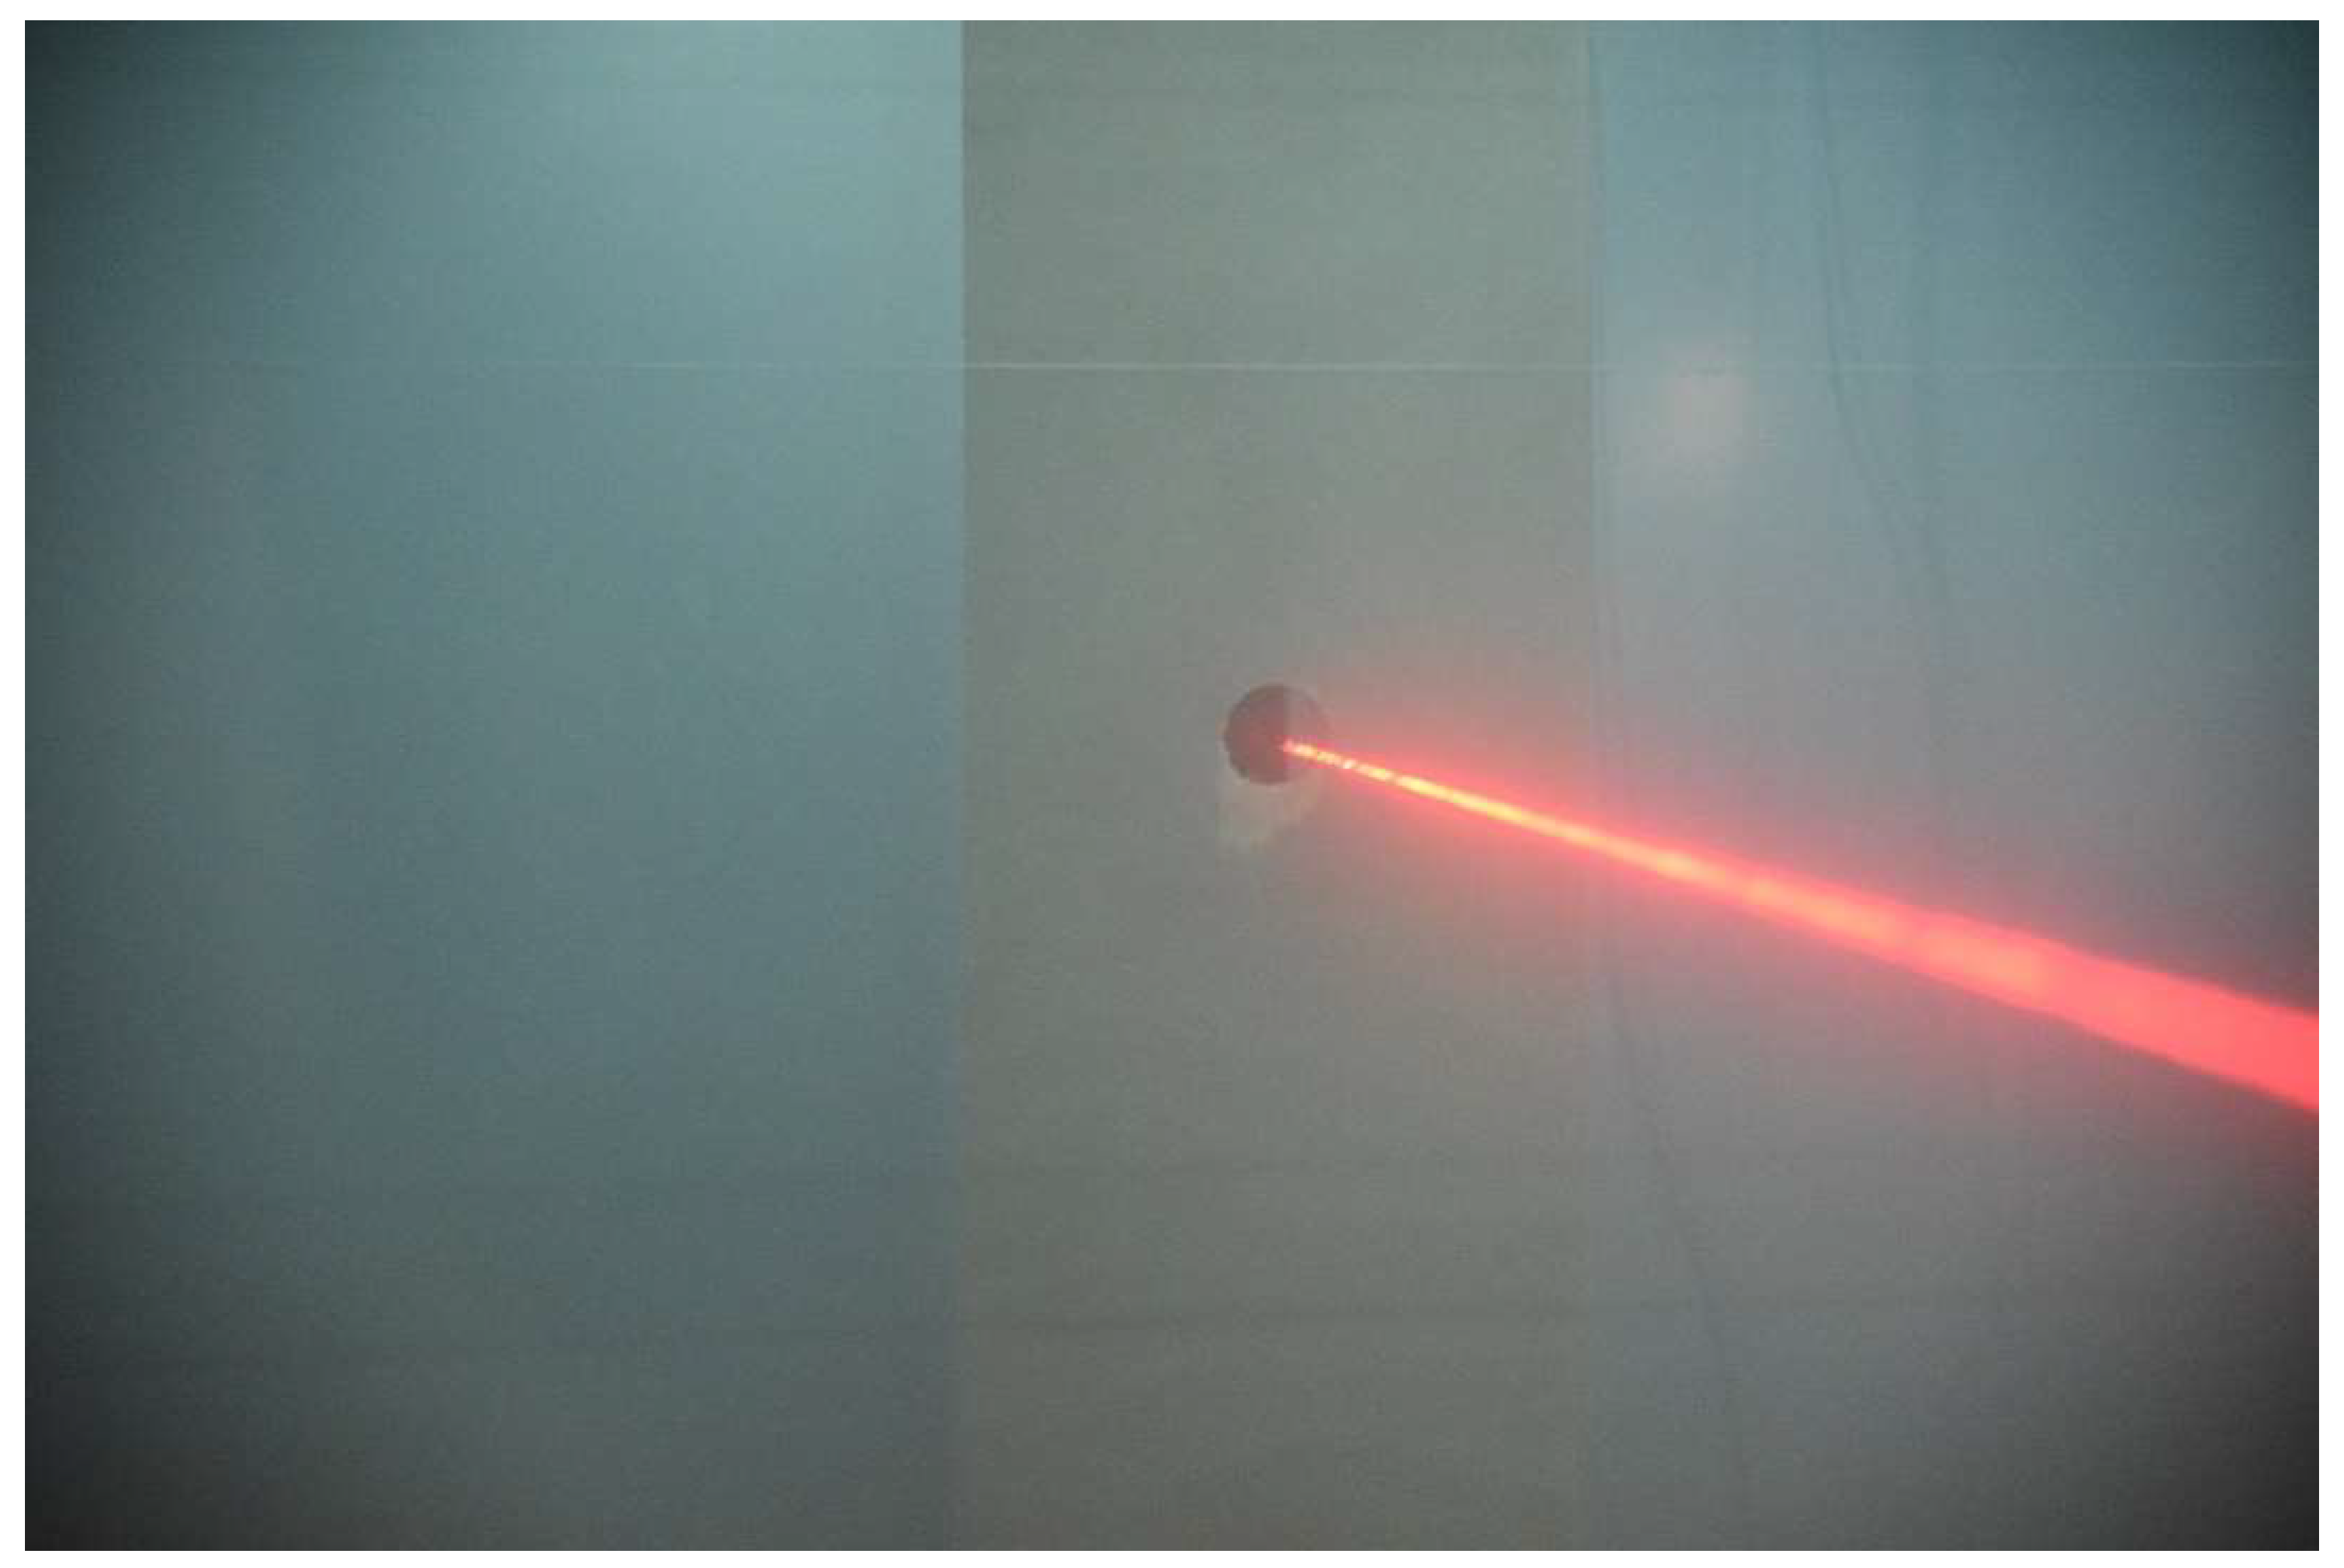
4. Experimental Setup

The experiment was conducted to examine the effect of fog on electromagnetic signal propagation in the Ka band, in a frequency region of 26.5–40 GHz. An Agilent (USA) Vector Network Analyzer model N5230C covering frequencies up to 40 GHz is used. The experiment was conducted in a closed tunnel, shown in Figure 4, where artificial fog was introduced under controlled conditions. The Ka radiation was transmitted through the fog, while measuring attenuation and phase shifts. Independent optical measurements were performed simultaneously, to characterize fog visibility and water vapor concentration inside the tunnel.
The tunnel dimensions were 18 m length with a cross-section of 2 m × 2 m (width × height), allowing free passage across the mmW radiation beam, see Figure 4. The transmitter/receiver system was placed on one side of the tunnel and a 2 m × 2 m metallic board with Lambertian surface was positioned perpendicularly on the other side, in order to enhance the back-scattering signal to the radar’s receiver. As a result, the mmW radiation traveled through a total distance of 36 m (forth and back).
The tunnel was built to a minimum of clapboard construction to reduce a parasitic back-reflections of stray radiation toward the receiver. The entire length of the tunnel was covered with a nylon sheet to allow a stabilizing of a water droplets cloud to settle. This experimental setup was built within a closed structure to minimize the impact of the outdoor weather on the meteorological conditions, cloud concentration, and droplets size distribution inside the tunnel.
Through four openings along the tunnel, a thick artificial fog was introduced with a stable size distribution whose mass median diameter (MMD) is approximately 8 µm. This droplet distribution represents a compromise between the distribution of cumulus clouds and radiative fogs [29,30], which mmW radiation may propagate in a natural atmosphere. The cloud was generated using four ultrasonic foggers based on piezoelectric transducers whose operation is controlled automatically during the experiment to achieve the required visibility, shown in Figure 5. A fast homogenization of the cloud inside the tunnel was achieved, by small fans that were distributed along the tunnel’s corners to reduce effects of stray radiation to the receiver, shown in Figure 6. The fans were turned off during the measurement itself.
The mmW propagation measurements were carried out sequentially from high to low cloud concentrations. The decrease in fog concentration, while maintaining homogeneity and other cloud parameters stable within the tunnel, is achieved spontaneously during the experiment. The highlighted gray area in Figure 7 shows a typical homogeneity while gradual reduction in visibility (panel b) and corresponding cloud concentration (panel a) is achieved within the tunnel, as indicated by the similarity of the black and the red curves. A course of ~12 successive propagation measurements during this time period were completed within 20 min to ensure maximal reliability when comparing results.
The classification of droplets size distributions was done using a SprayTech Malvern Instrument equipped with a 300 mm lens, allowing for real-time measurement of droplet diameters in the range of 0.1–900 µm. The technique is based on a diffraction of light in 632.8 nm that is measured by a spaced array of 36 detectors. The Mie and Fraunhofer scattering pattern is instantaneously analyzed using a multiple scattering model and shows a typical cloud distribution that was derived from the SprayTech during the experiment, ensuring MMD of ~8 µm. This system is also providing an additional measure of mass concentration within a short optical path of the instrument to double check the cloud uniformity inside the tunnel. Figure 8 shows values of the droplet sizes measured by the SprayTech.
Two horn antennas were connected to the VNA that was placed outside the fog chamber—one for transmission and the other for reception. The antennas were directed into the chamber so that they were aimed at a metal board placed on the other side of the chamber, as shown in Figure 9. The experimental setup was tuned to 28 GHz, a frequency that is allocated for the 5G network.

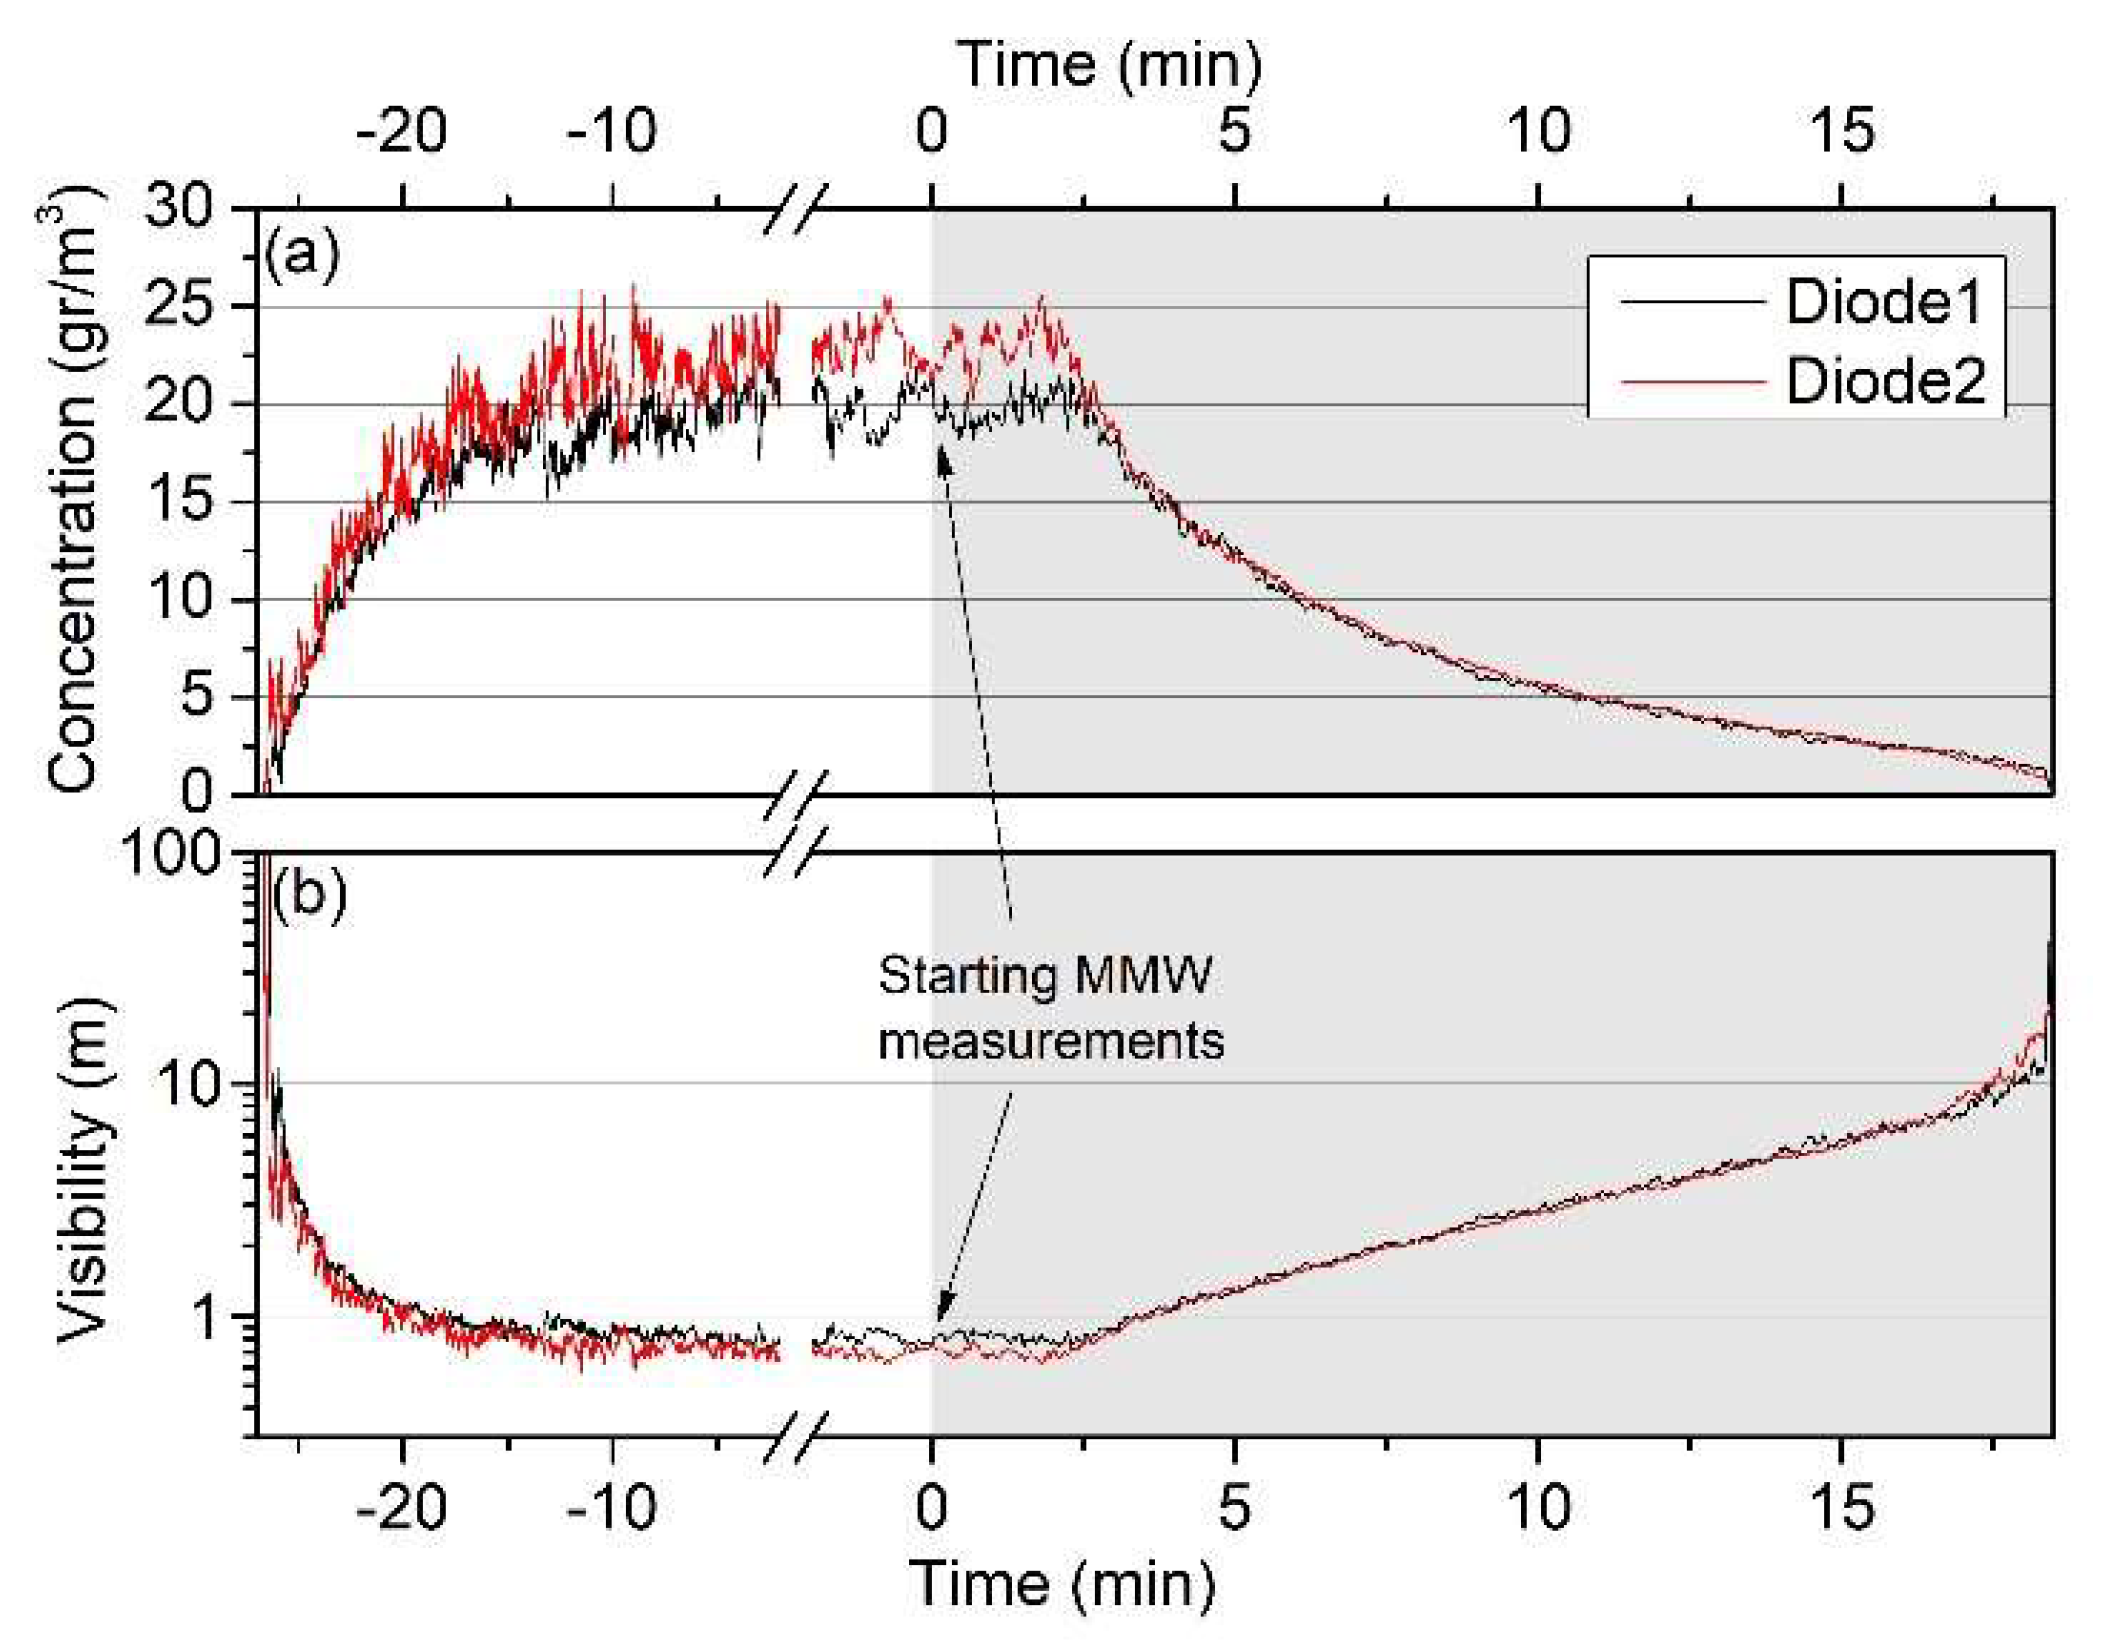
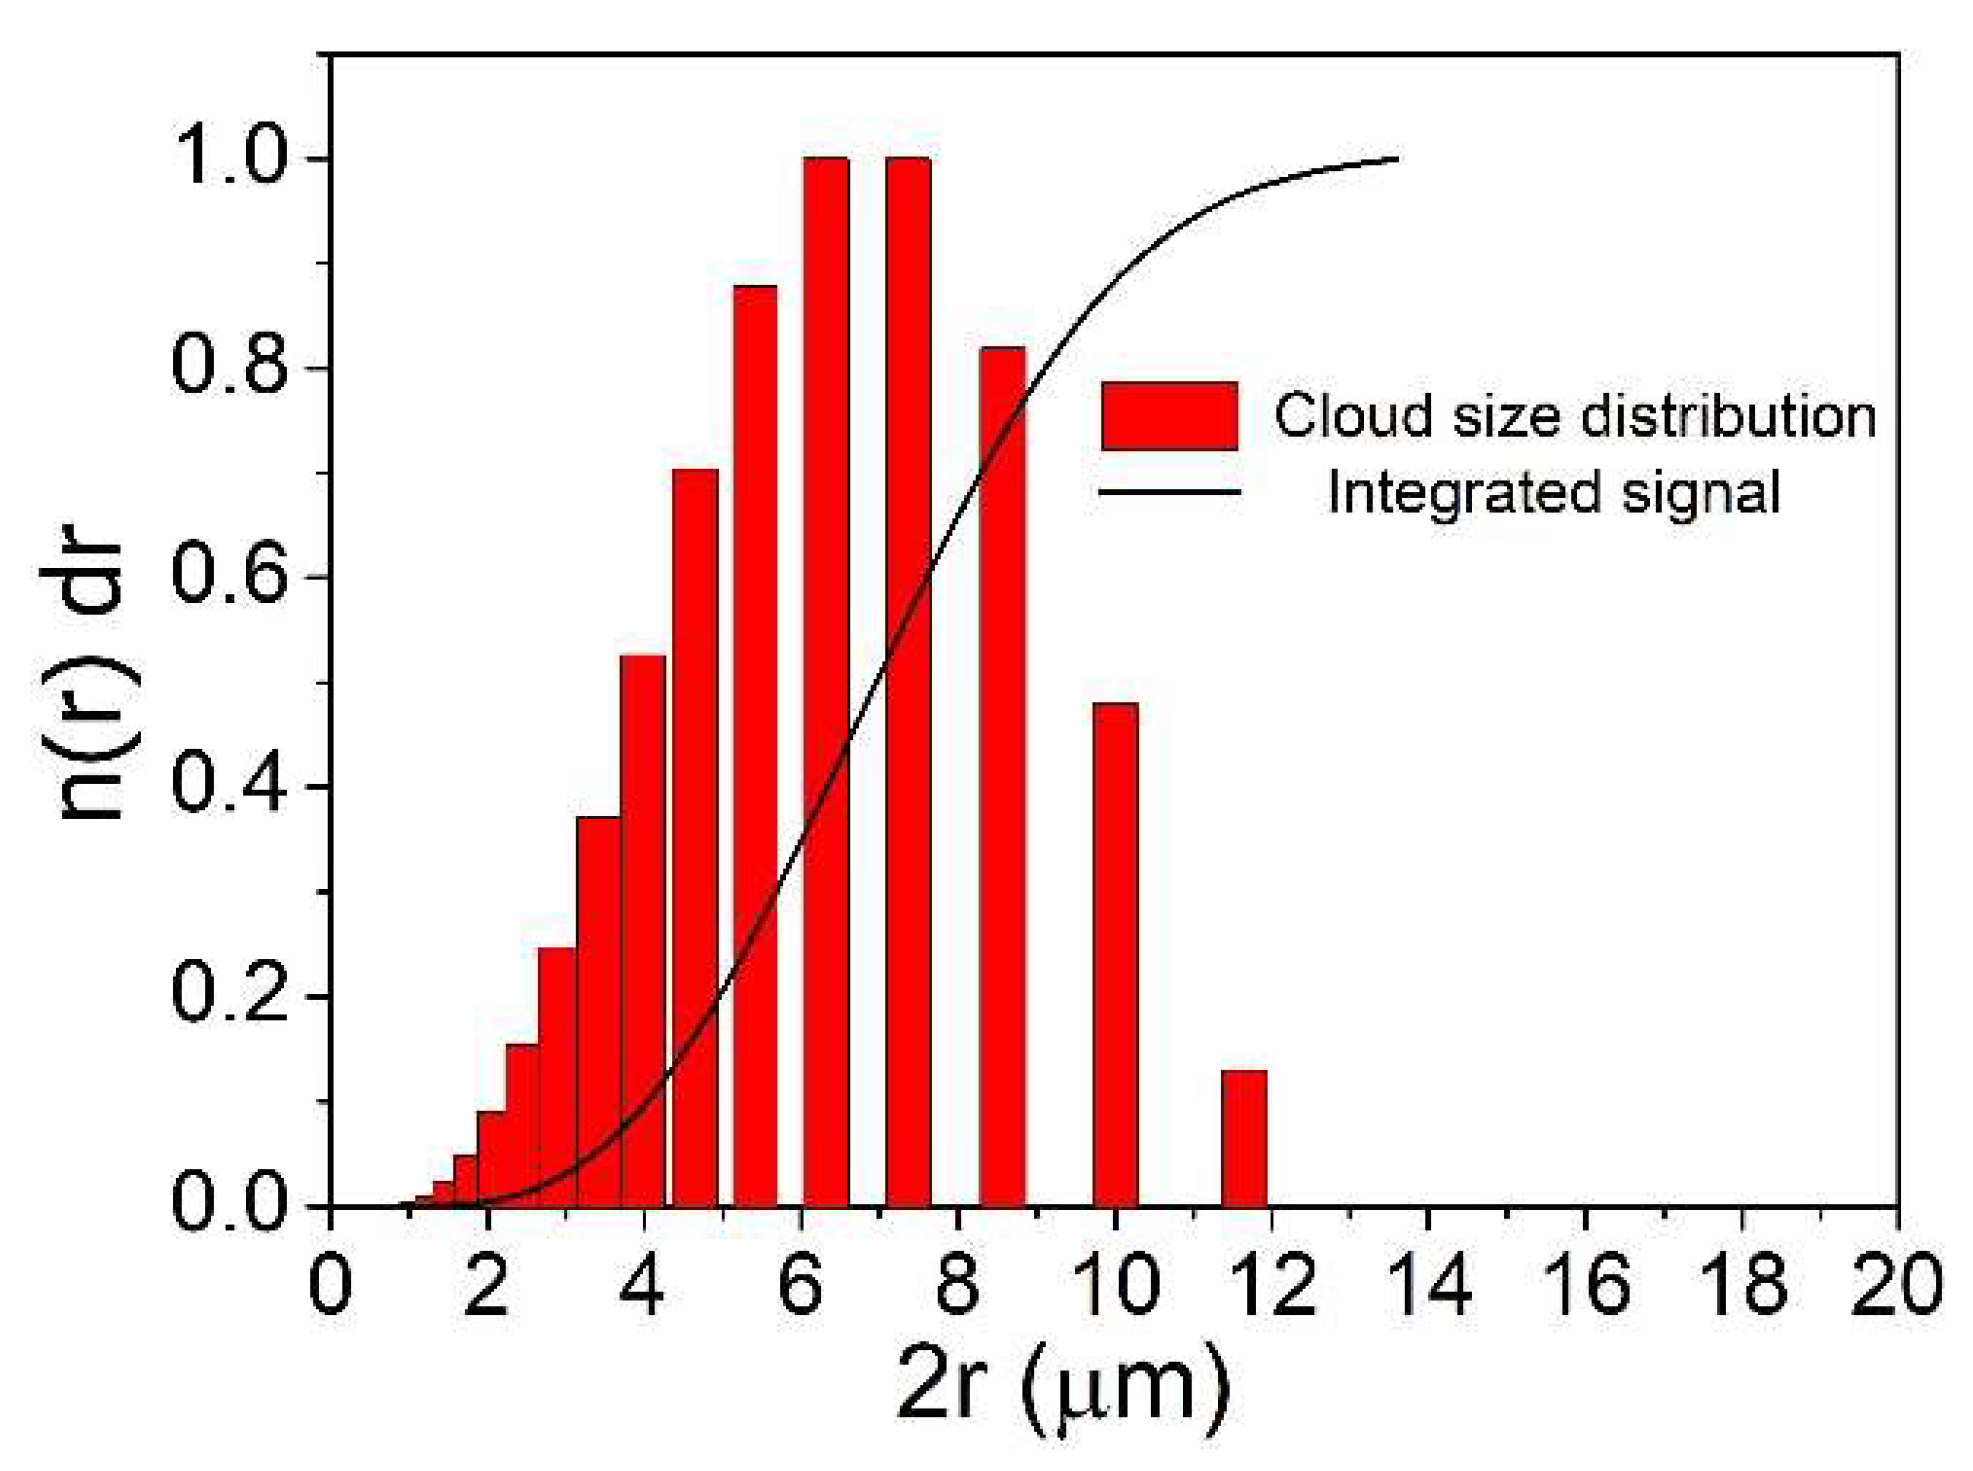
5. Visibility Measurement and Estimation of Water Droplet Concentration

The visibility measurements were discussed elsewhere [17]. However, we will concentrate more on the experimental technique here. Two laser diode-based systems (ThorLabs CPS635) were simultaneously operated in different positions across the tunnel to measure the optical transmittance and test the homogeneity of the cloud during the entire course of measurements. The laser source at 635 nm was placed on one side of the tunnel and a Si Avalanche Photodetector (ThorLabs APD36) was placed 2.19 m away on its other side, as shown in Figure 10.
The transmittance over this distance can be measured using the Beer–Lambert Equation as follows:
I t I 0 = e α e x t W l i q d
where α e x t is the averaged mass extinction coefficient (in m 2 / g ), W liq is the concentration of the liquid water phase (in g / m 3 ), and I 0 & I t are the intensity signals measured at time zero when the tunnel is clean and at a time ‘t’, respectively.
To normalize for the laser intensity fluctuations, the p-polarized light was split near the source using a Brewster window to minimize reflections. Thus, about 5% of the output intensity was measured simultaneously by a reference APD detector located next to it. All optics were purged with fresh air to avoid condensation on the surfaces. The light intensity was modulated by varying the current periodically at a frequency of 129 Hz and the measured signal via the Ref/Signal APDs was plugged to a National Instruments A/D card (PCI-4472) equipped with a LabView lock-in amplifier software kit. According to Ref. [17], the instantaneous visibility at a 1 Hz is calculated via the following expression:
V i s ( t ) = l n 50 · d ln ( I 0 I t )
Note that d = 2.19   m is the actual optical pass length through the cloud. Since reference APD is applied here, the explicit expression for the power ratio used in Equation (11) is as follows:
I 0 I t = I 0 S i g · I t R e f I t S i g · I 0 R e f
where Sig and Ref indexes are the abbreviations for the APD types.
The mass extinction coefficient α e x t is calculated by weighting the relative contribution of the extinction efficiency Q e x t ( r ) from Mie theory taking into account the water refractive index n ( 635 n m ) = 1.331 + i 1.5 · 10 8 and the actual size distribution n ( r ) inside the tunnel (see), as follows:
α e x t =   r 2 Q e x t ( r ) n ( r ) d r 4 3 ρ   r 3 n ( r ) d r 0.246   m 2 / g
where ρ is the water density. When substituting the value of α e x t from Equation (13) into Equation (10), the cloud concentration in the liquid phase W liq can be derived vs. time. Figure 7a shows an example for the cloud concentration calculated during a full course of 12 propagation measurements. Panel (b) shows the associated visibility that was derived using Equation (11).
We note, that while mmW propagation is affected by the total water concentration absorption in all phases, the propagation of Vis-IR radiation through foggy atmosphere is predominantly influenced by a Mie scattering, as described above. The point relevant to our estimation method for the cloud water concentration is that the extinction of the 635 nm light is mainly affected by the aerosol phase. Thus, the signal measured under Equation [10] is oblivious to the existence of a water concentration due to a vapor phase ( W gas ). This last W gas is separately calculated for the case of 100% relative humidity taking into account the meteorological condition inside the tunnel as follows:
c = M w H 2 o · P v a p K · T 12 g r m 3
and thus the total water concentration that is used for the phase retardation of the mmW radiation is W Total = W gas + W l i q .

6. Experimental Results
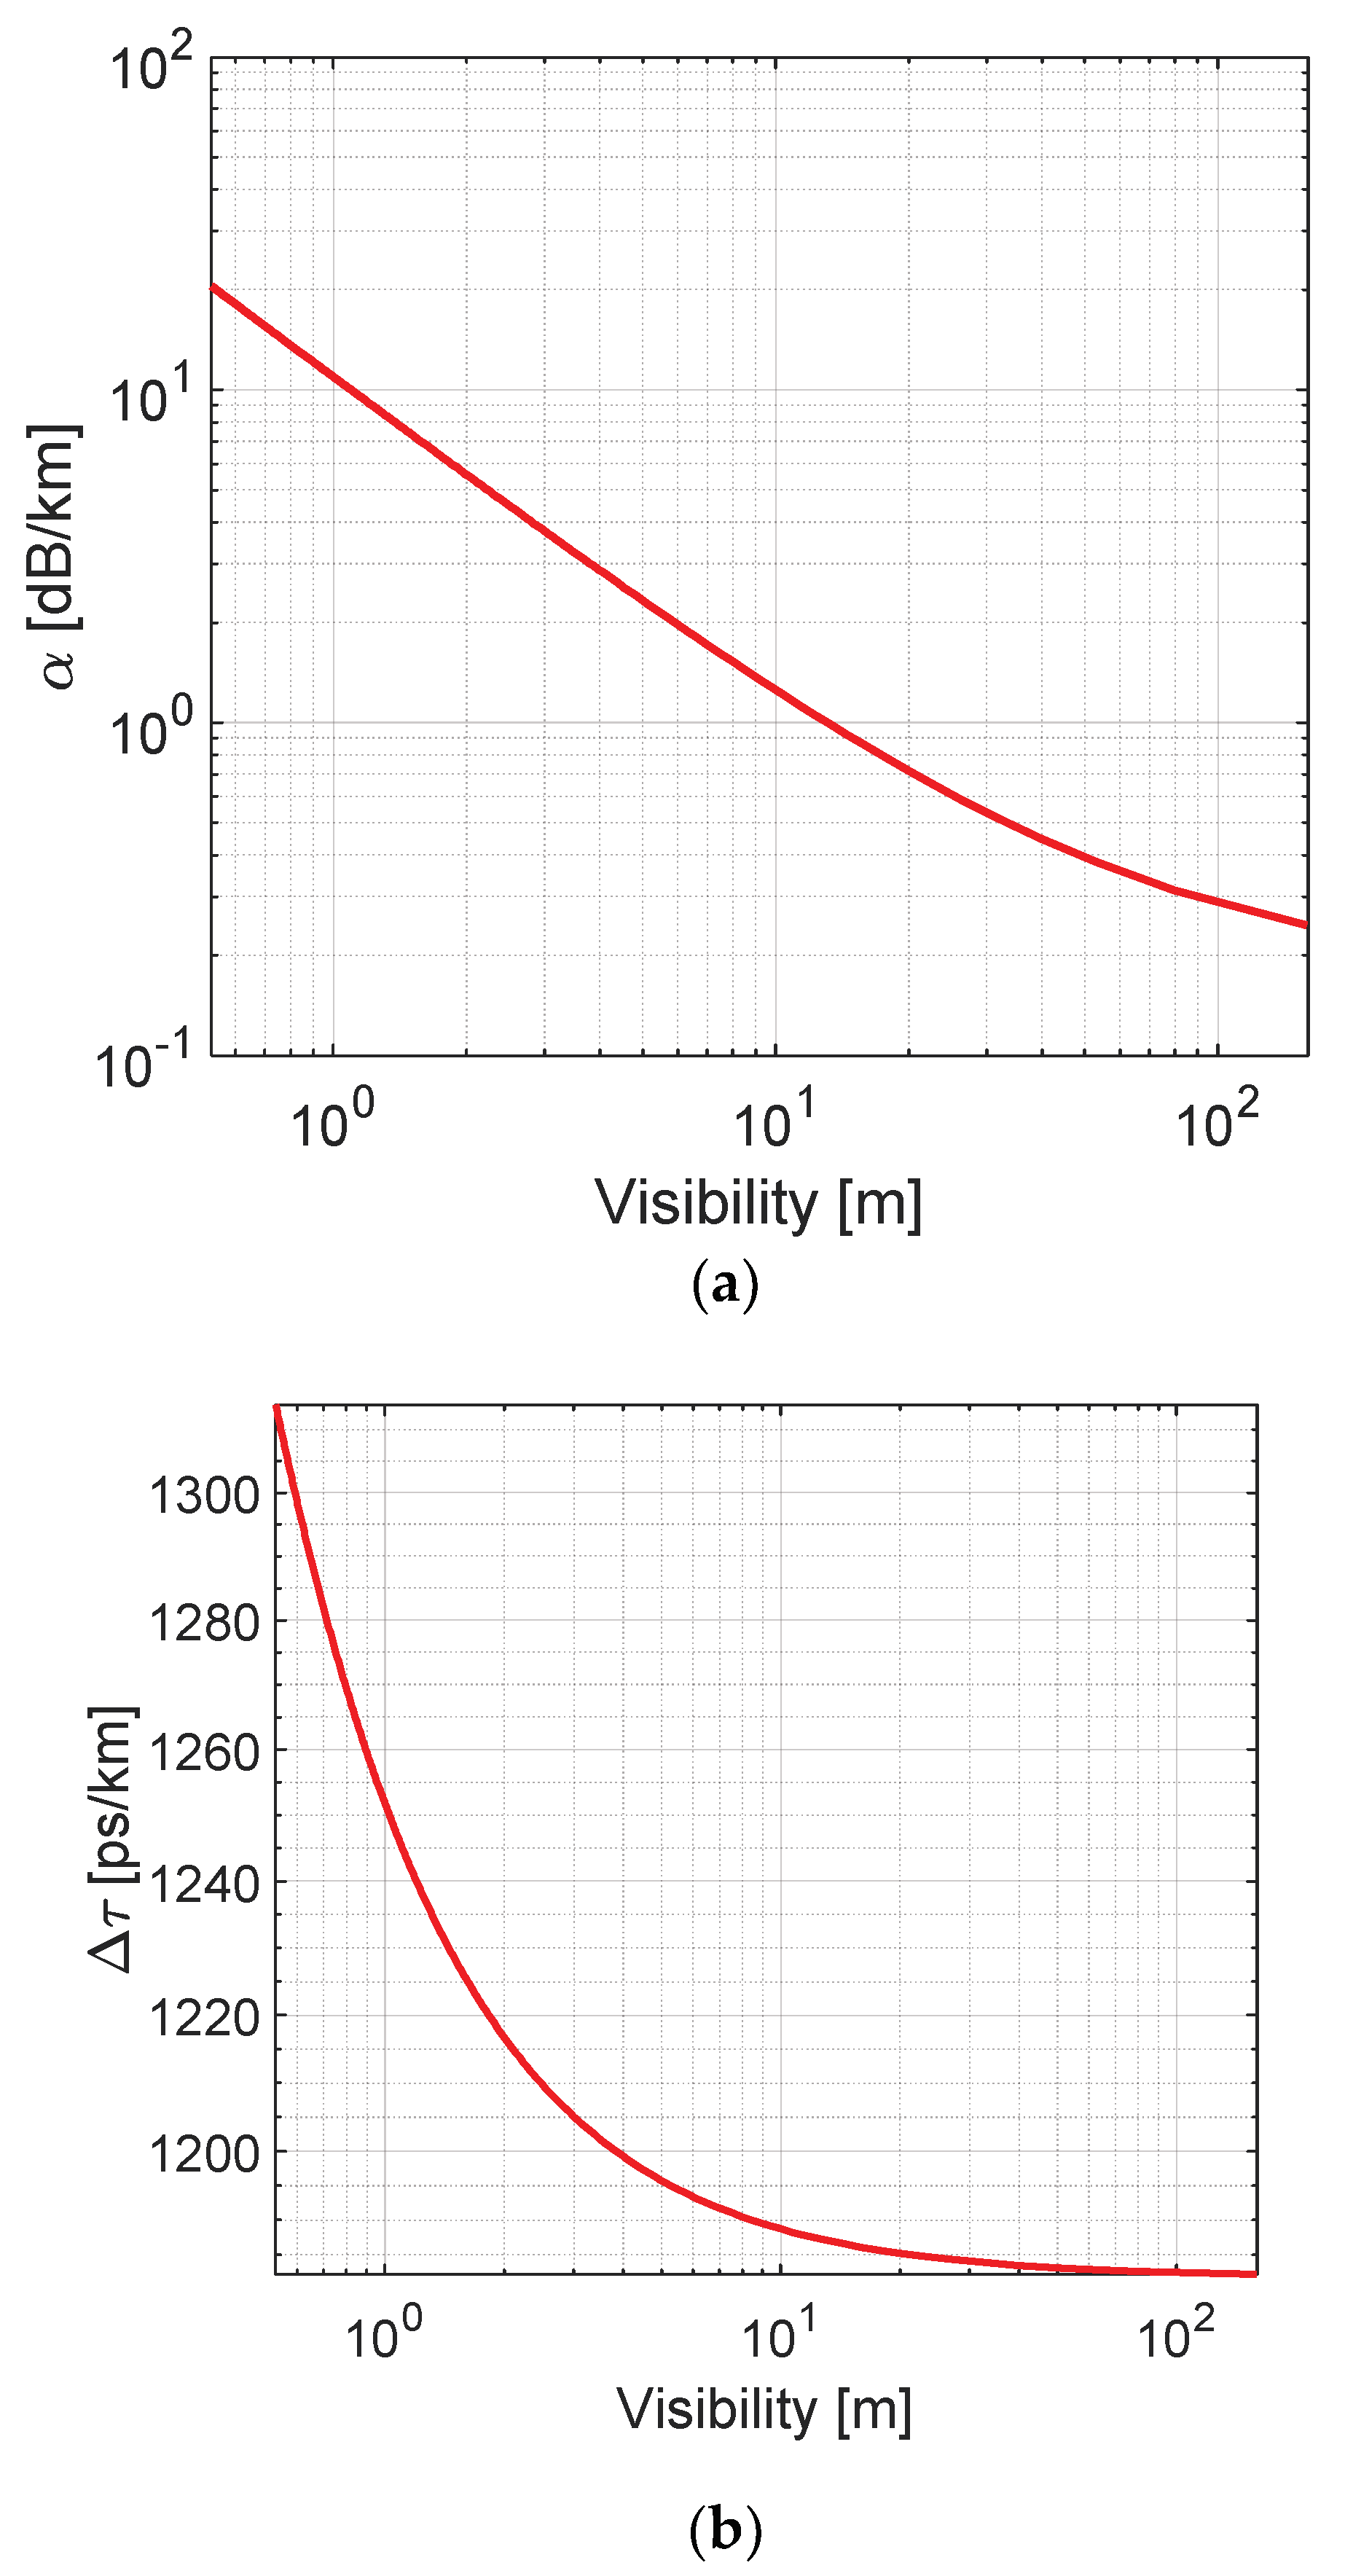
The characteristics of the mmW propagation were observed with a two-port vector network analyzer measuring the scattering parameter S21. The data of these results were stored for later processing, in order to find the received signal respective magnitude and phase shift. The attenuation coefficient and the group delay are extracted and compared to the results obtained from the model. The study was focused on frequencies in the vicinity of 28 GHz allocated for the 5G cellular network.

6.1. Attenuation

Figure 11 presents mmW for different levels of fog visibilities. The noise appearing in the graph was reduced by averaging. Visibility distance is measured using the optical laser systems and detectors. The fog level was changed from 1000 m down to 80 cm.
The calculation of the cumulative attenuation along the path of propagation in different fog densities is carried out from the scattering parameter S21 measured by the VNA. The attenuation is calculated using Equation (9):
L ( f ) = G r · ( c 4 π d · | S 2 , 1 | · f ) 2 · G t
Here, the gain of both transmitting and receiving antennas are Gr = Gt = 24 dB at f = 28 GHz. The overall distance is d = 36 m. According to the model, the power which is estimated to be received at clear visibility is −43.53 dBm. The experiment demonstrates −43.79 dBm, which is almost the same.
Using a simulation in Matlab, a comparison is made between the attenuation measured in the experiment and its estimation using the model. The comparison revealed a good match as shown in Figure 12. The solid line represents the model estimation and the dots are for the experimental results.

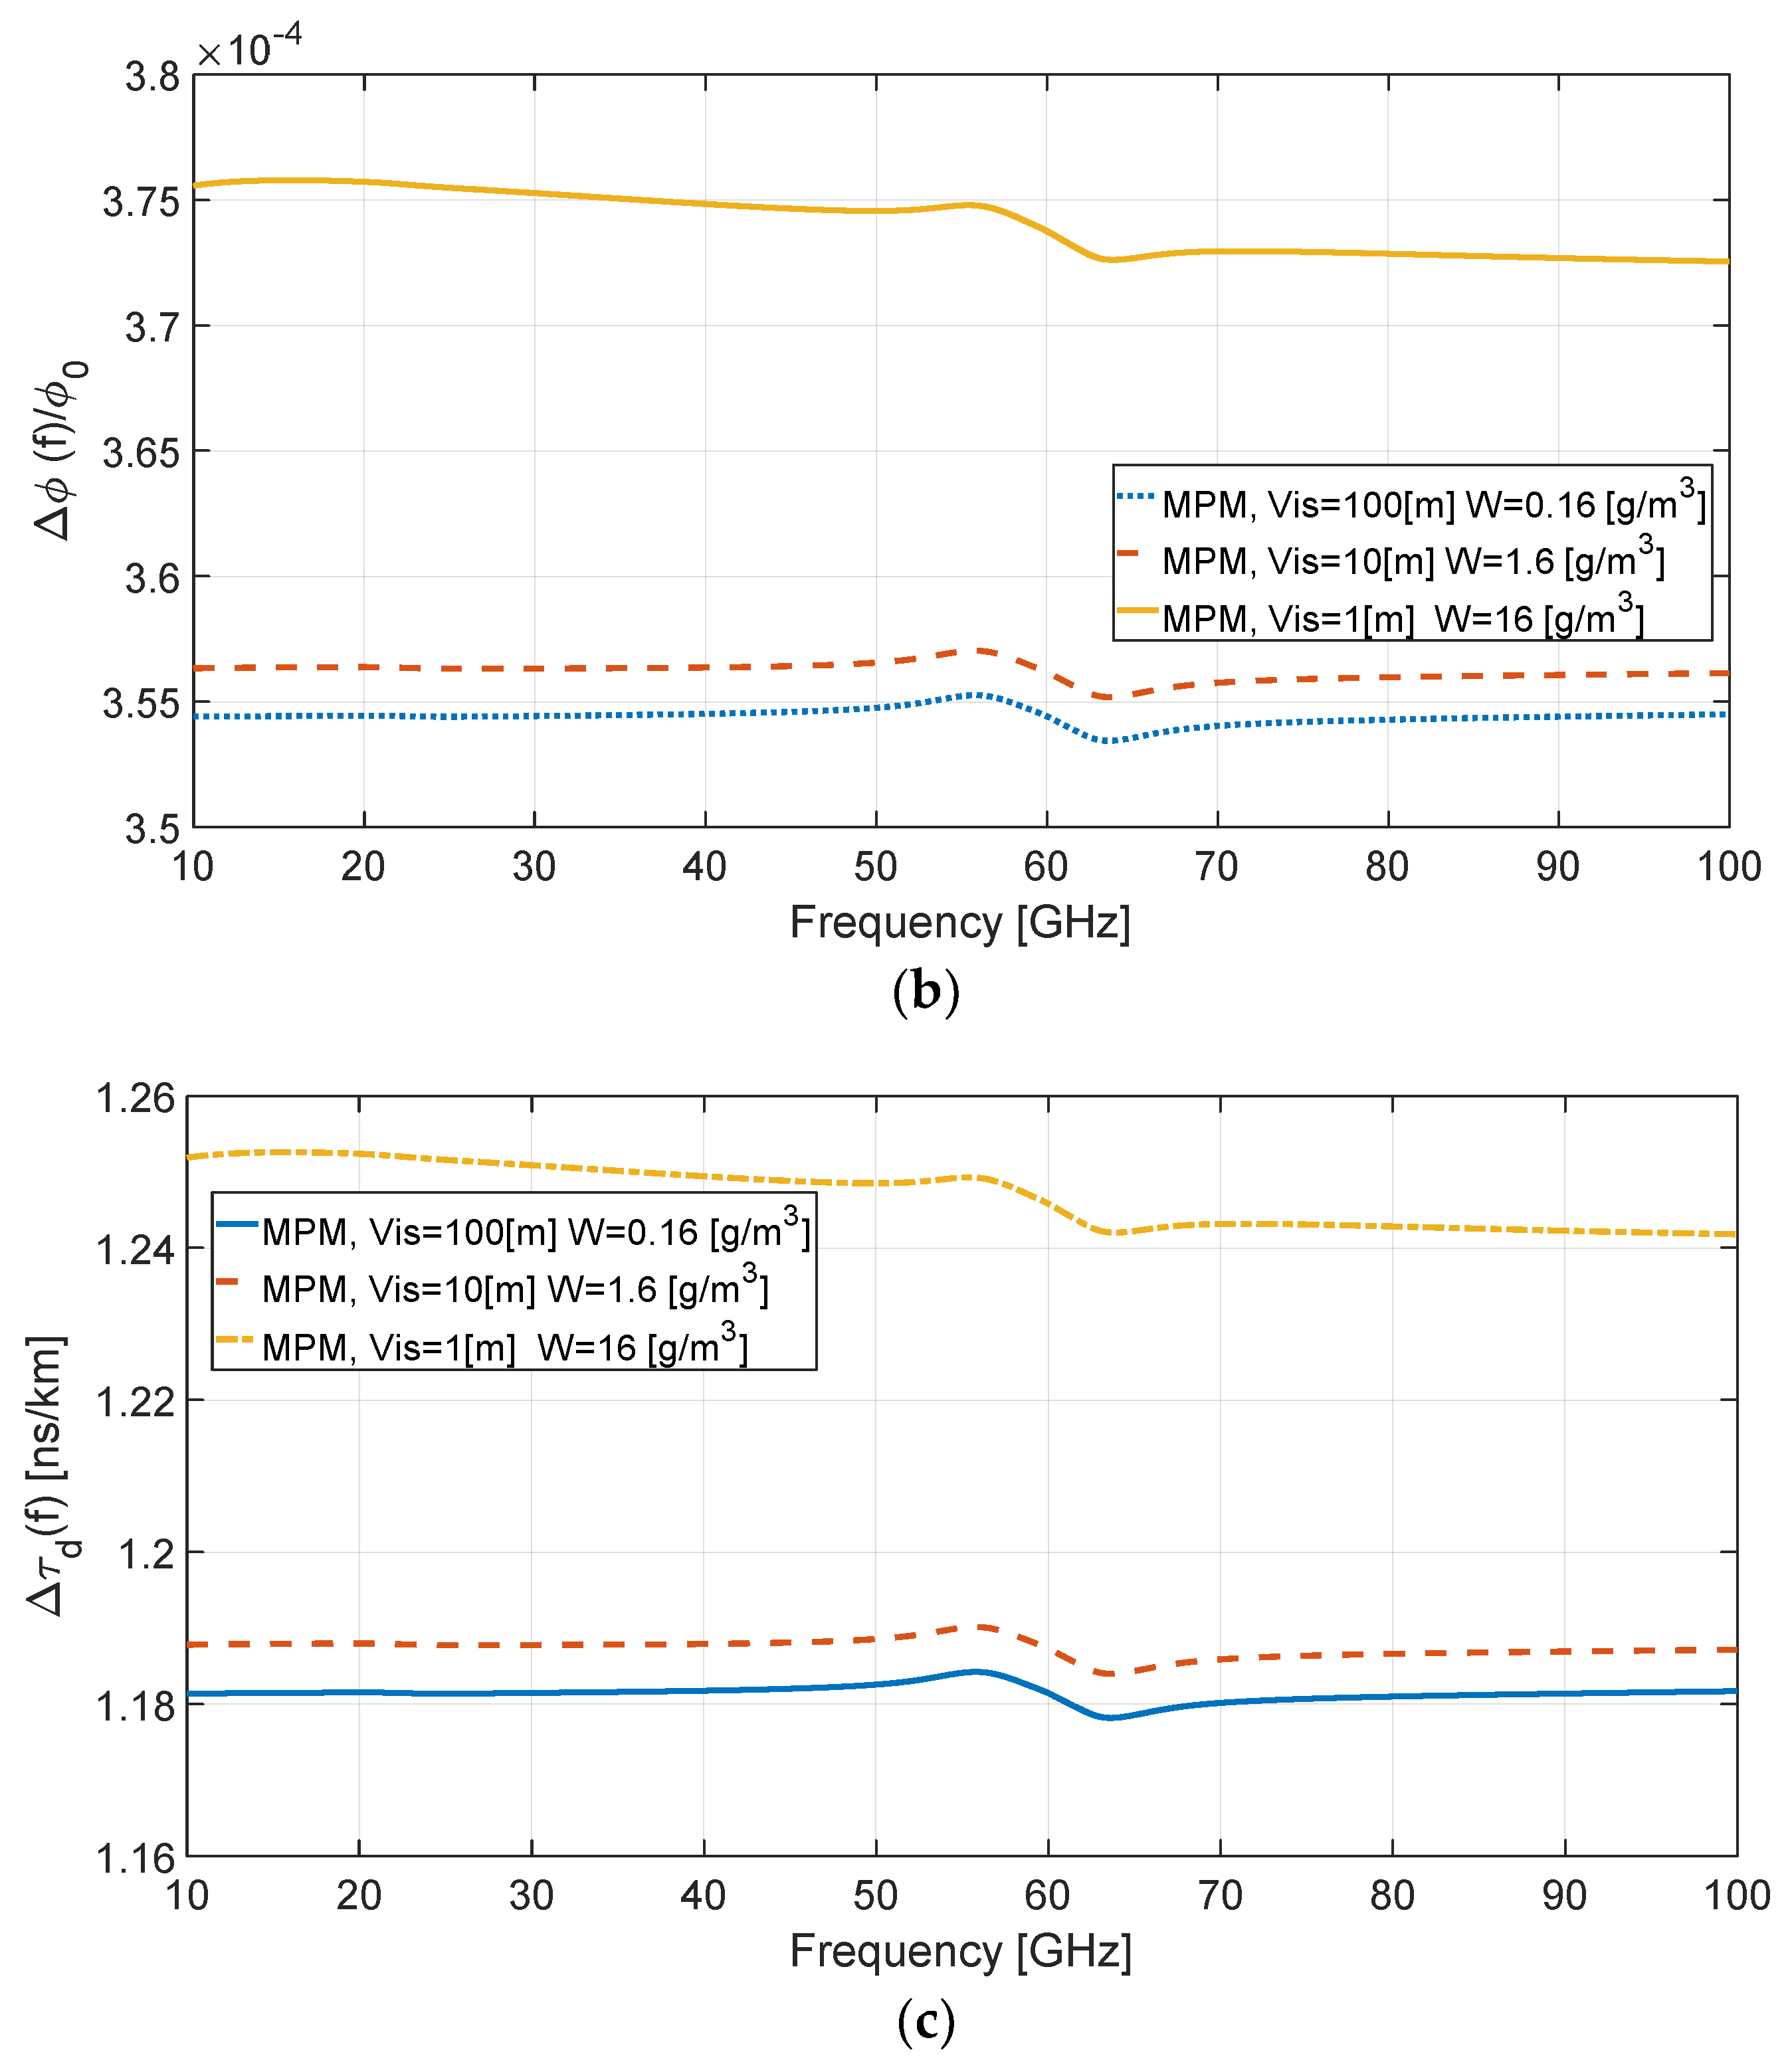
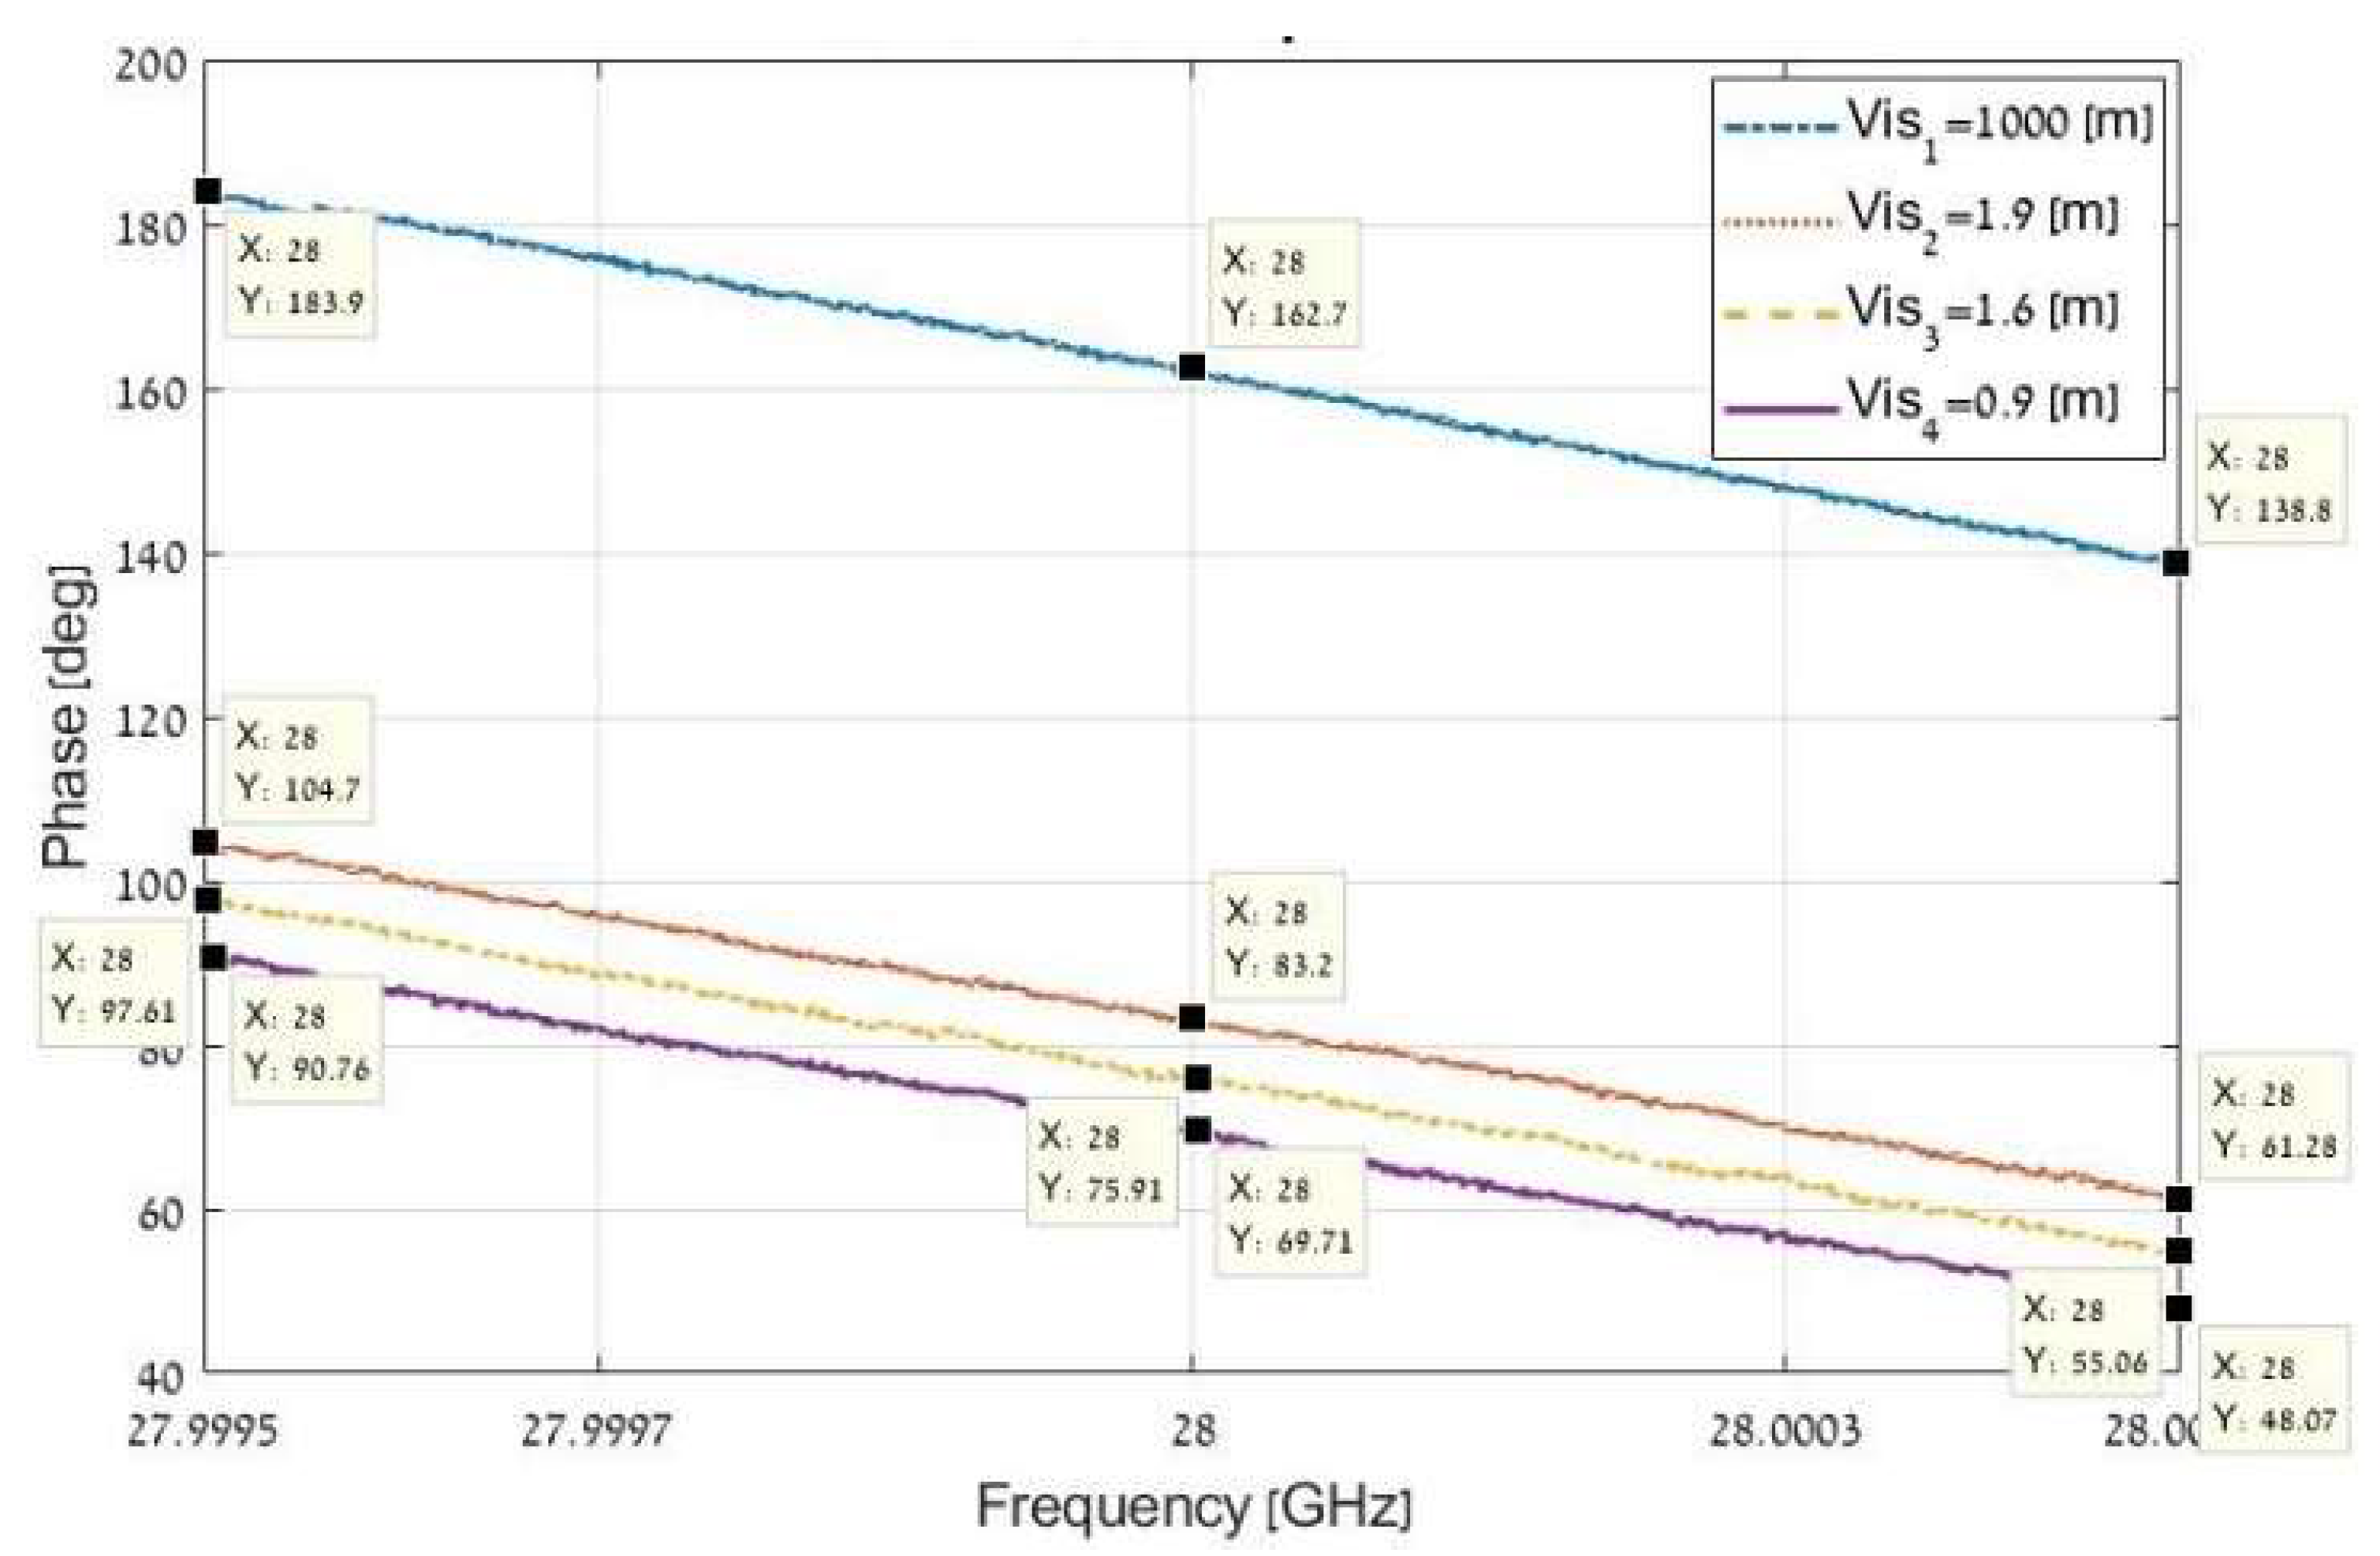
6.2. Phase Shift and Group Delay

The received signal phase shift relative to the transmitted signal is also analyzed. First, the overall distance of the propagation between receiving and transmission is calculated using Equation (7) for clear air (high visibility). In this case, the distance can be estimated from the slope of the graph appearing in Figure 13 for 1000 m visibility:
d = c · τ 0 = c 2 π d ϕ 0 ( f ) d f
It is found that the overall length which the signal passes is d = 18.775 m. This value is close to the value measured manually.
Now, the real part of the refractivity N 0 + N ( f ) is calculated by the absolute phase obtained in the measurement using Equation (6):
N 0 + N ( f ) = Δ ϕ ( f ) ϕ 0 ( f ) · 10 6 = ϕ ( f ) ϕ 0 ( f ) ϕ 0 ( f ) · 10 6
Once these coefficients have been found, they can be used for calculating of the time delay using (10). The incremental group delay is found by:
Δ τ d ( f ) = d c · [ ϕ ( f ) ϕ 0 ( f ) ϕ 0 ( f ) ]
where τ 0 = d c = 62.61 n s is the approximated delay expected in clear air. The results are summarized in Table 3.
Figure 14 demonstrates the increase in the refractivity as the water droplet concentration W is increased.

7. Summary and Conclusions

Terrestrial fog characteristics are different in terms of distribution of droplet diameter depending on the source of the cloud. For example, night radiation (convection) fog has a lower size distribution <5 µm; then, advection maritime clouds are ~10 µm [29]. Both are common in the Mediterranean basin areas and may perturb electromagnetic radiation differently because of the effect of Mie scattering. However, in the case of mmW propagation, the size parameter allows for the assumption of Rayleigh approximation and hence the most relevant attenuation effect in the atmosphere is due to absorption rather than scattering. Therefore, in this experiment, a greater concern was given to carefully stabilize the droplet size distribution of the cloud, from which the total water concentration could be derived, rather than simulating a particular cloud distribution scenario. The reliability of determining the concentration of this extremely high liquid water content sources (~24 gr/cm3) allows us to examine the mmW phase retardation at a relatively short distance (18 m), which simulates a cumulative potential effect of mmW propagation in the open atmosphere.
Propagation of millimeter wave radiation in the atmospheric medium is characterized via the complex refractivity of the particle composing the air. In foggy conditions, the water droplet suspended in the air causes attenuation and phase shifts, which are determined by the imaginary and real parts of the refraction index, respectively.
Experiments performed in a controlled chamber for different fog densities show comparable results to those estimated by the MPM model. It is demonstrated that attenuation is growing as the water droplet concentration increases (the visibility goes down). In Figure 15a, the attenuation coefficient α is described as a function of the fog visibility, revealing an attenuation range up to two orders of magnitude above that of clear air.
Consequently, in mmW links operating in the presence of fog, the transmission power should be increased in order to accomplish the same link budget as that of a link operating in clear weather conditions. The graph of Figure 11 shows that there is a decrease of 1.5 dB in the received power intensity for a propagation distance of 36 m as in the experiment. Thus, attenuation of 0.042 dB per meter is expected in similar outdoor foggy conditions. For a distance of 100 m, an attenuation of 4.2 dB is anticipated, while for 1 km it will grow to 42 dB. During fog, the attenuation becomes a significant factor to be considered for maintaining the required link budget necessary for reliable mmW communications even in relatively short distances.
The water suspension also leads to an increase in the real part of the refractivity, slowing down the group velocity of the mmW signal. This effect causes a dispersive phase shift that was measured during the experiment for different visibilities (see Figure 15b).
The study can be used for estimating the link budget of wireless links operating in the millimeter wave regime and may also contribute to the understanding of the observations by liquid water clouds radar in the Ka-band. It is focused on the frequency band recently allocated for the 5G cellular network. Heavy fog results in a severe attenuation that may cause a reduction in the signal-to-noise ratio to levels that may disrupt the availability of the communications. Phase dispersion may cause interference in high symbol rate transmissions.

Author Contributions

Conceptualization, Y.P. and G.A.P.; methodology, Y.P., G.A.P., A.E. and O.S. ; software, G.A.P., A.E. and Y.G.; validation, Y.P., G.A.P., A.E. O.S. and Y.G.; formal analysis, Y.P., G.A.P., A.E. and Y.G.; investigation, A.E. O.S. and Y.G.; resources, A.E. O.S. and Y.G.; data curation, A.E. O.S. and Y.G.; writing—original draft preparation, A.E. O.S. and Y.G.; writing—review and editing, Y.P. and G.A.P.; visualization, , Y.P. and G.A.P.; supervision, , Y.P. and G.A.P.; project administration, Y.P. and A.E.; funding acquisition, Y.P. All authors have read and agreed to the published version of the manuscript.

Funding

This research received no external funding.

Conflicts of Interest

The authors declare no conflict of interest.

Appendix A

Table A1. Mathematical Nomenclature and Abbreviations.
SymbolMeaningSymbolMeaning
GHzGiga-Hertz τ 0 time delay in vacuum
mmeter Δ τ d ( f ) incremental group delay
kmkilometercLight speed
cmcentimeterH2Owater
µmmicrometerO2oxygen
nmnanometerPr and Ptreceived and transmitted power respectively
grgram (unit of mass)Gr and Gtthe gains’ of the receiving and transmitting antennas
pspico-secondmmWmillimeter wave
x size parameter α e x t averaged mass extinction coefficient (in m 2 / g )
π Pi ( = 3.14159)Wwater droplet concentration
Ddroplet diameter W liq concentration of the liquid water phase (in g / m 3 )
λ wavelength I 0 and I t the intensity signals measured at time zero when the tunnel is clean and at a time ‘t’
n ( f ) refractive index (frequency dependent) V i s ( t ) instantaneous visibility
N 0   real constant of nondispersive term Q e x t ( r ) extinction efficiency
N ( f ) real terms respectively n ( r ) actual size distribution
N ( f ) imaginary terms respectively ρ water density
α(f)attenuation propagation factorsSig and Refindexes of abbreviations for the APDs types
β(f)wavenumber propagation factors W gas water concentration due to a vapor phase
dpropagation distanceS21measuring scattering parameter
L ( f ) attenuationdBdecibel
ϕ ( f ) corresponsive phase shiftdBmdecibel relative to milli-wate
ϕ 0 ( f ) phase shift in vacuum°Ctemperature in callus degrees
Δ ϕ ( f ) incremental phase shiftkPaKilopascals (Atmospheric pressure unit)
τ d ( f ) group delayRHRelative humidity

References

  1. Federal Communications Commission. Fact Sheet: Spectrum Frontiers Proposal To Identify, Open Up Vast Amounts Of New High-Band Spectrum For Next Generation (5G) Wireless Broadband. 2017. Available online: https://transition.fcc.gov/Daily_Releases/Daily_Business/2016/db0623/DOC-339990A1.pdf (accessed on 23 June 2016).
  2. Rappaport, T.S.; Xing, Y.; MacCartney, G.R.; Molisch, A.F.; Mellios, E.; Zhang, J. Overview of Millimeter Wave Communications for Fifth-Generation (5G) Wireless Networks—With a Focus on Propagation Models. IEEE Trans. Antennas Propag. 2017, 65, 6213–6230. [Google Scholar] [CrossRef]
  3. Rappaport, T.S.; Heath, R.W., Jr.; Daniels, R.C.; Murdock, J.N. Millimeter Wave Wireless Communications; New York University Prentice Hall: New York, NY, USA, 2015. [Google Scholar]
  4. Feng, W.; Li, Y.; Jin, D.; Su, L.; Chen, S. Millimetre-Wave Backhaul for 5G Networks: Challenges and Solutions. Sensors 2016, 16, 892. [Google Scholar] [CrossRef]
  5. Ducournau, G.; Szriftgiser, P.; Pavanello, F.; Peytavit, E.; Zaknoune, M.; Bacquet, D.; Beck, A.; Akalin, T.; Lampin, J.F. THz Communications Using Photonics and Electronic Devices: The Race to Data-Rate. J. Infrared Milli. Terahz. Waves 2015, 36, 198–220. [Google Scholar] [CrossRef]
  6. Matricciani, E. A Relationship Between Phase Delay and Attenuation Due to Rain and Its Applications to Satellite and Deep-Space Tracking. IEEE Trans. Antennas Propag. 2009, 57, 3602–3611. [Google Scholar] [CrossRef]
  7. Federici, J.; Moeller, L. Review of Terahertz and Subterahertz Wireless Communications. J. Appl. Phys. 2010, 107, 111101. [Google Scholar] [CrossRef] [Green Version]
  8. Moeller, L.; Su, K.; Barat, R.B.; Federici, J.F. THz and IR Signaling through Fog Scintillations. In Proceedings of the European Wireless 2012—18th European Conference 2012, Poznan, Poland, 18–20 April 2012. [Google Scholar]
  9. Boccardi, F.; Heath, R.W.; Lozano, A.; Marzetta, T.L.; Popovski, P. Five Disruptive Technology Directions for 5G. IEEE Commun. Mag. 2014, 52, 74–80. [Google Scholar] [CrossRef] [Green Version]
  10. Ge, X.; Tu, S.; Mao, G.; Wang, C.X.; Han, T. 5G Ultra-Dense Cellular Networks. IEEE Wirel. Commun. 2016, 23, 72–79. [Google Scholar] [CrossRef] [Green Version]
  11. Chen, S.; Zhao, J. The Requirements, Challenges, and Technologies for 5G of Terrestrial Mobile Telecommunication. IEEE Commun. Mag. 2014, 52, 36–43. [Google Scholar] [CrossRef]
  12. Csurgai-Horváth, L.; Bitó, J. Fog Attenuation on V Band Terrestrial Radio and a Low-Cost Measurement Setup. In Proceedings of the Future Network & Mobile Summit, Florence, Italy, 16–18 June 2010. [Google Scholar]
  13. Vasseur, H.; Gibbins, C.J. Inference of Fog Characteristics from Attenuation Measurements at Millimeter and Optical Wavelength. Radio Sci. 1996, 31, 1089–1097. [Google Scholar] [CrossRef]
  14. Antes, J.; Boes, F.; Messinger, T.; Lewark, U.J.; Mahler, T.; Tessmann, A.; Henneberger, R.; Zwick, T.; Kallfass, I. Multi-Gigabit Millimeter-Wave Wireless Communication in Realistic Transmission Environments. IEEE Trans. Terahertz Sci. Technol. 2015, 5, 1078–1087. [Google Scholar] [CrossRef]
  15. Golovachev, Y.; Etinger, A.; Pinhasi, G.A.; Pinhasi, Y. Millimeter Wave High Resolution Radar Accuracy in Fog Conditions—Theory and Experimental Verification. Sensors 2018, 18, 2148. [Google Scholar] [CrossRef] [Green Version]
  16. Golovachev, Y.; Etinger, A.; Pinhasi, G.A.; Pinhasi, Y. Propagation Properties of Sub-Millimeter Waves in Foggy Conditions. J. Appl. Phys. 2019, 125, 151612. [Google Scholar] [CrossRef] [Green Version]
  17. Etinger, A.; Golovachev, Y.; Pinhasi, G.A.; Pinhasi, Y. Dielectric Characterization of Fog in the Terahertz Regime. Acta Phys. Pol. A 2019, 136, 749–753. [Google Scholar] [CrossRef]
  18. Battaglia, A.; Ajewole, M.O.; Simmer, C. Multiple Scattering Effects due to Hydrometeors on Precipitation Radar Systems: Multiple Scattering Effects. Geophys. Res. Lett. 2005, 32. [Google Scholar] [CrossRef]
  19. Delanoë, J.; Protat, A.; Vinson, J.P.; Brett, W.; Caudoux, C.; Bertrand, F.; Hallali, R.; Barthes, L.; Haeffelin, M.; Dupont, J.C.; et al. BASTA: A 95-GHz FMCW Doppler Radar for Cloud and Fog Studies. J. Atmos. Ocean. Technol. 2016, 33, 1023–1038. [Google Scholar] [CrossRef] [Green Version]
  20. Matrosov, S.Y. Attenuation-Based Estimates of Rainfall Rates Aloft with Vertically Pointing Ka-Band Radars. J. Atmos. Ocean. Technol. 2005, 22, 43–54. [Google Scholar] [CrossRef]
  21. Matrosov, S.Y. Synergetic Use of Millimeter- and Centimeter-Wavelength Radars For retrievals of Cloud and Rainfall Parameters. Atmos. Chem. Phys. 2010, 10, 3321–3331. [Google Scholar] [CrossRef] [Green Version]
  22. Petty, G.M. A First Course in Atmospheric Radiation; University of Michigan Sundog: Ann Arbor, MI, USA, 2006. [Google Scholar]
  23. Shoshanim, O.; Peri, D.; Egert, S. High Resolution Spectroscopic Study in the Terahertz. IEEE Sens. J. 2014, 14, 547–553. [Google Scholar] [CrossRef]
  24. Liebe, H. Atmospheric EHF Window Transparencies Near 35, 90, 140 and 220 GHz. IEEE Trans. Antennas Propag. 1983, 31, 127–135. [Google Scholar] [CrossRef]
  25. Liebe, H.J. MPM—An Atmospheric Millimeter-Wave Propagation Model. Int. J. Infrared Milli. Waves 1989, 10, 631–650. [Google Scholar] [CrossRef]
  26. International Electronical Commission. International Lighting Vocabulary; CIE 17.4; International Electronical Commission: Geneva, Switzerland, 1987. [Google Scholar]
  27. International Telecommunication Union. Attenuation Due to Clouds and Fog; ITU-R P.840-8; International Telecommunication Union: Geneva, Switzerland, 2019. [Google Scholar]
  28. Pinhasi, G.A.; Golovachev, Y. Propagation of Linear FM Signals in Dielectric Media. ResearchGate. 2017. Available online: https://www.researchgate.net/publication/326176854_PROPAGATION_OF_LINEAR_FM_SIGNALS_IN_DIELECTRIC_MEDIA (accessed on 30 January 2020).
  29. Muhammad, S.S.; Flecker, B.; Leitgeb, E.; Gebhart, M. Characterization of Fog Attenuation in Terrestrial Free Space Links. Opt. Eng. Opt Eng 2007, 46. [Google Scholar] [CrossRef]
  30. Tampieri, F.; Tomasi, C. Size Distribution Models of Fog and Cloud Droplets in Terms of the Modified Gamma Function. Tellus 1976, 28, 333–347. [Google Scholar] [CrossRef] [Green Version]
Figure 1. Transmission of millimeter waves in various fog visibilities in: (a) attenuation L ( f ) in [dB]; (b) incremental phase shift Δ ϕ ( f ) / ϕ 0 ; (c) incremental group delay Δ τ d ( f ) .
Electronics 09 00720 g001aElectronics 09 00720 g001b
Figure 2. Graphs of the power ratio Pr/Pt as a function of frequency expected at distance of 1 km, assuming omni-directional antennas for different visibility levels.
Electronics 09 00720 g002
Figure 3. Graphs of the 28 GHz link budget power ratio Pr/Pt as a function of distance d.
Electronics 09 00720 g003
Figure 4. Schematic illustration of experimental setup [16].
Electronics 09 00720 g004
Figure 5. The fog-streaming machine.
Electronics 09 00720 g005
Figure 6. The fog chamber with the small fans used to distribute the fog uniformly.
Electronics 09 00720 g006
Figure 7. Typical results for the cloud concentration within the tunnel during a course of mmW mesurements: (a) and the corresponding visibility distance (b). The highlighted gray indicates the time at which mmW measurements were conducted.
Electronics 09 00720 g007
Figure 8. A typical droplet size distribution measured by the SprayTech during the experiment.
Electronics 09 00720 g008
Figure 9. Experiment system: (a) the Network Analyzer connected to two horn antennas outside the chamber; (b) the horn antennas.
Electronics 09 00720 g009
Figure 10. The laser beam passing through the fog tunnel.
Electronics 09 00720 g010
Figure 11. Received signal power at 28 GHz for variable fog visibility.
Electronics 09 00720 g011
Figure 12. Simulation and experiment results for the attenuation mmW at 28 GHz. The environmental conditions are: T = 16 °C, P = 101 KPa, RH = 100%.
Electronics 09 00720 g012
Figure 13. Graph of experimental results of received signal phase at 28 GHz for different fog visibilities.
Electronics 09 00720 g013
Figure 14. Simulation and experimental results for the real part of refractivity at 28 GHz. Environmental conditions: T = 16 °C, P = 101 kPa, RH = 100% (For reference, RH = 60% for clear air).
Electronics 09 00720 g014
Figure 15. (a) attenuation and (b) incremental group delay of 28 GHz mmW for different fog visibility values.
Electronics 09 00720 g015
Table 1. Millimeter wave band for 5G communications.
Frequency BandAdvantagesDisadvantages
28 GHzSuffers the least path loss; Low oxygen absorption and rain attenuation.Lightly licensed; The bandwidth is relatively small.
38 GHzRelatively less attenuation caused by oxygen absorption and rain.Less research and applications done.
60 GHzUnlicensed bands;
Large bandwidth to achieve multi-gigabit rate.
Peak point of oxygen absorption; Relatively large rain attenuation.
73 GHzSmall effects of atmospheric absorption.Large rain attenuation;
Large path loss due to high frequency point.
Table 2. Comparison of measured fog attenuation in millimeter wavelengths with previous researches.
Frequency [GHz]ReferenceVapor
Concentration
[g/m3]
Measured Attenuation [dB/km]Comments
72.56[12]0.20.6
210[13]0.030.4
240[14]337
320[15]3079.8Artificial fog was created by a thermal fog machine
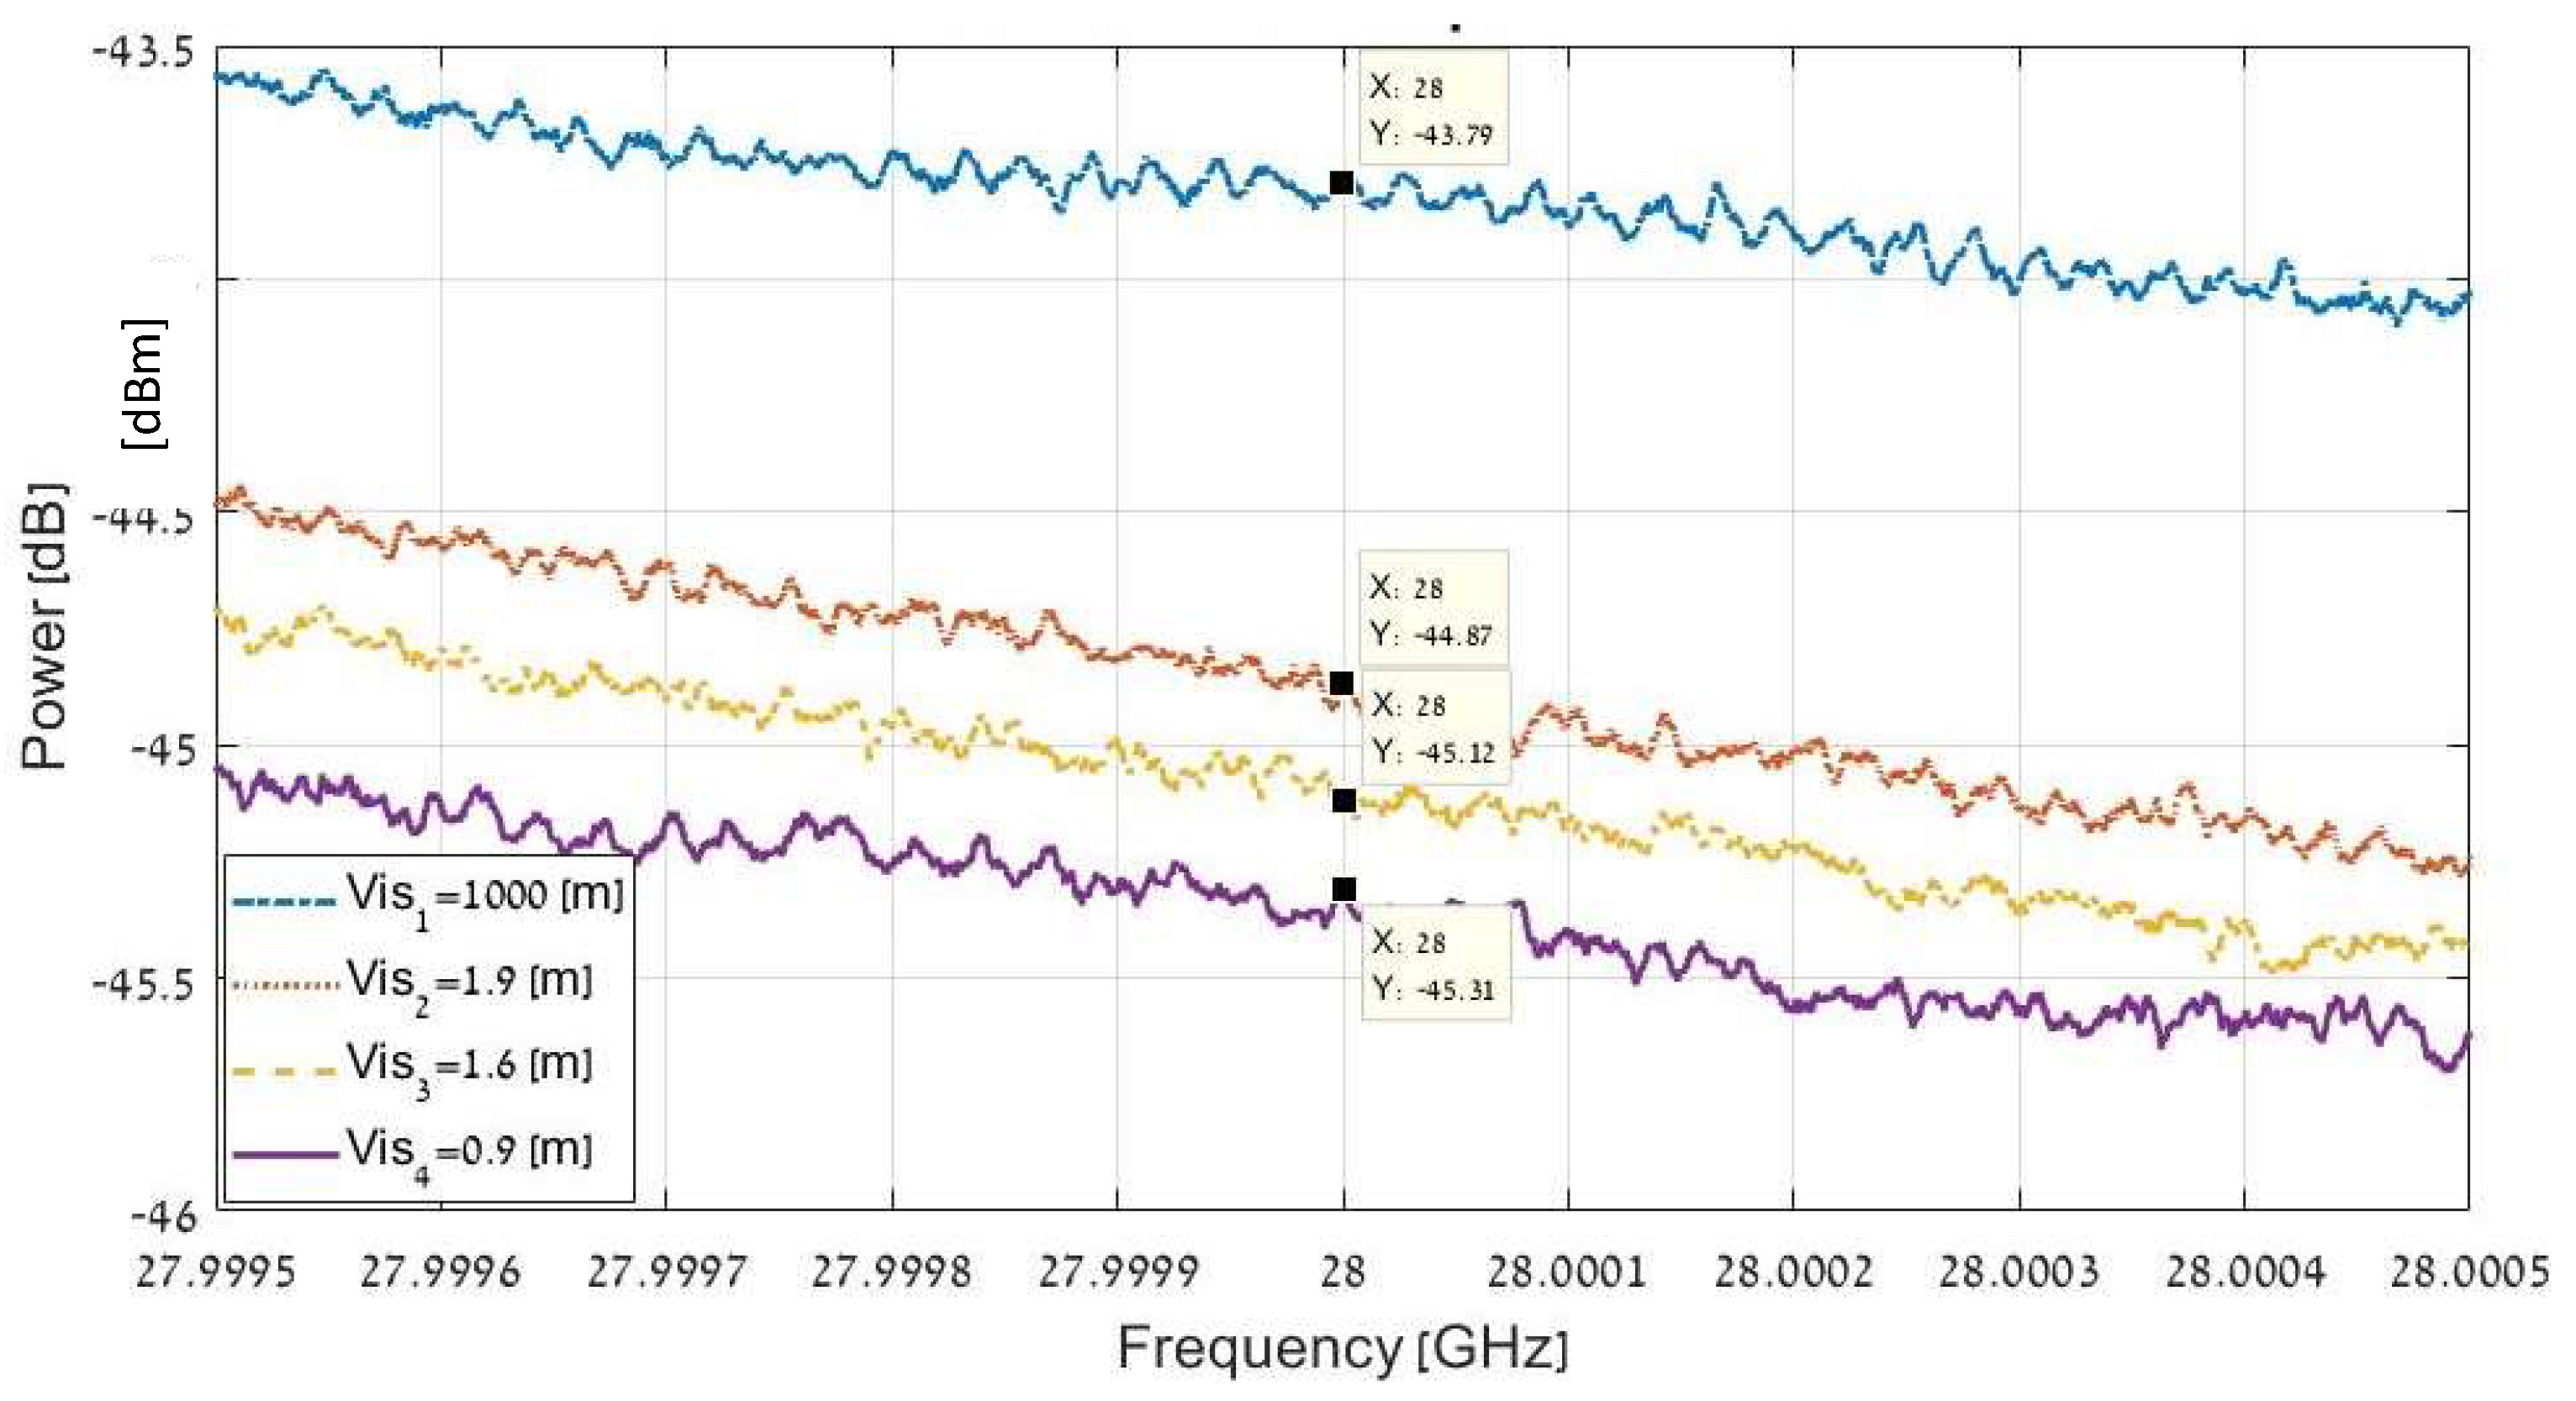
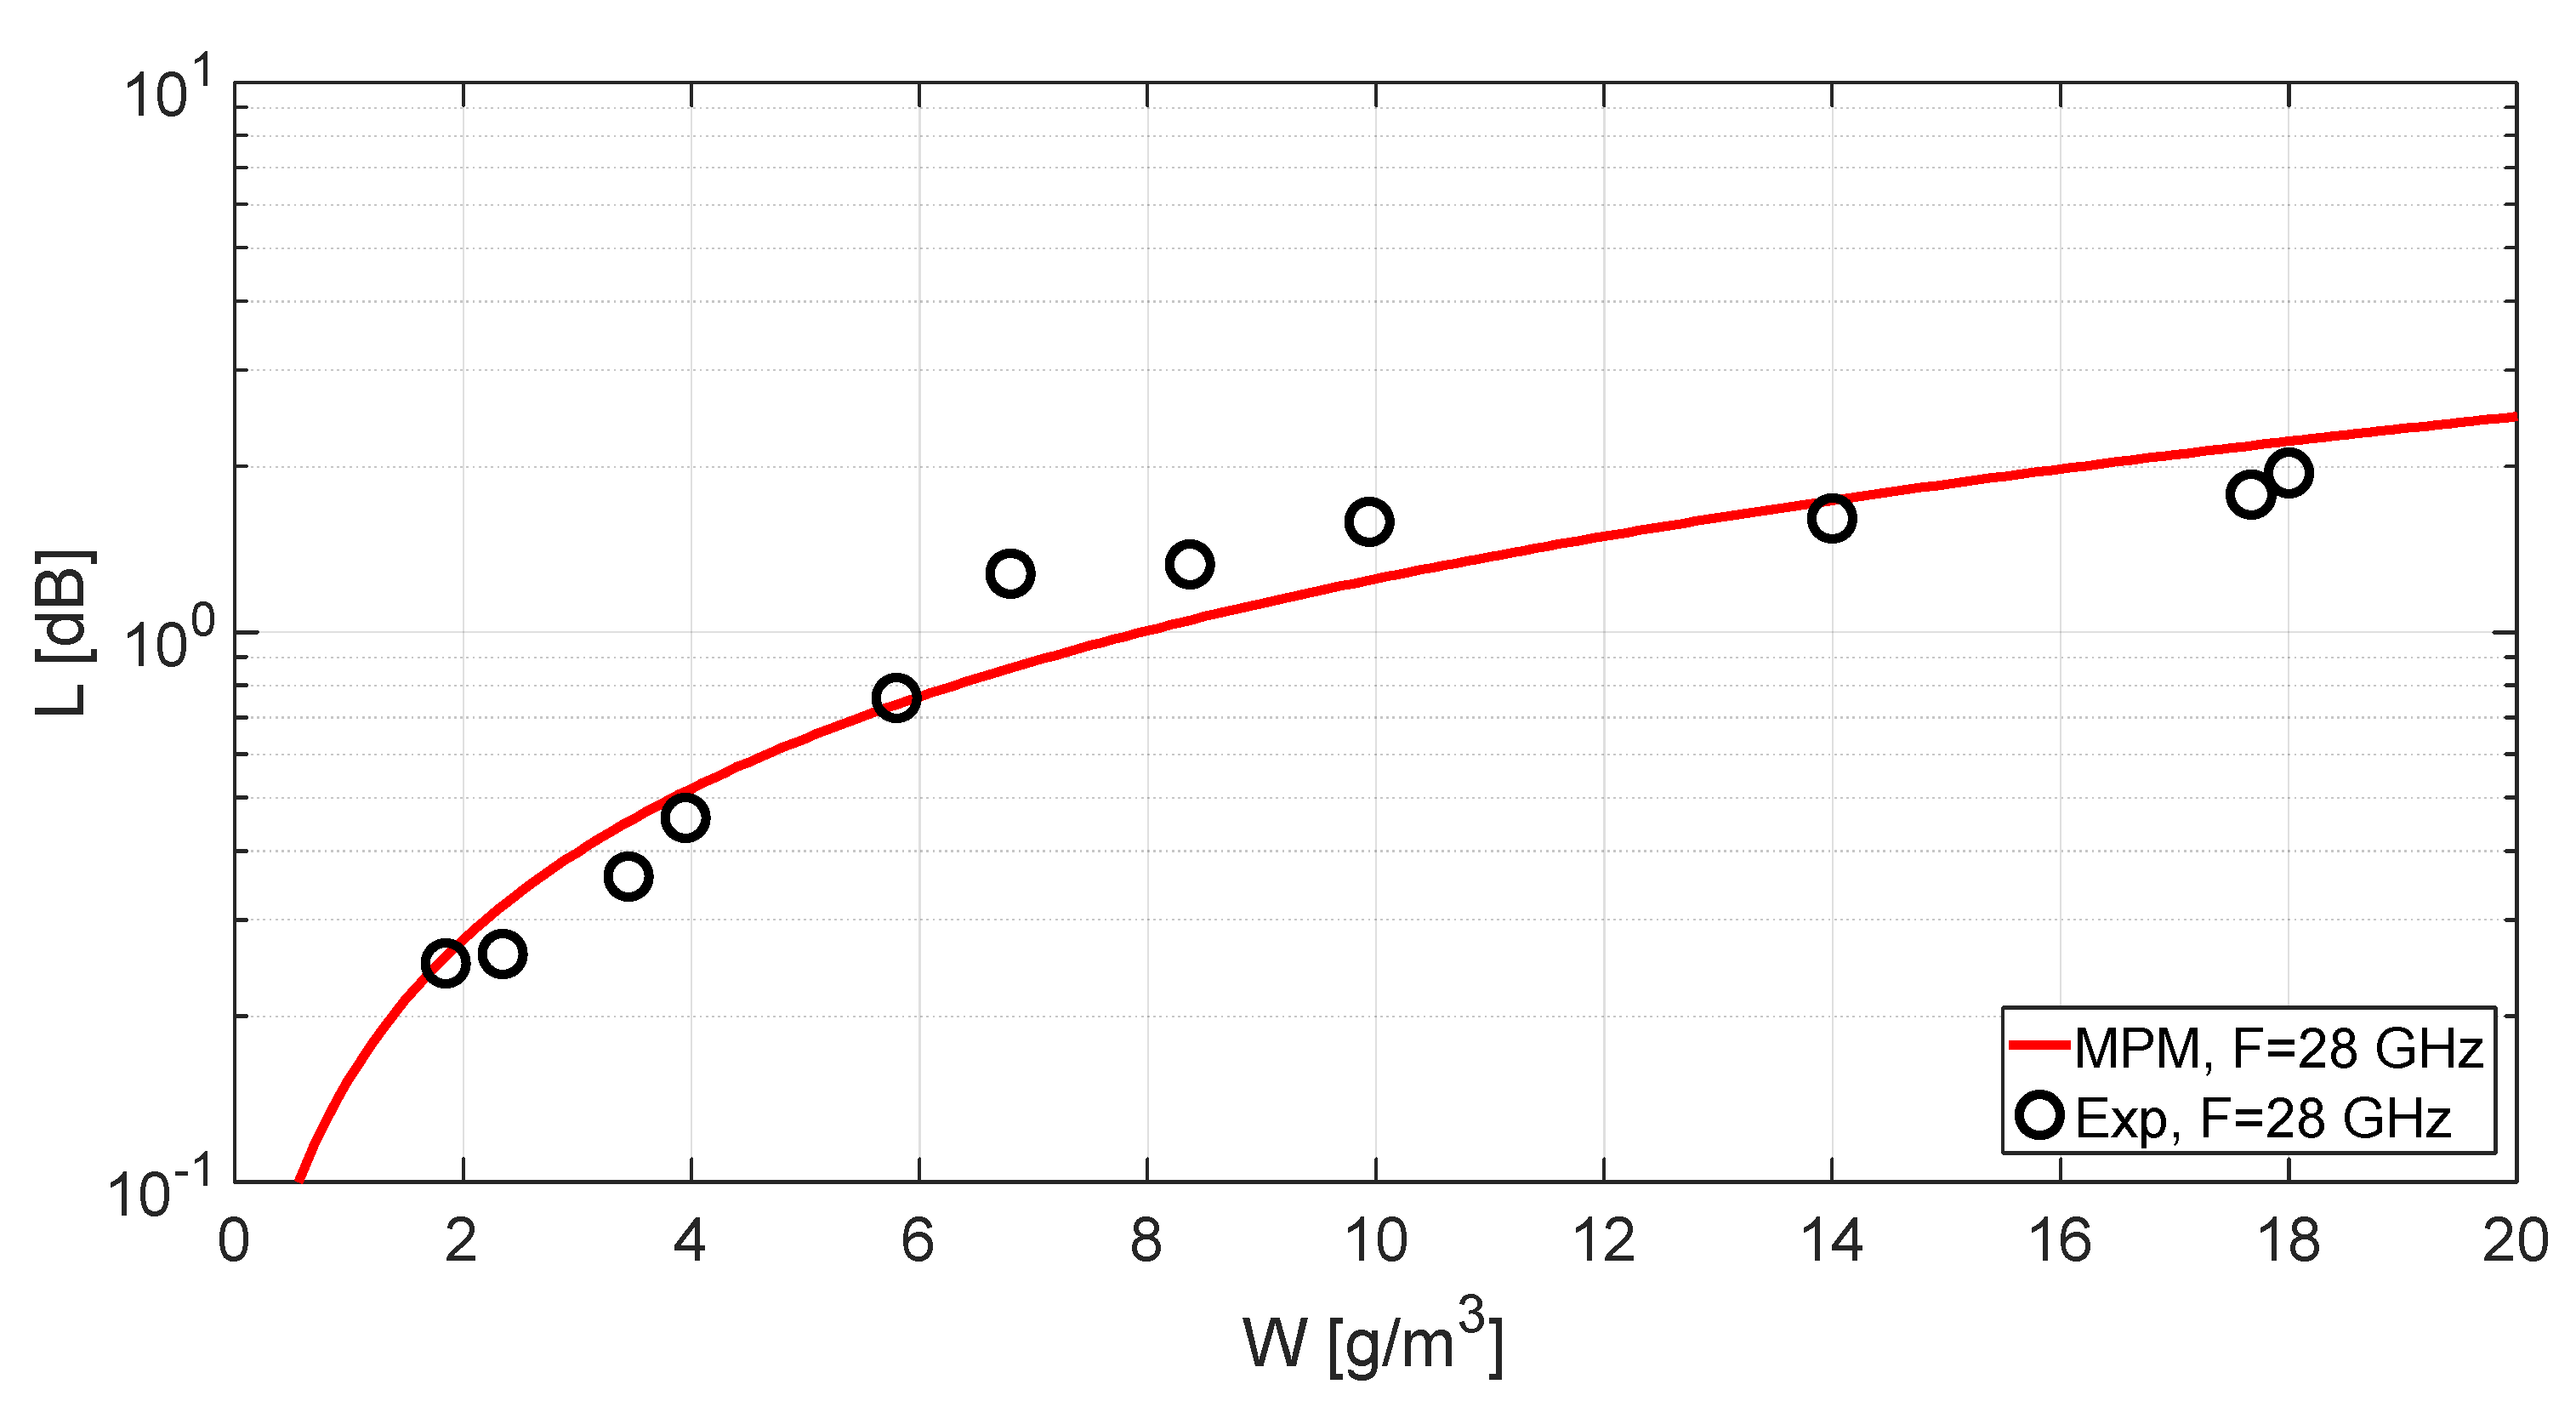
Table 3. Summary of experimentally measured phase shift and resulted refractivity indexes and incremental group delays for different fog visibilities.
Visibility[m]
Measured
W[g/m3]
Calculated
ϕ [ deg ]
Measured
Δ ϕ [ deg ]
Measured
Δ ϕ [ deg /m ]
Measured
N 0 + N [ p p m ]
Calculated
Δ τ d [ ps ]
Calculated
10000.02162.70000
8.51.85115.447.31.339.06982.44
6.82.35111.251.51.442.5392.66
4.63.45104.558.21.648.07323.01
3.93.9510062.71.751.79023.24
2.75.889.972.8260.13283.76
2.36.885.577.22.163.76723.99
1.98.3783.279.52.265.6674.11
1.69.9475.986.82.471.69684.49
1.11466.696.12.779.37864.97
0.9117.6769.7932.676.8184.81
0.91858.9103.82.985.73885.37

