Abstract
Lung cancer occurs in the lungs, trachea, or bronchi. This cancer is often caused by malignant nodules. These cancer cells spread uncontrollably to other organs of the body and pose a threat to life. An accurate assessment of disease severity is critical to determining the optimal treatment approach. In this study, a Taguchi-based convolutional neural network (CNN) was proposed for classifying nodules into malignant or benign. For setting parameters in a CNN, most users adopt trial and error to determine structural parameters. This study used the Taguchi method for selecting preliminary factors. The orthogonal table design is used in the Taguchi method. The final optimal parameter combination was determined, as were the most significant parameters. To verify the proposed method, the lung image database consortium data set from the National Cancer Institute was used for analysis. The database contains a total of 16,471 images, including 11,139 malignant nodule images. The experimental results demonstrated that the proposed method with the optimal parameter combination obtained an accuracy of 99.6%.
1. Introduction
Lung cancer is the commonest form of cancer with the highest death rate both in developed and developing countries. In Taiwan, it has ranked first in terms of cancer mortality for more than five years. Female lung cancer is the number one cause of cancer-related death among women in Taiwan. Lung cancer is the leading cause of death in the United States and East Asia [1,2]. The smoking behaviors and environmental factors that cause lung cancer have been extensively studied [3]. Lung cancer is asymptomatic in the initial stage; therefore, approximately 70% to 75% of most newly diagnosed lung cancers are terminal. Traditionally, chest x-rays, computed tomography (CT), and magnetic resonance imaging have been used to physically analyze tissues to diagnose lung cancer [4,5]. Systemic therapy for these patients includes chemotherapy or targeted therapy. Early detection of lung cancer is critical in reducing misdiagnosis by physicians. Because of rapid advancements in computer software, the application of computer aided detection (CAD) software has become common. CAD assists imaging specialists to determine, identify, and evaluate lung lesions and nodules in digital CT images. In particular, the discovery of small nodules between 5 and 15 mm in diameter allows the early detection and treatment of lung diseases.
The current wave of artificial intelligence technology has achieved several breakthroughs, such as recognition, generation, and analysis of images [6,7,8], and speech [9], in the natural user interfaces. Machines have features that enable humans to interact with users. Modern devices not only have more affinity, but also a more reasonable and intelligent judgment and response to the surrounding environment. Such products have large development potential, including driverless cars, drones, smart homes, manufacturing robots, and chat robots. Convolutional neural networks (CNN) are a major development in deep learning. CNNs are capable of classifying images and are widely applied in object detection tasks [10,11,12]. Furthermore, they have been continuously developed and improved. The handwritten font recognition model LeNet-5 [13] was developed in 1994 and is one of the earliest CNNs. LeCun et al. compared the multilayer back propagation network and CNN. The excellent design of LeNet5 helps extract features using operations such as convolution, parameter sharing, and pooling, thus reducing computational costs. Finally, the fully connected neural network is used for classification and recognition. This network is the basis for several neural network architectures. Developed in 2012, AlexNet [14] won the Imagenet competition. ReLU, instead of traditional activation functions, is used in AlexNet. However, the GPU memory limits the network size, Therefore, AlexNet was extended on two GPUs, which were trained in parallel. However, none of the aforementioned architectures has a rapid method of determining optimal parameters. Therefore, in this study, we used the Taguchi method to determine optimal parameters.
Experiments should be conducted to obtain sufficient relevant data to determine the mechanism of the observed phenomena. Most researchers use the trial and error approach to determine optimal parameters. Trial and error is a type of learning in which various responses in a situation are attempted, seemingly at random, until one response achieves the relevant goal. Through successive trials, the successful response is strengthened and occurs earlier. However, this method is time consuming. Therefore, an efficient method should be used to obtain experimental data. Taguchi [15,16] developed a method based on the orthogonal array (OA) experiment, which considerably reduces variance for the experiment by optimal setting control parameters. Therefore, a combination of experimental design and control parameter optimization is used in the Taguchi method to obtain the best results. An OA provides a well-balanced set of experiments. The Taguchi signal-to-noise ratio (S/N) is a logarithmic function of the desired output. It is an optimized objective function, which is helpful for data analysis and the prediction of the optimal results. The Taguchi method is a scientifically standardized mechanism for evaluating and implementing improvements in products, processes, materials, equipment, and facilities. These improvements are designed to optimize the program to produce the best results and simultaneously reducing the number of defects. In recent years, several researchers [17,18] have used the evolutionary computation methods to optimize parameters of CNN. Esteban et al. [17] used evolutionary techniques at unprecedented scales to discover models and DNA-based coding schemes for CIFAR-10 and CIFAR-100 datasets. Ma et al. [18] proposed an autonomous and continuous learning (ACL) algorithm that can automatically generate a deep convolutional neural network (DCNN) architecture for each given visual task. They divided the DCNN into multiple stacked meta-convolutional blocks and fully connected blocks, each of which may contain convolution, pooling, full connection, batch normalization, activation and exit operations to convert the architecture to integer code. According to the above-mentioned methods, these methods can obtain good accuracy. However, they take more time to determine the architecture parameters [17,18]. We used the CNN-based Taguchi method to classify lung nodules in CT images. Our objective was to improve the CNN accuracy and decrease the experimental time.
2. CNN-Based Taguchi Method
This section details how a Taguchi-based CNN is used for detecting gender from an image data set. The flow chart of the proposed method is presented in Figure 1.
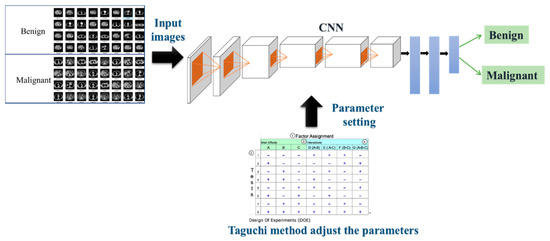
Figure 1.
Flow chart of the proposed method.
2.1. CNNs
CNNs consists of one or more convolutional and fully connected layers, and pooling layers. Compared with other deep learning structures, CNNs can provide better results in image and speech recognition. This model can also be trained using back-propagation algorithms. AlexNet was used in this study [14].
The AlexNet network structure has eight layers. The first five layers are convolutional layers (C), the next three layers are fully connected (FC) layers, and the output of the last fully connected layer is passed to a 1000-channel softmax layer, which corresponds to the distribution of 1000 class labels. Lung nodules are classified using two labels, namely benign and malignant. Therefore, we changed the last FC layer to a two-channel softmax layer, which corresponded to the distribution of the two-class label. Table 1 lists the parameters of show the AlexNet architecture.

Table 1.
Parameters of the AlexNet architecture.
2.2. Taguchi Method
Statistical methods are used in quality engineering to improve product quality and reduce costs. These methods are also used in biology, marketing, and advertising. Professional statisticians concur with the goals and advancements of quality engineering. The most substantial advantage of the Taguchi method is that useful information can be obtained with fewer experiments. Although it is not as favorable as the full factor method for determining the exact optimization position, it requires fewer trends to determine the optimization trend. The feasibility is considerably greater than the full factor method. The Taguchi method has the following characteristics: (1) quality characteristics based on the quality loss function, (2) definition and selection of experimental factors, (3) S/N ratio, and (4) the Taguchi OA.
In the full factor method, when the control factor and number of levels increase, the number of experiments increases exponentially. Therefore, partial factorial design increases the complexity of the experimental method. If an OA is used, fewer experiments are required to obtain a reliable factor effect. The use of OA to conduct experiments is key to Taguchi quality engineering. Before the OA is constructed, the number of factors that affect the quality characteristics, the level of each factor, and the difficulties that may occur in the experiment should be determined. Then, an appropriate OA should be selected, and the factors should be preconfigured before experiments are conducted. An appropriate OA is configured for the selected control factor for experiments. Finally, the S/N ratio is calculated based on the experimental observations obtained by the experiment, and the best factor is analyzed using the S/N ratio.
The analysis of experimental data is based on the S/N ratio created by Dr. Taguchi. The quality characteristics can be divided into the larger the better (LTB), smaller the better, and nominal the best. This paper presents a static parameter design. A larger quality characteristic and higher experimental is preferred. We used the following LTB formula:
where T is the number of experiments, and is the experimental result.
3. Experimental Results
3.1. Dataset
The lung image database consortium image collection includes diagnostic and lung cancer screening chest CT scans with annotated lesions. Eight medical imaging companies and seven academic centers collaborated to create this data set which contains 245,931 images (CT scans and X-ray images). For each participant, images from CT scans were obtained with an associated XML file that recorded the results of a two-phase image annotation process performed by four experienced chest radiologists. In the initial blinded-read phase, each radiologist independently reviewed each CT scan and marked lesions belonging to one of three categories “nodules ≥ 3 mm in diameter,” “nodules < 3 mm in diameter,” and “non-nodules ≥ 3 mm in diameter” (see Figure 2).
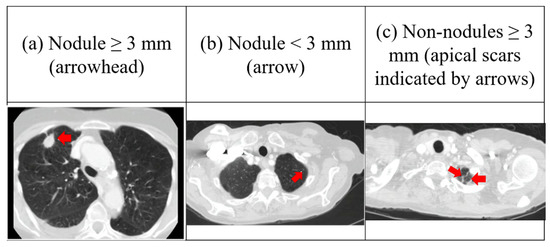
Figure 2.
Lung nodules.
In this data set nodules are classified as either benign or malignant. We classified 16,471 images as benign and 11,139 images as malignant. Figure 3 shows the malignant and benign lung nodules of computed tomography (CT).
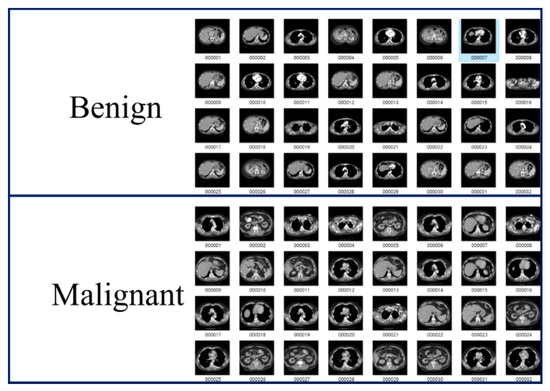
Figure 3.
The malignant and benign lung nodules of computed tomography (CT).
3.2. Taguchi Based CNNs
3.2.1. Defining Control Levels and Factors
First, we defined the three levels and six factors. Factors included kernel size, stride, and padding for first and fifth convolutional layers. Table 2 presents the control levels and factors.
Table 2.
Control levels and factors.
3.2.2. OA
Experiments were performed according to the OA. Here, there were five with three levels and one with two levels. The degree of freedom was 15. We selected the L18 OA. Table 3 presents the L18 OA. The factors C1 Kernel Size, C1 Stride, C1 Padding, C5 Kernel Size, C5 Stride and C5 Padding are shown in Table 3. The initially selected factors and levels required experiments, while only 18 experiments were required after using the Taguchi experiment.
Table 3.
L18 orthogonal array (OA).
Table 4 presents the test accuracy and S/N ratio. Finally, we analyzed the best levels and rank significance factors. Table 5 presents the best level prediction.
Table 4.
Accuracy of the test and signal-to-noise (S/N) ratio.
Table 5.
Best level prediction.
3.2.3. Confirmation Experiment
The best factors that were determined in this experiment were as follows: C1 Kernel Size = 9, C1 Stride = 4, C1 Padding = 2, C5 Kernel Size = 5, C5 Stride = 1, C5 Padding = 2. These best factors were used to perform two confirmation experiments.
To verify that these best factors were the optimal combination, each experiment was performed five times, as depicted in Table 6 and Table 7. Table 6 presents the experimental results of the original AlexNet parameters, and Table 7 presents the experimental results of the best combination. The accuracy of the best combination improved by 2.764%. Experimental results verified the accuracy of the original AlexNet was 96.836%. After using the Taguchi method to determine the architecture parameters of AlexNet, the accuracy was increased to 99.6%. It can be proved that the parameter optimization of Taguchi method improves the accuracy of AlexNet for classifying nodules into malignant or benign. The proposed method assists radiologists in diagnosing lung nodules more accurately and is an excellent CAD.
Table 6.
Experimental results of the original AlexNet parameters.
Table 7.
Experimental results of the best combination.
3.3. Comparison Results of Training Times
In this study, 5 parameters with 3 levels and 1 parameter with 2 levels in AlexNet were chosen, the training times using the Taguchi-based CNN and the trial and error method were 4.5 h, and 5 days and 1.5 h, respectively. Table 8 presents the comparison results of training times using the Taguchi-based CNN and the trial and error method. Recently, Ma et al. [18] proposed an autonomous and continuous learning (ACL) algorithm to determine a DCNN structure for solving classification problems. The MNIST, Fashion-MNIST, EMNIST-Digits, EMNIST-Letters, CIFAR10 and CIFAR100 datasets were used, the average training time of each generation took about 3, 5, 18, 12, 11, and 11 GPU days. Table 9 shows the training times using the ACL algorithm for various databases. It took more training time than the Taguchi-based CNN method. In addition, an ACL algorithm [18] divided the DCNN into multiple stacked meta-convolutional blocks and fully connected blocks, each of which might contain convolution, pooling, full connection, batch normalization, activation and exit operations to convert the architecture to integer code. According to an ACL algorithm, the parameter optimization of the convolution layers was also used in this study.
Table 8.
The comparison results of training times using various methods.
Table 9.
The training times using the autonomous and continuous learning (ACL) algorithm for various databases.
4. Conclusions
In radiology, it is important to improve the accuracy of lung nodule classification. An excellent CAD can not only assist the radiologist, but also reduce the burden on the radiologist. In this study, we used the Taguchi method to design experiments and improve the classification accuracy of AlexNet. Compared with the trial and error method, the proposed method saves substantial experimental time. The selected five parameters with three levels and one parameter with two levels in AlexNet require 486 experiments using the trial and error method, while only 18 experiments are required using the Taguchi method. The S/N ratio reaction table is used to determine the response of the factor to the system at this level, and then determine the best level. The order of the influence of each factor on the system is C5 Padding, C1 Kernel Size, C5 Stride, C1 Stride, C5 Kernel, and C1 Padding. The accuracy of the best factor using Taguchi-based CNN is improved by 2.764%. The training times using the Taguchi-based CNN and the trial and error method are 4.5 h, and 5 days and 1.5 h, respectively. Experimental results indicate that the proposed method takes less training time than other methods. In future work, the proposed method can also be applied to breast cancer, brain tumors, and liver tumors. In addition, some incremental data methods, such as Generative Adversarial Network (GAN), can be used to increase the amount of training data and improve the accuracy of classification.
Author Contributions
Conceptualization, C.-J.L.; methodology, C.-J.L. and Y.-C.L.; software, C.-J.L. and Y.-C.L.; data curation, C.-H.L.; writing—original draft preparation, C.-J.L. and Y.-C.L.; funding acquisition, C.-J.L. All authors have read and agreed to the published version of the manuscript.
Funding
This research was funded by the Ministry of Science and Technology of the Republic of China, grant number MOST 108-2221-E-167-026.
Acknowledgments
The authors would like to thank the Ministry of Science and Technology of the Republic of China, Taiwan for financially supporting this research under Contract No. MOST 108-2221-E-167-026.
Conflicts of Interest
The authors declare no conflict of interest.
References
- Rebecca, L.; Siegel, K.D.; Miller, A.J. Cancer statistics, 2019. CA Cancer J. Clin. 2019, 69, 7–34. [Google Scholar] [CrossRef]
- Worrawat, E.; Jonathan, C. An overview of cancer trends in Asia. Neurocomputing 2015, 165. [Google Scholar] [CrossRef]
- Cornfield, J.; Haenszel, W.; Hammond, E.C.; Lilienfeld, A.M.; Shimkin, M.B.; Wynder, E.L. Smoking and lung cancer: Recent evidence and a discussion of some questions. Int. J. Epidemiol. 2009, 38, 1175–1191. [Google Scholar] [CrossRef] [PubMed]
- Mountain, C.F.; Dresler, C.M. Regional Lymph Node Classification for Lung Cancer Staging. CHEST 1997, 111, 1718–1723. [Google Scholar] [CrossRef] [PubMed]
- Mountain, C.F. Revisions in the International System for Staging Lung Cancer. Chest 1997, 111, 1710. [Google Scholar] [CrossRef] [PubMed]
- Kumar, A.; Kim, J.; Lyndon, D.; Fulham, M.; Feng, D. An Ensemble of Fine-Tuned Convolutional Neural Networks for Medical Image Classification. IEEE J. Biomed. Health Inform. 2017, 31–40. [Google Scholar] [CrossRef] [PubMed]
- Igor, Š.; Aleksej, A. Convolutional Neural Network Based Automatic Object Detection on Aerial Images. IEEE Geosci. Remote. Sens. Lett. 2016, 13, 740–744. [Google Scholar] [CrossRef]
- Juan, M.P.; Arturo, A.; José, M.A. Olive-Fruit Variety Classification by Means of Image Processing and Convolutional Neural Networks. IEEE Access 2019, 7, 147629–147641. [Google Scholar] [CrossRef]
- Hou, J.C.; Wang, S.S.; Lai, Y.H.; Tsao, Y.; Chang, H.W.; Wang, H.M. Audio-Visual Speech Enhancement Using Multimodal Deep Convolutional Neural Networks. IEEE Trans. Emerg. Top. Comput. Intell. 2018, 2, 117–128. [Google Scholar] [CrossRef]
- Changxing, D.; Dacheng, T. Trunk-Branch Ensemble Convolutional Neural Networks for Video-Based Face Recognition. IEEE Trans. Pattern Anal. Mach. Intell. 2017, 40, 1002–1014. [Google Scholar] [CrossRef]
- Pejman, R.; Tõnis, U. Convolutional Neural Network Super Resolution for Face Recognition in Surveillance Monitoring; Springer International Publishing: Cham, Switzerlamd, 2016; pp. 175–184. [Google Scholar] [CrossRef]
- Gil, L.; Tal, H. Age and gender classification using convolutional neural networks. In Proceedings of the 2015 IEEE Conference on Computer Vision and Pattern Recognition Workshops (CVPRW), Boston, MA, USA, 7–12 June 2015. [Google Scholar] [CrossRef]
- Lecun, Y.; Bottou, L.; Bengio, Y.; Haffner, P. Gradient-based learning applied to document recognition. IEEE 1998, 88, 2278–2324. [Google Scholar] [CrossRef]
- Krizhevsky, A.; Sutskever, I.; Hinton, G. ImageNet classification with deep convolutional neural networks. Commun. ACM 2017, 60, 6. [Google Scholar] [CrossRef]
- Yang, W.H.; Tarng, Y.S. Design optimization of cutting parameters for turning operations based on the Taguchi method. J. Mater. Process. Technol. 1998, 84, 122–129. [Google Scholar] [CrossRef]
- Ballantyne, K.N.; Oorschot, R.A.; Mitchell, R.J. Reduce optimisation time and effort: Taguchi experimental design methods. Forensic Sci. Int. Genet. Suppl. Ser. 2008, 1, 7–8. [Google Scholar] [CrossRef]
- Real, E.; Moore, S.; Selle, A.; Saxena, S.; Suematsu, Y.L.; Tan, J.; Le, Q.; Kurakin, A. Large-scale evolution of image classifiers. arXiv 2017, arXiv:1703.01041. [Google Scholar]
- Ma, B.; Li, X.; Xia, Y.; Zhang, Y. Autonomous deep learning: A genetic DCNN designer for image classification. Neurocomputing 2020, 379, 152–161. [Google Scholar] [CrossRef]
© 2020 by the authors. Licensee MDPI, Basel, Switzerland. This article is an open access article distributed under the terms and conditions of the Creative Commons Attribution (CC BY) license (http://creativecommons.org/licenses/by/4.0/).