A Segmentation Enhancement Method for the Low-Contrast and Narrow-Banded Substances in CBCT Images


Abstract
1. Introduction
2. Materials and Methodology
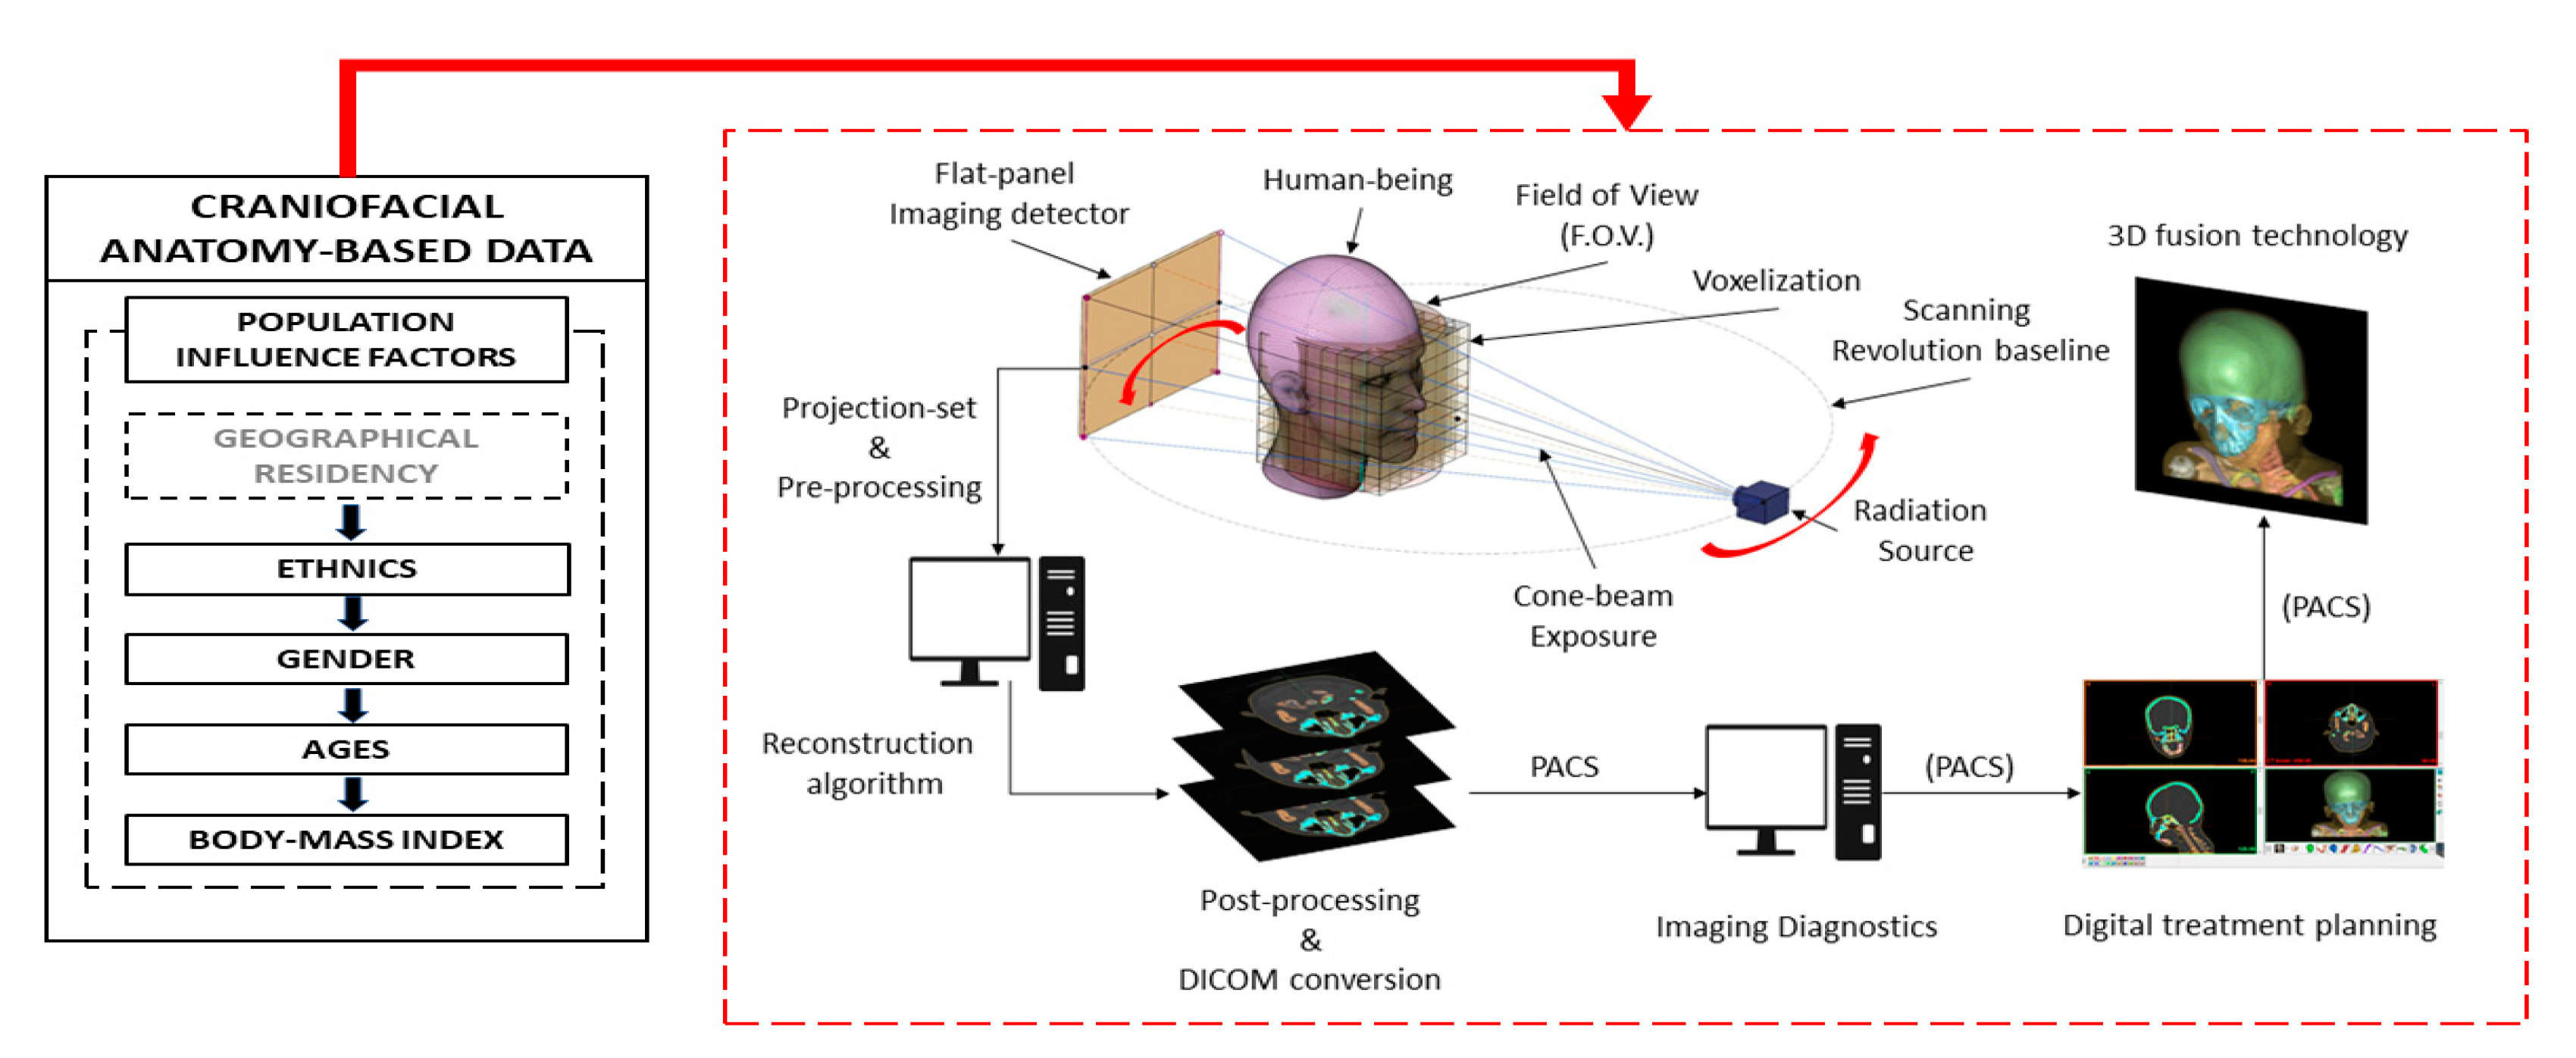
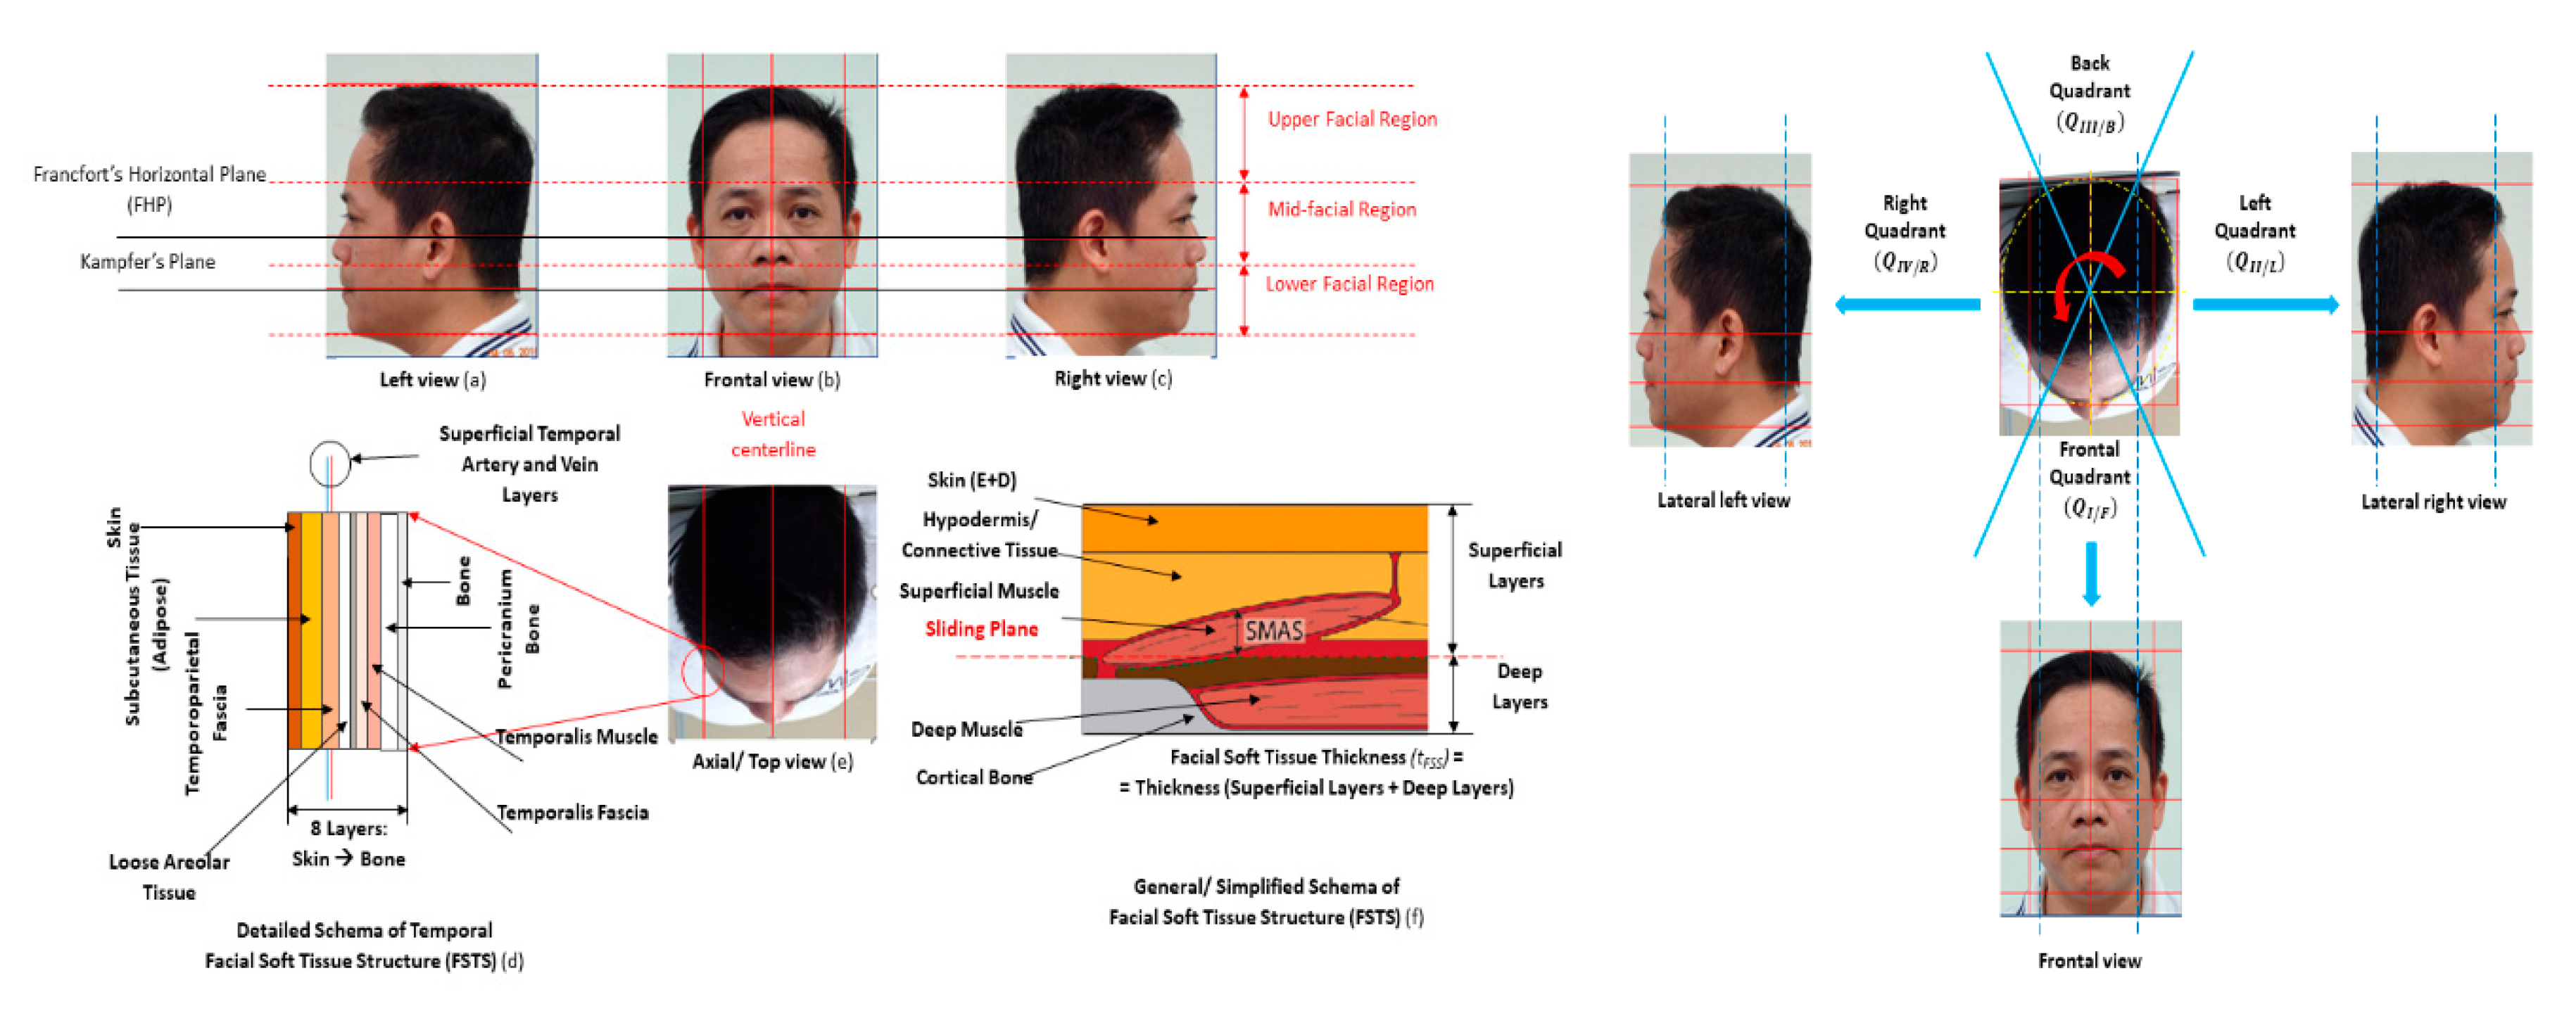
2.1. Materials and Equipment
2.2. The Proposed Anatomic Moderators (PAM)
2.3. Knapsack Problem in PAM-Based Craniofacial Soft Tissue or Skin Segmentation
| Algorithm 1 Subset-sum partitioning to solve the PAM-based MCKP | |
| Input:, , , and initial values of Output: optimal solution for Begin | |
| Let be the profit of the fixed 1-valued variables in each threshold , . The procedure is implemented as follow: | |
| 1: | For every remaining threshold of , , the median of the remained in the set of is computed, as . The subsets and are defined as followed: and And: and , when . |
| 2: | Compute , the median of the set . |
| 3: | For , solve the problem’s . The stop condition is implemented, as if is optimal, as Equation (8). |
| 4: | For every threshold, variables elimination is executed as below:
|
| 5: | If n = 0, that means having no thresholds remained, then: Solve the current linear equation of to find . Else Return to step 1 of this algorithm. |
| End | |
2.4. The Proposed Segmentation Method for FSTS Narrow Low-Contrast Substances of FSTS
| Algorithm 2 Proposed segmentation method | |
| Input: Import the SA2IR reconstruction , regional and quadrant sectioning and Output: cross-junction boundary and the thickness of facial combination skin Begin | |
| 1: | Threshold the FSTS out of the original images. The followed procedure is implemented on the FSTS-thresholded image only. Generate the sagittal and coronal decompositions of each axial slice. |
| 2: | Compute the pixel-wise gray value of the corresponded projections per each facial region’s quadrant |
| 3: | Implement the primary segmentation based on the preset number of concerned threshold values, as Equations (1)–(3). |
| 4: | Calculate PAM, the optimum FSTS thickness equivalence as the known pixel-wise gray-value summation, calculated in step 2. Use subset-sum partitioning to solve the MCKP (Algorithm 1). |
| 5: | Update the FSTS-thresholded image with the optimum . |
| 6: | Segment the final result, by minimizing Equation (11). Compute the PAM-based skin thickness pixel-wise. |
| End | |
2.5. Segmentation Efficiency Assessment Indices
3. Results and Discussion
4. Conclusions
Author Contributions
Funding
Conflicts of Interest
References
- Dao-Ngoc, L. The review of RP (Rapid Prototyping application in maxillofacial surgeries in Vietnam from 2010 to 2016: In the manufacturing engineer’s view. Cập nhật nha khoa—Tài liệu tham khảo và đào tạo liên tục 2017, 22, 121–142. [Google Scholar]
- Dao-Ngoc, L. A review of dental CAD/CAM technology: A story of past and present. Cập nhật nha khoa—Tài liệu tham khảo và đào tạo liên tục 2016, 21, 1–31. [Google Scholar]
- Kim, I.H.; Singer, S.R.; Mupparapu, M. Review of cone-beam computed tomography guidelines in North America. Quintessence Int. 2019, 50, 136–145. [Google Scholar] [PubMed]
- Hayashi, T.; Arai, Y.; Chikui, T.; Hayashi-Sakai, S.; Honda, K.; Indo, H.; Kawai, T.; Kobayashi, K.; Murakami, S.; Nagasawa, M.; et al. Committee on clinical practice guidelines Japanese society for, oral maxillofacial, radiology. Clinical guidelines for dental cone-beam computed tomography. Oral Radiol. 2018, 34, 89–104. [Google Scholar] [CrossRef]
- Bornstein, M.M.; Jorner, K.; Jacobs, R. Use of cone-beam computed tomography in implant dentistry: Current concepts, indications, and limitations for clinical practice and research. Periodontology 2017, 73, 51–72. [Google Scholar] [CrossRef]
- Jacobs, R.; Vranckx, M.; Vanderstuyft, T.; Quirynen, M.; Salmon, B. CBCT vs. other imaging modalities to assess peri-implant bone and diagnose complications: A systematic review. Eur. J. Oral Implant. 2018, 11, 77–92. [Google Scholar]
- Patel, S.; Brown, J.; Pimentel, T.; Kelly, R.D.; Abella, F.; Durack, C. Cone-beam computed tomography in Endodontics—A review of the literature. Int. Endod. J. 2019, 52, 1138–1152. [Google Scholar] [CrossRef]
- Woelber, J.P.; Fleiner, J.; Rau, J.; Ratka-Kruger, P.; Hannig, C. Accuracy and usefulness of CBCT in periodontology: A systematic review of the literature. Int. J. Periodontics Restor. Dent. 2018, 38, 289–297. [Google Scholar] [CrossRef]
- Qin, Z.; Zhang, X.; Li, Y.; Wang, P.; Li, J. One-stage treatment for maxillofacial asymmetry with orthognathic and contouring surgery using virtual surgical planning and 3D-printed surgical templates. J. Plast. Reconstr. Aesthet. Surg. 2019, 72, 97–106. [Google Scholar] [CrossRef]
- Fourie, Z.; Damstra, J.; Gerrits, P.O.; Ren, Y. Evaluation of anthropometric accuracy and reliability using different three-dimensional scanning systems. Forensic Sci. Int. 2011, 207, 127–134. [Google Scholar] [CrossRef]
- Bastir, M.; Rosas, A.; Lieberman, D.E.; O’Higgins, P. Middle cranial fossa anatomy and the origin of modern humans. Anat. Rec. 2008, 291, 130–140. [Google Scholar] [CrossRef] [PubMed]
- Stephan, C.N.; Meikle, B.; Freudenstein, N.; Taylor, R.; Claes, P. Facial soft tissue thicknesses in craniofacial identification: Data collection protocols and associated measurement errors. Forensic Sci. Int. 2019, 304, 109965. [Google Scholar] [CrossRef] [PubMed]
- De Donno, A.; Sablone, S.; Lauretti, C.; Mele, F.; Martini, A.; Introna, F.; Santoro, V. Facial approximation: Soft tissue thickness values for Caucasian males using cone-beam computer tomography. Leg. Med. 2019, 37, 49–53. [Google Scholar] [CrossRef] [PubMed]
- Hwang, H.S.; Park, M.-K.; Lee, W.J.; Cho, J.H.; Kim, B.K.; Wilkinson, C.M. Facial soft tissue thickness database for craniofacial reconstruction in Korean adults. J. Forensic Sci. 2019, 57, 1442–1447. [Google Scholar] [CrossRef]
- Berkhout, W.E.R. The ALARA-principle. Backgrounds and enforcement in dental practices. Ned. Tijdschr. Voor Tandheelkd. 2015, 122, 263–270. [Google Scholar] [CrossRef]
- Bushberg, J.T. Eleventh annual Warren K. Sinclair keynote address-science, radiation protection, and NCRP: Building on the past, looking to the future. Health Phys. 2015, 108, 115–123. [Google Scholar] [CrossRef]
- Ludlow, J.B.; Timothy, R.; Walker, C.; Hunter, R.; Benavides, E.; Samuelson, D.B. Effective dose of dental CBCT—A meta-analysis of published data and additional data for nine CBCT units. Dentomaxillofacial Radiol. 2015, 44. [Google Scholar] [CrossRef]
- McGuigan, M.B.; Duncan, H.F.; Horner, K. An analysis of effective dose optimization and its impact on image quality and diagnostic efficacy relating to dental cone beam computed tomography (CBCT). Swiss Dent. J. 2018, 128, 297–316. [Google Scholar]
- Fernandes, K.; Levin, T.L.; Miller, T.; Schoenfeld, A.H.; Amis, E.S., Jr. Evaluating an image gently and image wisely campaign in a multihospital health care system. J. Am. Coll. Radiol. 2016, 13, 1010–1017. [Google Scholar] [CrossRef]
- White, D.R.; Booz, J.; Griffith, R.V.; Spokas, J.J.; Wilson, I.J. ICRU report 44: Tissue substitutes in radiation dosimetry and measurement. J. Int. Comm. Radiat. Units Meas. 1989, 23, 198. [Google Scholar]
- Zhu, Z.G.; Wahid, K.; Babyn, P.; Cooper, D.; Pratt, I.; Carter, Y. Improved compressed sensing based algorithm for sparse-view CT image reconstruction. Comput. Math. Methods Med. 2013, 2013. [Google Scholar] [CrossRef] [PubMed]
- Zhang, C.; Zhang, T.; Zheng, J.; Li, Y.; You, J.; Guan, Y. A model of regularization parameter determination in low-dose X-ray CT reconstruction based on dictionary learning. Comput. Math. Methods Med. 2015, 2015, 790–831. [Google Scholar] [CrossRef] [PubMed]
- Matenine, D.; Goussard, Y.; Despres, P. GPU-accelerated regularized iterative reconstruction for few-view cone-beam CT. Med. Phys. 2015, 42, 1505–1517. [Google Scholar] [CrossRef] [PubMed]
- Chen, L.Y.; Liang, X.; Shen, C.Y.; Jiang, S.; Wang, J. Synthetic CT generation from CBCT images via deep learning. Med. Phys. 2020, 47, 1115–1125. [Google Scholar] [CrossRef] [PubMed]
- Kang, S.H.; Jeon, K.; Kim, H.J.; Seo, J.K.; Lee, S.H. Automatic three-dimensional cephalometric annotation system using three-dimensional convolutional neural networks: A developmental trial. Comput. Methods Biomech. Biomed. Eng. Imaging Vis. 2020, 8, 210–218. [Google Scholar] [CrossRef]
- Dao-Ngoc, L.; Du, Y.C. Generative noise reduction in dental cone-beam CT by a selective anatomy analytic iteration reconstruction algorithm. Electronics 2019, 8, 1381. [Google Scholar] [CrossRef]
- Stephan, C.N. Accuracies of facial soft tissue depth means for estimating ground-truth skin surfaces in forensic craniofacial identification. Int. J. Legal. Med. 2015, 129, 877–888. [Google Scholar] [CrossRef]
- He, J.; Kim, C.S.; Kuo, C.C.J. Interactive Segmentation Techniques: Algorithms and Performance Evaluation; SpringerBriefs in Signal Processing; Springer: Berlin/Heidelberg, Germany, 2014; ISBN 2096-4084. [Google Scholar]
- Aichert, A.; Manhart, M.T.; Navalpakkam, B.K.; Grimm, R.; Hutter, J.; Maier, A.; Hornegger, J.; Doerfler, A. A realistic digital phantom for perfusion C-arm CT based on MRI data. In Proceedings of the 2013 IEEE Nuclear Science Symposium and Medical Imaging Conference (2013 NSS/MIC), Seoul, Korea, 27 October–2 November 2013. [Google Scholar]
- De Greef, S.; Claes, P.; Vandermeulen, D.; Mollemans, W.; Suetens, P.; Willems, G. Large-scale in-vivo Caucasian facial soft tissue thickness database for craniofacial reconstruction. Forensic Sci. Int. 2006, 159, S126–S146. [Google Scholar] [CrossRef]
- Kellerer, H.; Pferschy, U.; Pisinger, D. Knapsack problems. In Handbook of Combinatorial Optimization; Springer: Berlin/Heidelberg, Germany, 2004; ISBN 3-540-40286-1. [Google Scholar]
- Pisinger, D. Budgeting with bounded multiple-choice constraints. Eur. J. Oper. Res. 2001, 129, 471–480. [Google Scholar] [CrossRef]
- Kuno, T.L.; Konno, H.; Zemel, E. A linear-time algorithm for solving continuous maximin knapsack problems. Oper. Res. Lett. 1991, 10, 23–26. [Google Scholar] [CrossRef]
- McInerney, T.; Terzopoulos, D. Deformable models in medical image analysis: A survey. Med. Image Anal. 1996, 1, 91–108. [Google Scholar] [CrossRef]
- Karasev, P.; Kolesov, I.; Fritscher, K.; Vela, P.; Mitchell, P.; Tannenbaum, A. Interactive medical image segmentation using PDE control of active contours. IEEE Trans. Med. Imaging 2013, 32, 2127–2139. [Google Scholar] [CrossRef] [PubMed]
- Goldenberg, R.; Kimmel, R.; Rivlin, E.; Rudzsky, M. Fast geodesic active contours. IEEE Trans. Image Process. 2001, 10, 1467–1475. [Google Scholar] [CrossRef]
- Casselles, V.; Kimmel, R.; Sapiro, G. Geodesic active contours. Int. J. Comput. Vis. 1997, 22, 61–79. [Google Scholar] [CrossRef]
- Chan, T.F.; Vese, L.A. Active contour without edges. IEEE Trans. Image Process. 2001, 10, 266–277. [Google Scholar] [CrossRef]
- Mumford, D.; Shah, J. Optimal approximations by piecewise smooth functions and associated variational problems. Commun. Pure Appl. Math. 1989, 42, 577–685. [Google Scholar] [CrossRef]
- Ramlau, R.; Ring, W. Regularization of ill-posed Mumford–Shah models with perimeter penalization. Inverse Probl. 2010, 26, 115001. [Google Scholar] [CrossRef]
- Blake, A.; Zisserman, A.; Bobrow, D.G.; Brady, M.; Davis, R.; Winston, P.H. Visual Reconstruction; MIT Press: Cambridge, MA, USA, 1987; ISSN 9780262255769. [Google Scholar]
- Wang, L.; Chang, Y.; Wang, H.; Wang, Z.Z.; Pu, J.T.; Yang, X.D. An active contour model based on local fitted images for image segmentation. Inf. Sci. 2017, 418, 61–73. [Google Scholar] [CrossRef]
- Shyu, K.K.; Pham, V.T.; Tran, T.T.; Lee, P.L. Unsupervised active contour driven by density distance and local fitting energy with applications to medical image segmentation. Mach. Vis. Appl. 2012, 23, 1159–1175. [Google Scholar] [CrossRef]


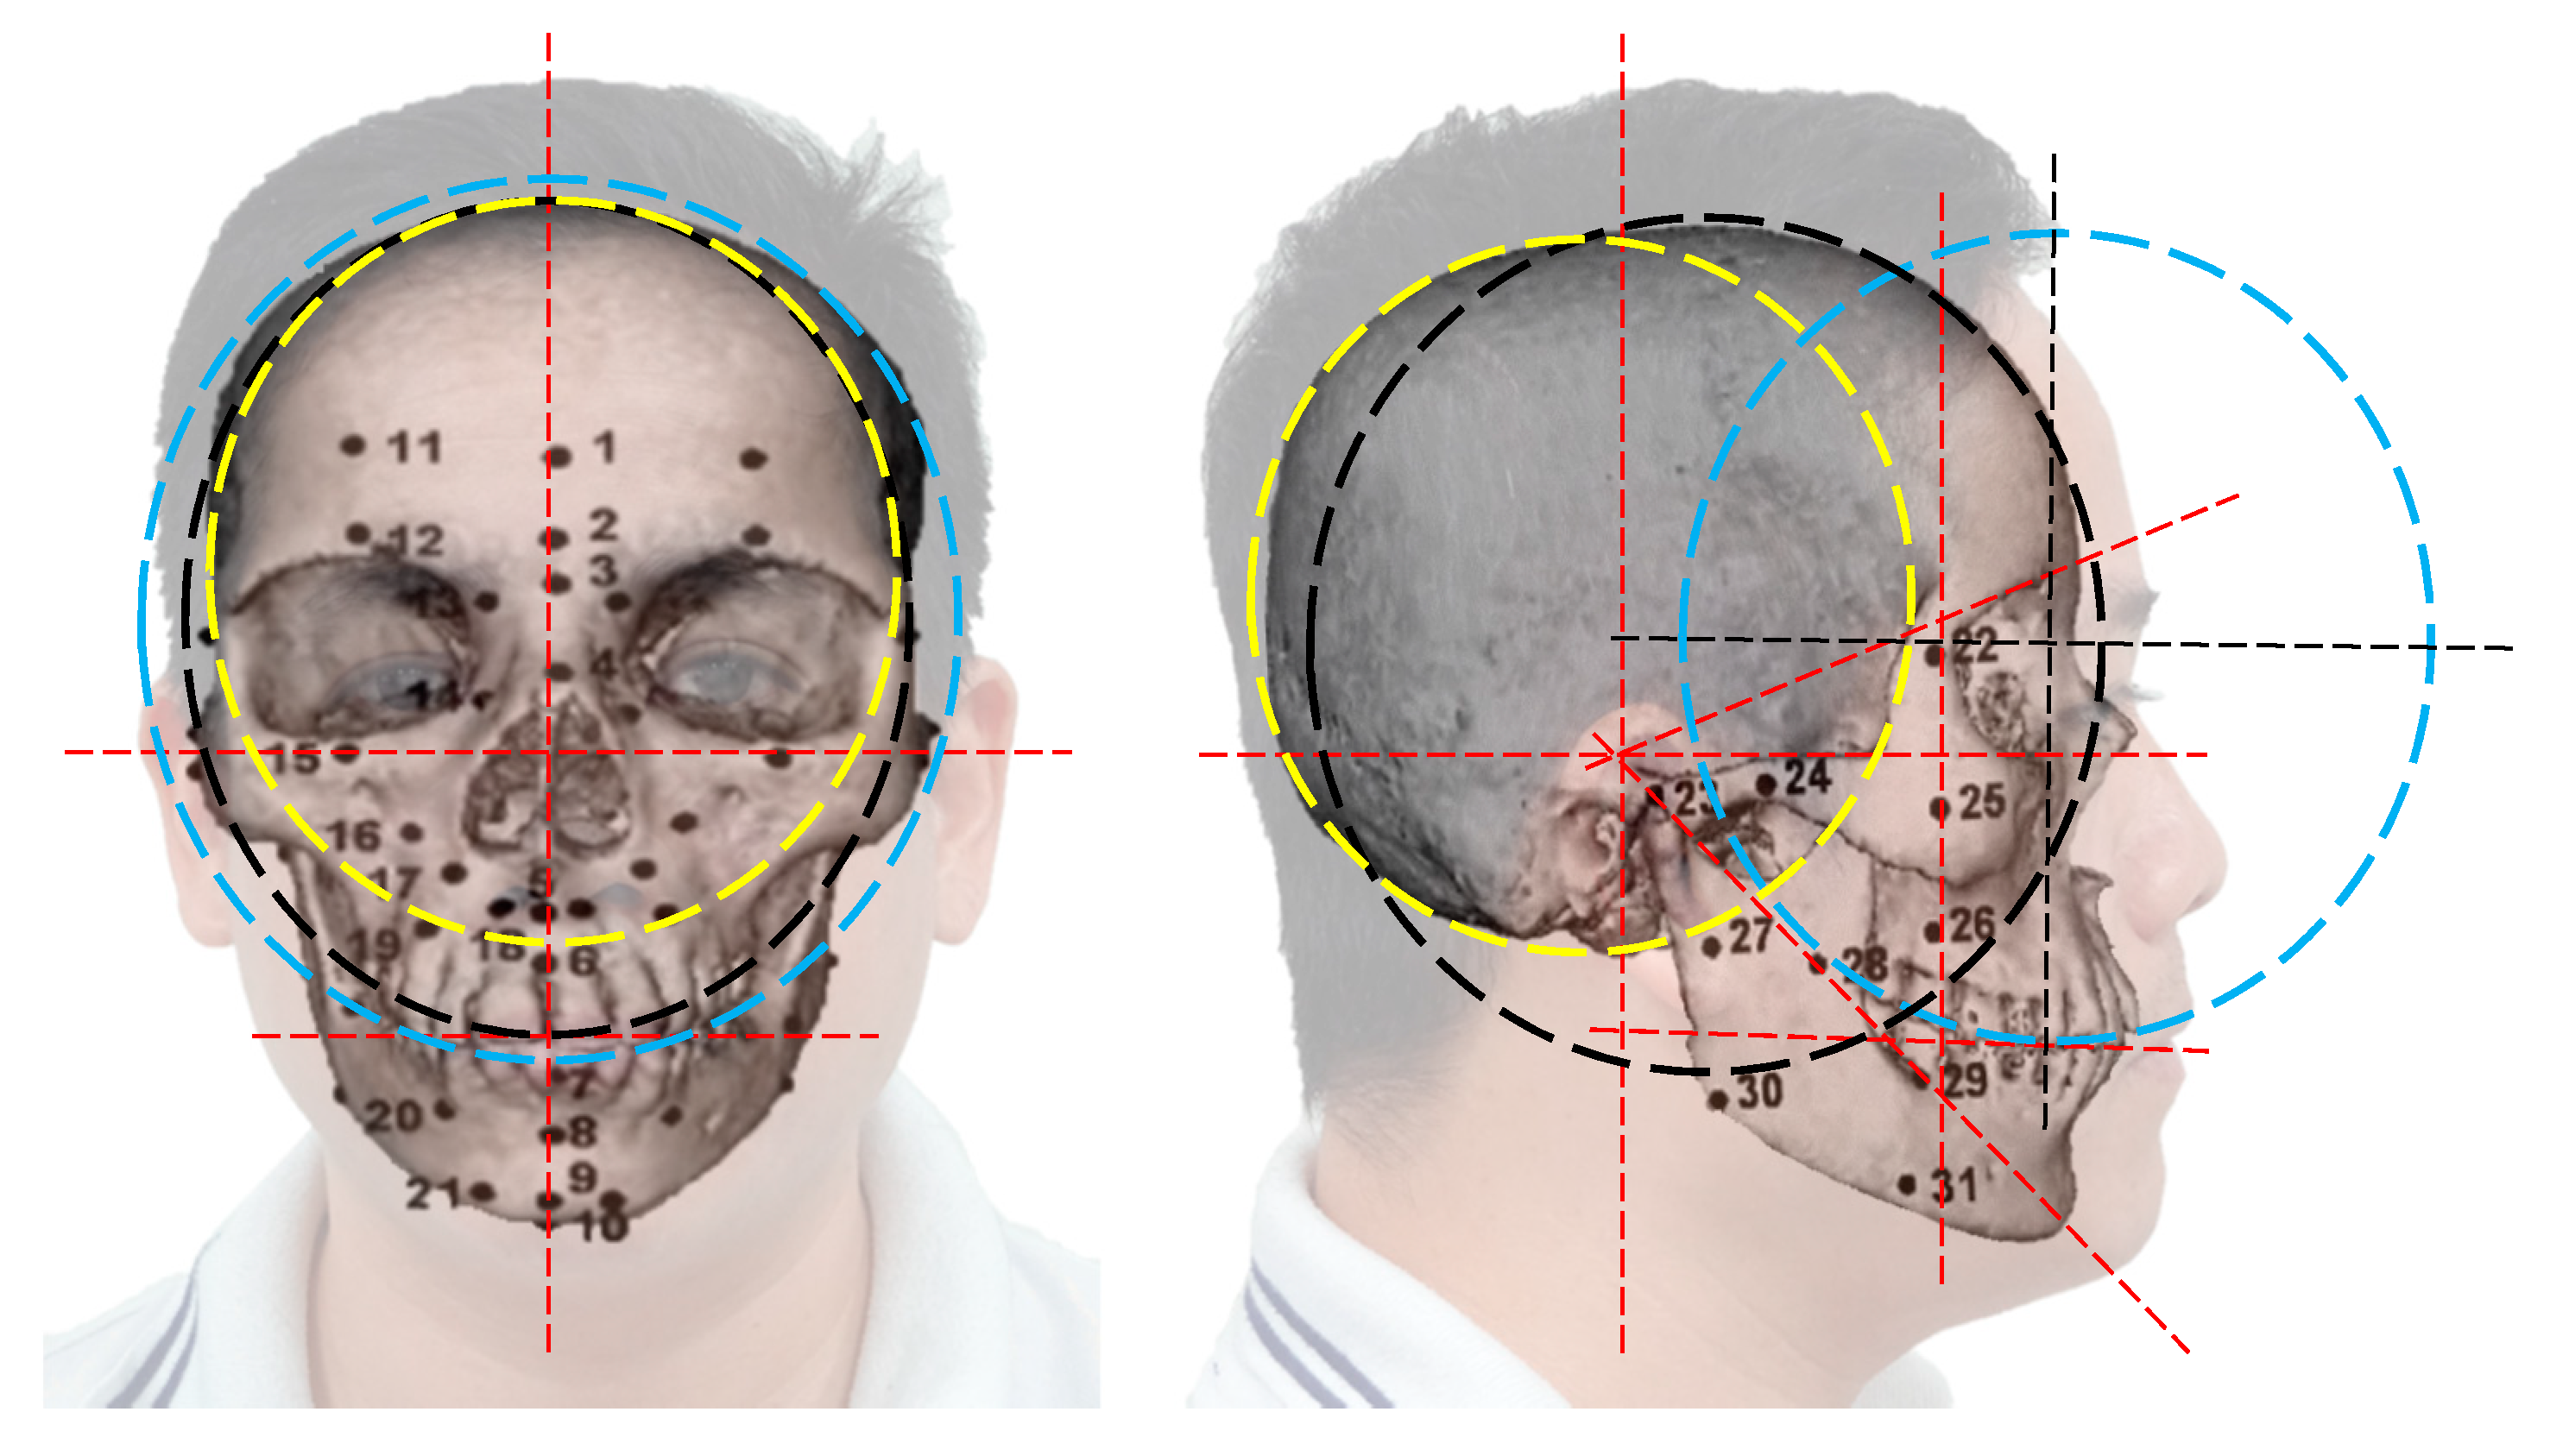
| No. | Landmarks | No. | Landmarks | No. | Landmarks |
|---|---|---|---|---|---|
| 1 | Supra-glabella 1 | 12/33 | Supraorbital 2 | 23/44 | Supra-glenoid 2 |
| 2 | Glabella 2 | 13/34 | Lateral glabella 2 | 24/45 | Zygomatic arch 2 |
| 3 | Nasion 2 | 14/35 | Lateral nasal 2 | 25/46 | Lateral orbit 2 |
| 4 | End of nasion 2 | 15/36 | Sub-orbital 2 | 26/47 | Supra-M2 3 |
| 5 | Mid-philtrum 3 | 16/37 | Inferior malar 2 | 27/48 | Mid masseter 3 |
| 6 | Upper lip 3 | 17/38 | Lateral nostril 3 | 28/49 | Occlusal line 3 |
| 7 | Lower lip 3 | 18/39 | Nasolabial ridge 3 | 29/50 | Sub-M2 3 |
| 8 | Chin–lip fold 3 | 19/40 | Supra-canine 3 | 30/51 | Gonion 3 |
| 9 | Mental eminence 3 | 20/41 | Sub-canine 3 | 31/52 | Mid-mandibula 3 |
| 10 | Beneath chin 3 | 21/42 | Mental tubercle anterior 3 | - | - |
| 11/32 | Frontal eminence 1 | 22/43 | Mid-lateral orbit 2 | - | - |
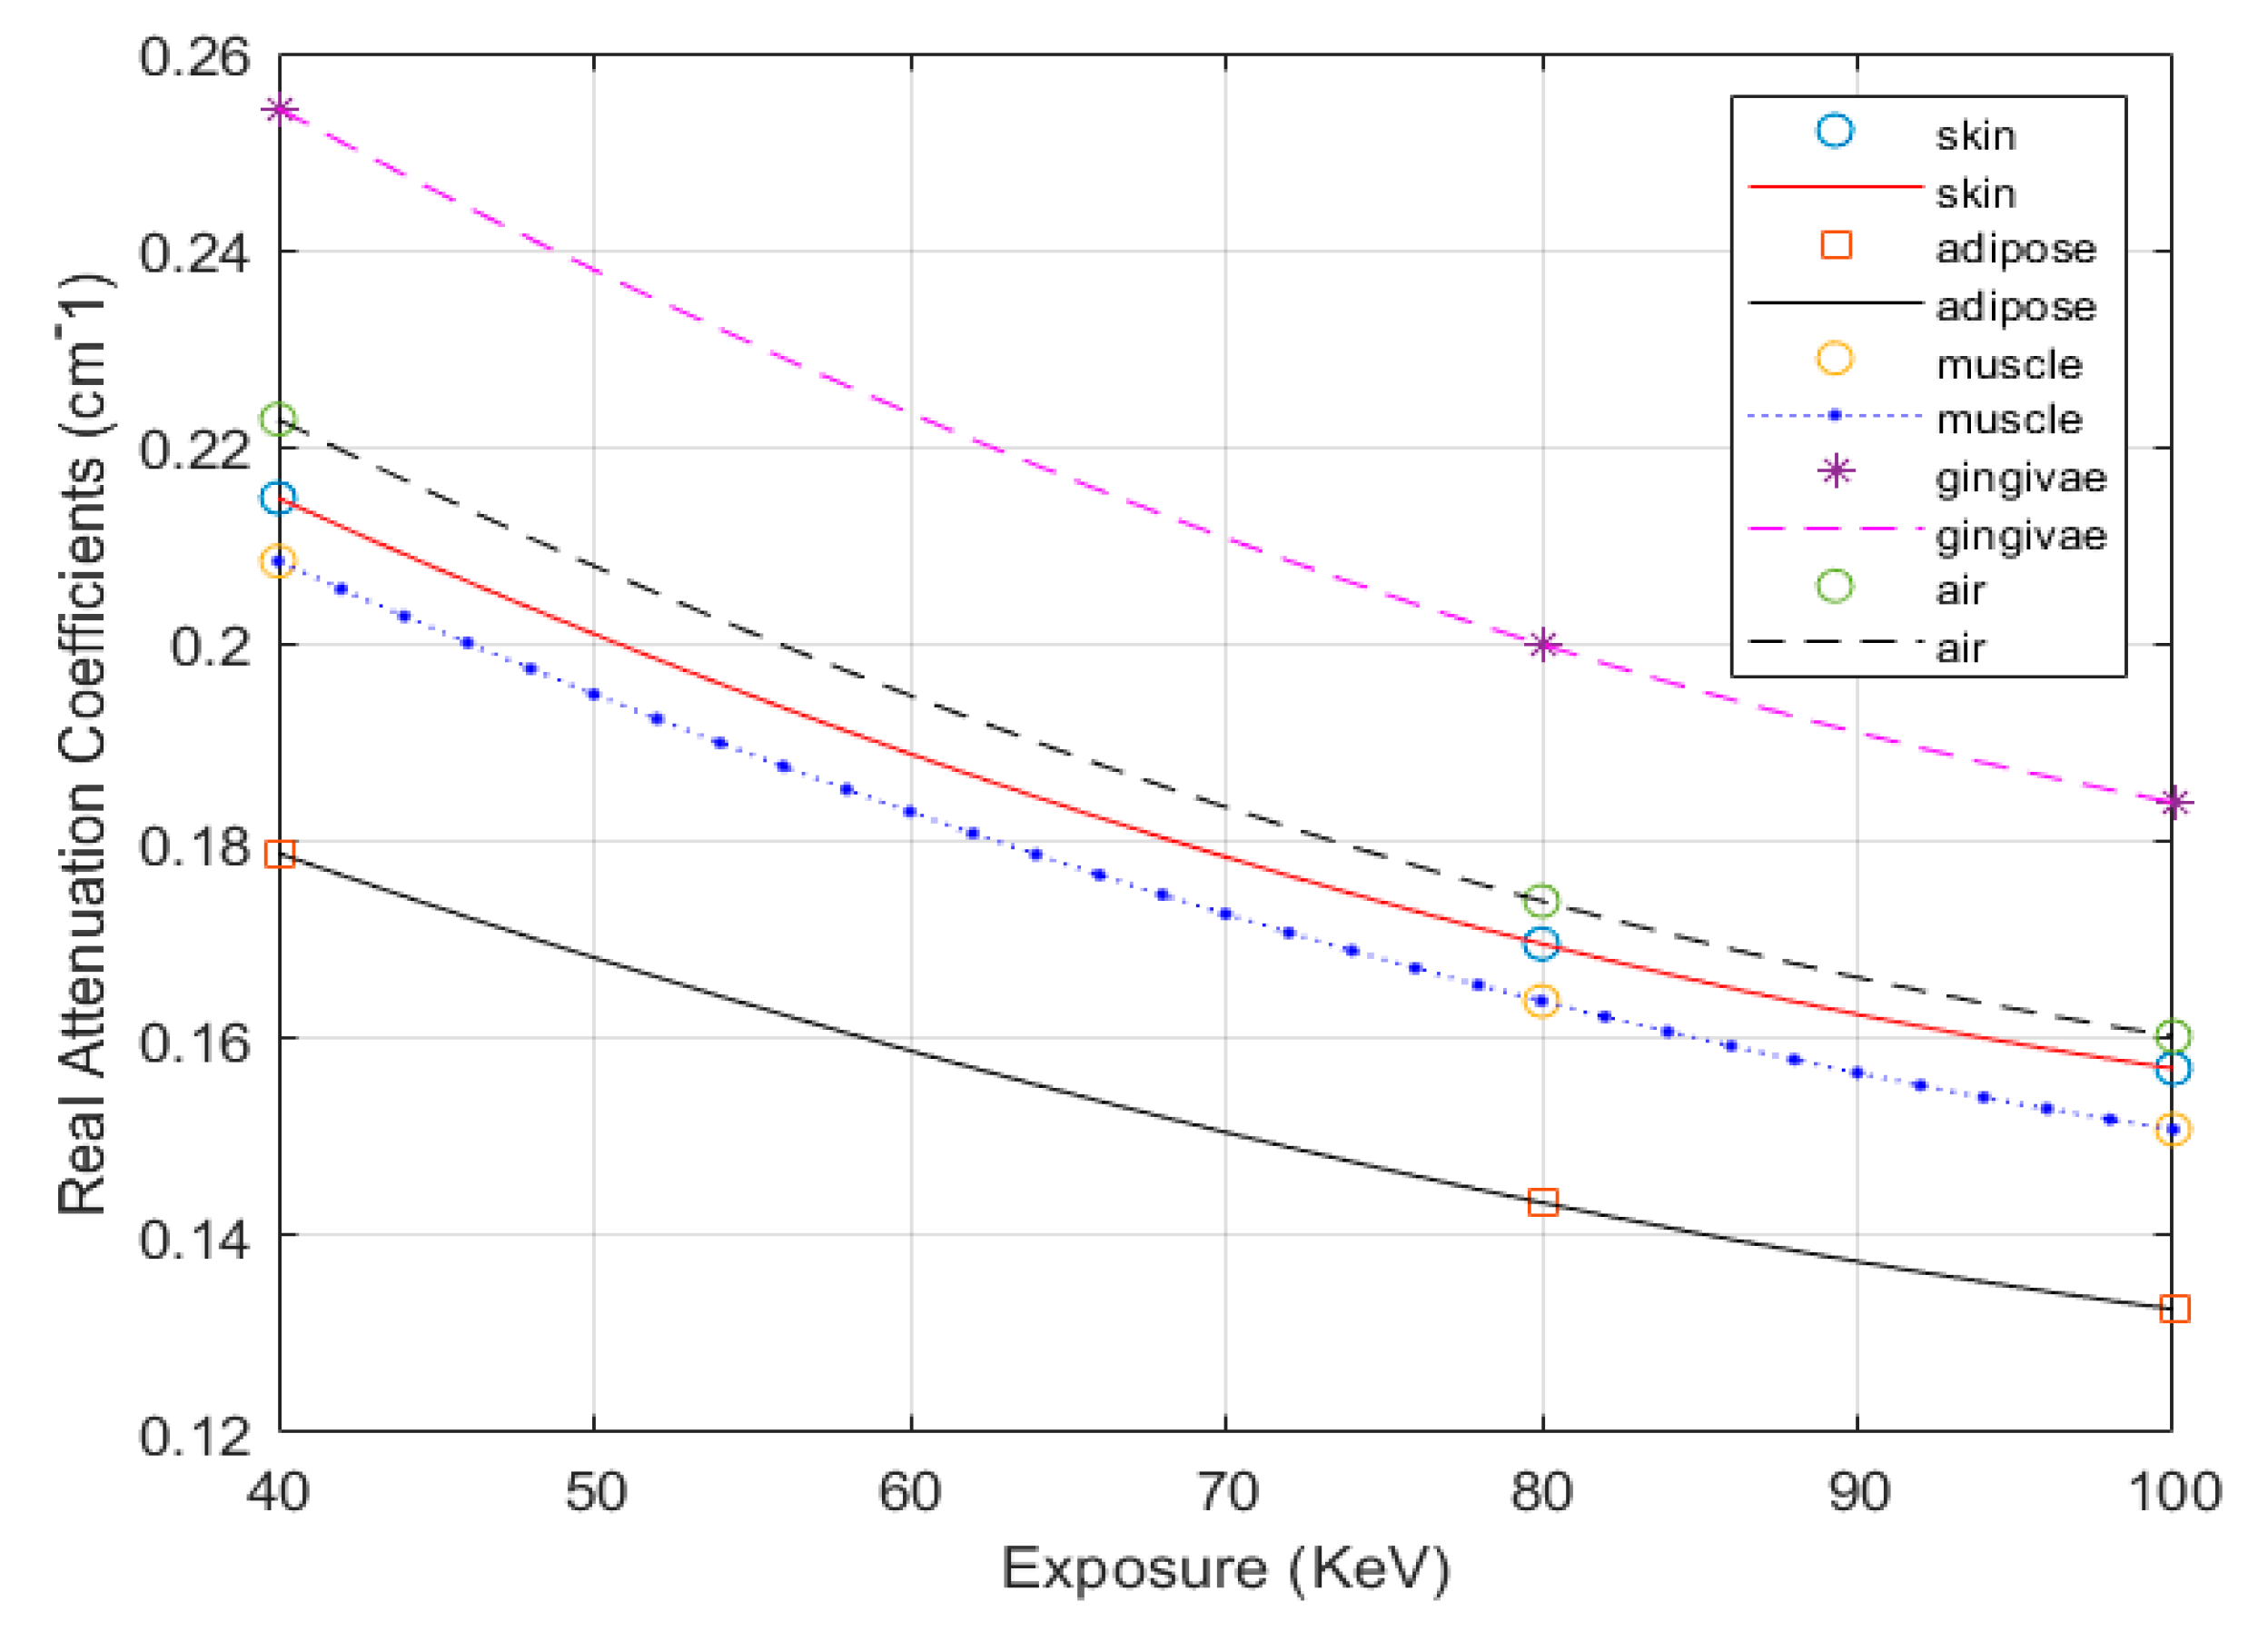
| Tissues | Specific Density ρ (kg/m3) | Mass Attenuation Coefficient µ/ρ (cm2/g) | Mass–Energy Absorption Coefficient µen/ρ (cm2/g) | ||||
|---|---|---|---|---|---|---|---|
| Exposure Mode (keV) | 40 | 80 | 100 | 40 | 80 | 100 | |
| Skin | 1090.00 | 0.2620 | 0.1810 | 0.1690 | 0.0649 | 0.0254 | 0.0250 |
| Adipose | 916.00 | 0.2400 | 0.1800 | 0.1690 | 0.0448 | 0.0235 | 0.0243 |
| Muscle | 1050.00 | 0.2690 | 0.1820 | 0.1690 | 0.0705 | 0.0260 | 0.0254 |
| Gingivae | 1160.00 | 0.2972 | 0.2011 | 0.1867 | 0.0779 | 0.0287 | 0.0281 |
| Air | 1225.00 | 0.2490 | 0.1660 | 0.1540 | 0.0671 | 0.0240 | 0.0232 |
| Caucasians Aged (18–29) | The Proposed PAM-Based FSTS Thickness (in mm) | |||||||||||||
|---|---|---|---|---|---|---|---|---|---|---|---|---|---|---|
| Females | Males | |||||||||||||
| BMI | <20 | (20–25) | >25 | <20 | (20–25) | >25 | ||||||||
| Soft Tissue Thickness | μ | σ | μ | σ | μ | σ | μ | σ | μ | σ | μ | Σ | ||
| FSTS | UFR | QI/QIII | 3.850 | 0.5500 | 4.000 | 0.600 | 4.500 | 0.650 | 3.850 | 0.430 | 4.100 | 0.595 | 4.900 | 0.905 |
| QII/QIV | 3.800 | 0.500 | 3.900 | 0.600 | 4.500 | 0.600 | 3.800 | 0.470 | 4.100 | 0.640 | 5.000 | 0.960 | ||
| MFR | QI/QIII | 6.999 | 1.287 | 7.354 | 1.356 | 8.155 | 1.405 | 6.319 | 1.123 | 6.717 | 1.287 | 7.941 | 1.606 | |
| QII/QIV | 7.700 | 1.750 | 8.250 | 1.850 | 9.500 | 1.900 | 6.950 | 2.080 | 7.743 | 2.032 | 9.550 | 2.460 | ||
| LFR | QI/QIII | 11.35 | 1.894 | 11.502 | 1.945 | 12.246 | 2.156 | 11.465 | 1.918 | 11.834 | 2.063 | 12.816 | 2.080 | |
| QII/QIV | 16.367 | 2.567 | 17.000 | 2.700 | 18.800 | 3.100 | 15.867 | 2.427 | 16.879 | 2.912 | 19.867 | 3.357 | ||
| SFSTS | UFR | QI/QIII | 2.595 | 0.140 | 2.745 | 0.190 | 3.245 | 0.24 | 2.595 | 0.020 | 2.845 | 0.185 | 3.645 | 0.495 |
| QII/QIV | 2.545 | 0.090 | 2.645 | 0.190 | 3.245 | 0.19 | 2.545 | 0.060 | 2.845 | 0.230 | 3.745 | 0.550 | ||
| MFR | QI/QIII | 5.744 | 0.877 | 6.099 | 0.946 | 6.900 | 0.995 | 5.064 | 0.713 | 5.462 | 0.877 | 6.686 | 1.196 | |
| QII/QIV | 6.445 | 1.340 | 6.995 | 1.440 | 8.245 | 1.49 | 5.695 | 1.670 | 6.488 | 1.622 | 8.295 | 2.050 | ||
| LFR | QI/QIII | 10.095 | 1.484 | 10.247 | 1.535 | 10.991 | 1.746 | 10.210 | 1.508 | 10.579 | 1.653 | 11.561 | 1.670 | |
| QII/QIV | 15.112 | 2.157 | 15.745 | 2.290 | 17.545 | 2.69 | 14.612 | 2.017 | 15.624 | 2.502 | 18.612 | 2.947 | ||
| IQA Index | [33] | [42] | The Proposed Method | |
|---|---|---|---|---|
| Methods | ||||
| SDSC | 0 | 0 | 1 | |
| JSIM | 0 | 0 | 1 | |
| Skin detection | X | X | √ | |
| Segmented result |  Max. iterations = 300 |  Max. iterations = 3600 |  Max. iterations = 3000 | |
| Operation time (s) | 8.970 | 77.540 | 45.8911 ( = 4) | |
© 2020 by the authors. Licensee MDPI, Basel, Switzerland. This article is an open access article distributed under the terms and conditions of the Creative Commons Attribution (CC BY) license (http://creativecommons.org/licenses/by/4.0/).
Share and Cite
Dao-Ngoc, L.; Liu, C.-F.; Du, Y.-C. A Segmentation Enhancement Method for the Low-Contrast and Narrow-Banded Substances in CBCT Images. Electronics 2020, 9, 974. https://doi.org/10.3390/electronics9060974
Dao-Ngoc L, Liu C-F, Du Y-C. A Segmentation Enhancement Method for the Low-Contrast and Narrow-Banded Substances in CBCT Images. Electronics. 2020; 9(6):974. https://doi.org/10.3390/electronics9060974
Chicago/Turabian StyleDao-Ngoc, Lam, Ching-Feng Liu, and Yi-Chun Du. 2020. "A Segmentation Enhancement Method for the Low-Contrast and Narrow-Banded Substances in CBCT Images" Electronics 9, no. 6: 974. https://doi.org/10.3390/electronics9060974
APA StyleDao-Ngoc, L., Liu, C.-F., & Du, Y.-C. (2020). A Segmentation Enhancement Method for the Low-Contrast and Narrow-Banded Substances in CBCT Images. Electronics, 9(6), 974. https://doi.org/10.3390/electronics9060974