Article

Assessment of Head Impacts and Muscle Activity in Soccer Using a T3 Inertial Sensor and a Portable Electromyography (EMG) System: A Preliminary Study

by
Matthew T. O. Worsey
1,
Bethany S. Jones
1,2,
Andres Cervantes
1,3,
Sabrina P. Chauvet
1,4,
David V. Thiel
1 and
Hugo G. Espinosa
1,*
1
Griffith University Sports Technology (GUST), School of Engineering and Built Environment, Griffith University, Brisbane QLD 4111, Australia
2
Faculty of Biological Sciences, University of Leeds, Leeds LS2 9JT, UK
3
Center of Applied Physics and Advanced Technology (CFATA), National Autonomous University of Mexico (UNAM), Queretaro Cp 3001, Mexico
4
Arquus, 68 Route du point du jour, 44600 Saint-Nazaire, France
*
Author to whom correspondence should be addressed.
Electronics 2020, 9(5), 834; https://doi.org/10.3390/electronics9050834
Submission received: 16 April 2020 / Revised: 4 May 2020 / Accepted: 17 May 2020 / Published: 19 May 2020
(This article belongs to the Special Issue Wearable Electronics for Assessing Human Motor (dis)Abilities)

Abstract

:
Heading the ball is an important skill in soccer. Head impacts are of concern because of the potential adverse health effects. Many elite players now wear GPS (that include inertial monitoring units) on the upper spine for location tracking and workload measurement. By measuring the maximum acceleration of the head and the upper spine, we calculated the acceleration ratio as an attenuation index for participants (n = 8) of different skill levels during a front heading activity. This would allow for in-field estimates of head impacts to be made and concussive events detected. For novice participants, the ratio was as high as 8.3 (mean value 5.0 ± 1.8), whereas, for experienced players, the mean ratio was 3.2 ± 1.5. Elite players stiffen the neck muscles to increase the ball velocity and so the torso acts as a support structure. Electromyography (EMG) signals that were recorded from the neck and shoulder before and after a training intervention showed a major increase in mean average muscle activity (146%, p = 3.39 × 10⁻⁶). This was accompanied by a major decrease in acceleration ratio (34.41%, p = 0.008). The average head-ball impact velocity was 1.95 ± 0.53 m/s determined while using optical motion capture. For this low velocity, the impact force was 102 ± 19 N, 13% of the published concussive force. The voluntary action of neck muscles decreases isolated head movements during heading. Coaches and trainers may use this evidence in their development of junior players.

1. Introduction

1.1. Background

Soccer is regarded as one of the oldest sports with its first formal set of rules being created in 1848 in England [1]. It is now the world’s most popular sport, with over 250 million participating and more than 1.4 billion having an interest [2]. On a global scale, soccer and related businesses are worth more than $250 billion annually and they continue to gain more popularity [3]. Unlike other sports, soccer requires minimal equipment and little to no physical contact enabling people of different ages and economic class to participate. However, with no specific training, the risk of injury can increase particularly in skills that require accurate form and techniques, one such being heading a ball [4]. Over the past decade, concussion has been a big concern within sports, predominantly in full contact sports, such as American football and rugby [5,6]. Despite soccer having minimal player-to-player contact, like American football and rugby, the technique of heading whereby players voluntarily use their head to impact the ball has been the centre of research regarding concussion in soccer [7]. On average, a professional soccer player will make head to ball contact 6–7 times in a match [8] and, in the midfield positions, a high percentage of heading is linear as players return the ball from the direction it came [9]. Kirkendall and Garrett [1] stress the importance of contracting the neck muscles to stablise the head during a soccer header. An unprepared head increases the ball mass-contact mass ratio and increases the risk of injury due to the force of the ball hitting the head and accelerating it backward. This suggests that higher neck strength is a key factor in reducing the severity of head impacts. A range of literature has investigated this association [10,11] and very recently a novel testing device to assess the effect of neck strength on risk of concussion has been developed [12].

1.2. Literature Review

An in depth review of scientific literature investigating head impacts and neck strength in sport (mainly soccer heading) was conducted. Table 1 presents the key findings of this review.
The literature survey by Peek et al. [10] identified that higher neck strength is associated with lower head acceleration in soccer heading (p = 0.05). Clearly, this paper contradicts the conclusions of Mansell et al. [11], but it is supported by Dezman et al. [15] and Schmidt et al. [16].

1.3. Assessments of Wearable Technology

The viability of using a commercially available smart soccer ball to detect and assess head impacts has been tested [17]. The researchers concluded that the sensing capabilities are limited in its current form; however, if the properties of the sensor technology embedded in the ball is improved, then it does show promise. Moreover, there is concern with data ownership, availability, and fair play regulations when a neutral object is used for data collection in a competitive game. The use of wearable technology is becoming increasingly popular in sport training and competition [18,19]. Wearable technology often consists of global positioning system (GPS) units with inbuilt inertial measurement unit (IMU) sensors. IMU sensors generally consist of three axis accelerometers, gyroscopes, and magnetometers, and have sample rates that are greater than 100 Hz [20,21,22,23]. Many elite sports codes (e.g., soccer, rugby, field hockey etc.) allow players to wear a GPS/IMU unit at the location of the third thoracic (T3) spinal vertebra [24]. This location is regarded as the safest location in sports where the potential for direct impacts is minimal. There is potential in using the acceleration data from the T3 sensor in order to estimate the head acceleration and so to assess the severity of head impacts. There is also a possibility of being able to analyse player head-neck rigidity and, in turn, amend the heading technique of novice players, so that the impact acceleration directly absorbed by the head is minimized. Alternative commercial technologies used for head impact monitoring, such as the X2 Biosystems Xpatch [25], Reebok checklight [26], and the Triax SIM-P [27], do not incorporate a T3 sensor and, thus, assessment of neck muscle involvement is not possible.

1.4. Research Questions

The research question addressed in this paper has three parts:
Can a T3 located IMU sensors be used to quantify the head accelerations (linear and angular) during soccer ball impacts?
Can appropriate instruction to activate neck muscles increase head stability and as a result reduce the impact acceleration directly on the head?
Can a novel acceleration impact ratio metric (head impact/T3 impact) indicate neck muscle activation and provide meaningful feedback to players regarding the safety of their heading technique?
These research questions were addressed in three ways. Firstly, laboratory tests were conducted in order to verify acceleration measurements while using optical motion capture. Data from the optical motion capture system were used to determine soccer ball velocity, ball acceleration, and the header impact force. The next stage of the investigation looked at the impact ratio between the maximum acceleration measured at the head and that measured at the T3 as compared across participants of various skill levels. Should this be consistent for an individual, and then T3 located acceleration can be used to estimate the head acceleration. Finally, an intervention study was conducted while using electromyography (EMG) signals. The intention of the intervention study was to assess whether instructing a novice soccer player to consciously activate their neck muscles reduced the impact ratio and ultimately the impact acceleration directly on their head.

2. Materials and Methods

2.1. Instrumentation

2.1.1. Inertial Sensors

The inertial sensor technology used was manufactured in-house and contains a three-axis accelerometer (±16 g), three-axis gyroscope (±2000 °/s), and magnetometer (±7 Gauss) (SABELSense, Griffith University, Nathan, Australia [20,28,29,30]). The sampling rate of the sensor was set to 250 Hz—the highest capture speed for these units. The dimensions of the sensor are 55 mm × 30 mm × 13 mm (L × W × H) and weighs approximately 23 g. The sensor has a sync function that pulses a red LED, allowing for the user to synchronise sensor data with video footage. There is also an option for real-time data streaming using wireless connectivity (2.4 GHz).

2.1.2. Optical Motion Capture

A 12 camera OptiTrack (Freedspace Laboratories, Melbourne, VIC, Australia) optical motion capture system sampling at 100 Hz was used as a validation tool for measurements that were recorded by the IMUs. The motion capture space was calibrated specifically for the procedure. Table 2 shows the calibration report.

2.1.3. Surface Electromyography System

An electromyography (Bortec Biomedical, Calgary, AB, Canada) was used to measure neck muscle activity during the heading trials. Surface silver chloride (Ag-AgCl) electrodes were applied to the skin over the muscle bellies of the right sternocleidomastoid. A ground electrode was placed over the clavicle. The amplifier gain was set to 500 and an input impedance of 10 GΩ. All of the EMG signals were recorded at a sampling frequency 1000 Hz. A PicoScope (Pico Technology, Cambridge, UK) oscilloscope with a sampling frequency of 1 GS/s produced real-time acquisition of both muscle EMG signals which was viewed on the PicoScope software on a laptop. All of the trials were recorded using a single video camera. The video files were downloaded and aligned with the EMG signal and IMU sensor recordings while using the respective peak values.

2.2. Participant Slection

Prior to participation, all of the participants who volunteered for this study were briefed about the protocol and asked to sign a consent form. All the participants completed a questionnaire collecting some personal details (height, weight, age), including their self-assessed soccer playing level. This research was conducted under Griffith University Ethics Committee (approval number 20/07/2017).

2.2.1. Motion Capture Heading Tests

One participant (n = 1) was recruited for the laboratory heading test has 18 years of experience playing for amateur level soccer clubs and once played at the academy level. The participant’s position is center-back and, thus, has developed a strong heading technique.

2.2.2. Field Heading Tests

The participants selected for the field heading tests (n = 8, height 175 ± 11.8 cm, weight 76.4 ± 13.5 kg, age 27 ± 7.2 years) ranged from novice to semi-professional ranked by the highest level of soccer played. The field consisted of natural grass and it is regularly used in soccer competition.

2.2.3. Neck Muscle Activity (EMG) Intervention Test

One healthy male volunteered to participate in the study. The participant had no prior experience of playing competitive soccer.

2.3. Protocol

2.3.1. Inertial Sensor Validation with Optical Motion Capture

The first stage of the protocol was implemented in order to validate the inertial sensor measurements while using an optical motion capture system. A size 5 soccer ball and the participant were instrumented with passive retroreflective markers. The participant was instrumented using The Rizzoli Trunk Protocol marker set (15 markers, Figure 1), designed for tracking multi-segment trunk kinematics [31]. The two main body segments tracked using this setup are the pelvis and thorax; however, it also tracks a segment in the cervical zone. This was the simplest marker set that met the requirements that are needed to validate an inertial sensor located at the third thoracic vertebrae (T3). A set of four markers were placed on a non-reflective hat (Figure 1c) designed for motion capture to create a rigid body for tracking head movement while using the commercial software. While the ball is slightly compressed on impact, the determination of the velocity before and after impact of the center of mass will be accurate to within millimeters. This rigid body was used to validate an inertial sensor located in close proximity to the participant’s occipital bone perturbance. The soccer ball was fitted with four asymmetrically placed markers and a rigid body was created marking the center of the ball (Figure 1c).
The T3 inertial sensor was fixed to the participant using a specially designed sports bra, which contains a tight pocket for the sensor on the back. The second inertial sensor was fixed to the posterior of the participant’s head (occipital bone) while using a fabric headband. This method of fixture was found to be reliable and not prone to excessive vibration given the relatively low impacts in these trials. The experimental phase started after the participant was instrumented with both the motion capture suit and inertial sensors located at the T3 and occipital bone. The efficacy of the sports bra in holding the IMU was validated using the motion tracker software. The experiment consisted of the participant executing five soccer headers while keeping both feet on the floor. The ball was thrown to the participant using an under-arm technique from a 3 m distance. The participant was instructed to head the ball back to the thrower, mimicking a linear header that commonly occurs in midfield positions.

2.3.2. Inertial Sensor Field Testing

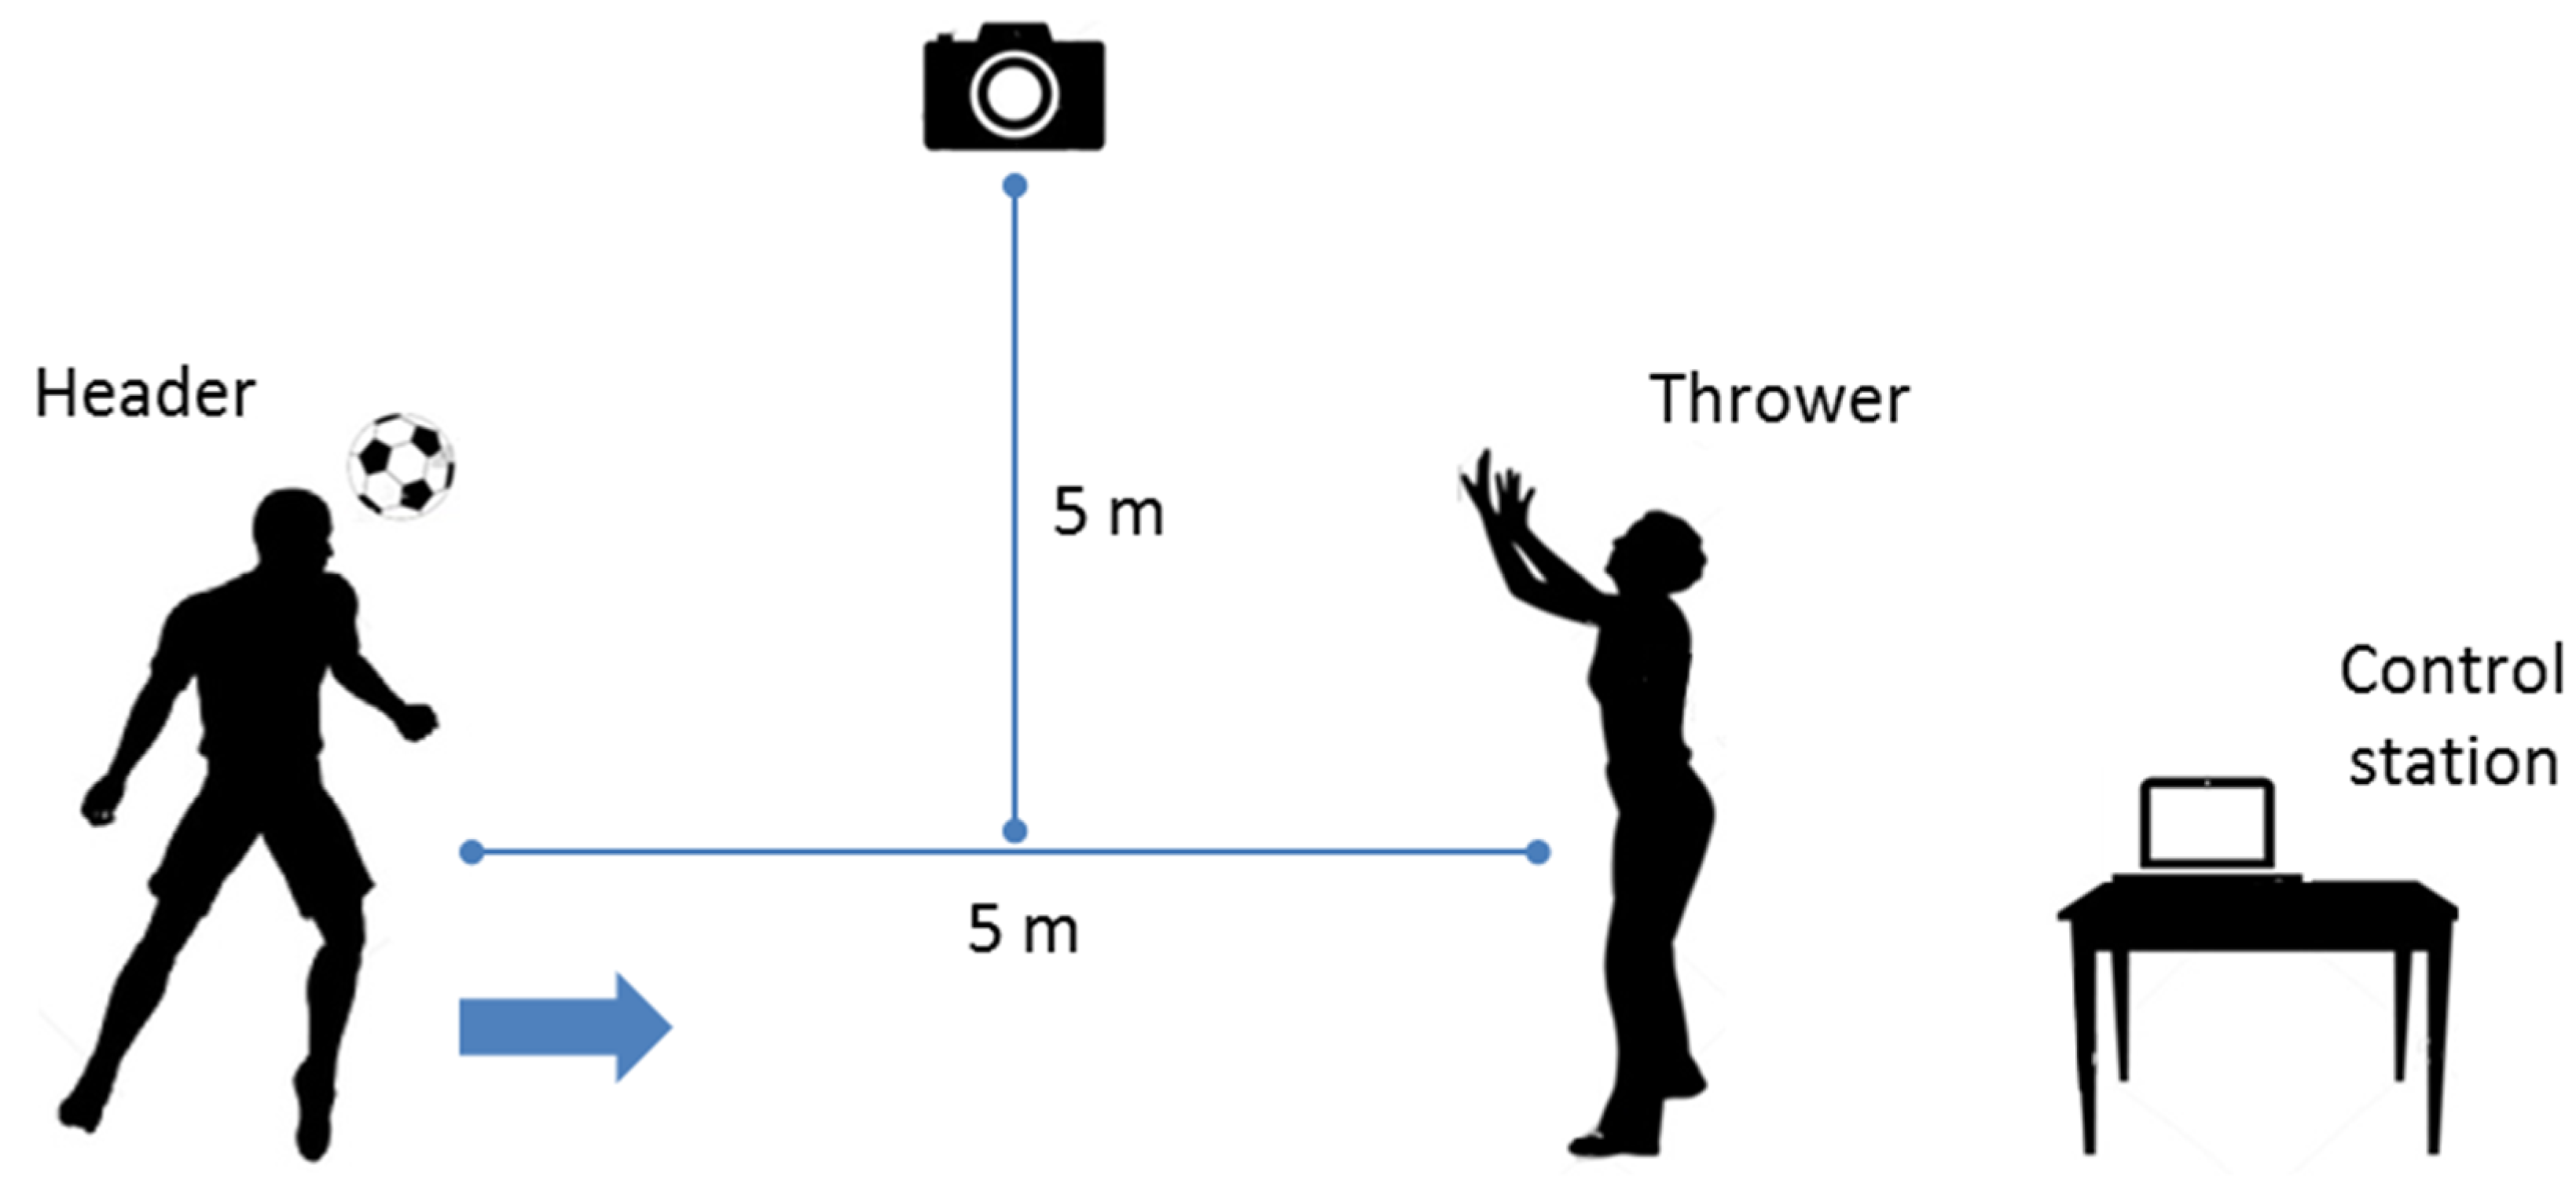
This experimental procedure was conducted outside of a laboratory setting on a natural grass soccer field. The protocol consisted of participants performing 10 headers in the forward direction from a soccer ball that was gently thrown from a distance of 5 m. Figure 2 shows the experimental arrangement. A computer on the monitoring table wirelessly triggered the sensors. All of the ball contacts were recorded using a Panasonic HC-V750M video camera (120 frames per second) fixed to a tripod. The video records were used as a synchronization reference for the inertial sensor data. The field testing procedure was identical to the laboratory validation protocol, except for an increase to a five meter distance between the thrower and the participant. The inertial sensors were again fixed to the T3 and the back of the head using a sports bra and headband, as described previously.

2.3.3. Inertial Sensor with Electromyography (Intervention Test)

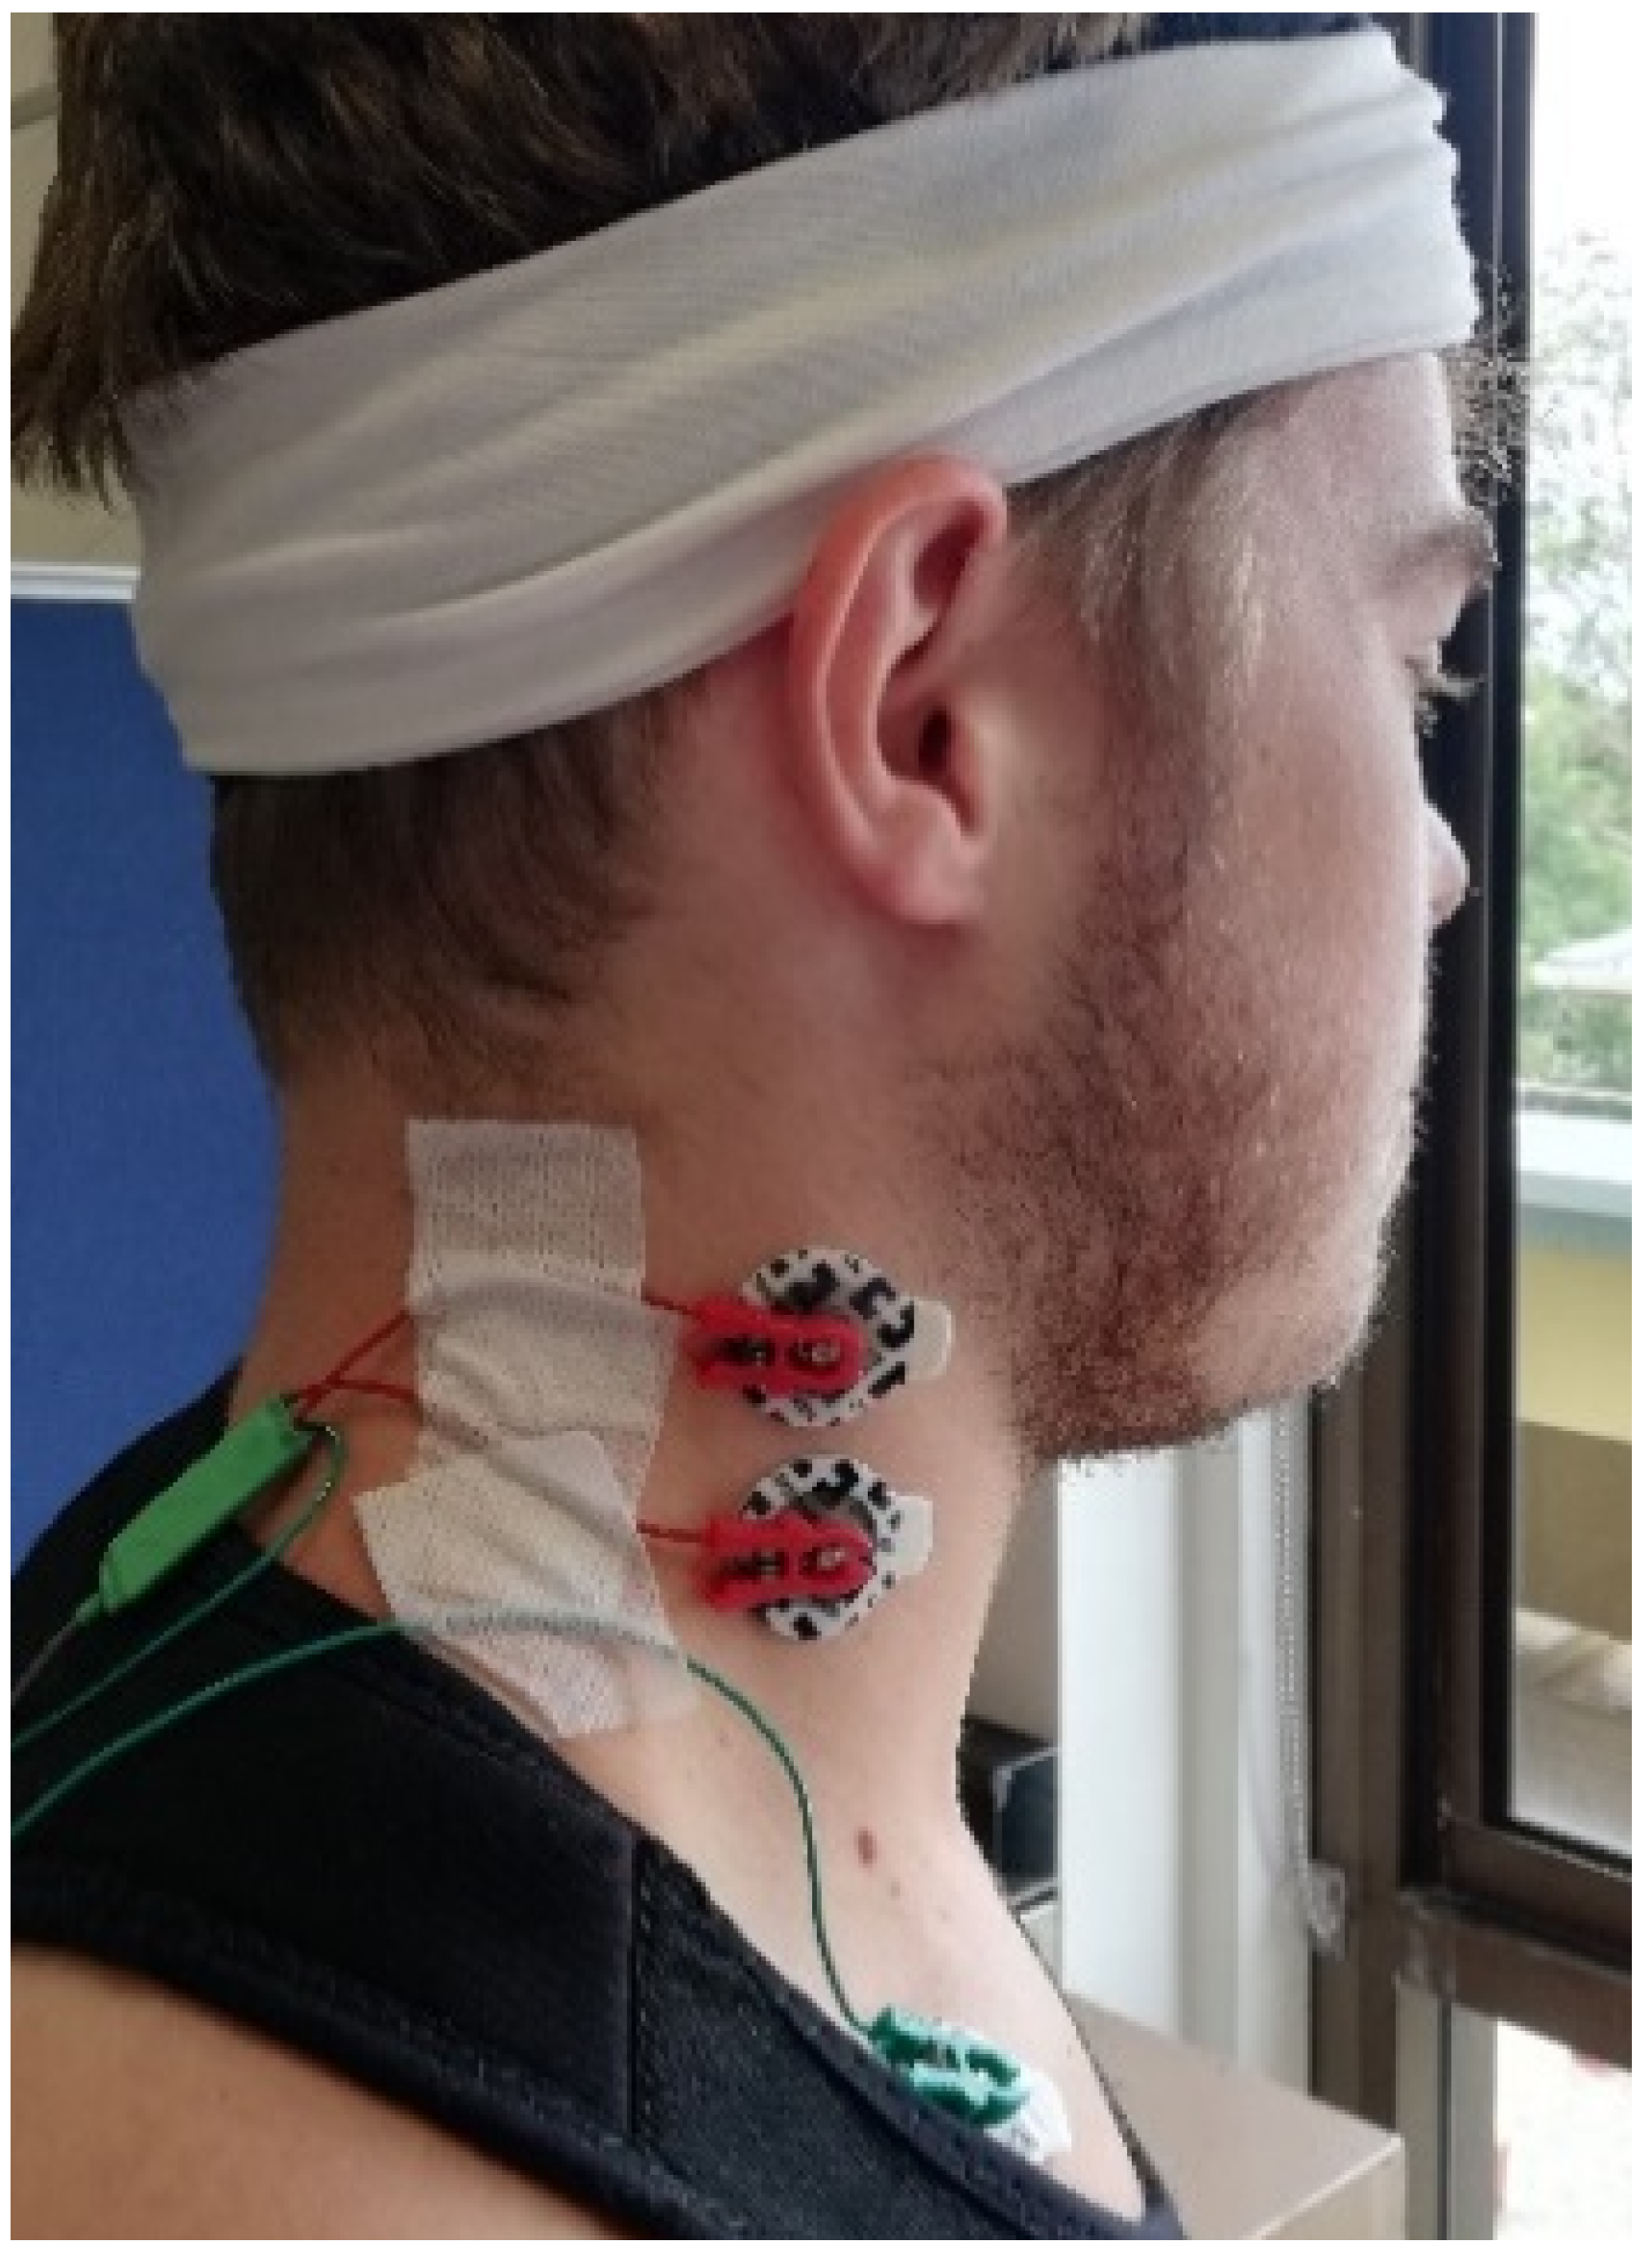
The procedure for front direction headers was repeated while using the inertial sensors along with surface electrode electromyography (EMG). The target muscle of the EMG was the sternocleidomastoid. Before the electrodes were placed, the participant’s skin was cleaned with alcohol wipes. EMG surface electrodes were placed over the right sternocleidomastoid muscle belly; the orientation is shown in Figure 3. A ground electrode was placed over the clavicle bone. The inertial sensors were again fixed to the T3 and head while using a sports bra and headband, identical to the field test procedure.
The participant warmed-up by performing five trial headers. Three trials consisting of five headers each were performed with a ten-minute rest period between each trail. The thrower gently tossed the ball at a constant velocity (3.5 m/s estimated from the video recordings) towards the participant’s head. The participant was directed to head the ball forcefully back to the thrower. The EMG recording was stopped and saved to the computer during the rest period after each trial.

2.4. Algorithm

2.4.1. Inertial Sensor Validation with Optical Motion Capture

The optical motion capture data were saved as a csv file and the inertial sensor data were downloaded onto a PC. The agreement between the optical motion capture data and inertial sensor data were assessed while using an algorithm created on MATLAB (MathWorks, Natick, MA, USA). The magnitude of the optical motion capture position data was calculated and then filtered using a fourth order low-pass digital Butterworth filter with a cut-off frequency of 5 Hz to remove high frequency signal components. The position data were filtered, as noise in the raw displacement data is amplified by differentiation [32]. The second derivative of the filtered position data was then calculated while using Newton’s method to obtain the optical motion capture measure of acceleration.
The magnitude of the inertial sensor acceleration was calculated as the root mean square sum of the three orthogonal acceleration components. The acceleration signal was down sampled from 250 Hz to 100 Hz using linear interpolation to allow for synchronization of the data from the motion capture system.
The relative impact velocity between the head and the ball was calculated from the rigid body positions in a three-dimensional space as a function of time. The minimum distance between the two rigid bodies is the approximate sum of the head and ball radii, which indicated that the ball compressions were slight.

2.4.2. Inertial Sensor Field Testing

The data were downloaded from the headband and T3 mounted inertial sensors onto a PC and post processed using software created on MATLAB (MathWorks, Natick, MA, USA). A peak finder algorithm was used to automatically detect header events. Video analysis was used to confirm that the impact peaks were associated with soccer headers. The magnitude of the acceleration was calculated for both sensors and used for analysis. For each header event detected, the impact acceleration magnitude that was recorded by the headband sensor was divided by that detected by the T3 sensor to obtain the impact ratio between the sensors. The distribution of impact ratios of each header was then displayed visually using box and whisker plots.

2.4.3. Inertial Sensor with Electromyography (Intervention Test)

For the inertial sensor data, the bespoke algorithm was used in order to calculate the impact ratios. MATLAB was used to rectify each EMG signal and calculate the RMS values, allowing for a digital Butterworth filter (cut-off frequency of 10 Hz) to be applied and smooth the data. The maximum voltage for each trial was taken as a percentage of the participant’s maximum voluntary contraction (MVC) in order to normalize and allow for comparison between individuals. The MVC was determined by recording the filtered maximum EMG signal during maximum voluntary muscle contraction with the electrodes positioned for the tests. Box and whisker plots were used to visually assess the relationship between muscle activity and impact ratio recorded by the inertial sensors, and this was statistically verified using a t-test probability.

3. Results

3.1. Inertial Sensor Validation with Optical Motion Capture

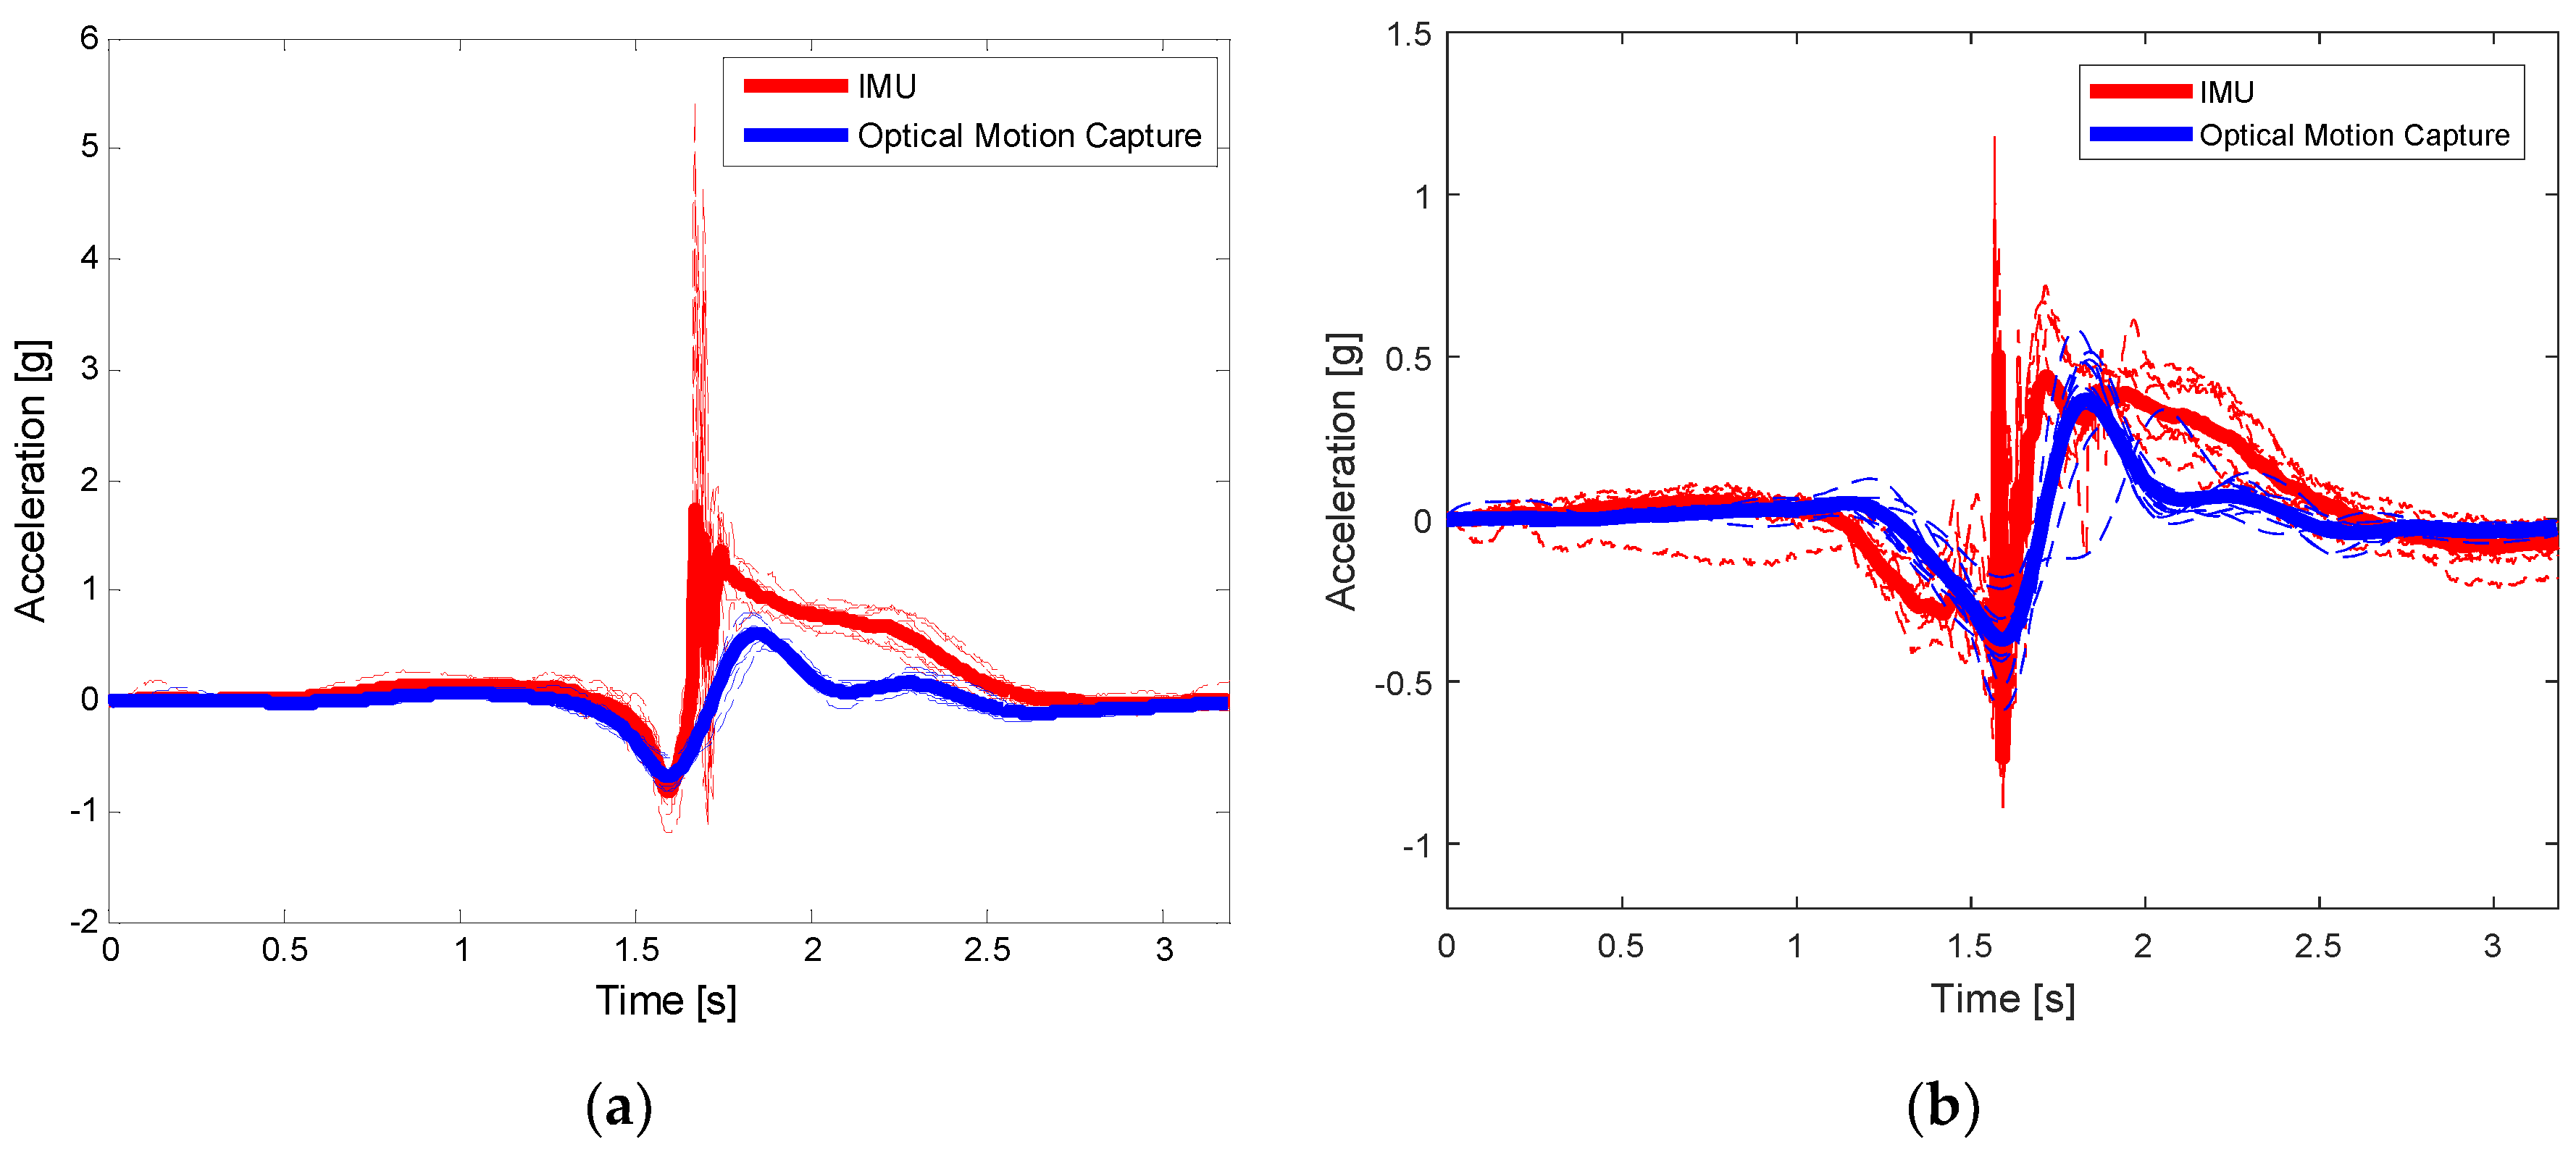
Figure 4 shows the superimposition of 10 headers (dashed lines) for acceleration signals as a function of time, recorded by the IMU sensor and optical motion capture. The thicker lines in both plots correspond to the mean acceleration values. Figure 4a shows the acceleration signals of the IMU located on the head, while Figure 4b shows the acceleration signals of the sensor located at T3.
There is an observable difference in the mean profiles of both IMU and motion capture for both locations, because the IMU had a sampling speed (250 s/s) of 2.5 times the motion capture sampling speed (100 s/s). Acceleration peaks can be observed in the IMU data, with magnitudes of approximately 5.5 g (head) and 1.2 g (T3). Such peaks represent the time and magnitude of the ball impact and they provide useful information that cannot be obtained by motion capture. It can be used to determine, for example, the severity of the impact, the heading power of a particular player, the characterization of heading impacts for training purposes, etc. Figure 4 provides confidence in using the IMU sensor during field measurements of head impacts, where systems, such as motion capture, are not viable. However, the motion capture provides accurate measures of position and space orientation.
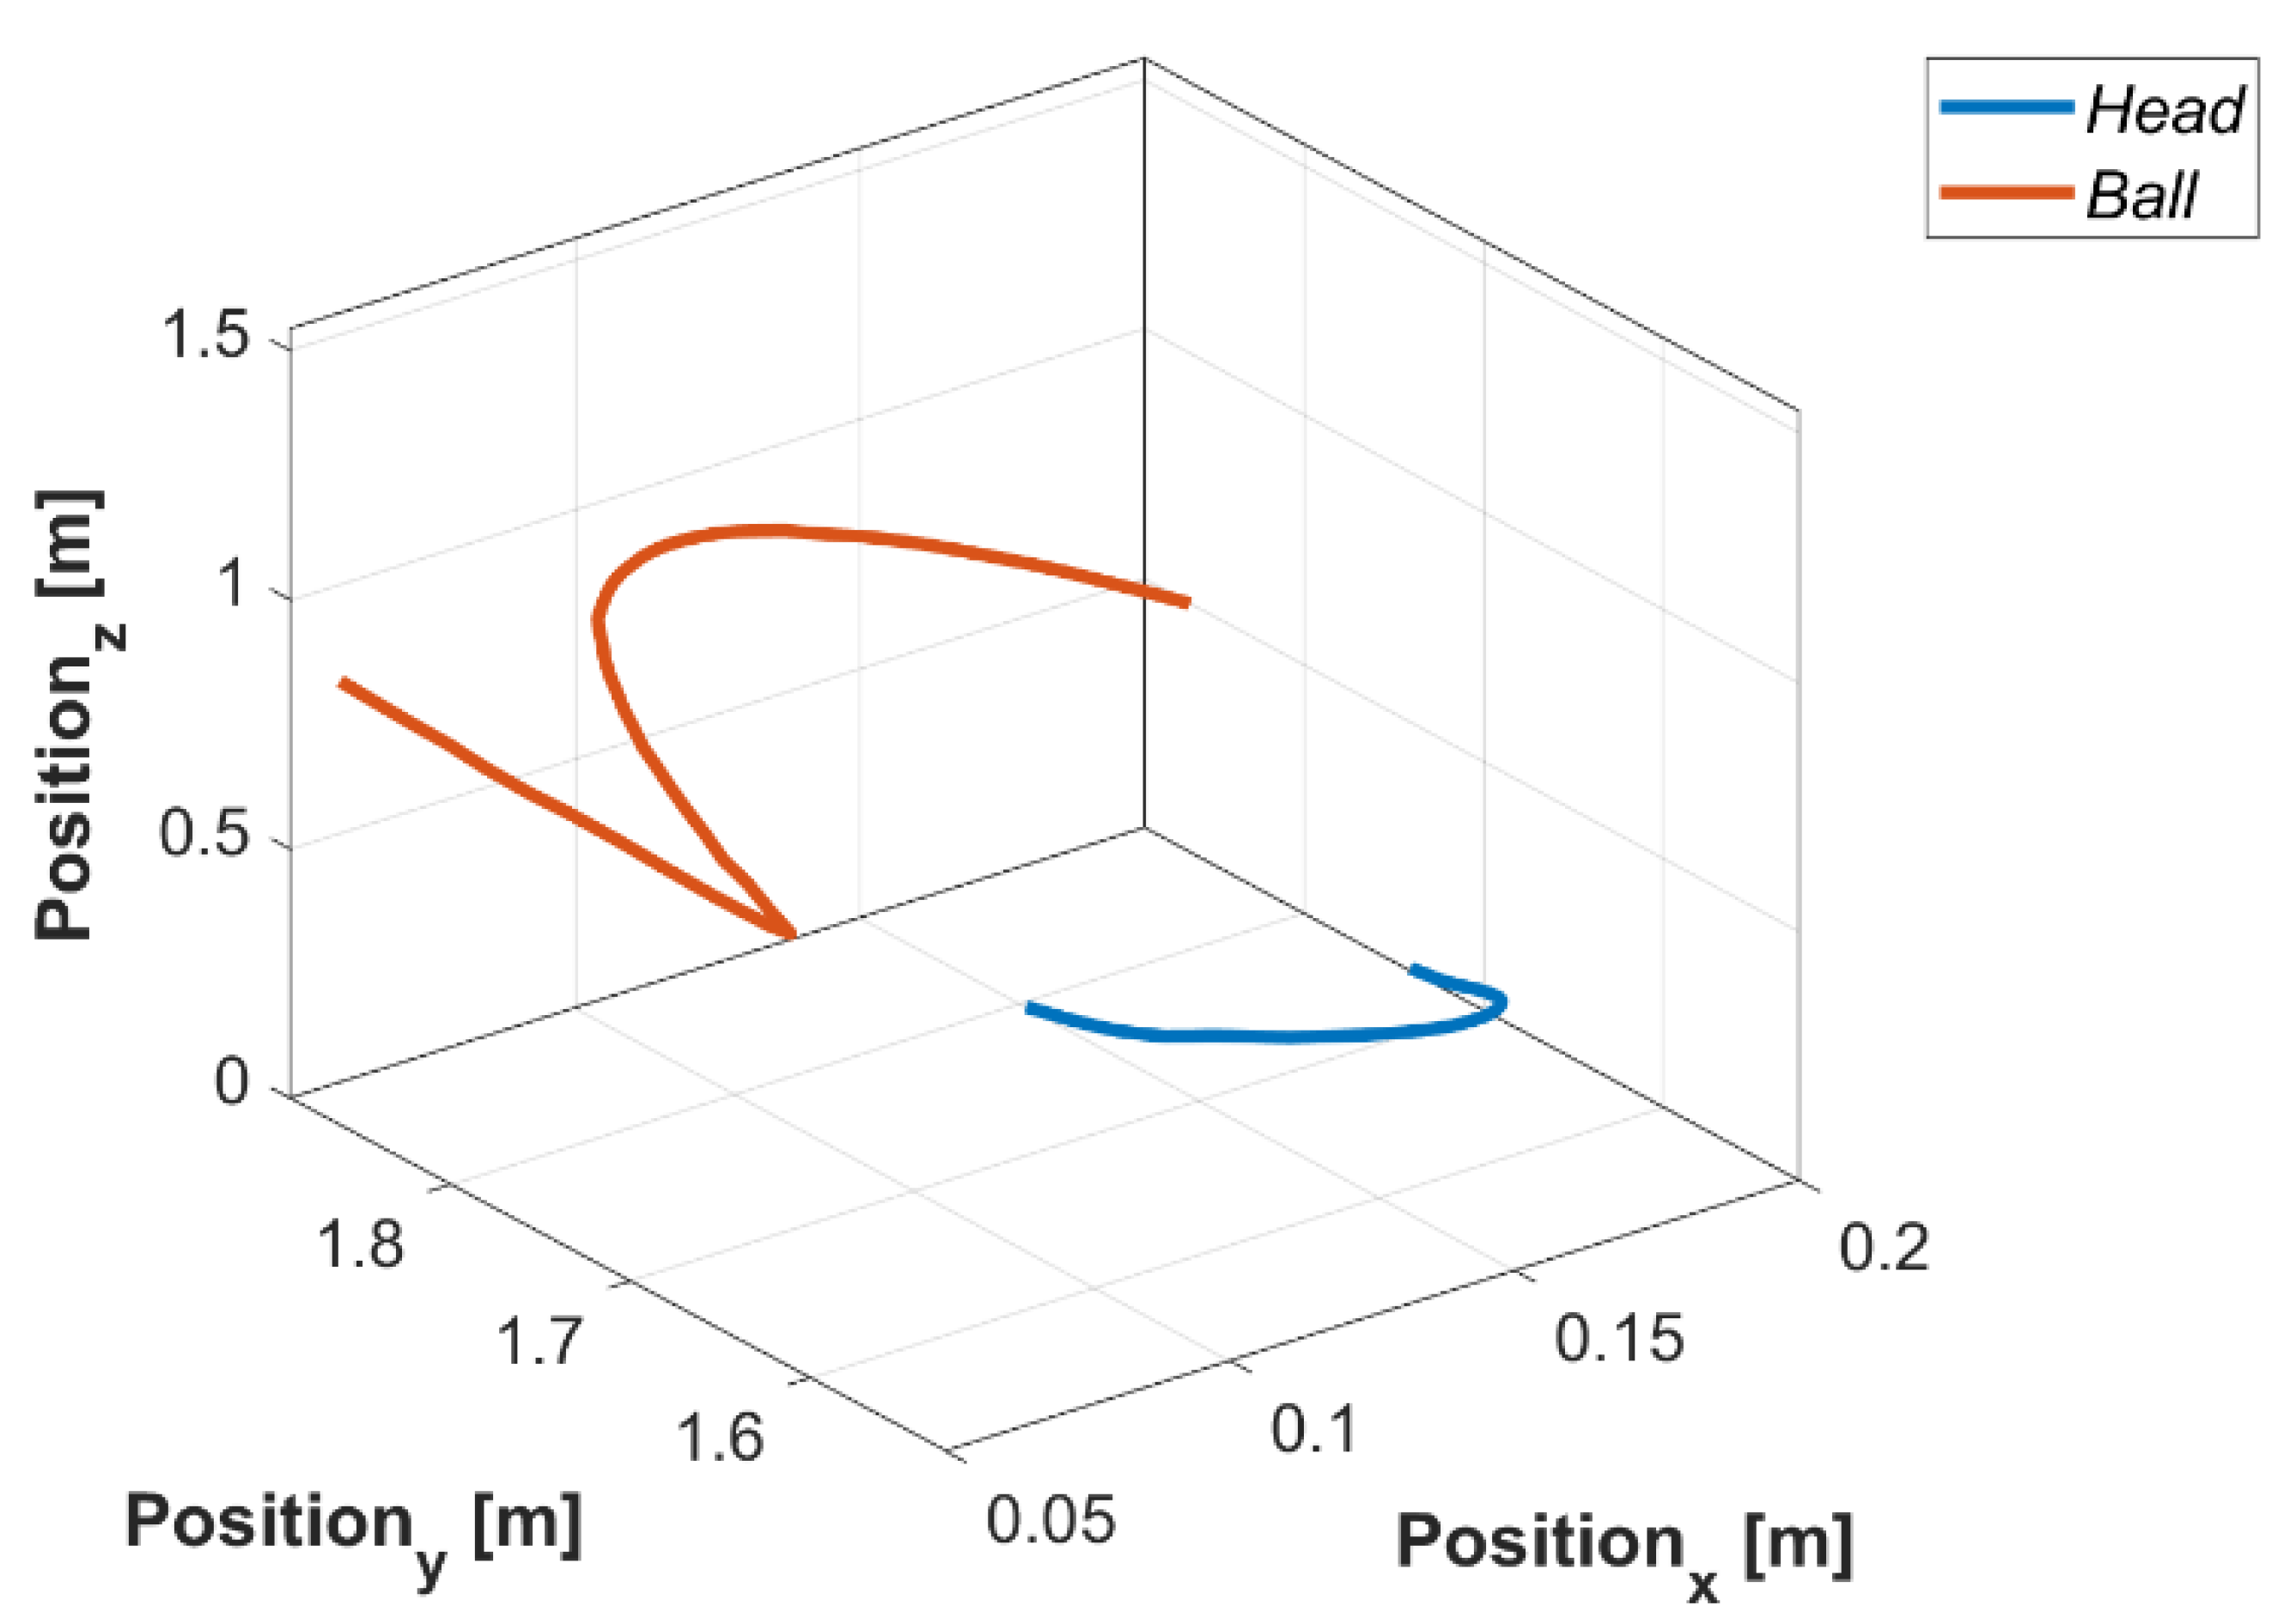
Figure 5 shows the ball and head trajectories in three-dimensional space during a soccer header.
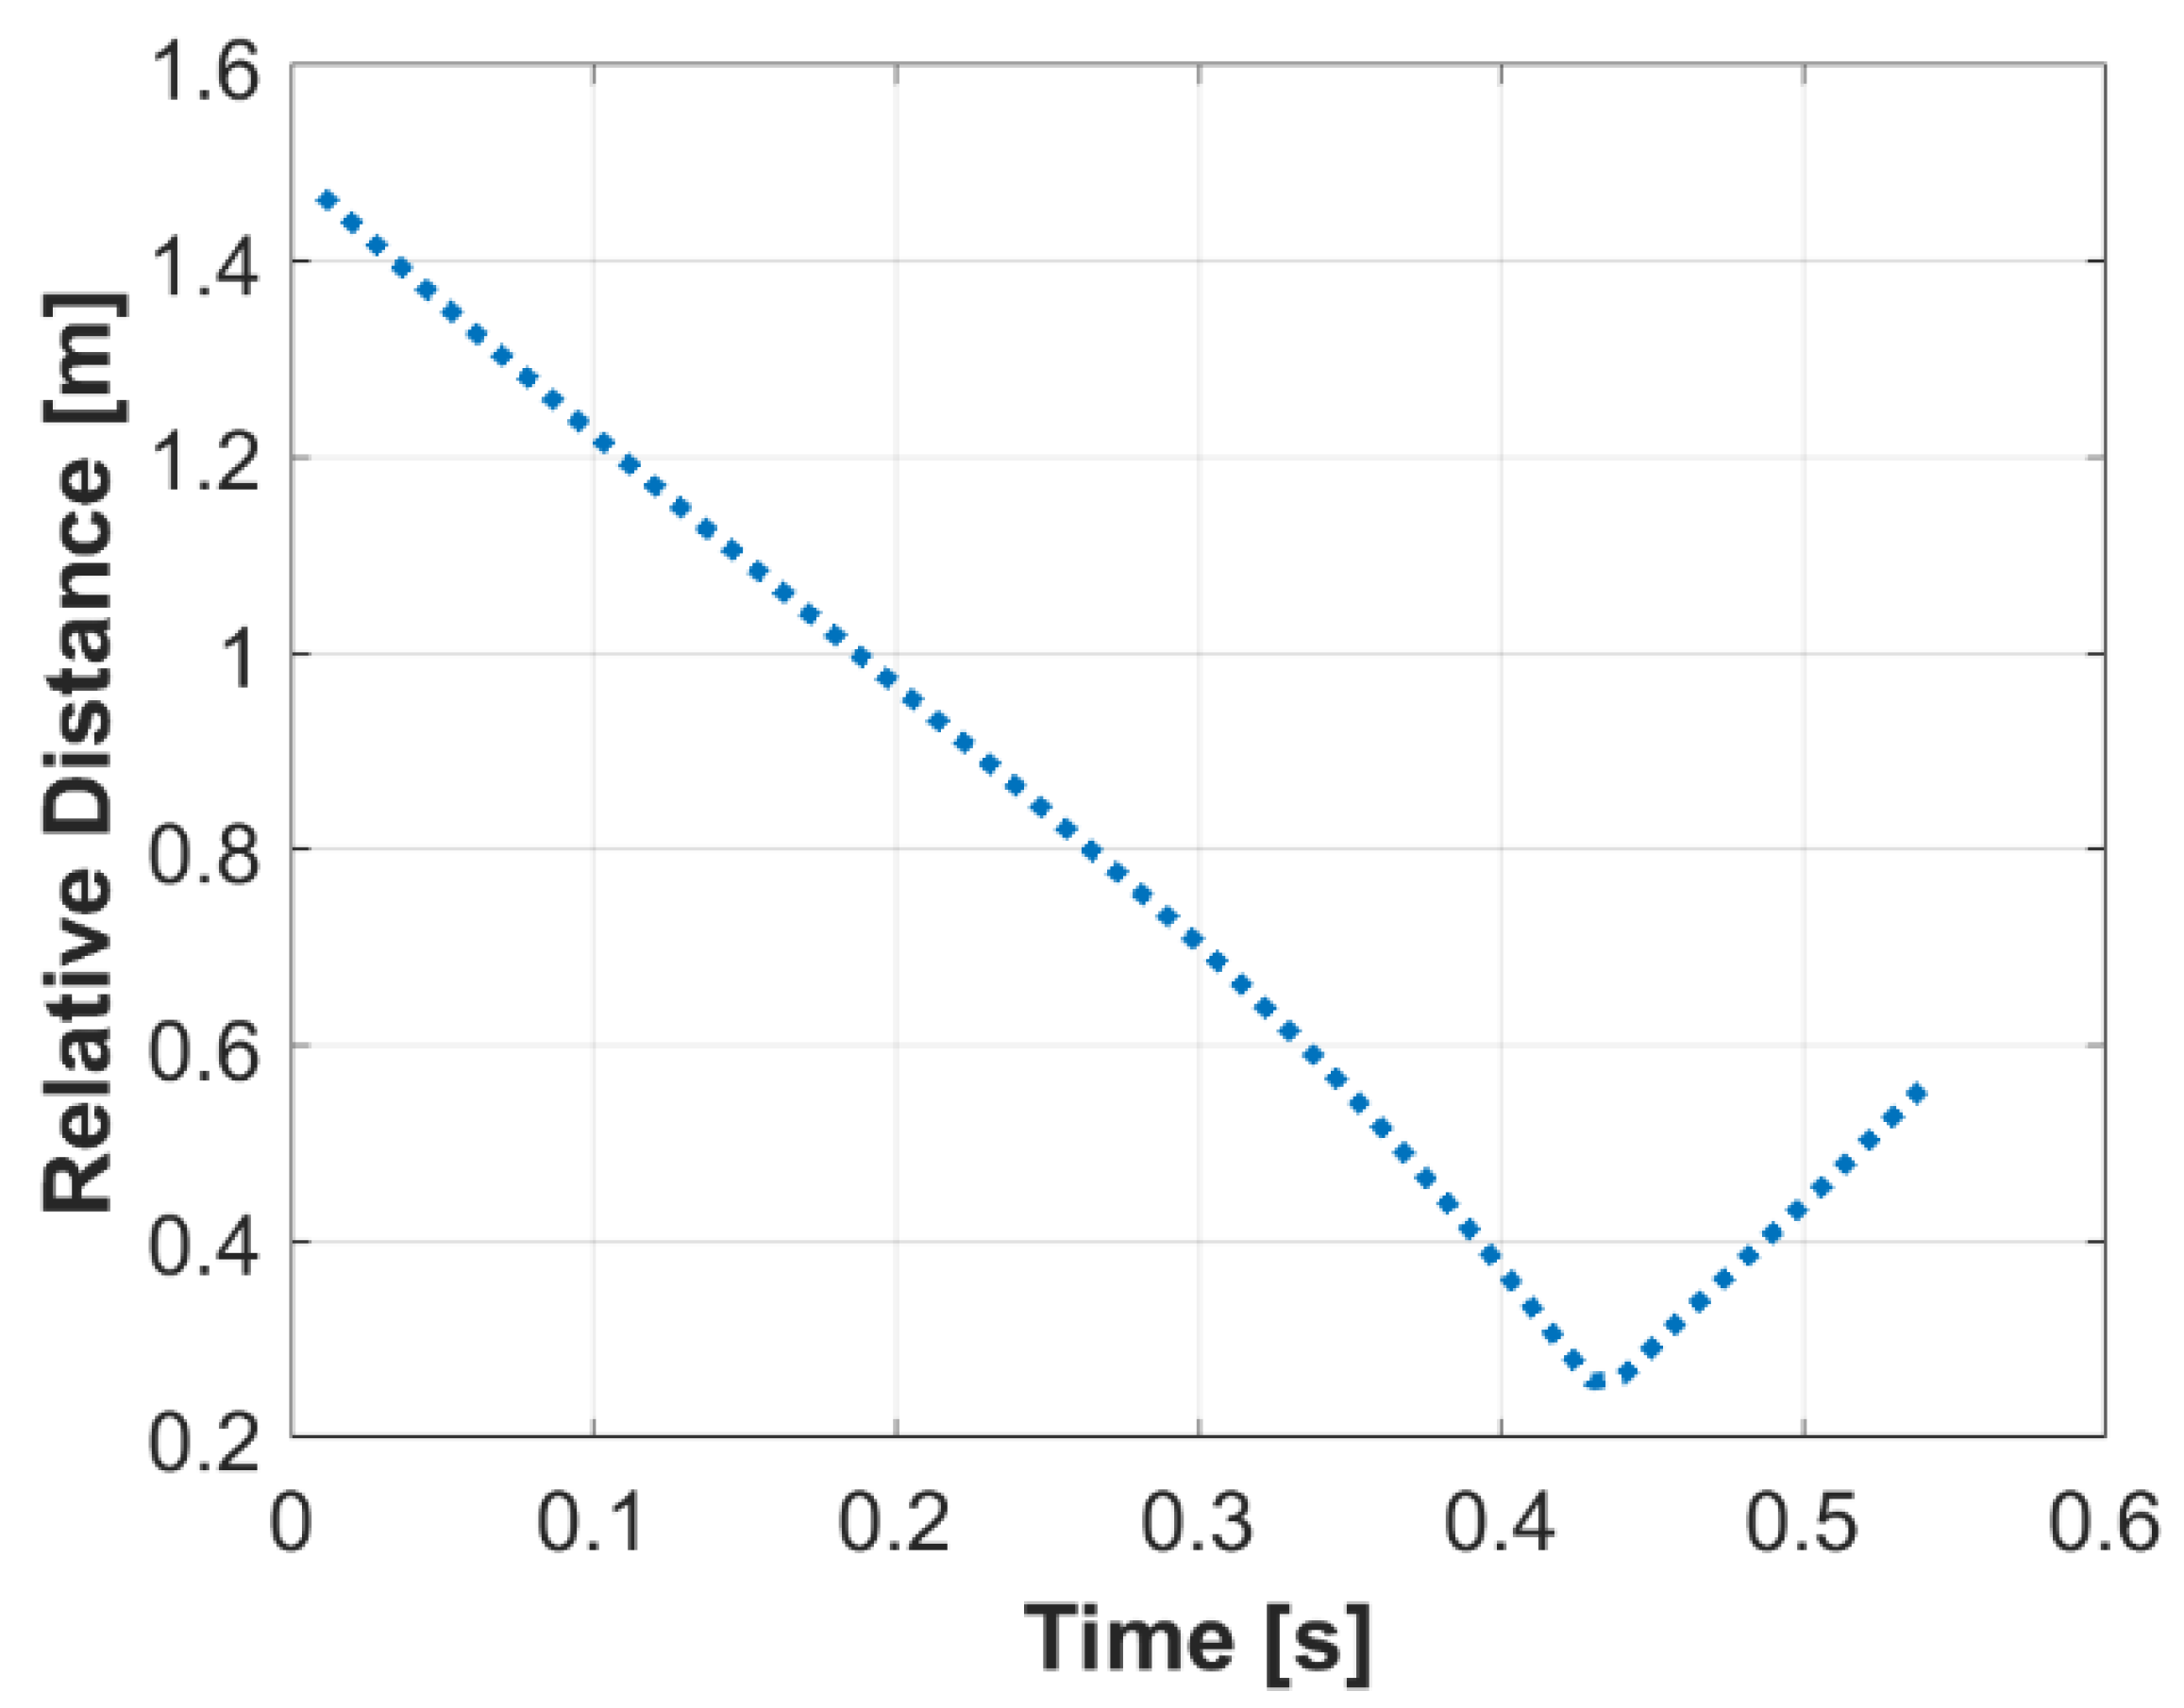
The ball and head positions were used to determine the relative difference between the geometric centers of the participant’s head and the ball (Figure 6).
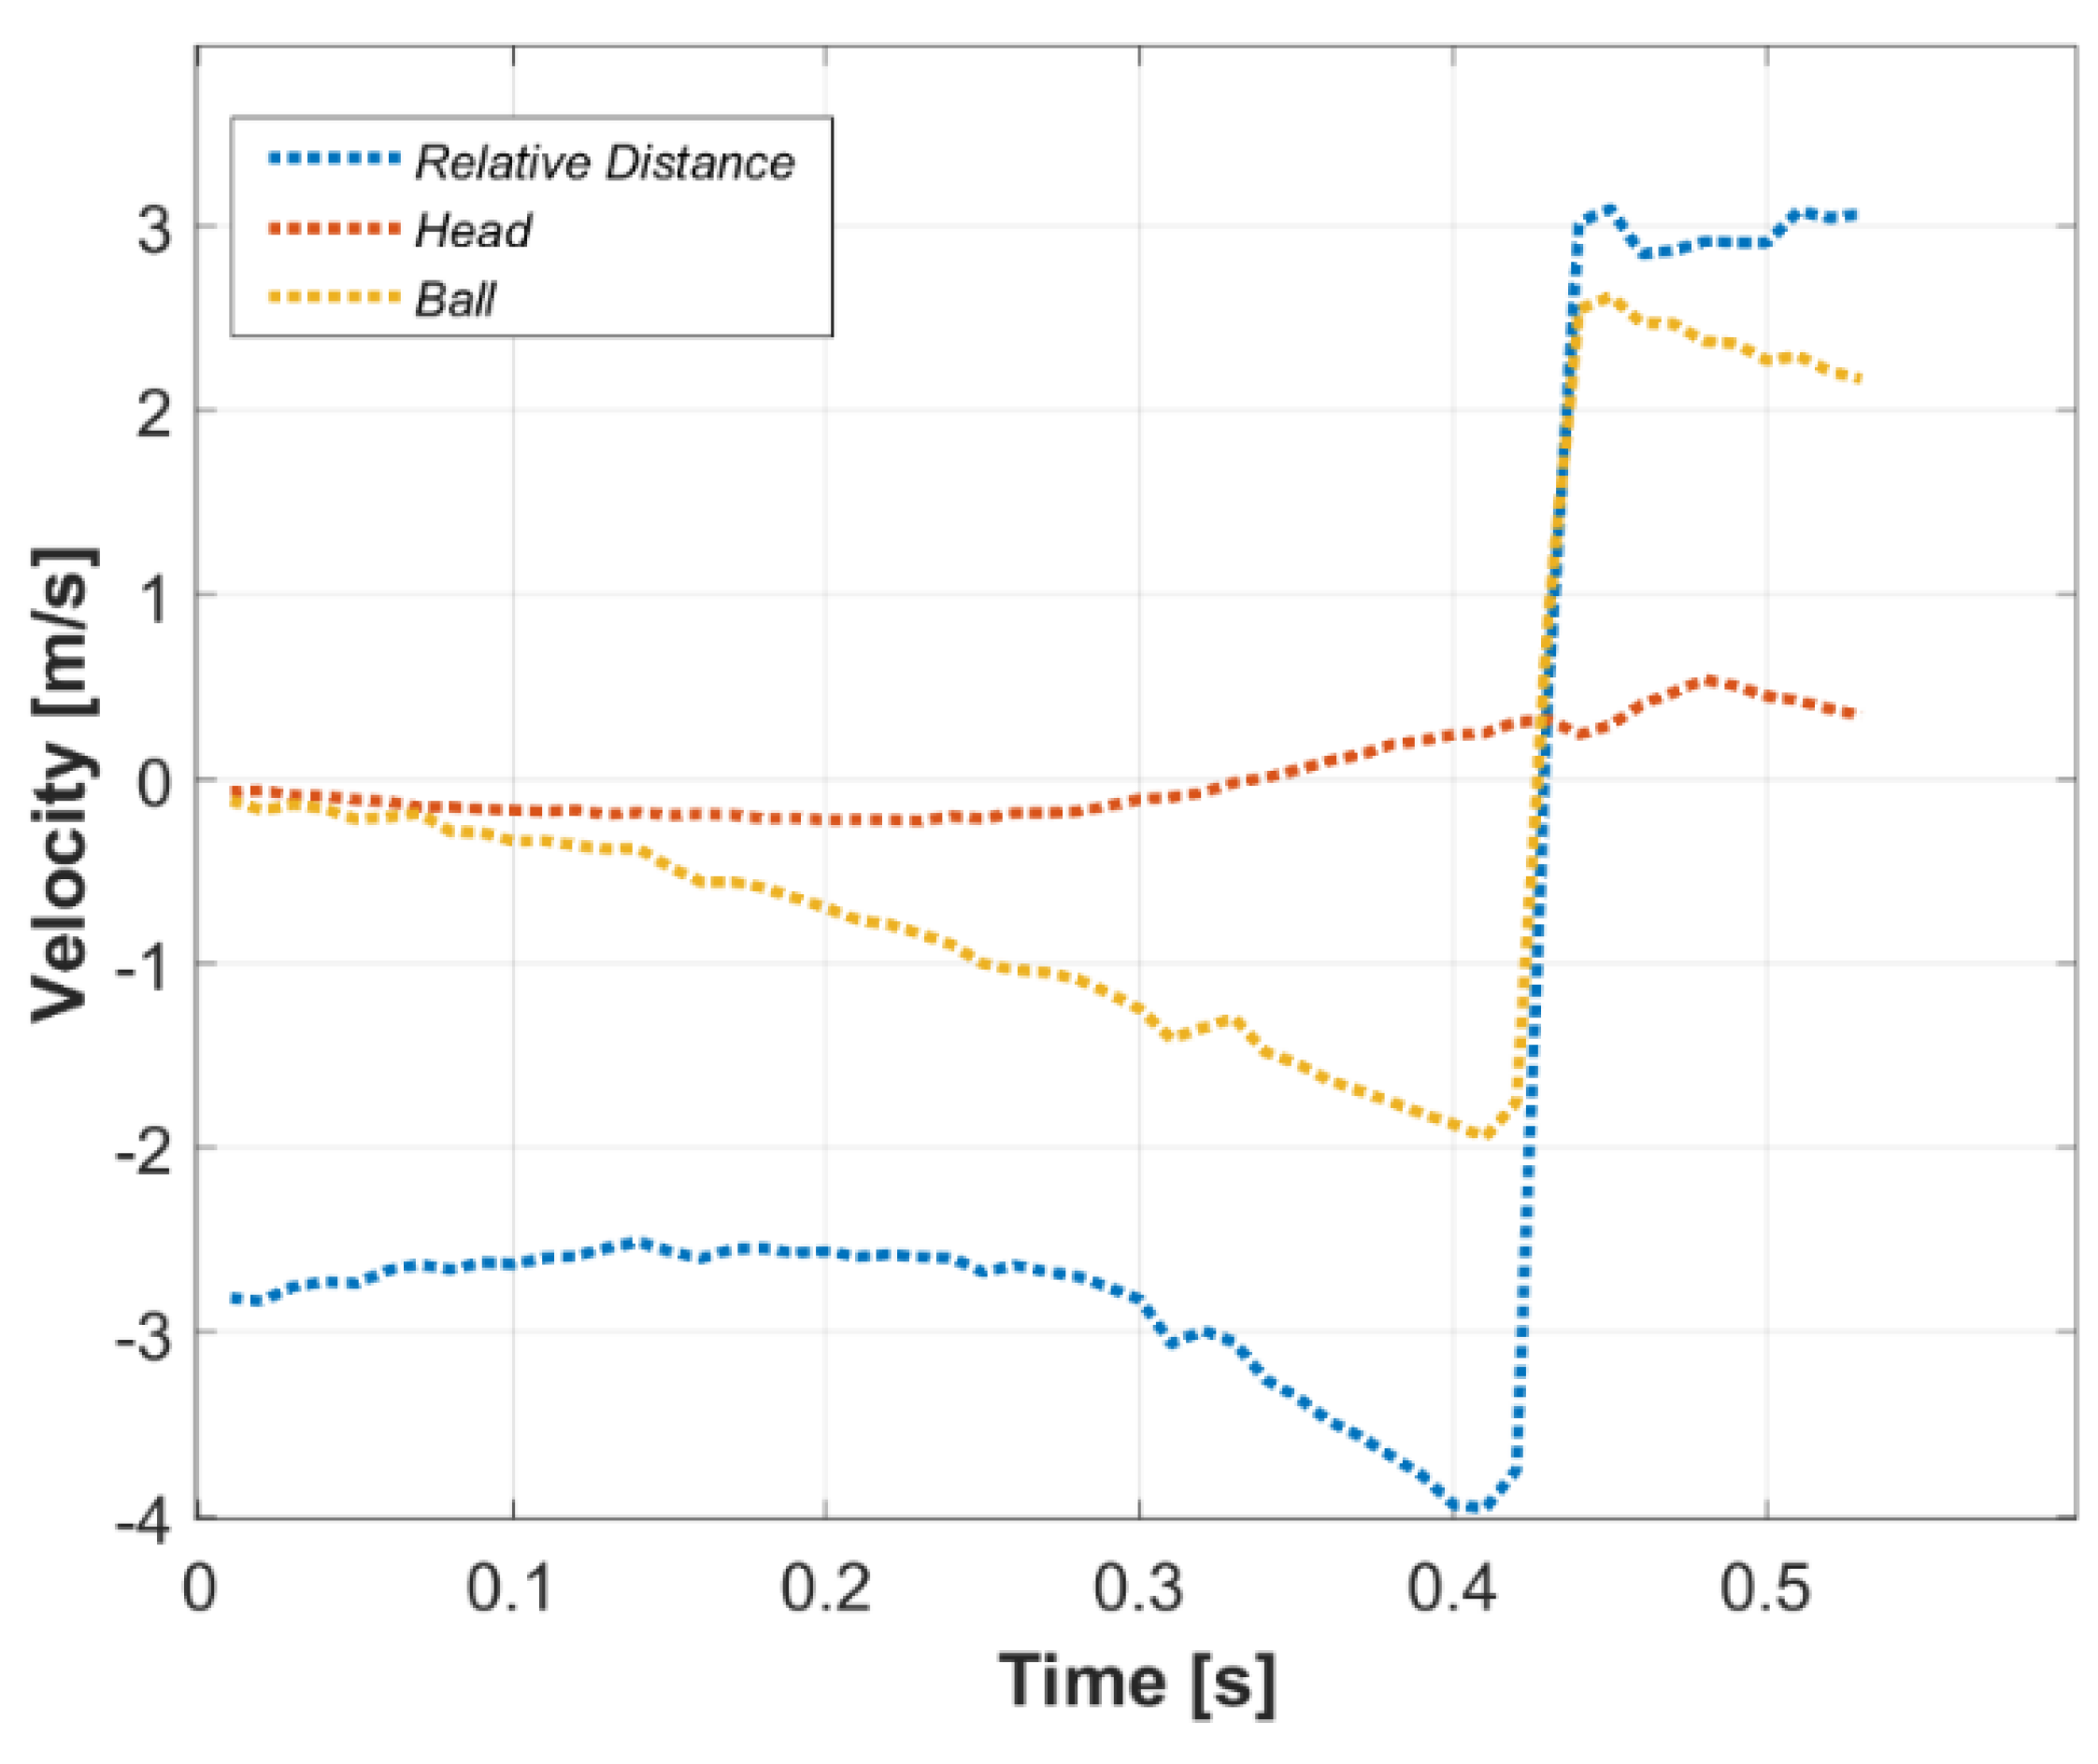
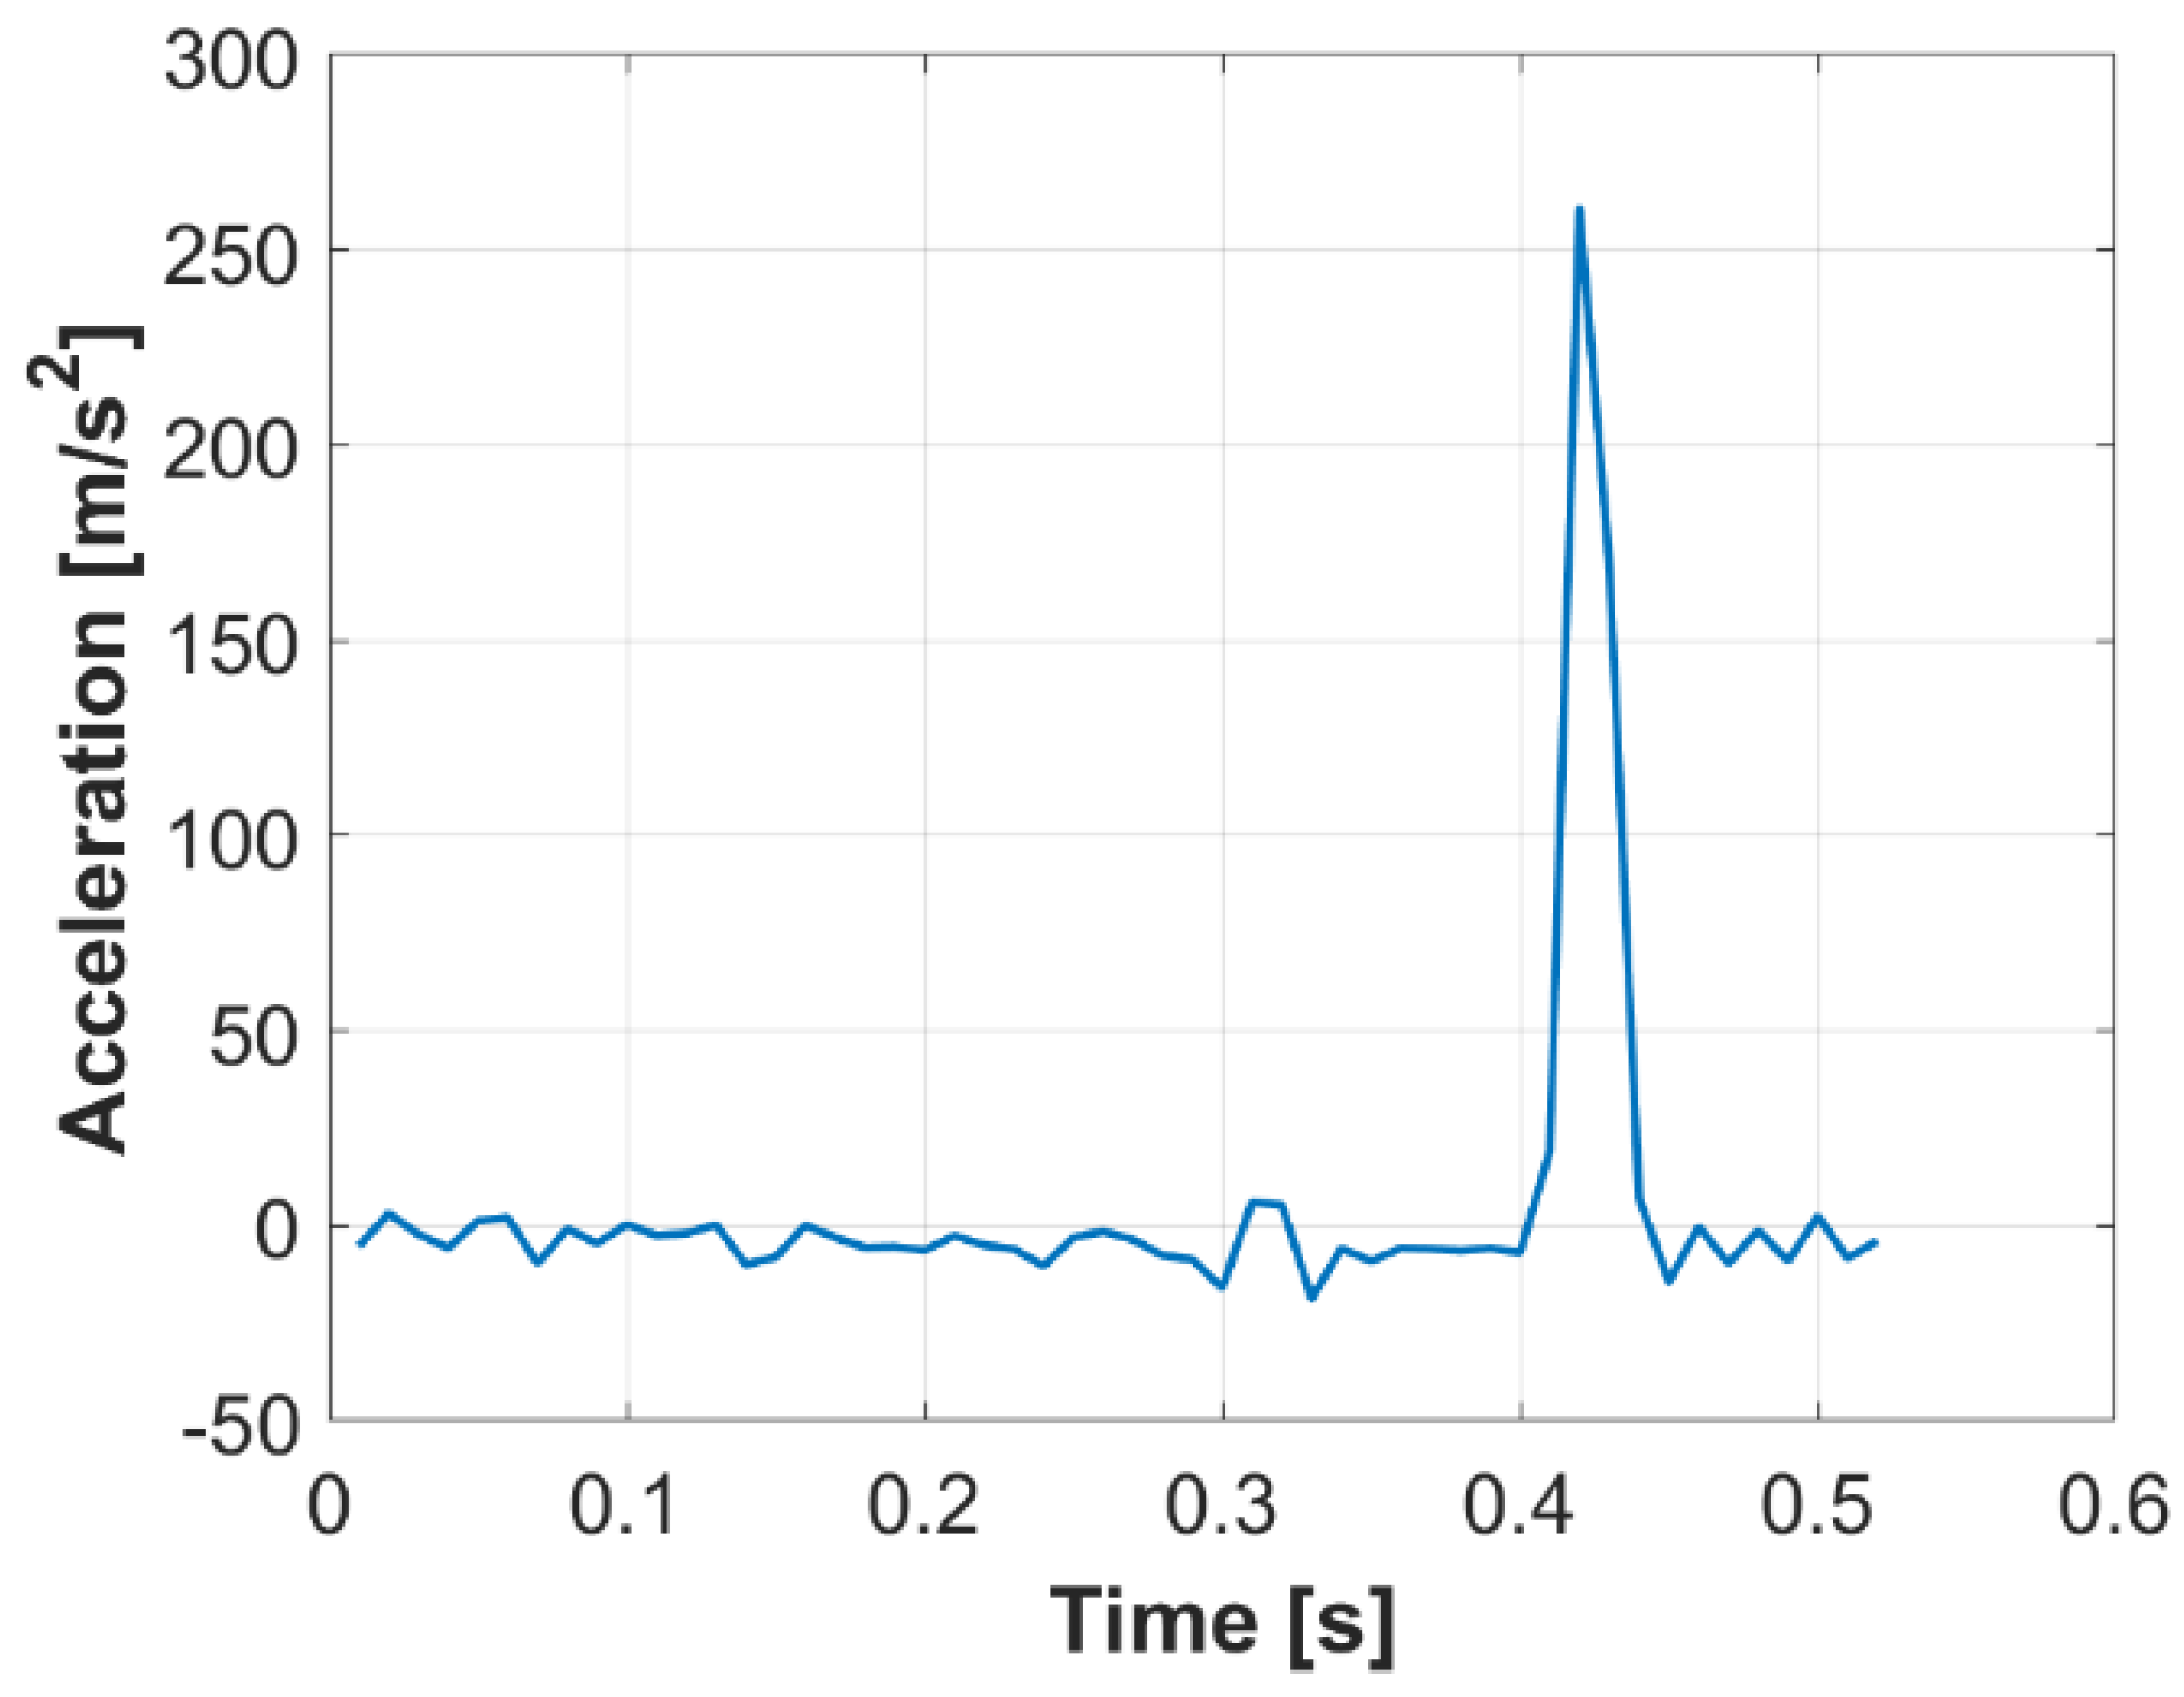
The relative distance was differentiated in order to obtain a velocity measurement (Figure 7) and differentiated again to obtain the relative acceleration (Figure 8). The distance measurement was used to determine the ball acceleration, given the very small head movement. The maximum velocity for the ball derived from the position data is similar to the velocity obtained when using the relative distance between the ball and head, showing that the optical motion capture was accurately tracking the two rigid bodies.
Newton’s second law (F = ma) was used to calculate the force F that was generated on impact, where m is the mass of the ball (0.45 kg) and a the acceleration or time differential of the velocity v, which is
F = m v t
Figure 8 shows an example of the acceleration in (m/s2) of the ball on impact for one header. The peak value shows the acceleration of the ball directly after impact. The optical motion capture equipment recorded five ball-head impacts. The mean average impact force was calculated as 102 ± 19 N.

3.2. Inertial Sensor Field Measurments

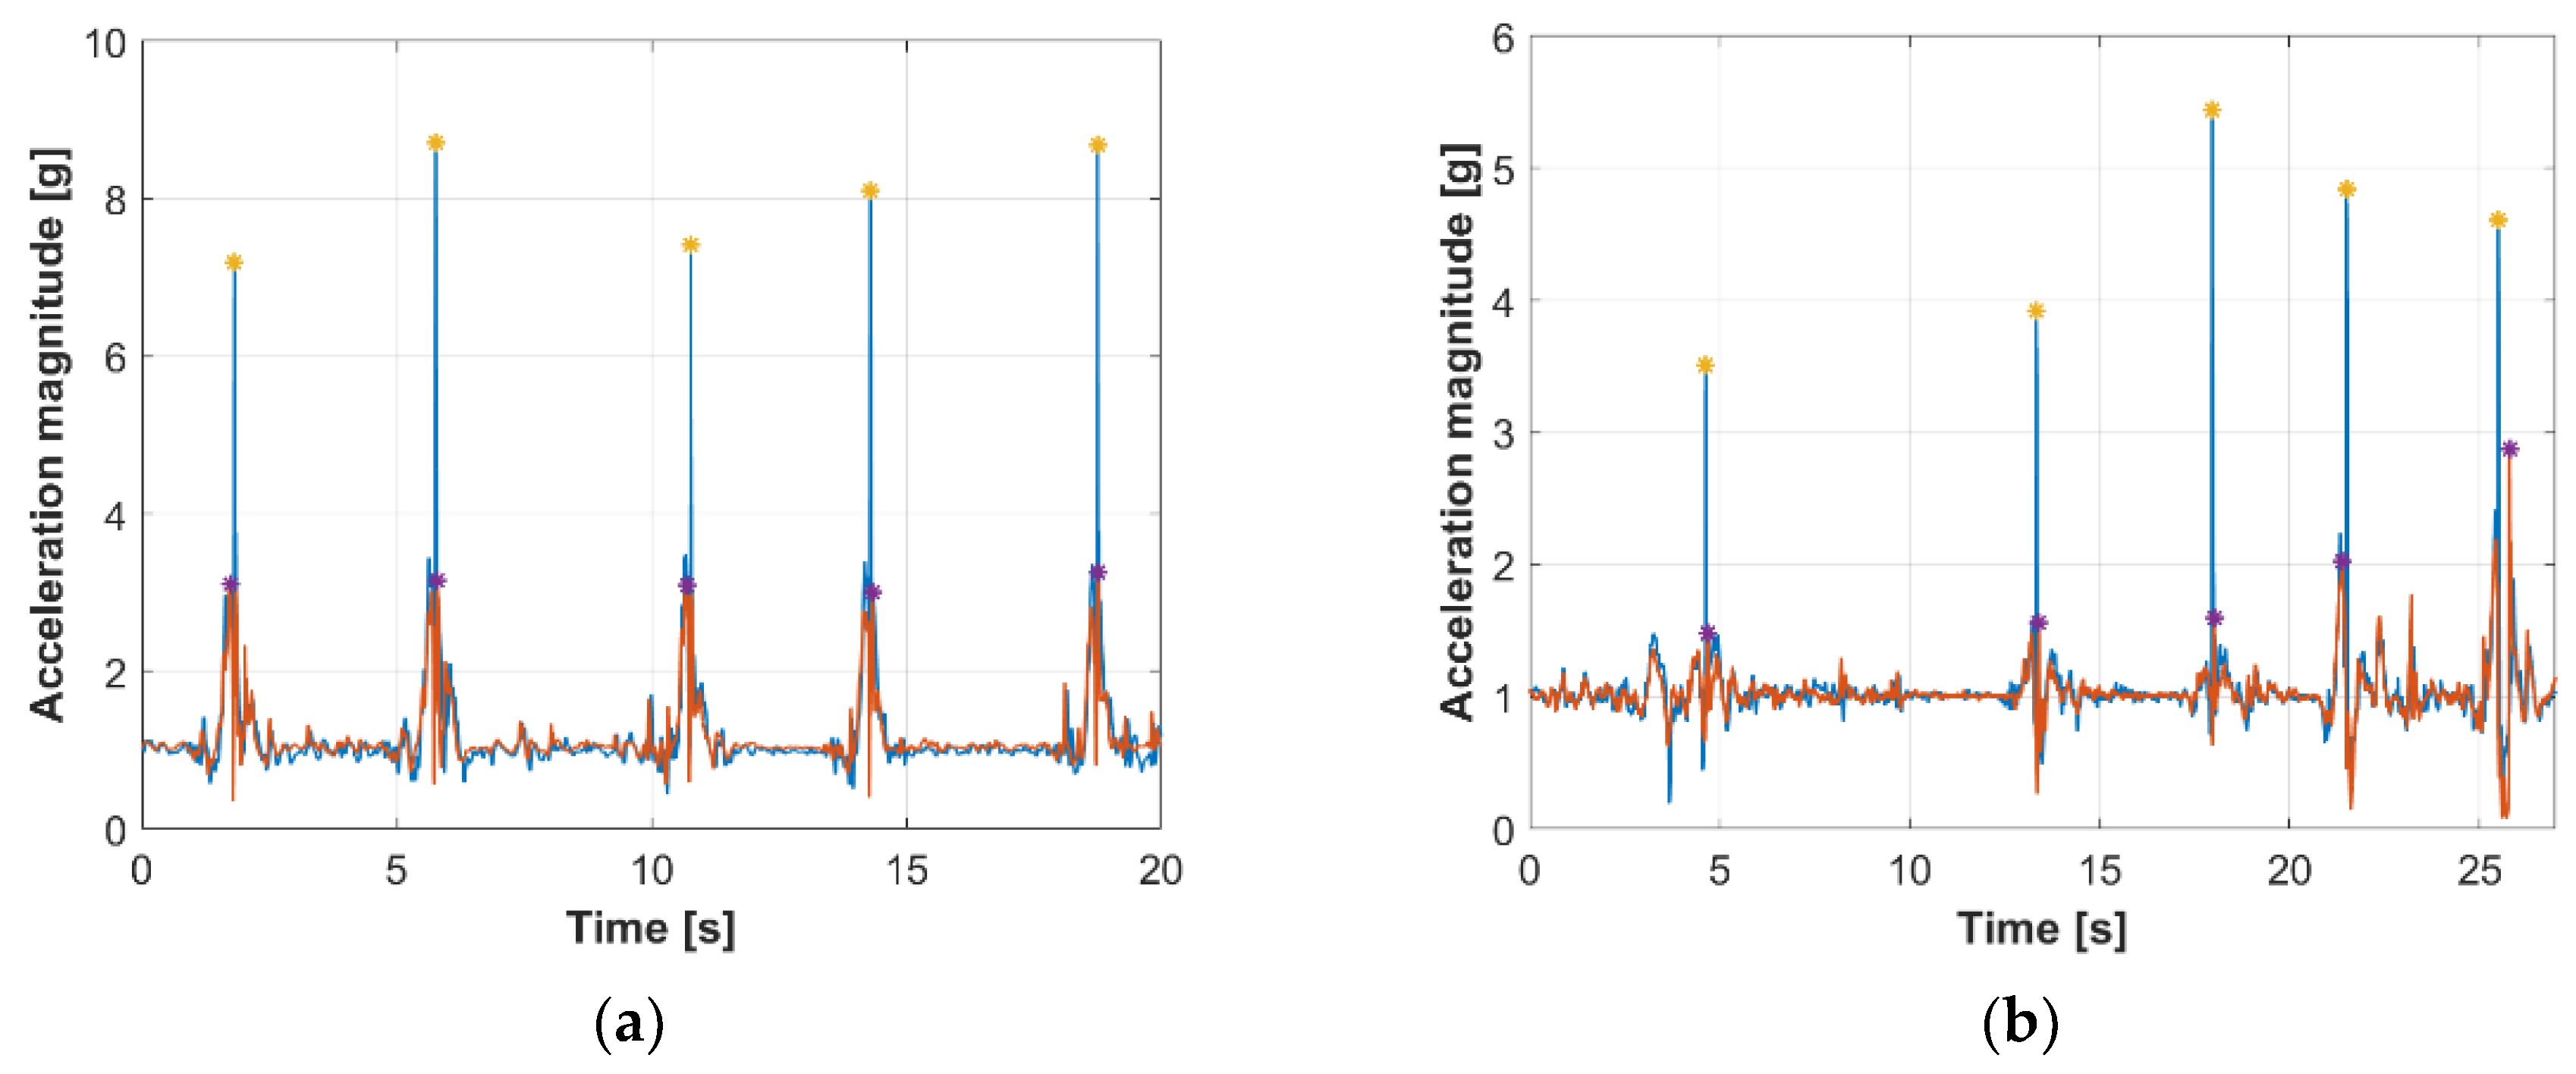
Raw data that were extracted from the headband and T3 inertial sensors of a semi-professional (a) and novice participant (b) for five headers is shown in Figure 9. There is an impact spike in the T3 sensor for each header. The consistency in technique of the semi-professional player as compared to the novice player is demonstrated by the repeatability in their signal.
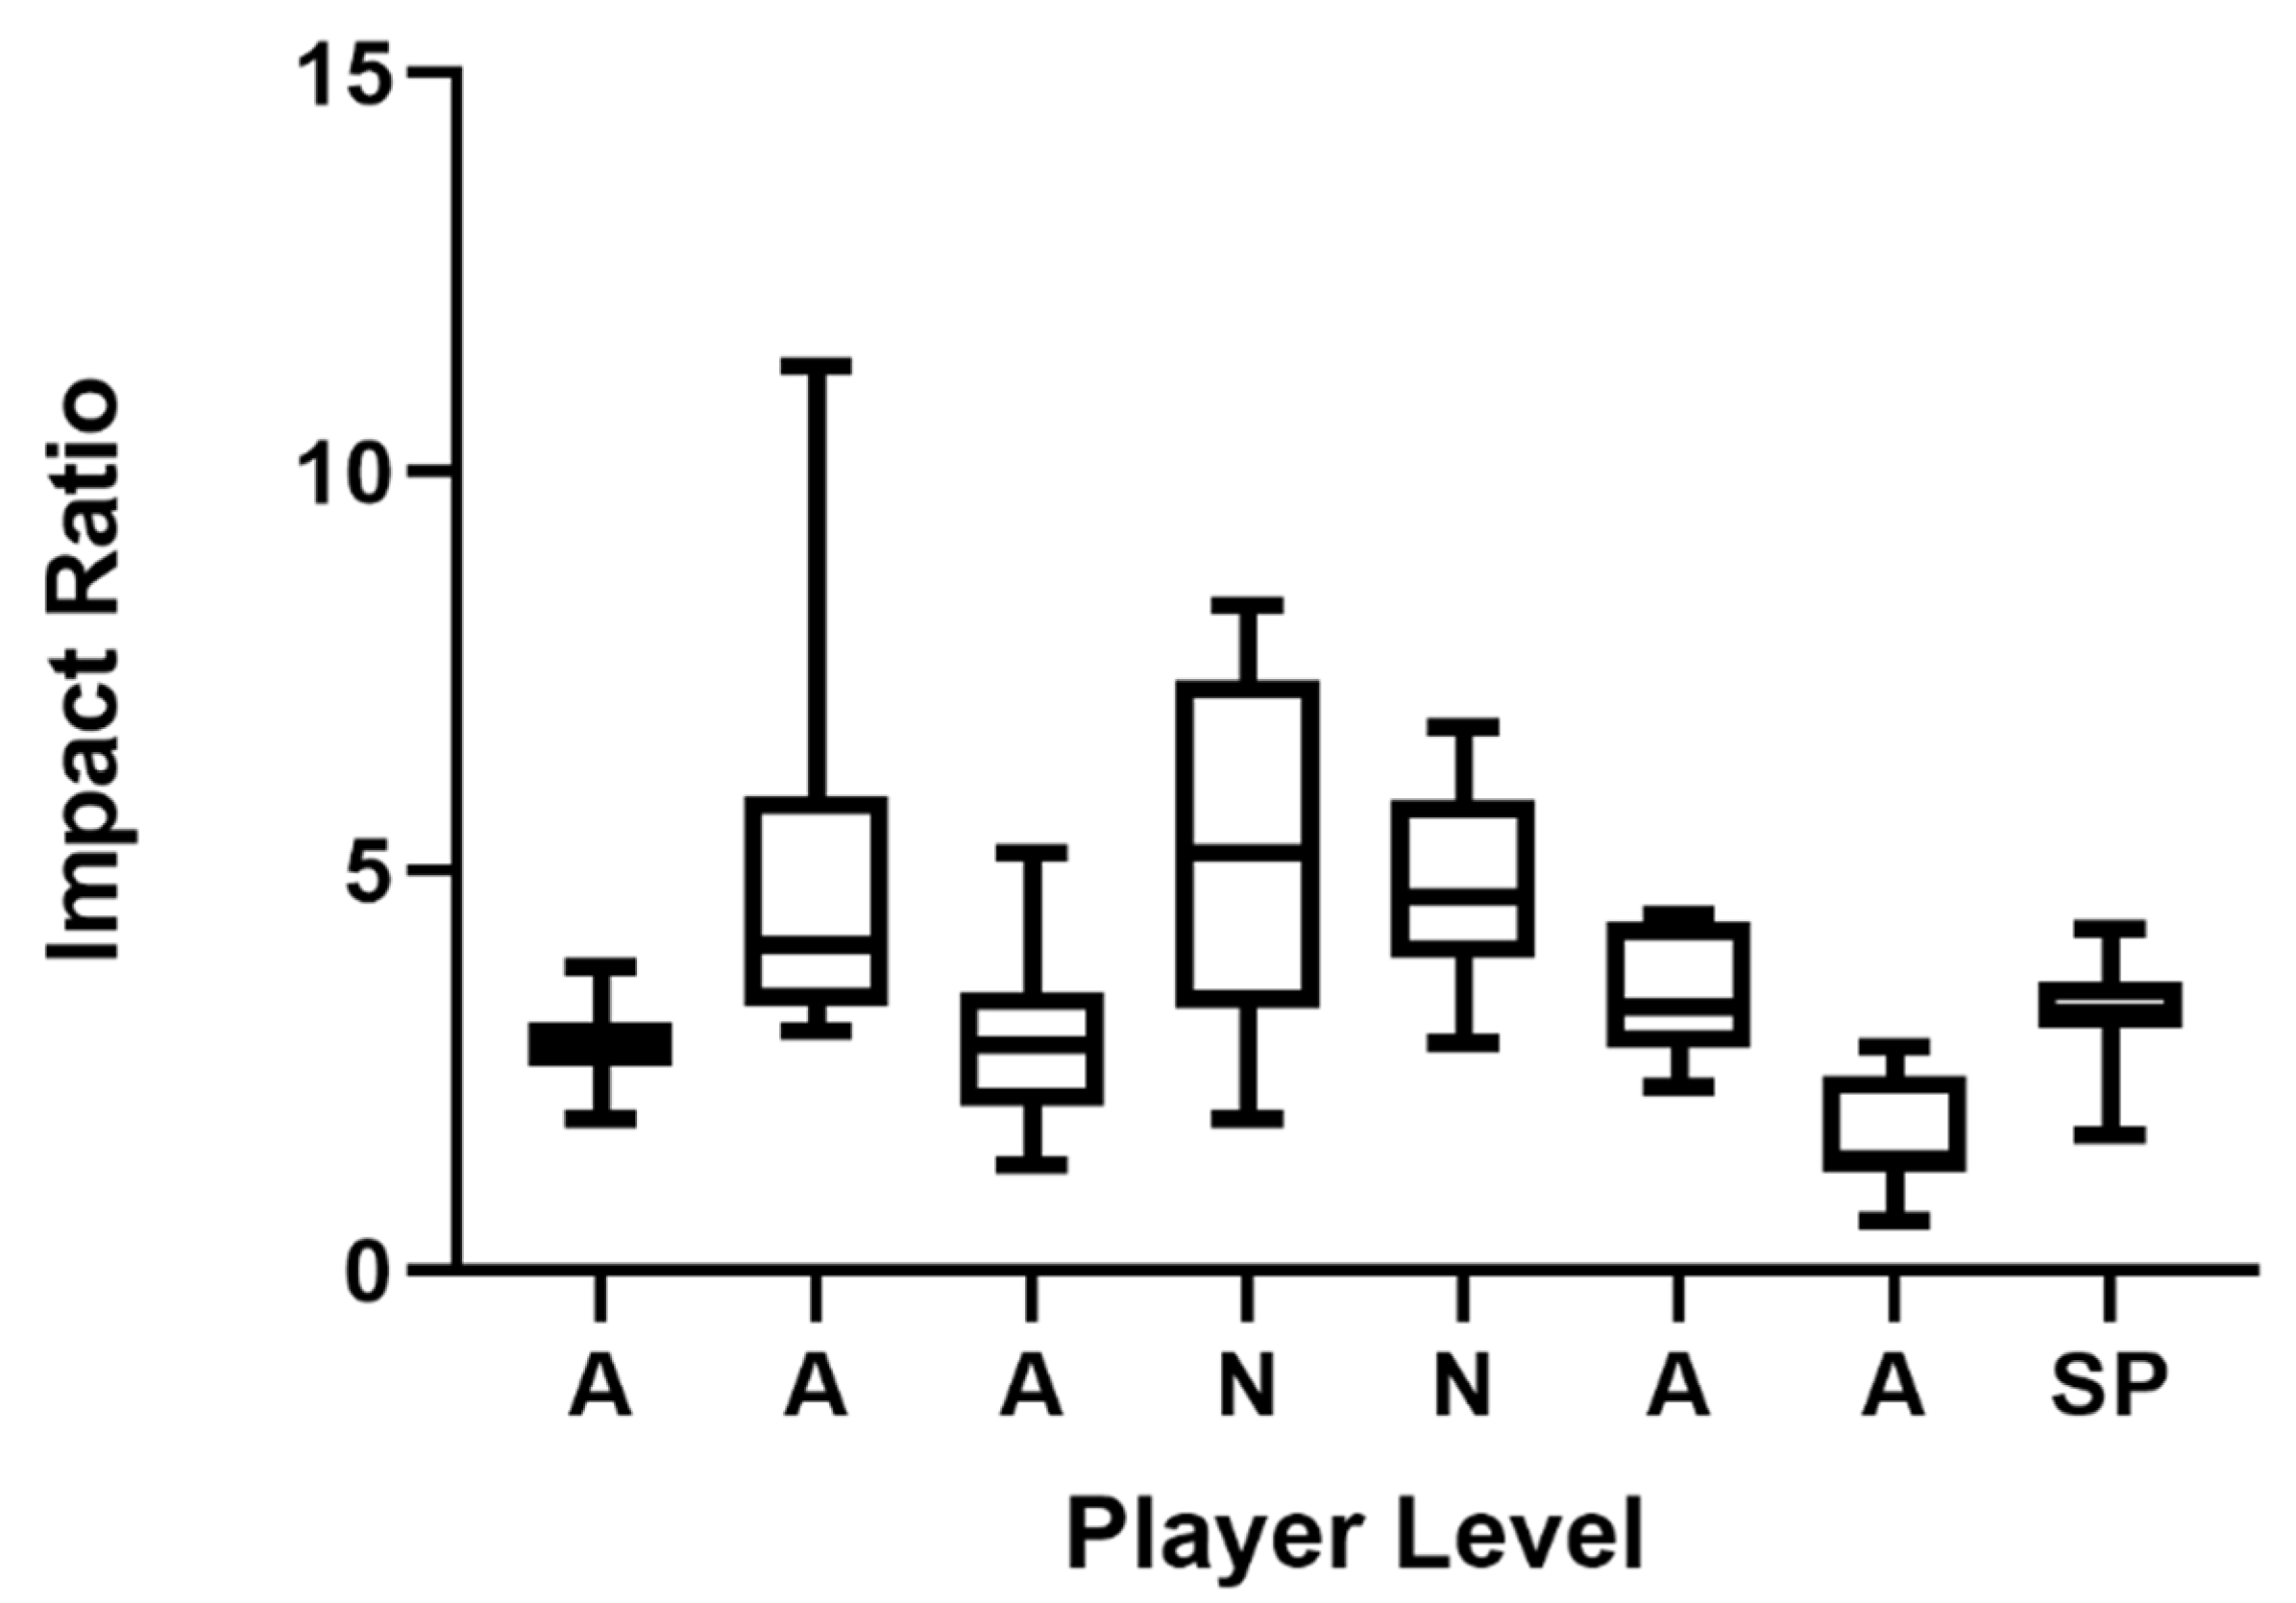
Figure 10 shows the variation in the acceleration ratio between the head and T3 acceleration impact in the direction of the ball for eight participants with different skill levels. The novice participants have a much larger ratio and larger range of values when compared to the more experienced and semi-professional players. This is thought to be the result of a lack of neck muscle activity before, during, and after the impact.

3.3. Inertial Sensor with Electromyogaphy (Intervention Test)

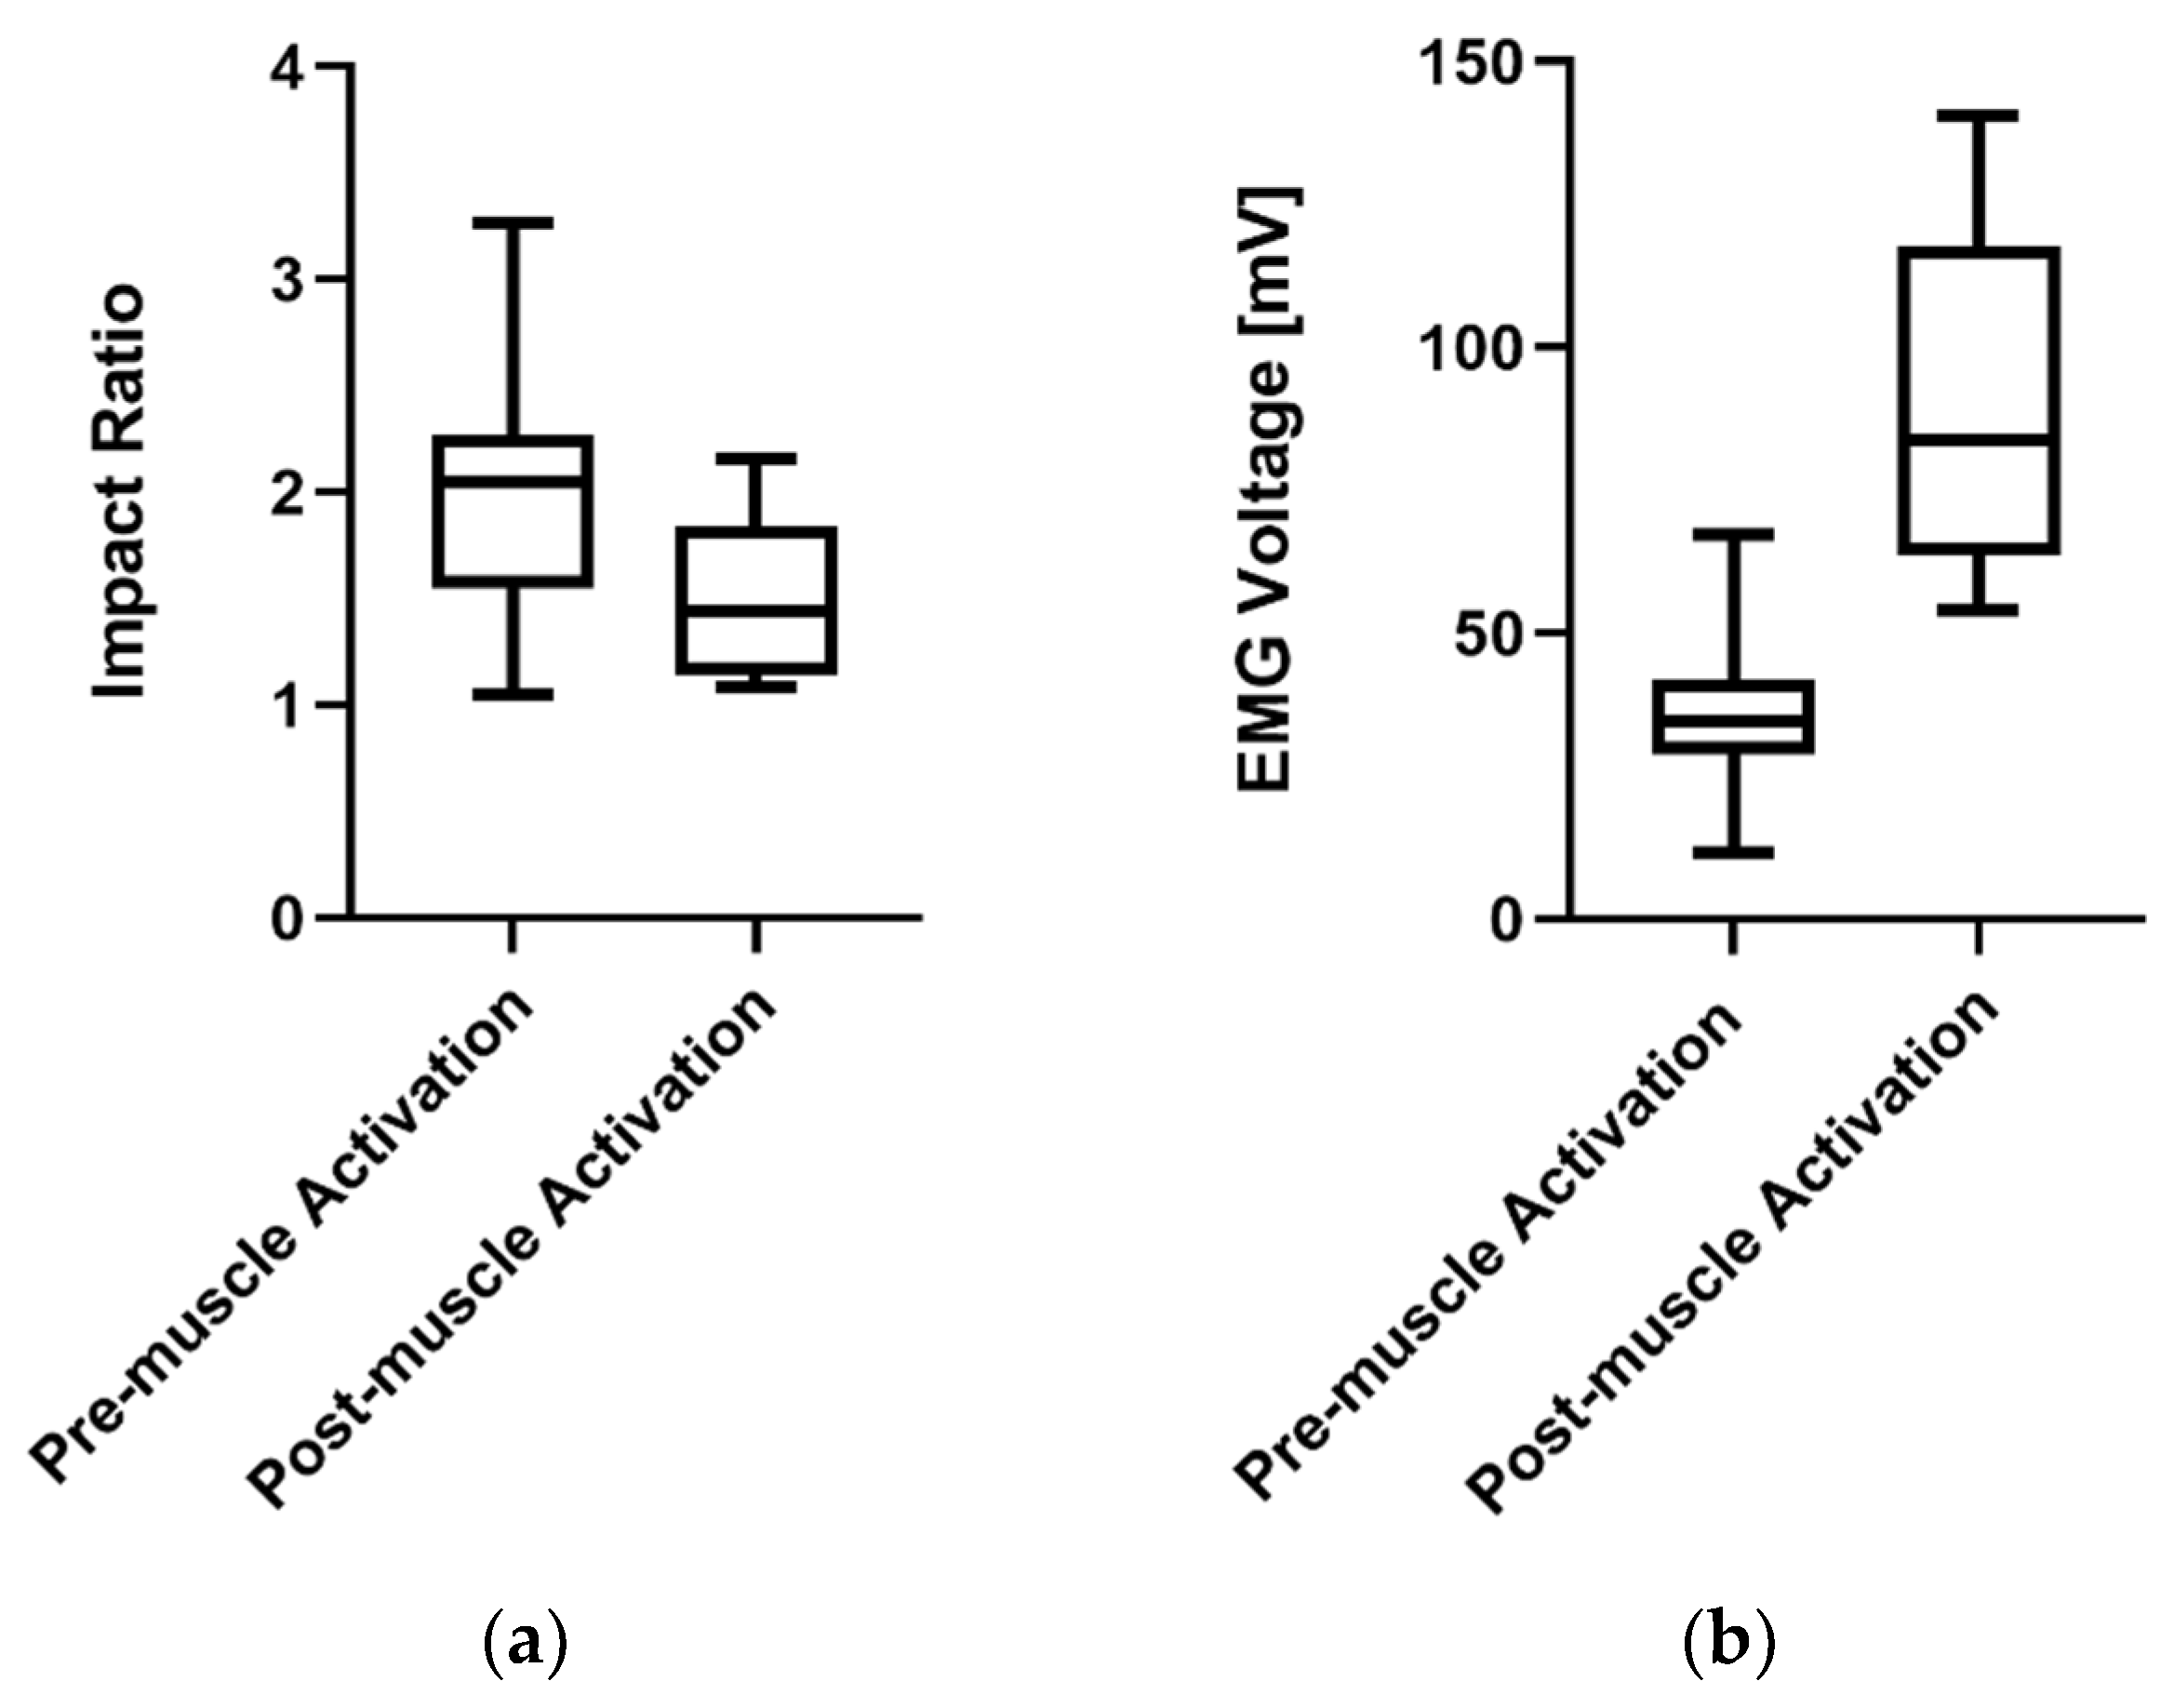
To explore this further, an experienced player gave a novice player instruction to activate the neck muscles at the time of impact. The level of muscle activity was measured while using EMG and compared with the impact acceleration. The participant was asked to head the ball 15 times in their usual manner and then 15 times with an emphasis on tightening the neck muscles. Figure 10 shows the before and after data of both the acceleration ratio and the EMG activity of the sternocleidomastoid muscle (Mean = 37 mV and 90 mV, SD = 14.5 and 27.49, respectively). A paired sample t-test found a significant difference in EMG voltage before and after muscle activation (p = 3.39 × 10⁻⁶). A paired sample t-test also found that there was a significant difference between the impact ratio before and after muscle activation (p = 0.008). Furthermore, the box and whisker diagrams (Figure 11) show that there is a clear increase in the muscle activity and decrease in the acceleration ratio. There was also a mean percentage decrease of 34% in the impact ratio after muscle activation (Mean = 2.00 and 1.49, SD = 0.58 and 0.32) before and after, respectively.

4. Discussion

Figure 4 shows the mean acceleration signals that were recorded by the optical motion capture system and IMU sensor superimposing 10 headings. It is clear that an impact estimated by the contact between the head and ball during a soccer header is identifiable in both measurement systems (the figure shows 10 head impacts). Visually, the signals from the two measurement systems are similar. It is evident that as the acceleration approaches its maximum and minimum values, there is a reduced agreement between the two systems. The position data recorded by the optical motion capture were low pass filtered, as the numerical differentiation amplifies high frequency jitter (noise) in a signal. This explains the difference in measurement at the magnitude extremities. The inertial acceleration sensors prove advantageous when monitoring acceleration during impacts. Filtering the position data prior to differentiation might eliminate important information that is relevant to the biomechanical processes that are involved in soccer head impact monitoring. This is evident in Figure 4, which highlights that the raw acceleration signal recorded by the inertial sensor has two peaks in acceleration present, whereas the differentiated optical motion capture acceleration signal has one.
Data that were recorded by the optical motion capture system were used to calculate the force generated during impact between the ball and the head. Figure 5 shows the position trajectory of the head and the soccer ball during a ball-head impact. The moment of impact between the head and the soccer ball is shown by the minimum relative distance (see Figure 6). In this case, the time of impact between the head and the ball occurs at 0.43 s, when the relative distance is at a minimum. The relative distance then increases as the ball returns to the thrower.
The relative distance position data were differentiated using the built-in function diff in MATLAB (MathWorks, Natick, MA, USA). The mean average velocity of the ball at point of impact was found to be 1.95 ± 0.53 m/s. Figure 7 provides the ball velocity recorded for one header. The impact velocity was measured as 2.62 m/s. The impact force of the soccer headers was calculated using the mass of the soccer ball and the acceleration of its flight, the peak value is the acceleration of the soccer ball directly after impact (Figure 8). The mean impact force was found to be 102.21 ± 19.15 N. A study that was conducted by Levendusky [33] exploring the characteristics of ball dynamics of heading established that balls travelling at 18 m/s collide with a solid object for an impact duration of 10.23 milliseconds, generating a force between 850 N to 912 N. Hodgson et al. [34] reported the range for potential concussive force at greater than 784 N. These measurements of heading force are similar to that found in this investigation when taking the difference in the incoming ball velocity into account (nine times faster).
Figure 10 displays box plot and whisker graphs that represent the impact ratio distribution for participants of different experience levels in a field test environment. It is evident that novices and some amateur players have the largest impact ratio and the largest variation. The participants who had played to an amateur level had a variety of impact ratio distributions. This can be explained by the fact that the level of self-assessed ability across amateur players was quite diverse. Some amateur participants may have been on the border of semi-professional level, whereas others may have played for recreational purposes only. The participant who had played at a semi-professional level had an impact ratio distribution with reduced variation when compared to the majority of amateur players and novices, with 75% of the impact ratio values below 4. This result suggests that players with higher experience have a significantly different heading technique, which reduces the acceleration impact directly absorbed by the head. This is achieved by creating a rigid body between the head and neck during a header, shown by an increase in the T3 impact acceleration, reducing impact ratio as a result. It is evident that the semi-professional participant produced higher impact ratios than some of the amateur participants. A reason for this could be that the participant had focused on heading performance, such as good control and producing high ball velocities, rather than on contracting the neck muscles to reduce the impact directly absorbed by the head. If the player recruited their neck muscles more, it would increase the impact acceleration absorbed by the T3 and reduce the impact ratio as a result. This shows that even semi-professional players can still improve their heading technique.
Figure 11 presents the box plot and whisker diagrams that show the distribution of the impact ratio measured by the IMU sensors and the EMG voltage, recorded on the sternocleidomastoid neck muscle before and after a participant was instructed to consciously tighten their neck muscles before, during and after the ball impact. Contracting the neck muscles during impact between the head and the ball results in the player creating a rigid structure, which ensures that the ball directly makes contact on the forehead, reducing the magnitude of unwanted angular rotation as well as increasing the outgoing ball velocity [10]. This action also produces a greater human mass and increases the transferred force, resulting in a more powerful header. Isometric contraction of the extensor and flexor muscles of the neck also stops the head from being whipped back by the force of the ball. Prior to impact, the trunk hyperextends and flexion at the hip generates the forward force. The greater the extension the greater the forward velocity of the trunk, which results in greater impact on the ball. Essentially, the contraction of the neck muscles provides the support and increases the amount of ball control while the transfer of force from player to ball originates from flexing the trunk at the hip [1].
Literature exploring the influence of EMG measured neck muscle activity on soccer headers is limited. Articles that report the use of EMG to measure neck muscle activity generally form part of a secondary measurement protocol and, thus, the process is described in less detail. Sunami and Maruyama [35] reported that neck muscles (sternocleidomastoid and trapezius) reach their peak values before impact between the head and the ball in soccer heading, in both frontal and lateral conditions. This concurs with the review of Kirkendall and Garrett [1], and the results of this investigation show a significant increase in EMG measurement of the sternocleidomastoid when heading with proper technique. The results from this investigation suggest that increasing neck muscle activity reduces the impact acceleration of the head and in turn the force experienced solely by the head.

5. Conclusions

A comparison between the acceleration impacts of heading the ball and player experience has demonstrated a significant difference in the preparation for and accommodation of the impact. The ratio between the maximum acceleration of the head and the maximum acceleration of the torso represented by an accelerometer located at the T3 indicates a failure of novice players to adequately prepare for the impact. The participants were instructed to head the ball straight back to the thrower. In the midfield positions, a high percentage of heading is linear as players return the ball from the direction it came [9]. Rotational heading is also common, but usually as an offensive part of the game, with players attempting to redirect a cross or corner into the goal [36]. Therefore, a continuation of this research is to include rotational headers and assess the effect of muscle activity on the impact ratio in this scenario.
The intervention study where a novice participant was asked to head the ball in their usual manner and then tighten their neck muscles resulted in a significant decrease in the acceleration ratio at impact. The increased muscle activity was experimentally observed using EMG signals recorded on the neck. The desirable outcome is for the head impact acceleration to stay consistent while the T3 impact acceleration increases. This results in a reduced impact ratio and demonstrates the participant’s recruitment of neck muscles to produce a rigid body between the head and neck when heading the ball. Further testing will be conducted on a greater sample size in order to assess whether this relationship holds true for a wider range of participants.
While this investigation reported low level head impacts, the outcomes suggest that, for elite players, the T3 accelerometer (commonly worn during matches integrated with a GPS tracker) can be used to estimate head impacts. Moreover, the novel impact ratio metric can be used to provide feedback to players regarding the safety of their heading technique. Further research is needed to match the level of head impacts recorded within a competitive setting, which report average peak linear accelerations of 37.56 g and 39.31 g for high school and collegiate level soccer players, respectively [31]. Although these values are below those that are associated with concussions (>60 g), repetitive head trauma is a serious concern for athletes potentially suffering from chronic brain damage [32] and it is estimated that soccer players head the ball six to seven times per match, exposing athletes to multiple sub-concussive impact accelerations.

Author Contributions

Procedure design, literature review, data collection, data analysis and manuscript preparation, M.T.O.W.; Procedure design, literature review, data collection, data analysis and manuscript preparation, B.S.J.; Procedure design, literature review, data collection, data analysis and manuscript preparation, A.C.; Procedure design, literature review, data collection and data analysis, S.P.C.; Procedure design, literature review, data collection, data analysis and manuscript preparation, D.V.T.; Procedure design, literature review, data collection, data analysis and manuscript preparation, H.G.E. All authors have read and agreed to the published version of the manuscript.

Funding

This research received no external funding.

Acknowledgments

ISEA provided a travel grants to S.C. to undertake a sports engineering internship at Griffith University. M.W. received a PhD scholarship funding from Griffith University. CESI and Selha Group financial supported S.C. during her 3-month internship.

Conflicts of Interest

The authors declare no conflict of interest.

References

  1. Kirkendall, D.T.; Garrett, W.E. Heading in soccer: Integral skill or grounds for cognitive dysfunction? J. Athl. Train. 2001, 36, 328–333. [Google Scholar] [PubMed]
  2. Kunz, M. 265 million playing football. FIFA Magazine, July 2007; 10–15. Available online: https://www.fifa.com/mm/document/fifafacts/bcoffsurv/emaga_9384_10704.pdf(accessed on 18 May 2020).
  3. Horne, J. Globalization and football. Leis. Stud. 2012, 31, 123–124. [Google Scholar] [CrossRef]
  4. Quintero, L.M.; Moore, J.W.; Yeager, M.G.; Rowsey, K.; Olmi, D.J.; Britton-Slater, J.; Harper, M.L.; Zezenski, L.E. Reducing risk of head injury in youth soccer: An extension of behavioral skills training for heading. J. Appl. Behav. Anal. 2019, 53, 237–248. [Google Scholar] [CrossRef] [PubMed] [Green Version]
  5. Guskiewicz, K.M.; Marshall, S.W.; Bailes, J.; McCrea, M.; Cantu, R.C.; Randolph, C.; Jordan, B.D. Association between recurrent concussion and late-life cognitive impairment in retired professional football players. Neurosurgery 2005, 57, 719–726. [Google Scholar] [CrossRef] [PubMed]
  6. Maroon, J.C.; Winkelman, R.; Bost, J.; Amos, A.; Mathyssek, C.; Miele, V. Chronic traumatic encephalopathy in contact sports: A systematic review of all reported pathological cases. PLoS ONE 2015, 10, 1–16. [Google Scholar] [CrossRef] [Green Version]
  7. Maher, M.E.; Hutchison, M.; Cusimano, M.; Comper, P.; Schweizer, T.A. Concussions and heading in soccer: A review of the evidence of incidence, mechanisms, biomarkers and neurocognitive outcomes. Brain Inj. 2014, 28, 271–285. [Google Scholar] [CrossRef]
  8. Reilly, T.; Thomas, V. A motion analysis of work rate in different positional roles in professional football match play. J. Human Mov. Stud. 1976, 2, 87–97. [Google Scholar]
  9. Erkmen, N. Evaluating the heading in professional soccer players by playing positions. J. Strength Cond. Res. 2009, 23, 1723–1728. [Google Scholar] [CrossRef]
  10. Peek, K.; Elliott, J.M.; Orr, R. Higher neck strength is associated with lower head acceleration during purposeful heading in soccer: A systematic review. J. Sci. Med. Sport 2020, 23, 453–462. [Google Scholar] [CrossRef]
  11. Mansell, J.; Tierney, R.T.; Sitler, M.R.; Swanik, K.A.; Stearne, D. Resistance training and head-neck segment dynamic stabilization in male and female collegiate soccer players. J. Athl. Train. 2005, 40, 310–319. [Google Scholar]
  12. Nazarahari, M.; Arthur, J.; Rouhani, H. A novel testing device to assess the effect of neck strength on risk of concussion. Ann. Biomed. Eng. 2020, 48, 1–13. [Google Scholar] [CrossRef] [PubMed]
  13. Caccese, J.B.; Buckley, T.A.; Tierney, R.T.; Rose, W.C.; Glutting, J.J.; Kaminski, T.W. Sex and age differences in head acceleration during purposeful soccer heading. Res. Sports Med. 2018, 26, 64–74. [Google Scholar] [CrossRef]
  14. Simoneau, M.; Denninger, M.; Hain, T.C. Role of loading on head stability and effective neck stiffness and viscosity. J. Biomech. 2008, 41, 2097–2103. [Google Scholar] [CrossRef] [PubMed]
  15. Dezman, Z.D.W.; Ledet, E.H.; Kerr, H.A. Neck strength imbalance correlates with increased head acceleration in soccer heading. Sports Health Multidiscip. Approach 2013, 5, 320–326. [Google Scholar] [CrossRef] [PubMed] [Green Version]
  16. Schmidt, J.D.; Guskiewicz, K.M.; Blackburn, J.T.; Mihalik, J.P.; Siegmund, G.P.; Marshall, S.W. The influence of cervical muscle characteristics on head impact biomechanics in football. Am. J. Sports Med. 2014, 42, 2056–2066. [Google Scholar] [CrossRef]
  17. Stone, T.; Stone, N.; Roy, N.; Melton, W.; Jackson, J.B.; Nelakuditi, S. On smart soccer ball as a head impact sensor. IEEE Trans. Instrum. Meas. 2019, 68, 2979–2987. [Google Scholar] [CrossRef]
  18. Camomilla, V.; Bergamini, E.; Fantozzi, S.; Vannozzi, G. Trends supporting the in-field use of wearable inertial sensors for sport performance evaluation: A systematic review. Sensors 2018, 18, 873. [Google Scholar] [CrossRef] [Green Version]
  19. Espinosa, H.G.; Shepherd, J.B.; Thiel, D.V.; Worsey, M.T.O. Anytime, anywhere! Inertial sensors monitor sports performance. IEEE Potentials 2019, 38, 11–16. [Google Scholar] [CrossRef]
  20. Espinosa, H.G.; Lee, J.; James, D.A. The inertial sensor: A base platform for wider adoption in sports science and applications. J. Fit. Res. 2015, 4, 13–20. [Google Scholar]
  21. Shepherd, J.; James, D.; Espinosa, H.; Thiel, D.; Rowlands, D. A literature review informing an operational guideline for inertial sensor propulsion measurement in wheelchair court sports. Sports 2018, 6, 34. [Google Scholar] [CrossRef]
  22. Worsey, M.T.O.; Espinosa, H.G.; Shepherd, J.B.; Thiel, D.V. Inertial sensors for performance analysis in combat sports: A systematic review. Sports 2019, 7, 28. [Google Scholar] [CrossRef] [PubMed] [Green Version]
  23. Worsey, M.T.O.; Espinosa, H.G.; Shepherd, J.B.; Thiel, D.V. A systematic review of performance analysis in rowing using inertial sensors. Electronics 2019, 8, 1304. [Google Scholar] [CrossRef] [Green Version]
  24. Catapult Sports. Available online: https://www.catapultsports.com/ (accessed on 14 November 2018).
  25. x2 Biosystems xPatch. Available online: http://www.x2biosystems.com/x2_x_patch (accessed on 1 May 2020).
  26. Reebok Checklight. Available online: https://news.reebok.com/global/latest-news/reebok-checklight-winsfast-company-innovation-by-design-award/s/1487ce21-b8b2-436f-b56ee3d658437f4e (accessed on 1 May 2020).
  27. Triax SIM-P. Available online: https://www.triaxtec.com/sim-p (accessed on 1 May 2020).
  28. Shepherd, J.B.; Thiel, D.V.; Espinosa, H.G. Evaluating the use of inertial-magnetic sensors to assess fatigue in boxing during intensive training. IEEE Sens. Lett. 2017, 1, 1–4. [Google Scholar] [CrossRef]
  29. Shepherd, J.; Wada, T.; Rowlands, D.; James, D. A novel AHRS inertial sensor-based algorithm for wheelchair propulsion performance analysis. Algorithms 2016, 9, 55. [Google Scholar] [CrossRef] [Green Version]
  30. Thiel, D.V.; Shepherd, J.; Espinosa, H.G.; Kenny, M.; Fischer, K.; Worsey, M.; Matsuo, A.; Wada, T. Predicting ground reaction forces in sprint running using a shank mounted inertial measurement unit. Proceedings 2018, 2, 199. [Google Scholar] [CrossRef] [Green Version]
  31. Leardini, A.; Biagi, F.; Merlo, A.; Belvedere, C.; Benedetti, M.G. Multi-segment trunk kinematics during locomotion and elementary exercises. Neurosurgery 2011, 26, 562–571. [Google Scholar] [CrossRef]
  32. Pezzack, J.C.; Norman, R.W.; Winter, D.A. An assessment of derivative determining techniques used for motion analysis. J. Biomech. 1977, 10, 377–382. [Google Scholar] [CrossRef]
  33. Levendusky, T.A. The Impact Characteristics of Two Types of Soccer Balls Under the Influence of Selected Conditions. Ph.D. Thesis, University of Toledo, Toledo, OH, USA, 1987. [Google Scholar]
  34. Hodgson, V.R.; Nakamura, M.S.; Nakamura, G.S. Mechanical impedance and impact response of the human cadaver zygoma. J. Biomech. 1968, 1, 73–78. [Google Scholar] [CrossRef]
  35. Sunami, S.; Maruyama, T. Motion and EMG analysis of soccer-ball heading for the lateral direction. Footb. Sci. 2008, 5, 7–17. [Google Scholar]
  36. Broglio, S.P. No acute changes in postural control after soccer heading. Br. J. Sports Med. 2004, 38, 561–567. [Google Scholar] [CrossRef]
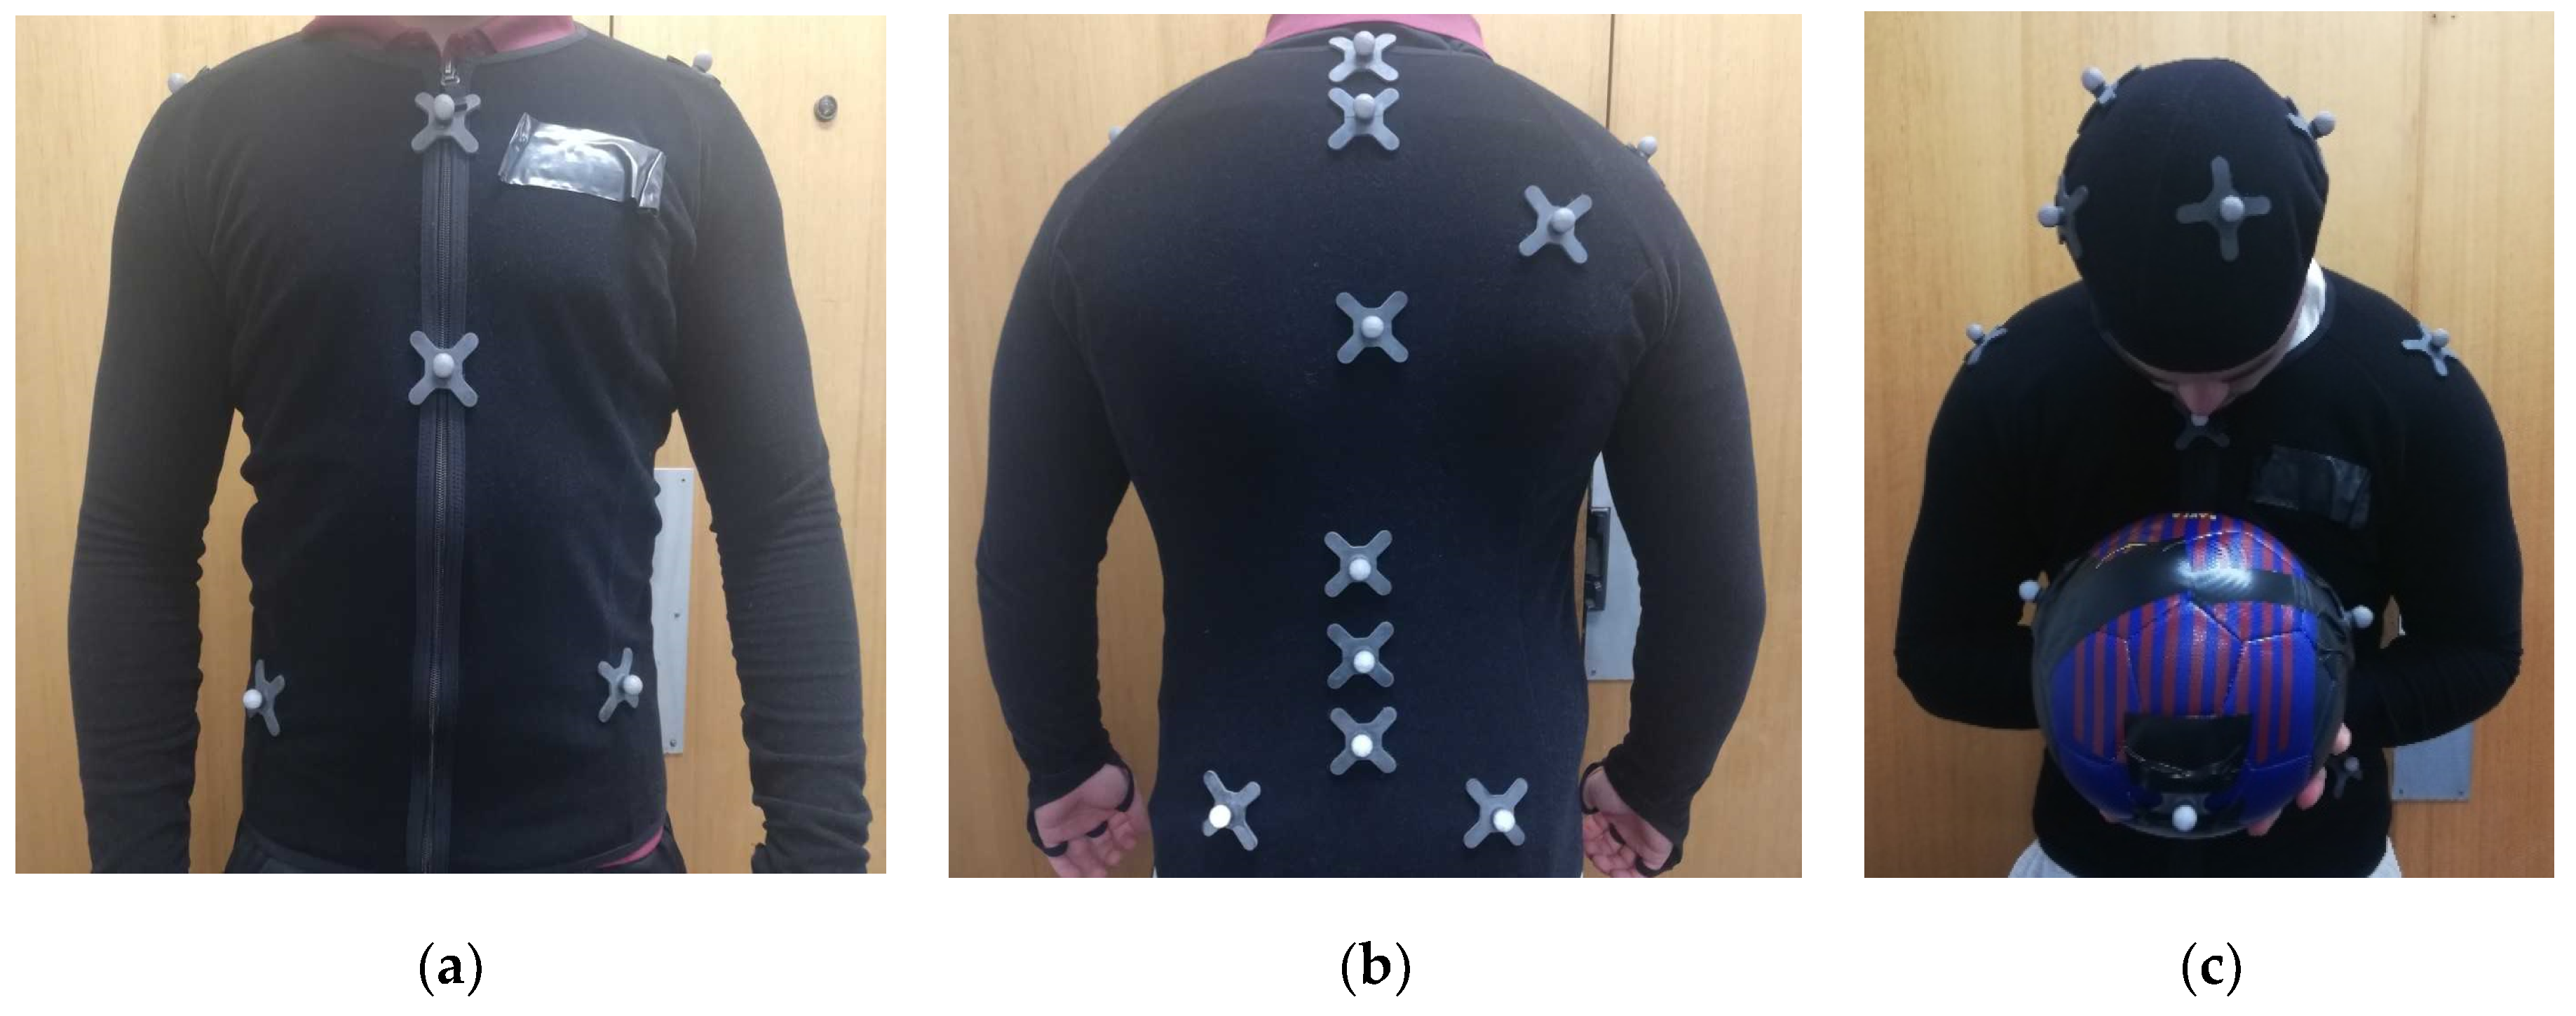
Figure 1. (a) anterior view of Rizzoli Trunk Protocol retroreflective marker set; (b) posterior view of Rizzoli Trunk Protocol retroreflective marker set; and, (c) hat and ball retroreflective markers. During the experiment, a full body motion capture suit was worn to ensure only the markers were reflective.
Electronics 09 00834 g001
Figure 2. Diagram showing the experimental set-up for the forward heading measurements. The distance between the ball thrower and the participant is 5 m. The arrow indicates the direction of heading. The control station contains a computer and the electromyography (EMG) device.
Electronics 09 00834 g002
Figure 3. A bipolar electrode configuration over the sternocleidomastoid muscle and a reference electrode placed over the clavicle. A sports bra and headband fixed the position of the inertial sensors.
Electronics 09 00834 g003
Figure 4. Inertial measurement unit (IMU) sensor and optical motion capture acceleration signals superimposed for 10 soccer heading impacts. (a) IMU located on the head (b) IMU sensor located at T3. Data obtained from participant used in motion capture heading tests.
Electronics 09 00834 g004
Figure 5. Three-dimensional (3D) position trajectories of the ball (red line) and head (blue line) during a heading impact recorded by the optical motion capture system.
Electronics 09 00834 g005
Figure 6. The relative distance between the geometric centre of the ball and the participant’s head. The point of impact between head and ball is clear as the minimum separation distance at time 0.43 s.
Electronics 09 00834 g006
Figure 7. Instantaneous velocity measured using the relative distance between head and ball and position tracking data for head and ball.
Electronics 09 00834 g007
Figure 8. Instantaneous ball acceleration obtained by differentiating the velocity signal with respect to time, for one header (impact point at 0.43 s).
Electronics 09 00834 g008
Figure 9. (a) Raw signal data extracted from the headband inertial sensor (blue) and T3 inertial sensor (orange) for a semi-professional participant; (b) raw signal data extracted from the headband inertial sensor (blue) and T3 inertial sensor (orange) for a novice participant. Head impacts are denoted by a yellow star and T3 impacts are denoted by a purple star.
Electronics 09 00834 g009
Figure 10. Impact ratio quartile distributions for each participant obtained in field measurements (N is novice, A is amateur and SP is semi-professional).
Electronics 09 00834 g010
Figure 11. (a) Impact ratio measured by the IMU sensors; and, (b) voltage measured by EMG upon header impact, before and after the participant was told to tighten neck muscles.
Electronics 09 00834 g011
Table 1. Key descriptors and findings extracted from reviewed scientific literature investigating head impacts and neck strength.
CitationSportNumber of SubjectsMeasurement TechnologyBiomechanical MovementPerformance MetricResearch Findings
[13]Soccer1006DOF Inertial sensor (Accel/Gyro) Fs = 1 kHzSoccer headingLinear head accelerations; rotational head accelerationsFemales (40.9 ± 13.3 g; 3279 ± 1065 rad/s2) Males (27.6 ± 8.5 g, 2219 ± 823 rad/s2)
[14]NA7Angular velocity sensorNAAngular velocity (with/without loading)Angular velocity of head significantly decreased when muscles were activated due to loading (18% and 20% for backwards and forwards head impacts).
[11]Soccer362-D motion capture system; Video camera
Fs = 60 Hz; EMG system Fs = 960 Hz; Force load cell
Maximum voluntary isometric contractionsNeck flexion and extension strength pre and post training intervention.15% increase in neck strength (neck girth increased by 3%). No kinematic, EMG or stiffness training effects were seen.
[15]Soccer1614 camera optical motion capture system (Vicon MX3) Fs = 450 Hz; DynamometerSoccer headingLinear head accelerations; rotational head accelerationsNeck strength difference was related to head acceleration (p = 0.05)
[16]American football49Head telemetry system; load cell Fs = 2 kHz; Ultrasound; Electromagnetic motion capture system
Fs = 100 Hz; EMG
Head impactsA range of descriptive statists relating to head and neck strength.Players with greater cervical stiffness had reduced odds of sustaining both moderate and severe head impacts.
[10]Soccer5 cross sectional studies (literature review)NASoccer headingNAHigher neck strength is associated with lower head acceleration (p < 9.95, r < −0.5)
Table 2. Optical motion capture calibration report.
Overall ReprojectionWorst CameraTriangulationOverall Wand ErrorRay Length
Mean 3D error: 1.147 mmMean 3D error: 1.282 mmRecommended: 3.1 mmMean error: 0.334 mmSuggested max: 5.7 m
Mean 2D error: 0.188 pixelsMean 2D error: 0.284 pixelsResidual mean error: 1.2 mm--
ExcellentExcellent-Exceptional-